Choosing a Water Distribution Pipe Rehabilitation Solution Using the Analytical Network Process Method


1
SC ACI Cluj SA, Avenue Dorobantilor, No. 70, Cluj-Napoca 400609, Romania
2
Faculty of Building Services Engineering, Technical University of Cluj-Napoca, Boulevard December 21, No. 128-130, Cluj-Napoca 400604, Romania
*
Author to whom correspondence should be addressed.
Water 2018, 10(4), 484; https://doi.org/10.3390/w10040484
Submission received: 20 February 2018
/
Revised: 11 April 2018
/
Accepted: 11 April 2018
/
Published: 15 April 2018
Abstract
:One of the major challenges faced by water companies around the world is the high level of water losses in distribution networks. This research paper presents a case study on the choice of the best technical solution for the rehabilitation of the water distribution network pipelines of Cluj-Napoca City, Romania. The analytical network process (ANP) method was used as the selection method, and calculations were performed using the Super Decisions 2.6.0 software. In the case study, five alternatives were analyzed based on seven criteria. The criteria taken into account in the decision-making included pipe diameter, pipe length, specific accomplishment duration, lifespan, pressure losses, price, and installation conditions, while the following methods were considered as rehabilitation alternatives: Compact Pipe, Slipline, Subline, Swagelining, and Pilot Pipe. Based on the highest global priority, we recommend choosing the Subline alternative as the method of rehabilitating water distribution pipes from asbestos cement pipes in the case of Cluj-Napoca City, Romania.
1. Introduction
1.1. Context
One of the main challenges facing water utilities worldwide is the high level of water loss in the distribution networks. According to the World Bank study, about 32 billion m3 of treated water is lost annually as leakage from urban water distribution systems around the world, while 16 billion m3 is used but not paid for [1].
The main problems faced by urban water distribution networks are old pipelines, frequent leakage, frequent failures, drinking water supply discontinuance, important water losses, high energy costs, and high costs with the rehabilitation of water distribution networks [2].
In this context, a smarter management of urban water distribution networks is needed to achieve higher levels of efficiency. Thus, the International Water Association (IWA) proposed that the leakage management process be improved in three different stages, namely: assessment, detection, and physical location [3].
A percentage of water that brings no revenue is indicated for Eastern European water supply systems and this percent ranges from 16 to 61% [4,5]. In Romania, the maximum allowable water losses from a water distribution system must not exceed 20% [6].
Causes of water loss include the following: pipe holes and longitudinal cracks, improper pipe fitting, gasket faults associated with the pipes used for the water distribution networks, old pipelines, road traffic, repairs to the road system, and high water pressure in water distribution networks.
If water distribution networks are made of pipes tightened with gaskets, a considerable part of the water loss occurs either due to incorrect pipe assembly or due to fatigue and aging of the material used to tighten the pipes [7].
Covelli et al. [7] states that most articles in the scholarly literature refer to the assessment of water losses through holes and longitudinal pipe cracks.
One of the methods of reducing water losses in water distribution networks is to install water pressure reducing devices. This purpose can be accomplished by means of flow or pressure control devices (throttle control valves (TCVs) or pressure reduction valves (PRVs) or by using small- or micro-turbines or pumps as turbines (PaT)), able to totally replace the PRVs or to be located in parallel or in series with them [8].
Determining the number of pressure reducing valves, positioning and setting them is a problem that requires optimization calculations [8,9].
Candelieri et al. [10] have conducted a study in which they have attempted to highlight the relationship between pressure variations and flow variations as well as pipeline sections that may be affected by leakage.
To locate leakage, Candelieri et al. [3] proposed combining chart-based analysis with traditional machine learning techniques (e.g., regression) to estimate the severity of leakage, which leads to leakage location improvement and helps water distribution network managers to define an intervention plan.
Several studies have proposed that localization be improved through the analysis of data collected by computer-based systems usually adopted in water distribution networks, such as supervisory control and data acquisition (SCADA), automatic metering readers (AMRs), GIS, and hydraulic simulation software [11].
In the field of drinking water production, one can optimize the following: production costs, water losses, the duration of water supply interruption, maintenance costs, and compliance with water quality requirements [12].
Since the 1970s, several articles have appeared on optimizing water distribution networks. The first field of research relates to the operation of pumps, because pump operation costs are the greatest expense for water companies around the world. The second field of research concerns the optimization of water quality in the water distribution network. This research field emerged in the 1990s.
Optimal operation of pumps is often formulated as a cost optimization problem. Pump operating costs are comprised of costs for energy consumption due to pump operation and costs due to the maintenance of pumps. The electricity costs have two components, namely, the costs of the electricity actually consumed and the electricity consumption tax [13].
Castro-Gama et al. [12] have implemented a pump operating program for the entire water distribution system in Milan. The results show that there is a potential to reduce electricity costs by up to 26%.
Soldi et al. [14] state that water distribution network managers can establish intervention/rehabilitation plans, even preventive ones, taking into account the vulnerability/resistance and damage chances of water distribution network components.
Resilience and vulnerability of networked infrastructures are strictly linked: while resilience is focused on a general evaluation of the robustness of the entire infrastructure, vulnerability is associated with a specific component, or set of components, to represent the possibility of being influenced by hazards/threats and the severity of the possible consequences [14].
When setting up the rehabilitation plan for water distribution networks, the concept of a “water-smart society” can be taken into account. This concept, where the true value of water is recognized and exploited, is transforming water distribution networks (WDNs) into “smart” water networks, with a widespread adoption of advanced metering infrastructure (AMI), automatic metering readers (AMRs), data analytics, hydro-informatics, and automation technologies, enhancing water efficiency operations and optimizing the supply and demand cycle through a growing availability of real time data from the process [15].
The rehabilitation of drinking water distribution networks is a crucial aspect of sustainable urban development. The mismanagement of water systems can engender not only the disruption of supply but also the degradation of water quality and increased operating and capital expenditures [16].
1.2. Current State of Research
At the international level, the methods of choosing technical solutions for the rehabilitation of water distribution networks are focused on the following main areas: predictive models on pipe degradation [17,18], models for risk estimation [19], economic and financial analysis [20], social analysis [21], cost optimization [22], energy optimization [23,24], the analysis of CO2 emissions on life cycle (LCE/LCA) [25], and multi-criteria methods [26].
Several software products have been designed in order to shorten the time required for substantiating the selection of technical solutions for the rehabilitation of water distribution systems.
Large et al. [27] performed the ranking of these software products in four categories, namely: Model M1, for assessing the deterioration of pipes, Model M2, for assessing the risks, Model M3, for economic analysis and financial analysis, and Model M4, for the multicriteria analysis [27,28].
Due to the difficult processes of optimization and reliability assessments of water distribution networks, most of the research focused only on the piping system, omitting other network components such as balancing tanks, pumps, or valves [29].
State of-the-art projects in rehabilitation management for urban water networks focus mainly on one single network alone, while an integrated multi-utility approach is still seldom used [30].
Multi-criteria analysis (MCA) methods can be defined as a set of techniques for assessing decisional options based on several criteria expressed in different measurement units [31]. According to Xu and Yang [32], multiple criteria decision-making refers to making decisions in the presence of multiple and usually conflicting criteria [16,32]. Recent review papers identify hundreds of MCA techniques for ranking or scoring options, weighting criteria, and transforming criteria into commensurate units [31]. Boran et al. [33] say that one of the weaknesses of these traditional methods is that they do not take into account the relationship between the criteria used for the evaluation.
The main multi-criteria analysis methods used internationally in order to substantiate the decision in the field of water distribution networks are presented in Table 1.
Analyzing the data from Table 1, one may note that the analytic hierarchy process (AHP) method is one of the most popular multi-criteria methods used in the field of water distribution networks.
Harrison et al. [1] have noticed that there is a gap between developed decisional theories and applications. The deficiency of knowledge is even greater in developing countries, where these methods and tools are difficult to apply and therefore are not well understood or validated.
Following the bibliographic study performed, we have noticed that there are few articles in the scholarly literature using the AHP method in the case of drinking water distribution networks.
For easier calculations in the case of multi-criteria methods, in practice it is customary to use software programs.
1.3. The Purpose and Contributions of the Paper
The purpose of the paper is to contribute to the increasingly complex decision-making process concerning water distribution networks in a given locality.
An important contribution of this paper is to provide a methodology for choosing the best rehabilitation technology for water distribution networks.
2. Materials and Methods
2.1. Description of Study Area
Here we analyze the possibility of rehabilitating the water distribution networks of Cluj-Napoca City, Romania.
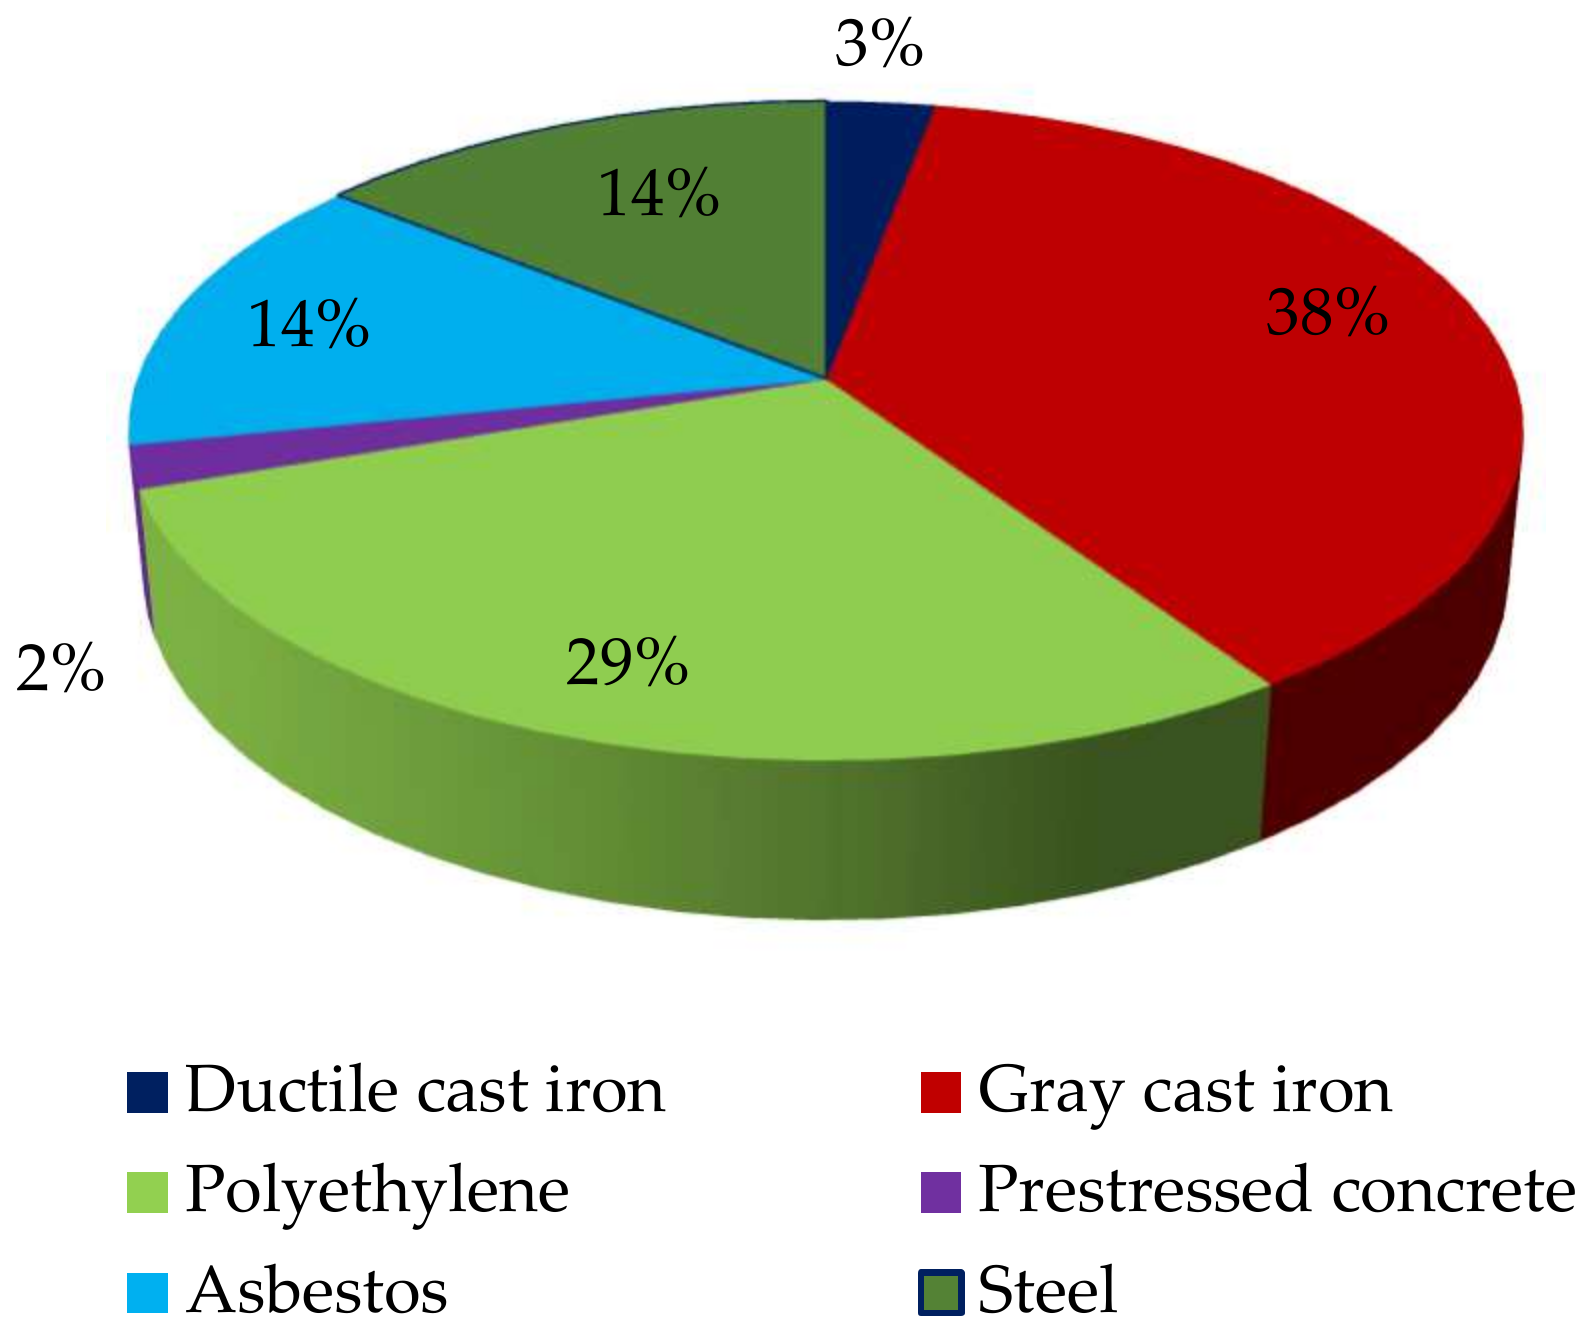
Following the inventory of existing pipeline types, it was concluded that the water distribution network in the city of Cluj-Napoca has a length of 479 km, with nominal diameters between 50 and 700 mm. It is made of various materials, depending on the knowledge and technology that existed during the period of construction, namely, ductile cast iron, gray cast iron, polyethylene, prestressed concrete, asbestos, and steel [28,48].
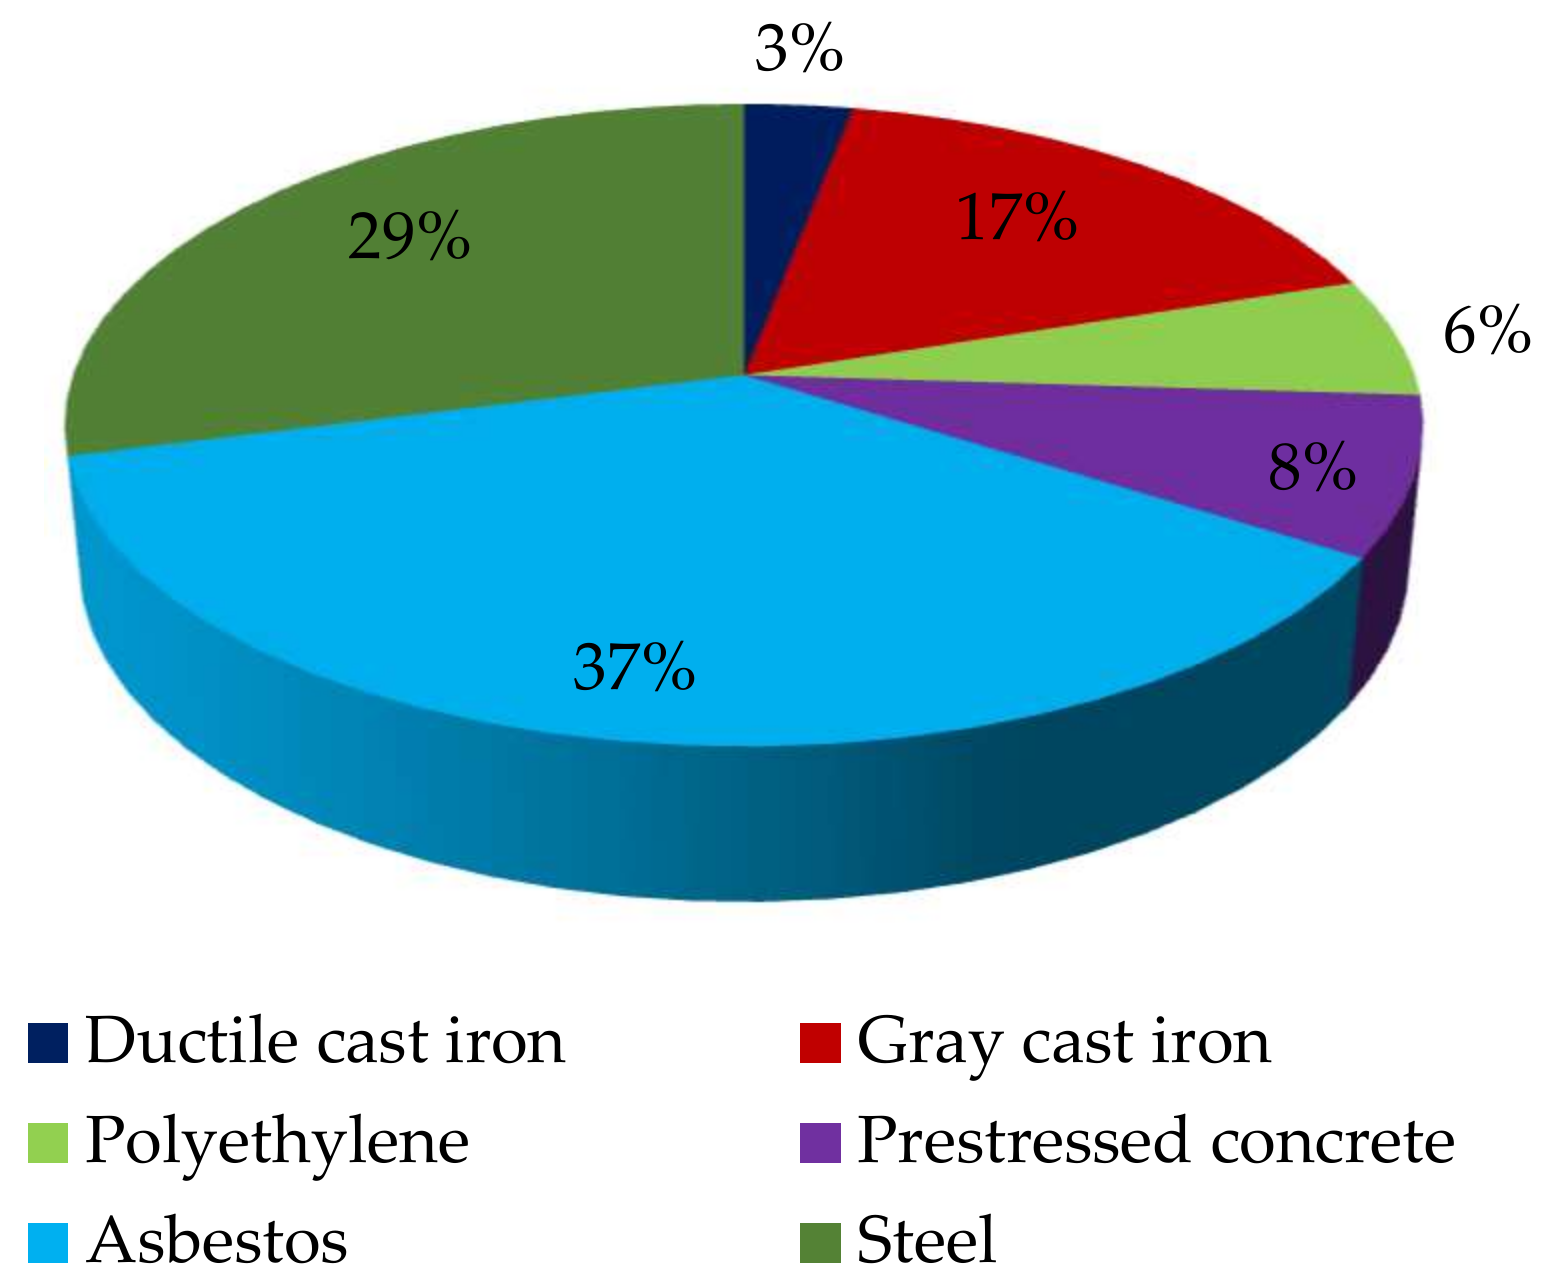
Figure 1 shows the percentages of the pipeline types that comprise the water distribution network in the city of Cluj-Napoca. Besides the inventory of pipeline types and their lengths, water losses from the water distribution system of Cluj-Napoca City have also been recorded. Figure 2 shows the percentage of water losses broken down by pipeline type.
Figure 2 shows that the largest water losses are recorded in asbestos pipes. Additionally, Figure 1 shows that the asbestos pipes have only a 14% share.
Given the fact that, in Cluj-Napoca, water distribution networks are quite old, the materials used to make water distribution networks are of poor quality, pipelines frequently break, and there are large water losses and frequent interruptions in the supply of drinking water, old pipes need to be replaced.
Considering the large water losses of the Cluj-Napoca water distribution system, a plan for the rehabilitation and modernization of water distribution networks must be established, starting with the asbestos pipes where the largest water losses are recorded [34].
2.2. Materials
Asbestos pipes started to be manufactured at the beginning of the 20th century in Italy. The new type of pipe came with some advantages, so it began to spread rapidly in most European and North American countries. Between the 1950s and the 1960s, the asbestos pipes were the most used material for the construction of water supply networks. At present, most asbestos water pipes are near the end of their lifespan [49].
Asbestos pipes pose water quality problems and, according to European regulations, have to be replaced [50].
Water loss reduction options are selected after carrying out a water balance/audit. The water balance reveals the nature and magnitude of the decision problem and provides guidance on which strategy options to adopt.
The strategy options can then be selected from a rich menu developed by the IWA and the American Water Works Association (AWWA) based on many years of research [1].
Water distribution networks can be installed using open-cut or trenchless technologies. The open-cut/trenching conventional method involves executing a new pipe at a depth of 1–6 m, or of replacing an existing pipe in the ground, by creating an open trench along the entire work route. No-dig/trenchless technology involves building or restoring a ground-based, water or water-free tubular work without opening a trench along the way. The excavations are local for the launch of the machine or of the new pipeline and for the rebuilding of the connection, the excavations representing less than 5% of the length [50].
In this study, we analyze five alternatives, as follows: Compact Pipe, Slipline, Subline, Swagelining, and Pilot Pipe (see Table 2).
In recent years, trenchless technologies have been used for construction and rehabilitation of buried utilities, such as gas pipelines, water distribution systems, sewer collection systems, and drainage culverts [52].
Pipeline renewal technologies may be divided into repair, rehabilitation, and replacement technologies [53]. Obviously, the water distribution network rehabilitation technologies may have their advantages, as well as their disadvantages.
Trojan and Costa [40] say that alternatives can be assessed using different criteria that are usually in conflict.
2.3. Methods
We propose multi-criteria methods for choosing technical solutions of rehabilitation of water distribution networks.
Two of the most important methods of multi-criteria decision-making (MCDM) are the AHP and the ANP. Because the ANP method (1996) is more recent than the AHP method (1980), a limited number of studies on this topic can be found. However, there are studies that have shown that the ANP method is superior to the AHP method [54].
Many decision problems cannot be structured hierarchically because they involve the interaction and dependence of higher-level elements on a lower-level element [55,56].
Saaty suggested the use of the AHP to solve the problem of independence among alternatives or criteria, as well as the use of the ANP to solve the problem of dependence among alternatives or criteria [54].
According to Cheng and Li [57], the ANP method incorporates both qualitative and quantitative approaches to a decision-making problem.
Nedjatia and Izbirak [54] assert that, for the decision-making process, when using qualitative and uncertain values, the use of the ANP method is preferable to the AHP method, so for the choice of pipeline rehabilitation technologies in water distribution systems, we propose the use of the ANP method.
The ANP method has been applied in many areas, such as quality [58], energy efficiency [59], civil engineering [60], renewable resources [61], environment [62], human resources [54], telecommunications [63], industry [64], health [65], finance [66], transportation [67], computer science [68], thermal energy supply systems [69], wastewater treatment [70], methane gas systems [71], banking, government, marketing, and tourism [72].
In order to select technologies for the rehabilitation of pipes from water distribution systems, the ANP method should be used. The 14 steps involved will here be explained.
Step 1: Establishing the purpose and the objectives. Goals are broad statements of intent and desirable long-term plans. The goals and objectives are derived from the utility’s vision and mission statements. The goals and objectives should involve considerations of economic, environmental and social sustainability. In practice, objectives are often conflicting and may be realized over a short-, medium-, or long-term period [1].
Issues related to the prioritization of alternatives or the general decision-making in water utility companies are always connected to conflicts of preference among managers who have different interests in attending to the company’s goals [40].
Step 2: Identification of the decision-making criteria. At this stage, the decision-maker must identify a list of selection criteria for the evaluation of the alternatives.
Tscheikner-Gratl et al. [30] assert that, at the start of the decision-making process, the decision-makers need enough time to define the decision-making criteria.
Tlili and Nafi [16] assert that decision-making on the classification of alternatives to rehabilitate water distribution networks depends on the number of criteria used and the weighting assigned to each criterion, which makes the aggregation task more complicated.
Step 3: Identification of alternatives. At this stage, the options that may contribute to the accomplishment of objectives are identified.
Step 4: Forming the structure of the ANP network. Jayant et al. [73] assert that many decision-making problems cannot be built as hierarchic problems because of the (interior/exterior) dependences and of the influences between and inside the clusters (criteria and alternatives). ANP is very useful for solving such problems.
Not only does the importance of the criteria determine the importance of the alternatives as in a hierarchy, but also the importance of the alternatives themselves determines the importance of the criteria. Feedback enables us to factor the future into the present to determine what we have to do to attain a desired future [74].
To structure detailed ANP models, Saaty wisely introduces clusters, which refer to grouping of homogeneous elements together, such as alternatives, criteria, and subcriteria.
Hence, in this model, there is one cluster for objectives and one cluster for all evaluation criteria, and each of the evaluation criteria with their sub-criteria have their own clusters. The alternatives are grouped into one cluster [75].
Relationships in a network are represented by arcs, and the directions of arcs signify dependence [56].
Step 5: Forming the pairwise comparison matrices. Similar to the AHP method, the priorities in case of the ANP method are directly assessed by pair comparison [76].
There are two levels of pairwise comparisons in the ANP method: the cluster level, which is more strategic, and the node/element level, which is more specialized.
Cluster comparisons involve comparing clusters with other clusters. While pair comparisons on elements in clusters are made depending on their influence on each element in another group, they are related to elements in another cluster (external dependence) or elements in their own group (inner dependency) [77].
Should there be n elements to be compared, then the pairwise comparison matrix noted with ‘’A’’ is defined as
where aii = 1, aji = 1/aij, and aij ≠ 0 [78].
The ‘’aij‘’ score in the pairwise comparison matrix represents the relative importance of the element from row (i) compared with the element from column (j) [68]. The pairwise comparison matrices are square matrices, with ‘’n‘’ elements on the line and ‘’n‘’ elements on the columns. In this context, for the ‘’n‘’ criteria, it is necessary to compare n (n−1)/2 pairs [79].
At this stage, the relative importance of each criterion relative to the other criteria is established, in order to determine the level of contribution of each criterion to the achievement of objectives [77].
The pair comparisons are made by the decision-makers who assess the pairs subjectively (initially based on verbal assessments—“equally important,” “slightly more important,” “absolutely more important,” and so on—and then an assignment of values on a scale from 1 to 9, which represents the degree of importance of one attribute towards another attribute). If the comparison between two criteria is reversed, then the importance value equals the reverse of the direct comparison value.
We used the Saaty scale for this purpose.
Step 6: Forming normalized matrices. Further, the values recorded in the pairwise comparison matrix are normalized, and the results are then recorded in the normalized matrix.
Saaty proposes several algorithms for approximating the relative weights [80,81]. There is still debate regarding approximation methods. A critical analysis of the weight calculation method can be taken from Bana and Vansnick [82,83]. In most articles, normalization is made by one of the following methods: the arithmetic average method [84,85], the geometric average method [86], and the difference method [87,88,89,90,91].
Further, we present the arithmetic average method, which supposes three steps:
- calculate the sum on each column of the pairwise comparison matrix using Equation (2);
- divide each element of the pairwise comparison matrix to the amount corresponding to its column using Equation (3);
- record the obtained values in the normalized matrix using Equation (4).
Step 7: Establishing local priorities. Based on the information recorded in the normalized matrix, local priorities are established using Equation (5), and the data are registered in a column matrix, according to the model presented in Equation (6). The respective matrix is called the local priority vector [92].
Step 8: Determining the consistency of the matrix. In order to determine the consistency factor of the matrices, we perform the following steps:
(a) Establish the average stochastic uniformity coefficient. The average stochastic uniformity coefficient, marked “R” is determined depending on the rank of the analyzed matrix, marked “m” based on Table 3 [93].
(b) Determine the uniformity coefficient. The uniformity coefficient “CI” is calculated based on Equation (7), as follows:
where [35] λmax > n. n is the number of elements to be compared.
(c) Determining the consistency factor of the matrices.
The consistency factor of matrices “CR” is calculated based on Equation (9), as follows:
When determining the consistency relation, one takes into account the following rule: if CR ≤ 0.10, then the matrix is considered consistent, namely, the vector of the weights is well determined. When higher matrix consistency ratios are found, it is necessary to resume comparisons for that respective matrix [95].
Step 9: Forming the unweighted supermatrix. After having established the local priorities based on the pairwise comparison matrices, the following step consists in progressively forming three supermatrices, namely, the initial or unweighted supermatrix, the weighted supermatrix, and the limit supermatrix, which are square matrices and have the same number of elements.
The priority vectors obtained from the pairwise comparison matrix are recorded as column vectors relative to their control criterion, in a new matrix called the unweighted supermatrix, whose form is according to Equation (9) [74].
The unweighted supermatrix represents the influence priority of an element from the left part of the matrix on an element from the upper part of the matrix relative to a certain control criterion.
The resulted matrix must be a stochastic one, meaning that the sum of the values recorded in each column must be equal to that of each cluster individually [95].
where ”CN” represents the cluster ”N”, ”Nn” is the element n in the cluster ”N”, and ”Wij” is the vector of the element influence [98,99,100,101,102,103].
In the unweighted matrix, ”Wij” virtually represents a local priority matrix, and it results from a comparison of two clusters.
Each column of the ”Wij” matrix is the priority vector resulting from a pairwise comparison matrix. This matrix virtually comprises the local priority vectors [104].
Step 10: Forming the weighted supermatrix. For each column block, the first entry of the local priority vector is multiplied with all of the elements of the first block of the respective column, the second entry with all of the elements of the second block of that column, and so on. Thus, the blocks of each column of the supermatrix are weighted, and the result is known as the weighted supermatrix, which is a stochastic one [56].
This “column stochastic” feature of the weighted supermatrix allows convergence to occur in the limit supermatrix [105].
Step 11: Forming the limit supermatrix. Finally, the weighted supermatrix is transformed into the limit supermatrix by raising itself to powers. The reason for multiplying the weighted supermatrix is because we wish to capture the transmission of influence along all possible paths of the supermatrix.
Raising the weighted supermatrix to the power ”2k + 1”, where ”k” is an arbitrarily large number, allow convergence of the matrix, which means the row values converge to the same value for each column of the matrix. The resulting matrix is called the limit supermatrix, which yields limit priorities capturing all of the indirect influences of each element on every other element [105].
The limit supermatrix has the same form as the weighted supermatrix, but all of the columns of the limit supermatrix are the same [56].
Step 12: Establishing the alternative ranking. The alternative ranking is established based on the global priority. Obviously, the alternative having the highest global priority ranks highest.
Step 13: Sensitivity analysis. Sensitivity analysis refers to the question of “what if” in order to see if the final answer is stable when entries are modified or to determine whether they are judgments or priorities [106].
Step 14: Choosing the best alternative. Eventually, the alternative with the highest global priority should be the selected one [56].
3. Results and Discussions
Step 1: Establishing the purpose and the objectives. The purpose of this study is to find the best technical solution for the rehabilitation of asbestos pipelines in order to reduce water losses in the water supply system of Cluj-Napoca City, Romania.
Step 2: Identifying the decision-making criteria. After the study of the scholarly literature and based on the available data, the decision-making criteria were selected. Table 4 presents the decision-making criteria used in the case study.
Step 3: Identifying the alternatives. In Section 2.2, five alternatives were identified, namely, Compact Pipe, Slipline, Subline, Swagelining, and Pilot Pipe. The data concerning the selected alternatives are presented in Table 2.
Step 4: Forming the structure of the ANP network. The problem is decomposed into a network where nodes correspond to clusters. The elements in a cluster may influence some or all of the elements of any other cluster. These relationships are represented by arcs with directions. Additionally, the relationships among elements in the same cluster can exist and be represented by a looped arc [105].
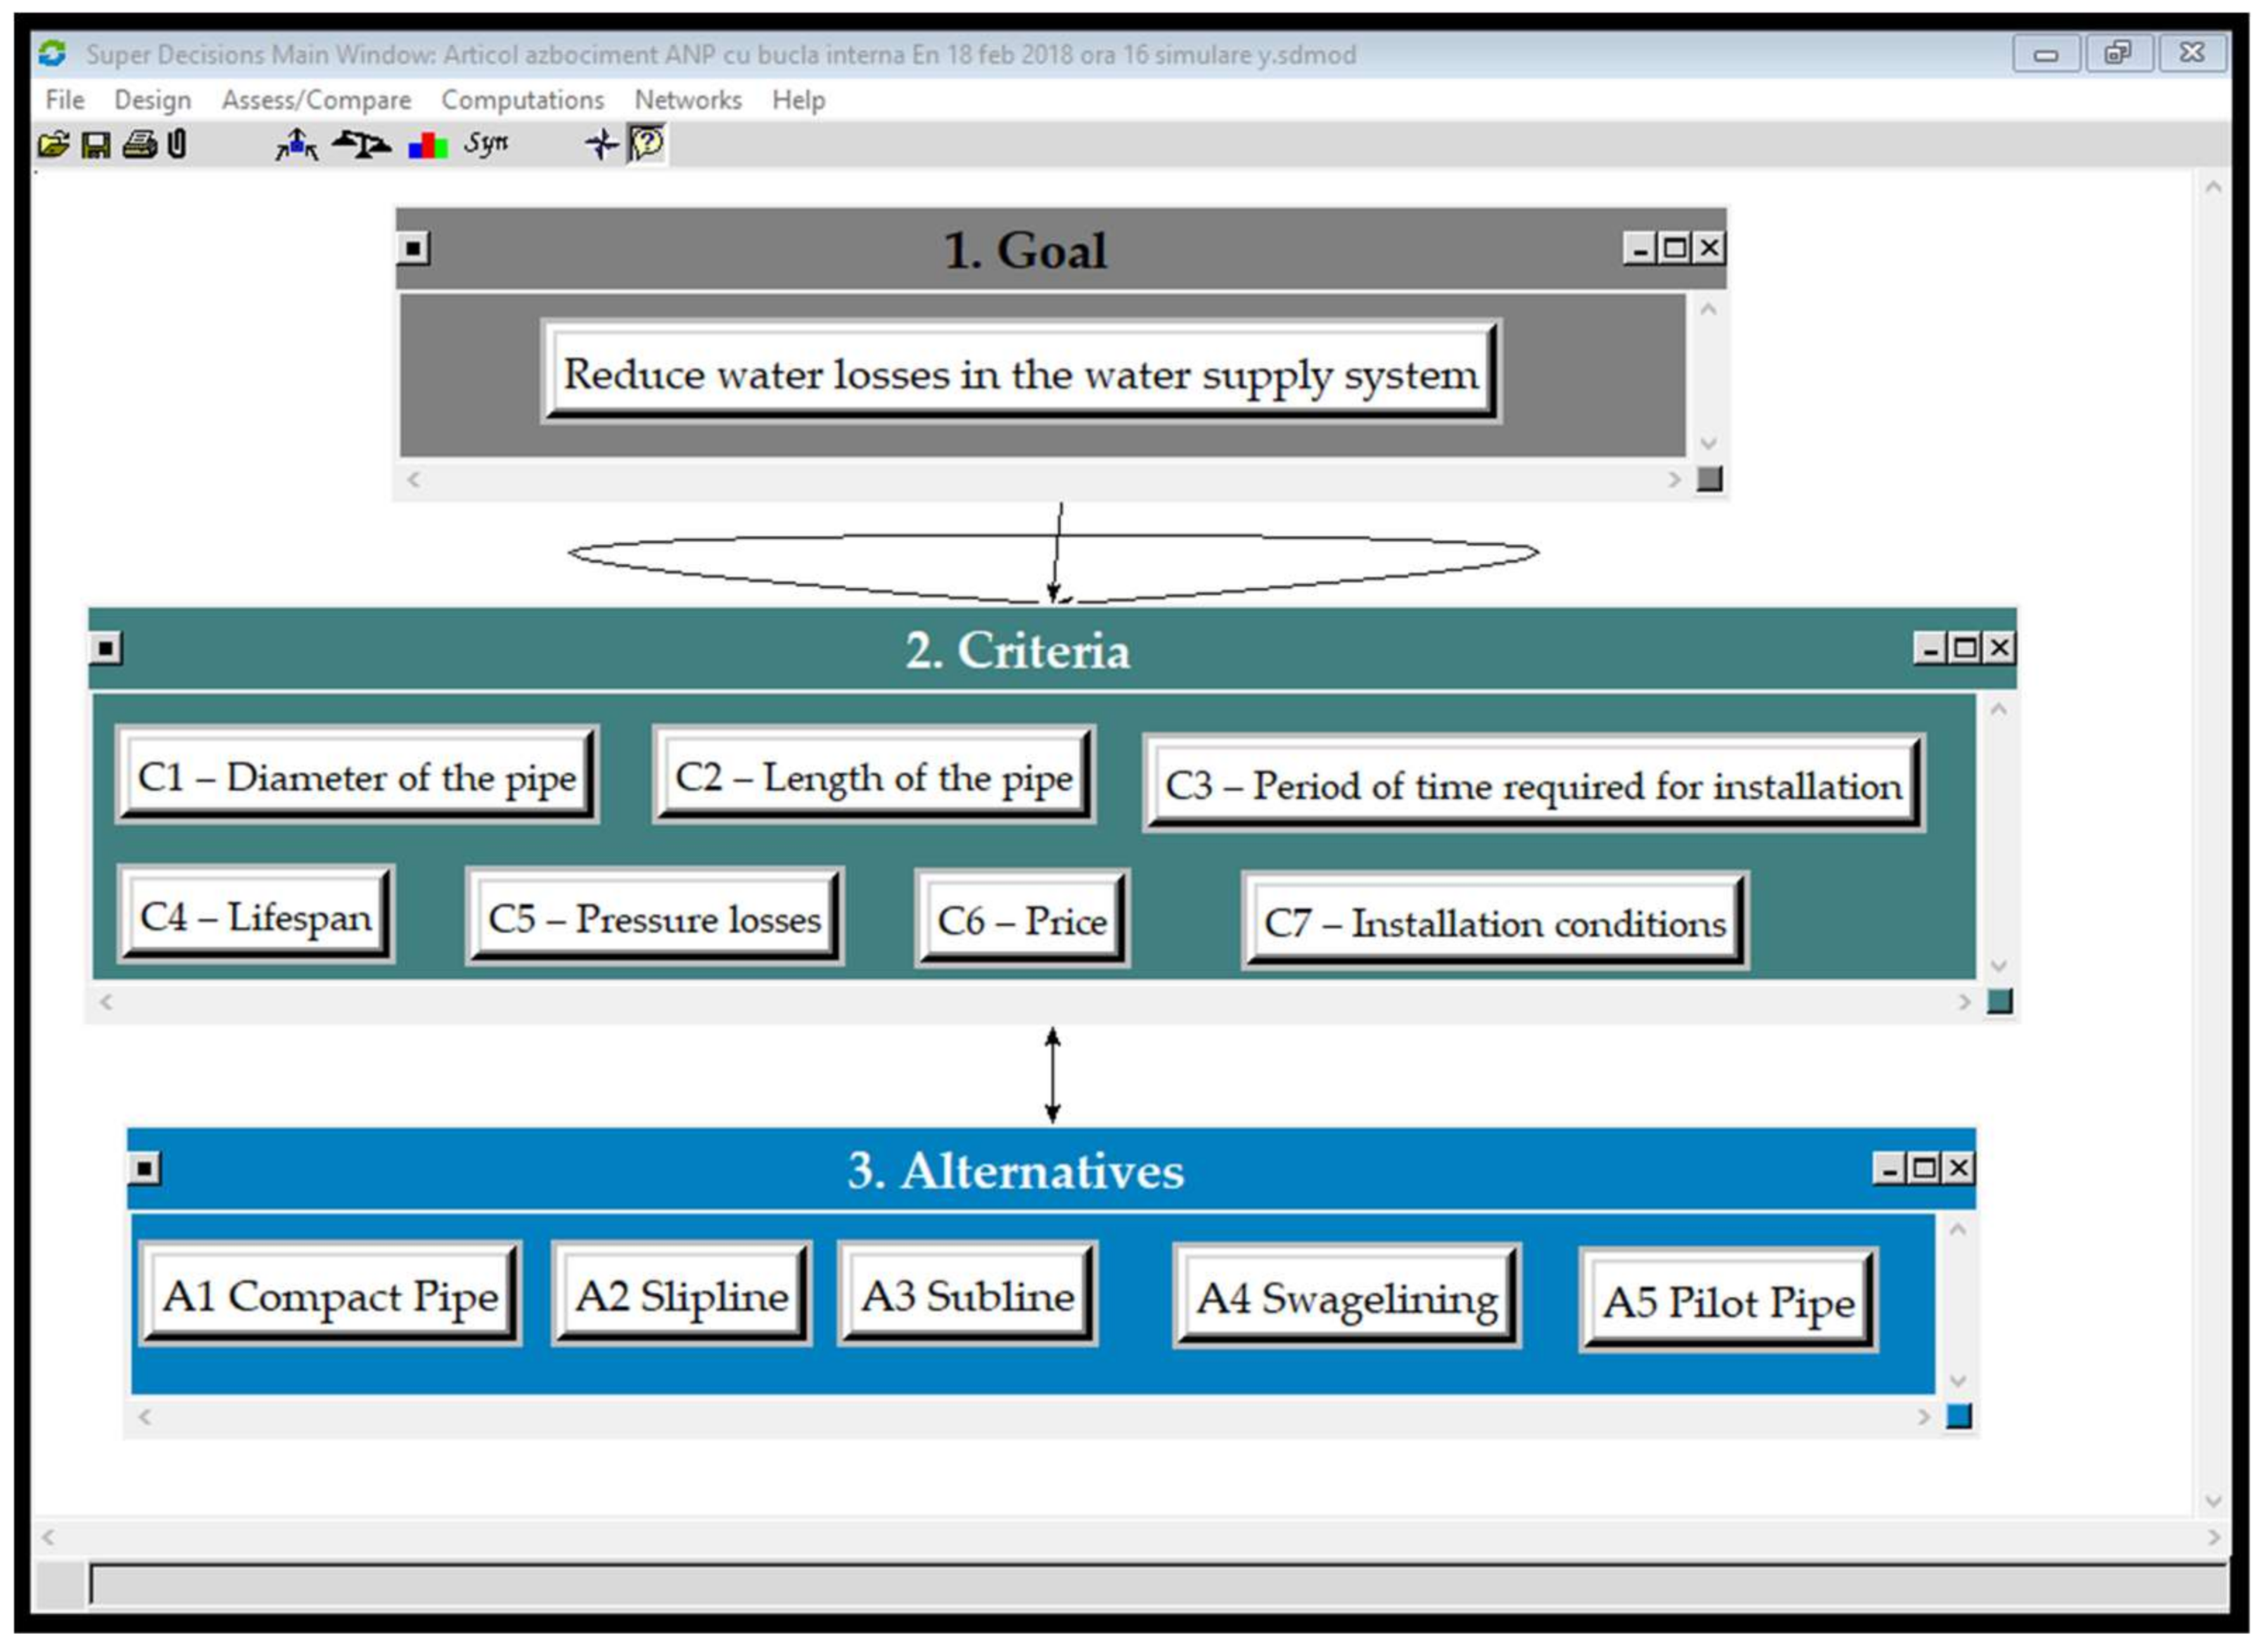
The ANP network was drawn in the Super Decisions 2.6.0 software (Creative Decisions Foundation, version 2.6.0, Pittsburgh, PA, USA). In order to rank the five alternatives based on the seven criteria, the ANP method by Saaty and the Super Decisions 2.6.0 software were used. This software was chosen because the academic version of the Super Decisions 2.6.0 software is free.
Figure 3 represents the hierarchical structure of the process of choosing the technical solution for the rehabilitation of water distribution networks containing three clusters, namely the “goal” cluster, the “criteria” cluster, and the “alternatives” cluster. There is a feedback loop in the criteria cluster, indicating that the nodes in this cluster (the criteria) are compared to them. There is also a feedback loop in the alternatives cluster and the criteria cluster, indicating that alternatives can influence the criteria.
The hierarchical structure of the network analytical process for choosing the optimal alternative was drawn using the Super Decisions 2.6.0 software, based on the relationship between criteria and alternatives.
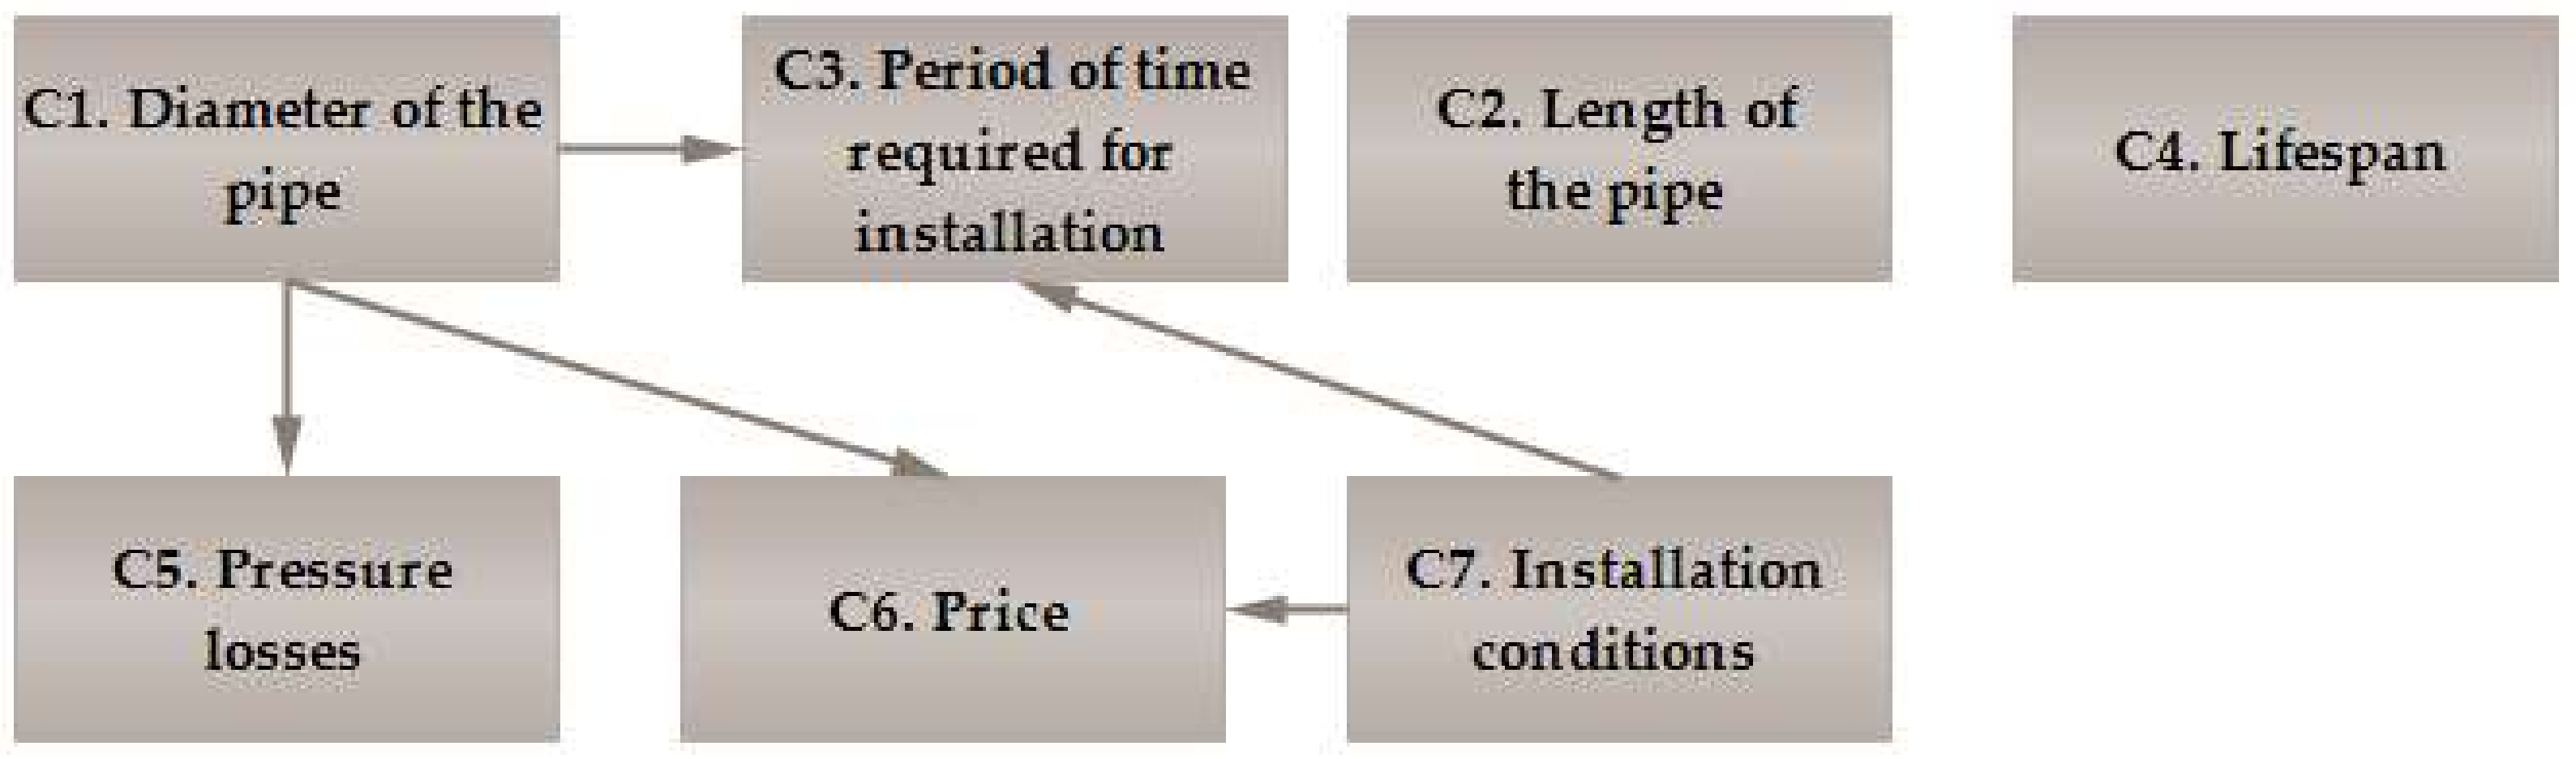
The relationships between the decision-making criteria specified in Figure 4 were identified.
Step 5: Forming the pairwise comparison matrices. In Table 5, we present the interaction between the elements of the decision-making process.
According to Table 5, for this case study, we may have a maximum of 39 pairwise comparison matrices, namely,
- 13 pairwise comparison matrices between the goal cluster and the 13 elements of the decision-making process mentioned in Table 5;
- 13 pairwise comparison matrices between the criteria cluster and the 13 elements of the decision-making process mentioned in Table 5;
- 13 pairwise comparison matrices between the alternatives cluster and the 13 elements of the decision-making process mentioned in Table 5.
For this case study, we identified 11 pairwise comparison matrices, namely,
- one matrix for comparing the criteria cluster in relation with the goal;
- two matrices that highlight the relationships between the decision-making criteria, as presented in Figure 4;
- one matrix that highlights the influence of alternatives on the criteria;
- seven matrices for comparing the alternatives in relation with the decision-making criteria, where one matrix was elaborated for each decision-making criterion.
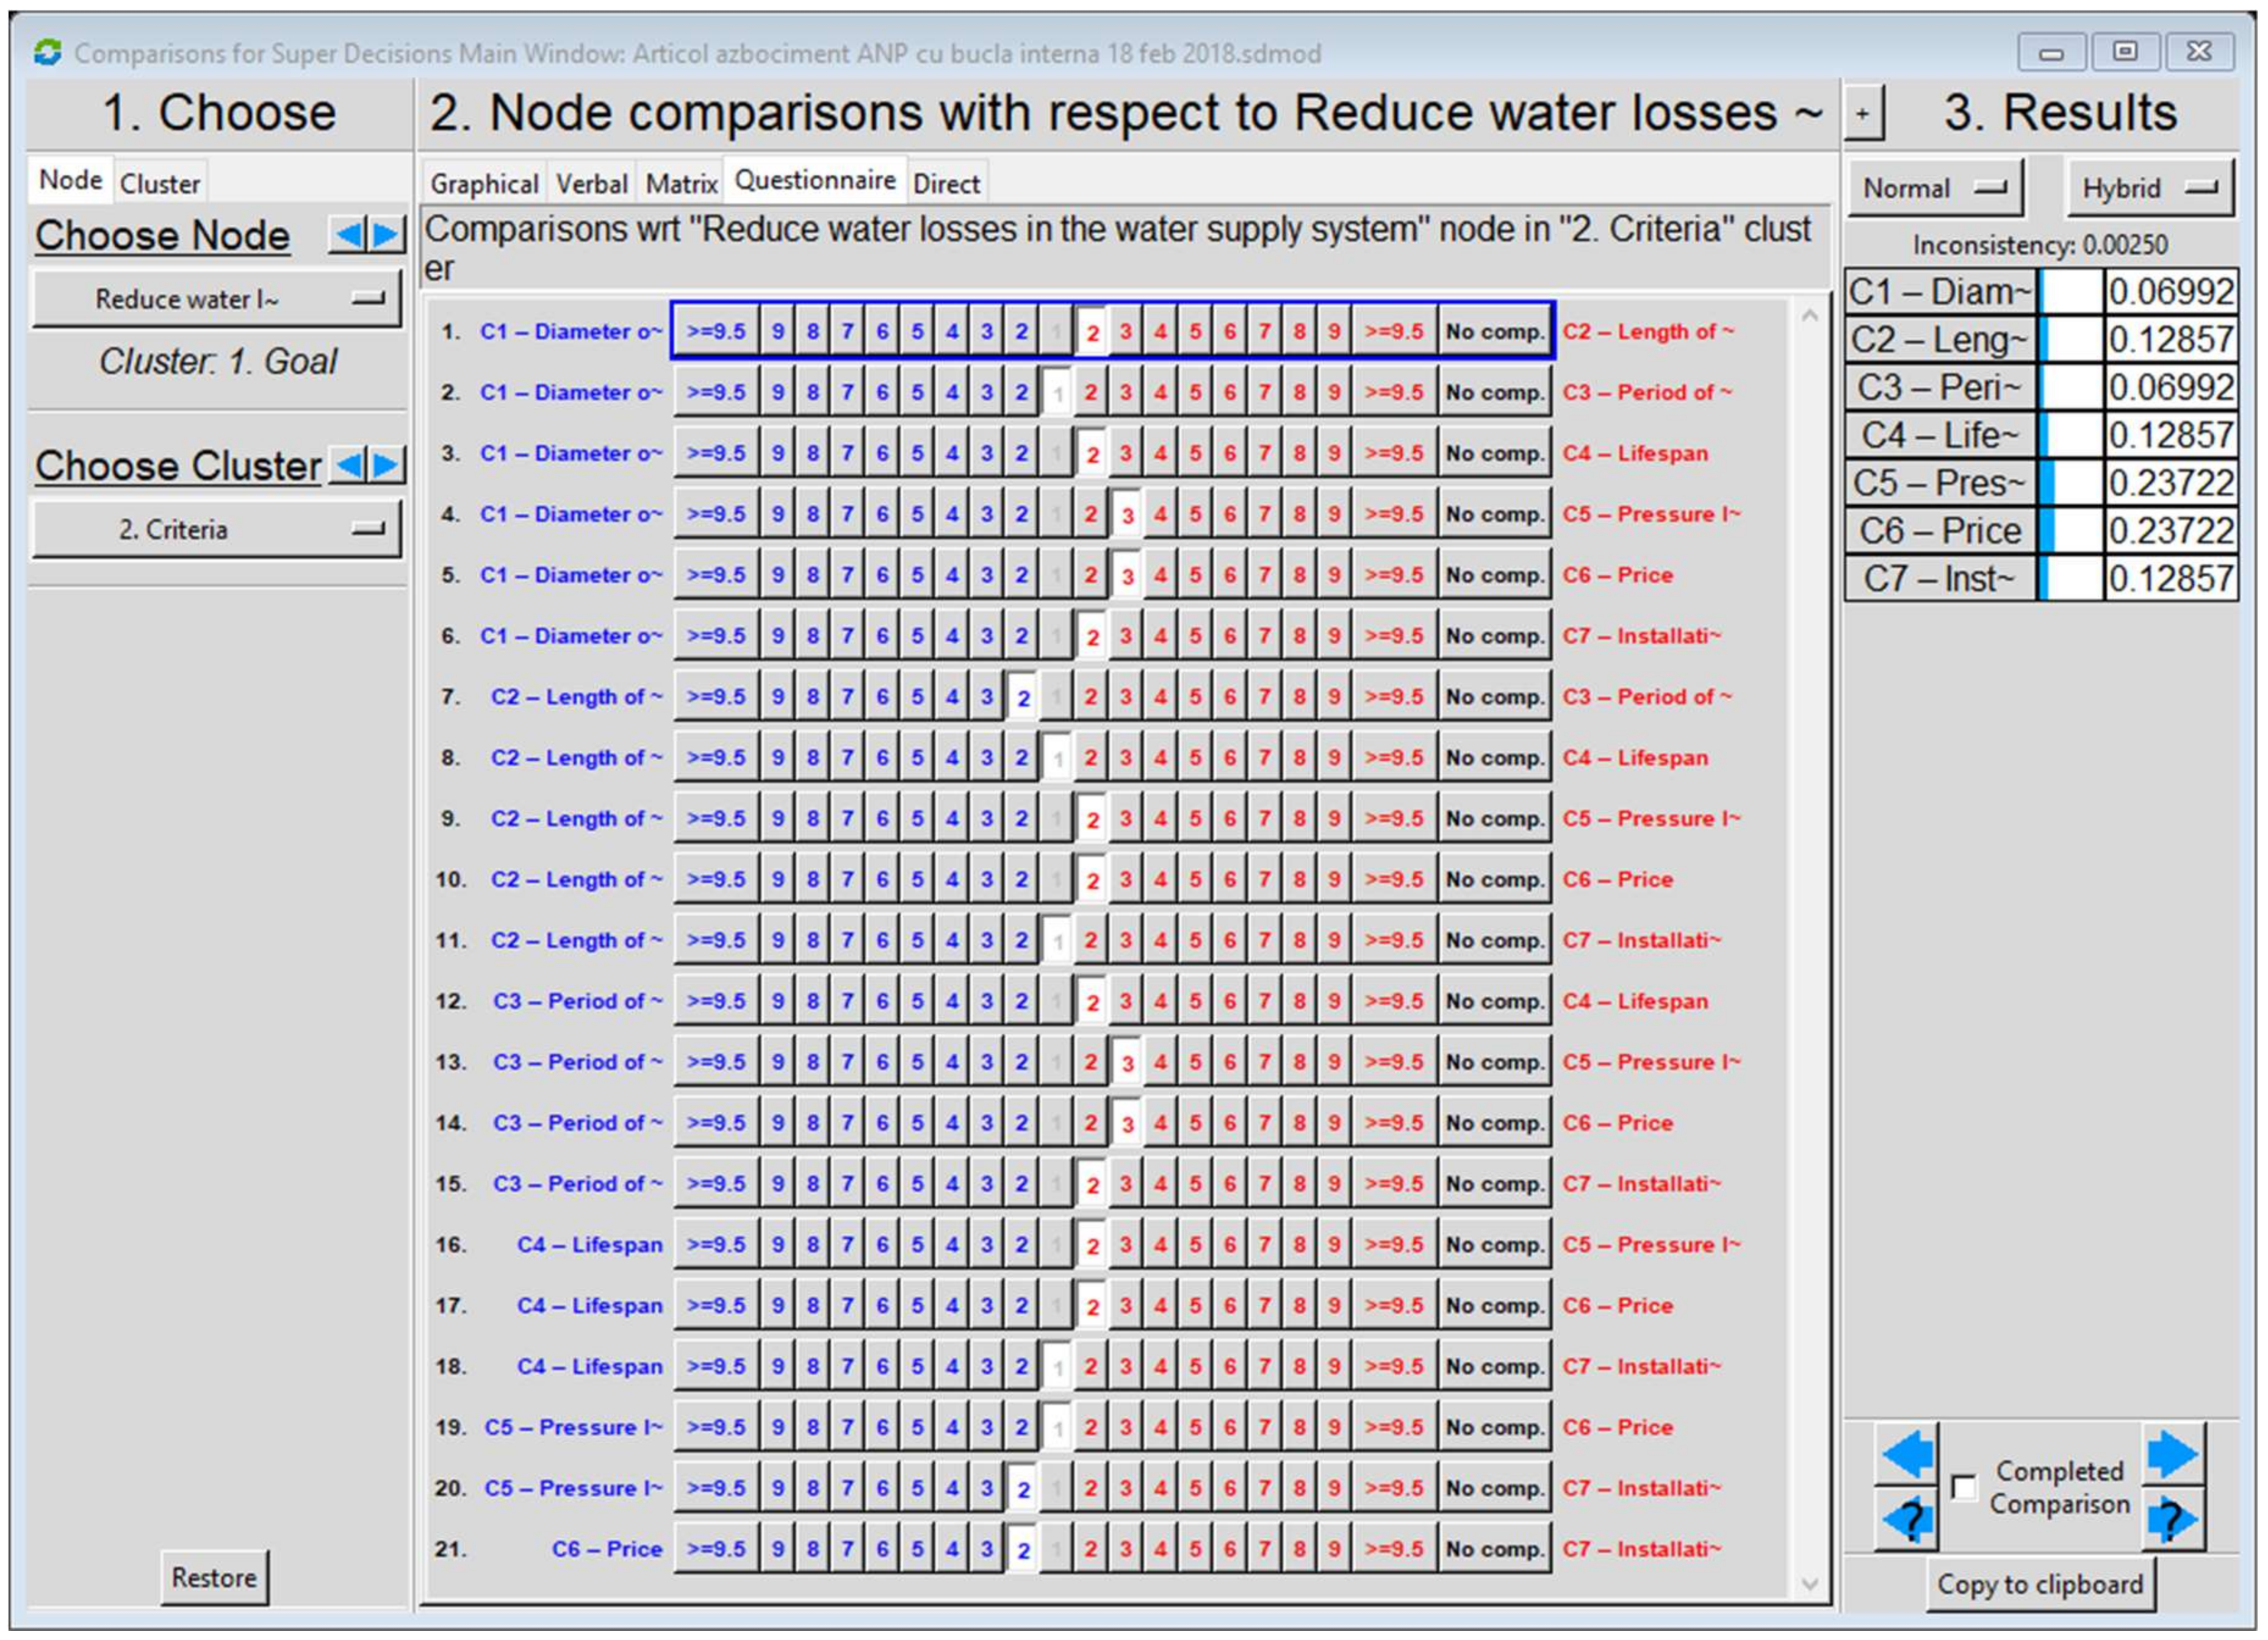
Further, the analysis of pair comparisons was done using the Super Decisions 2.6.0 software. Entering data for pair comparisons with the Super Decisions 2.6.0 software can be done through the following methods: direct data input, use of the questionnaire method, use of the matrix method, use of the verbal method, and use of the graphical method. For this case study, the data input was performed using the default data input option: the questionnaire method.
As an example, one presents the work algorithm to compare the decision-making criteria in relation with the purpose proposed in the case study. Thus, in Figure 5, we present the questionnaire used for pair comparison between the seven decision-making criteria in relation with the goal.
The pair comparisons are made based on the Fundamental Scale of Saaty.
In Table 6, we present the values of the pair comparisons between the criteria in relation with the goal.
In Table 6, it can be seen that, in the matrix, diagonally, the value one is entered because a criterion is compared to itself.
Step 6: Forming the normalized matrices. Further, the values of the criteria comparisons in relation with the purpose are normalized using the Super Decisions 2.6.0 software.
Step 7: Establishing local priorities. After normalizing the values of the criteria comparisons in relation with the purpose, the local priority vector W21 is established (see Equation (13)).
Step 8: Determining the consistency ratio of the matrix. Following the application of the calculation algorithm, eventually, for the pairwise comparison matrix of the decision-making criteria in relation with the goal, we obtained a matrix consistency ratio of 0.00250, so the matrix fulfils the consistency requirement (CR ≤ 0.1). In this case study, local priorities as well as the matrix consistency ratio were both established using the Super Decisions 2.6.0 software.
Moreover, similar calculations were performed for the other pairwise comparison matrices, after which it was found that, for all pairwise comparison matrices, the consistency ratio is less than 0.1; therefore, the matrices fulfill the consistency requirement (CR ≤ 0.1).
Step 9: Forming the unweighted supermatrix. Starting from the ranking structure of the process presented in Table 7, for this case study, the supermatrix has the following form:
where W21 is a vector representing the impact of the objective established over the criteria, W22 is a vector representing the dependency between the criteria, W23 is a vector representing the dependency between the criteria and the alternatives, and W32 is the vector representing the impact of the criteria on each alternative.
For this case study, the unweighted supermatrix was a square matrix with 13 lines and 13 columns, namely,
- one line and one column reserved for the goal cluster, having only one objective, namely, to reduce water losses in the drinking water distribution network;
- seven lines and seven columns reserved to the criteria cluster, namely, one line and one column reserved for each criterion;
- five lines and five columns reserved to the alternative cluster, namely, one line and one column reserved for each alternative.
Further, the unweighted matrix were elaborated based on the relative weights established for each pairwise comparison matrix (see Table A1). Thus, at the intersection between the line “2 Criteria” and column “1 Goal,” the relative weights obtained in the matrix of comparisons was entered between the criteria in relation with the established purpose (see Table A1). We proceeded similarly with the local weights established through the other matrices of the pairwise comparisons.
Step 10: Forming the weighted supermatrix. Based on the unweighted supermatrix, the weighted supermatrix was elaborated, and, in order to do this, the values from the unweighted supermatrix were multiplied with the weights corresponding to the cluster (see Table A2).
Step 11: Forming the limit supermatrix. The limit supermatrix is calculated by empowering the weighted supermatrix using Equation (12) (see Table A3).
Step 12: Establishing the alternative ranking. In Table 8, the alternative ranking obtained using the ANP method is presented.
Step 13: Sensitivity analysis. A sensitivity analysis was performed to check the robustness of the model. For this, the weight of each decision-making criterion was modified by ±10%.
Sensitivity analysis was performed for all seven criteria, and the alternative preferences were as follows: 0.180 for Alternative A1, 0.181 for Alternative A2, 0.366 for Alternative A3, 0.169 for Alternative A4, and 0.103 for Alternative A5.
The Super Decisions 2.6.0 software allows for the establishment of the limit supermatrix to be carried out by a number of nine different variants, defined as calculus type, scaling by scalar, new hierarchy (without limit), new hierarchy (with limit), identity at sinks, sinks formula (straight normalize), sinks formula (normalize limits), Pre-2001 Version, and Pre-2000 Version.
In this context, we ran a simulation within the case study using the nine variants for the establishment of the limit supermatrix, and, after the simulation, the same result was obtained. The limit supermatrix presented in Table A3 was determined by the “calculus type” variant.
Therefore, after performing the sensitivity analysis, it was proved that the method used offered a very stable ranking of alternatives.
Step 14: Selecting the best alternative. The priorities obtained after assessing the alternatives (see Table 8) are as follows: 0.1804 for Alternative A1 (Compact Pipe), 0.1813 for Alternative A2 (Slipline), 0.3664 for Alternative A3 (Subline), 0.1691 for Alternative A4 (Swagelining), and 0.1028 for Alternative A5 (Pilot Pipe).
Based on the priorities obtained and on the sensitivity analysis, we recommend Alternative A3, namely, the Subline technology, considering that this alternative obtained the highest global priority.
4. Conclusions
This paper presents a case study on the choice of the best technical solution for the rehabilitation of asbestos pipelines in the city of Cluj-Napoca, Romania. The ANP method was used as the method of selecting a solution for the rehabilitation of the pipes, and calculations were carried out using the Super Decisions 2.6.0 software.
In the case study, five alternatives are analyzed based on seven decision-making criteria. The decision-making criteria taken into account to substantiate the decisions included pipeline diameter, pipe length, specific building duration, lifespan, pressure drops, price, and mounting conditions, while the alternatives were Compact Pipe, Slipline, Subline, Swagelining, and Pilot Pipe.
Based on the maximum global priority, we recommend choosing the Subline alternative as a method of rehabilitating the water distribution networks made of asbestos pipes in the case of Cluj-Napoca City, Romania.
The mathematical model presented is a flexible one, as it allows for the entry of new criteria, subcriteria, and alternatives. The methodology described in this paper can be modified and used depending on the specific situation of a given town.
In the future, we also recommend studying the ANP-GP method, which, in addition to the ANP method, uses objective programming. We recommend combining the fuzzy approach with the ANP method, as this would better fit the style of human thinking and seems to produce reliable results.
Acknowledgments
We would like to thank Creative Decisions Foundation for the free version of the Super Decisions 2.6.0 software. The authors gratefully acknowledge the valuable suggestions from anonymous reviewers that helped improve the paper.
Author Contributions
Ioan Așchilean collected the date and designed this research project. Ioan Giurca established the working methodology and performed the multi-criteria simulation using the Super Decisions 2.6.0 software. All authors analyzed the manuscript and interpreted the data. All authors read and approved the final version of the manuscript.
Conflicts of Interest
The authors declare no conflict of interest.
Appendix A

Table A1.
The unweighted supermatrix.
| Cluster | 1. Goal | 2. Criteria | 3. Alternatives | |||||||||||
|---|---|---|---|---|---|---|---|---|---|---|---|---|---|---|
| C1 | C2 | C3 | C4 | C5 | C6 | C7 | A1 | A2 | A3 | A4 | A5 | |||
| 1. Goal | 0 | 0 | 0 | 0 | 0 | 0 | 0 | 0 | 0 | 0 | 0 | 0 | 0 | |
| 2. Criteria | C1 | 0.06992 | 0 | 0 | 0 | 0 | 0 | 0 | 0 | 0 | 0 | 0 | 0 | 0 |
| C2 | 0.12857 | 0 | 0 | 0 | 0 | 0 | 0 | 0 | 0 | 0 | 0 | 0 | 0.75 | |
| C3 | 0.06992 | 0.24931 | 0 | 0 | 0 | 0 | 0 | 0.25000 | 0 | 0 | 0 | 0 | 0 | |
| C4 | 0.12857 | 0 | 0 | 0 | 0 | 0 | 0 | 0 | 0 | 0 | 0 | 0 | 0 | |
| C5 | 0.23722 | 0.15706 | 0 | 0 | 0 | 0 | 0 | 0 | 0 | 0 | 0 | 0 | 0 | |
| C6 | 0.23722 | 0.59363 | 0 | 0 | 0 | 0 | 0 | 0.75000 | 0 | 0 | 0 | 0 | 0 | |
| C7 | 0.12857 | 0 | 0 | 0 | 0 | 0 | 0 | 0 | 0 | 0 | 0 | 0 | 0.25 | |
| 3. Alternatives | A1 | 0 | 0.07909 | 0.16649 | 0.18432 | 0.23077 | 0.34632 | 0.23077 | 0.19829 | 0 | 0 | 0 | 0 | 0 |
| A2 | 0 | 0.13673 | 0.16649 | 0.34908 | 0.23077 | 0.34632 | 0.23077 | 0.16278 | 0 | 0 | 0 | 0 | 0 | |
| A3 | 0 | 0.24440 | 0.43320 | 0.18432 | 0.23077 | 0.13500 | 0.23077 | 0.24351 | 0 | 0 | 0 | 0 | 0 | |
| A4 | 0 | 0.13673 | 0.16649 | 0.18432 | 0.23077 | 0.13500 | 0.07692 | 0.24351 | 0 | 0 | 0 | 0 | 0 | |
| A5 | 0 | 0.40305 | 0.06734 | 0.09796 | 0.07692 | 0.03736 | 0.23077 | 0.15191 | 0 | 0 | 0 | 0 | 0 | |
Table A2.
Weighted supermatrix.
| Cluster | 1. Goal | 2. Criteria | 3. Alternatives | |||||||||||
|---|---|---|---|---|---|---|---|---|---|---|---|---|---|---|
| C1 | C2 | C3 | C4 | C5 | C6 | C7 | A1 | A2 | A3 | A4 | A5 | |||
| 1. Goal | 0 | 0 | 0 | 0 | 0 | 0 | 0 | 0 | 0 | 0 | 0 | 0 | 0 | |
| 2. Criteria | C1 | 0.06992 | 0 | 0 | 0 | 0 | 0 | 0 | 0 | 0 | 0 | 0 | 0 | 0 |
| C2 | 0.12857 | 0 | 0 | 0 | 0 | 0 | 0 | 0 | 0 | 0 | 0 | 0 | 0.75000 | |
| C3 | 0.06992 | 0.06233 | 0 | 0 | 0 | 0 | 0 | 0.06250 | 0 | 0 | 0 | 0 | 0 | |
| C4 | 0.12857 | 0 | 0 | 0 | 0 | 0 | 0 | 0 | 0 | 0 | 0 | 0 | 0 | |
| C5 | 0.23722 | 0.03926 | 0 | 0 | 0 | 0 | 0 | 0 | 0 | 0 | 0 | 0 | 0 | |
| C6 | 0.23722 | 0.14841 | 0 | 0 | 0 | 0 | 0 | 0.18750 | 0 | 0 | 0 | 0 | 0 | |
| C7 | 0.12857 | 0 | 0 | 0 | 0 | 0 | 0 | 0 | 0 | 0 | 0 | 0 | 0.25000 | |
| 3. Alternatives | A1 | 0 | 0.05931 | 0.16649 | 0.18432 | 0.23077 | 0.34632 | 0.23077 | 0.14872 | 0 | 0 | 0 | 0 | 0 |
| A2 | 0 | 0.10255 | 0.16649 | 0.34908 | 0.23077 | 0.34632 | 0.23077 | 0.12209 | 0 | 0 | 0 | 0 | 0 | |
| A3 | 0 | 0.18330 | 0.43320 | 0.18432 | 0.23077 | 0.13500 | 0.23077 | 0.18263 | 0 | 0 | 0 | 0 | 0 | |
| A4 | 0 | 0.10255 | 0.16649 | 0.18432 | 0.23077 | 0.13500 | 0.07692 | 0.18263 | 0 | 0 | 0 | 0 | 0 | |
| A5 | 0 | 0.30229 | 0.06734 | 0.09796 | 0.07692 | 0.03736 | 0.23077 | 0.11393 | 0 | 0 | 0 | 0 | 0 | |
Table A3.
Limit supermatrix.
| Cluster | 1. Goal | 2. Criteria | 3. Alternatives | |||||||||||
|---|---|---|---|---|---|---|---|---|---|---|---|---|---|---|
| C1 | C2 | C3 | C4 | C5 | C6 | C7 | A1 | A2 | A3 | A4 | A5 | |||
| 1. Goal | 0 | 0 | 0 | 0 | 0 | 0 | 0 | 0 | 0 | 0 | 0 | 0 | 0 | |
| 2. Criteria | C1 | 0 | 0 | 0 | 0 | 0 | 0 | 0 | 0 | 0 | 0 | 0 | 0 | 0 |
| C2 | 0.16718 | 0.16718 | 0.16718 | 0.16718 | 0.16718 | 0.16718 | 0.16718 | 0.16718 | 0 | 0 | 0 | 0 | 0.16718 | |
| C3 | 0.01026 | 0.01026 | 0.01026 | 0.01026 | 0.01026 | 0.01026 | 0.01026 | 0.01026 | 0 | 0 | 0 | 0 | 0.01026 | |
| C4 | 0 | 0 | 0 | 0 | 0 | 0 | 0 | 0 | 0 | 0 | 0 | 0 | 0 | |
| C5 | 0 | 0 | 0 | 0 | 0 | 0 | 0 | 0 | 0 | 0 | 0 | 0 | 0 | |
| C6 | 0.03077 | 0.03077 | 0.03077 | 0.03077 | 0.03077 | 0.03077 | 0.03077 | 0.03077 | 0 | 0 | 0 | 0 | 0.03077 | |
| C7 | 0.05572 | 0.05572 | 0.05572 | 0.05572 | 0.05572 | 0.05572 | 0.05572 | 0.05572 | 0 | 0 | 0 | 0 | 0.05572 | |
| 3. Alternatives | A1 | 0.13282 | 0.13282 | 0.13282 | 0.13282 | 0.13282 | 0.13282 | 0.13282 | 0.13282 | 0 | 0 | 0 | 0 | 0.13282 |
| A2 | 0.13343 | 0.13343 | 0.13343 | 0.13343 | 0.13343 | 0.13343 | 0.13343 | 0.13343 | 0 | 0 | 0 | 0 | 0.13343 | |
| A3 | 0.26967 | 0.26967 | 0.26967 | 0.26967 | 0.26967 | 0.26967 | 0.26967 | 0.26967 | 0 | 0 | 0 | 0 | 0.26967 | |
| A4 | 0.12445 | 0.12445 | 0.12445 | 0.12445 | 0.12445 | 0.12445 | 0.12445 | 0.12445 | 0 | 0 | 0 | 0 | 0.12445 | |
| A5 | 0.07570 | 0.07570 | 0.07570 | 0.07570 | 0.07570 | 0.07570 | 0.07570 | 0.07570 | 0 | 0 | 0 | 0 | 0.07570 | |
References
- Mutikanga, H.E.; Sharma, S.K.; Vairavamoorthy, K. Multi-criteria Decision Analysis: A Strategic Planning Tool for Water Loss Management. Water Resour. Manag. 2011, 25, 3947–3969. [Google Scholar] [CrossRef]
- Puust, R.; Kapelan, Z.; Savic, D.A.; Koppel, T. A review of methods for leakage management in pipe networks. Urban Water J. 2010, 7, 25–45. [Google Scholar] [CrossRef]
- Candelieri, A.; Conti, D.; Archetti, F. A graph based analysis of leak localization in urban water networks. Procedia Eng. 2014, 70, 228–237. [Google Scholar] [CrossRef]
- Danilenko, A.; Van den Berg, C.; Macheve, B.; Moffitt, L.J. The IBNET Water Supply and Sanitation Blue Book: The International Benchmarking Network for Water and Sanitation Utilities Databook; Word Bank: Washington, DC, USA, 2014; pp. 45, 51, 88–89, 99, 112–114. ISBN 978-0821385821. [Google Scholar]
- Chirica, S.; Luca, A.-L. Consideratii privind pierderile de apa din retelele de conducte (Considerations regarding water losses from pipe networks). In Proceedings of the 52-a Conferinta Nationala de Instalatii cu Participare Internationala, Performanta in Mediul Construit al Mileniului Trei: Eficienta, Siguranta, Sanatate, Sinaia, Romania, 4–6 October 2017; Matrix Rom: Bucharest, Romania, 2017; p. 64. (In Romanian). [Google Scholar]
- Alimentări cu apă. Determinarea cantităţilor de apă potabilă pentru localităţi urbane şi rurale (Water supplies. Calculation of drinking water supply quantities in urban and rural sites); SR 1343/1-2006; Asociaţia de Standardizare din România (ASRO): Bucharest, Romania, 2006. (In Romanian) [Google Scholar]
- Covelli, C.; Cozzolino, L.; Cimorelli, L.; Della Morte, R.; Pianese, D. A model to simulate leakage through joints in water distribution systems. Water Sci. Technol. Water Supply 2015, 15, 852–863. [Google Scholar] [CrossRef]
- Covelli, C.; Cozzolino, L.; Cimorelli, L.; Della Morte, R.; Pianese, D. Optimal Location and Setting of PRVs in WDS for Leakage Minimization. Water Resour. Manag. 2016, 30, 1803–1817. [Google Scholar] [CrossRef]
- Covelli, C.; Cimorelli, L.; Cozzolino, L.; Della Morte, R.; Pianese, D. Reduction in water losses in water distribution systems using pressure reduction valves. Water Sci. Technol. Water Supply 2016, 16, 1033–1045. [Google Scholar] [CrossRef]
- Candelieri, A.; Soldi, D.; Archetti, F. Cost-effective sensors placement and leak localization—The Neptun pilot of the ICeWater project. J. Water Supply Res. Technol. AQUA 2015, 64, 567–582. [Google Scholar] [CrossRef]
- Candelieri, A.; Soldi, D.; Conti, D.; Archetti, F. Analytical Leakages Localization in Water Distribution Networks Through Spectral Clustering and Support Vector MACHINES. The Icewater Approach. Procedia Eng. 2014, 89, 1080–1088. [Google Scholar] [CrossRef]
- Castro-Gama, M.; Pan, Q.; Lanfranchi, E.A.; Jonoski, A.; Solomatine, D.P. Pump scheduling for a large water distribution network. Milan, Italy. Procedia Eng. 2017, 186, 436–443. [Google Scholar] [CrossRef]
- Mala-Jetmarova, H.; Sultanova, N.; Savic, D. Lost in optimisation of water distribution systems? A literature review of system operation. Environ. Model. Softw. 2017, 93, 209–254. [Google Scholar] [CrossRef]
- Soldi, D.; Candelieri, A.; Archetti, F. Resilience and vulnerability in urban water distribution networks through network theory and hydraulic simulation. Procedia Eng. 2015, 119, 1259–1268. [Google Scholar] [CrossRef]
- Candelieri, A.; Giordani, I.; Archetti, F. Supporting Resilience Management of Water Distribution Networks through Network Analysis and Hydraulic Simulation. In Proceedings of the 21st International Conference on Control Systems and Computer Science (CSCS), Bucharest, Romania, 29–31 May 2017. [Google Scholar] [CrossRef]
- Tlili, Y.; Nafi, A. A practical decision scheme for the prioritization of water pipe replacement. Water Sci. Technol. Water Supply 2012, 12, 895–917. [Google Scholar] [CrossRef]
- Yoo, D.G.; Kang, D.; Jun, H.; Kim, J.H. Rehabilitation Priority Determination of Water Pipes Based on Hydraulic Importance. Water 2014, 6, 3864–3887. [Google Scholar] [CrossRef]
- Shuang, Q.; Liu, Y.; Tang, Y.; Liu, J.; Shuang, K. System Reliability Evaluation in Water Distribution Networks with the Impact of Valves Experiencing Cascading Failures. Water 2017, 9, 413. [Google Scholar] [CrossRef]
- Lindhe, A. Risk Assessment and Decision Support for Managing Drinking Water Systems. Ph.D. Thesis, Chalmers University of Technology, Gothenburg, Sweden, 2010. [Google Scholar]
- Bassi, A.M.; Tan, Z.; Goss, S. An Integrated Assessment of Investments towards Global Water Sustainability. Water 2010, 2, 726–741. [Google Scholar] [CrossRef]
- Kanakoudis, V.; Tsitsifli, S.; Papadopoulou, A. Integrating the Carbon and Water Footprints’ Costs in the Water Framework Directive 2000/60/EC Full Water Cost Recovery Concept: Basic Principles towards Their Reliable Calculation and Socially Just Allocation. Water 2012, 4, 45–62. [Google Scholar] [CrossRef]
- Di Nardo, A.; Di Natale, M.; Giudicianni, C.; Santonastaso, G.F.; Tzatchkov, V.; Rodriguez Varela, J.M.; Alcocer Yamanaka, V.H. Water Supply Network Partitioning Based on Simultaneous Cost and Energy Optimization. Procedia Eng. 2016, 162, 238–245. [Google Scholar] [CrossRef]
- Ionescu, G.-C.; Ionescu, D.-S. The Optimization of Energy Consumption in Water Supply Systems. Acta Electroteh. 2005, 46, 191–194. [Google Scholar]
- Puleo, V.; Notaro, V.; Freni, G.; La Loggia, G. Water and energy saving in urban water systems: The ALADIN project. Procedia Eng. 2016, 162, 396–402. [Google Scholar] [CrossRef]
- Piratla, K.R.; Ariaratnam, S.T. Design innovation leads to sustainable water distribution systems. Constr. Innov. 2013, 13, 302–319. [Google Scholar] [CrossRef]
- Moselhi, O.; Zayed, T.; Salman, A. Selection Method for Rehabilitation of Water Distribution Networks. In Proceedings of the International Conference on Pipelines and Trenchless Technology, Shanghai, China, 18–21 October 2009; pp. 1390–1402. [Google Scholar]
- Large, A.; Le Gat, Y.; Elachachi, S.M.; Renaud, E.; Breysse, D.; Tomasian, M. Decision support tools: Review of risk models in drinking water network asset management. Water Util. J. 2015, 10, 45–53. [Google Scholar]
- Așchilean, I.; Badea, G.; Giurca, I.; Naghiu, G.S.; Iloaie, F.G. Determining Priorities Concerning Water Distribution Network Rehabilitation. Energy Procedia 2017, 112, 27–34. [Google Scholar] [CrossRef]
- Abunada, M.; Trifunović, N.; Kennedy, M.; Babel, M. Optimization and reliability assessment of water distribution networks incorporating demand balancing tanks. Procedia Eng. 2014, 70, 4–13. [Google Scholar] [CrossRef]
- Tscheikner-Gratl, F.; Egger, P.; Rauch, W.; Kleidorfer, M. Comparison of Multi-Criteria Decision Support Methods for Integrated Rehabilitation Prioritization. Water 2017, 9, 68. [Google Scholar] [CrossRef]
- Hajkowicz, S.; Higgins, A. A comparison of multiple criteria analysis techniques for water resource management. Eur. J. Oper. Res. 2008, 184, 255–265. [Google Scholar] [CrossRef]
- Xu, L.; Yang, J.B. Introduction to Multi-Criteria Decision Making and the Evidential Reasoning Approach; Manchester School of Management: Manchester, UK, 2001; p. 3. ISBN 186115111X. [Google Scholar]
- Boran, S.; Göztepe, K.; Yavuz, E. Study on Election of Personnel Based on Performance Measurement by Using Analytic Network Process (ANP). Int. J. Comput. Sci. Netw. Secur. 2008, 8, 333–338. [Google Scholar]
- Aşchilean, I.; Badea, G.; Giurca, I.; Naghiu, G.S.; Iloaie, F.G. Choosing the Optimal Technology to Rehabilitate the Pipes in Water Distribution Systems Using the AHP Method. Energy Procedia 2017, 112, 19–26. [Google Scholar] [CrossRef]
- Ihimekpen, N.; Isagba, E.S. The Use of AHP (Analytical Hierarchy Process) as Multi Criteria Decision Tool for the Selection of Best Water Supply Source for Benin City. Niger. J. Environ. Sci. Technol. 2017, 1, 169–176. [Google Scholar]
- Adamović, P.; Dunović, C.; Nahod, M.-M. Expert choice model for choosing appropriate trenchless method for pipe laying. In Proceedings of the 5th International Conference Technology for Sustainable Developement in Building Industry (TECHSTA 2007), Prag, Czech Republic, 24–26 September 2007; pp. 19–20. [Google Scholar]
- Blindu, I. Outil d’aide au diagnostic du réseau d’eau potable pour la ville de Chisinau par analyse spatiale et temporelle des dysfonctionnements hydrauliques. Ph.D. Thesis, Université Jean Monnet en cotutelle avec l’Université Technique de Moldavie, Chișinău, Republic of Moldova, 2013. (In French). [Google Scholar]
- Mohamed, E.; Zayed, T. Funding infrastructure renewal plan for water distribution system. In Proceedings of the CSCE 2008 Annual Conference, Québec, QC, Canada, 10–13 June 2008. [Google Scholar]
- Al-Barqawi, H.; Zayed, T. Infrastructure Management: Integrated AHP/ANN Model to Evaluate Municipal Water Mains’ Performance. J. Infrastruct. Syst. 2008, 14, 305–318. [Google Scholar] [CrossRef]
- Trojan, F.; Costa, M.D. Prioritising alternatives for maintenance of water distribution networks: A group decision approach. Water SA 2012, 38, 555–564. [Google Scholar] [CrossRef]
- Trojan, F.; Costa, M.D. Using Electre TRI to support maintenance of water distribution networks. Pesqui. Oper. 2012, 32, 423–442. [Google Scholar] [CrossRef]
- Haidar, H. Réhabilitation des réseaux d’eau potable: Méthodologie d’analyse multicritère des patrimoines et des programmes de rehabilitation présentée devant. Ph.D. Thesis, L’Institut National des Sciences Appliquées de Lyon, Villeurbanne, France, 2006. (In French). [Google Scholar]
- Marques, J.; Cunha, M.; Savić, D. A multicriteria approach for a phased design of water distribution networks. Procedia Eng. 2015, 119, 1231–1240. [Google Scholar] [CrossRef] [Green Version]
- Dražić, J.; Dunjić, D.; Mučenski, V.; Peško, I. Multi-criteria analysis of variation solutions for the pipeline route by applying the Promethee method. Tehnički Vjesnik 2016, 23, 599–610. [Google Scholar] [CrossRef]
- Fontana, M.E.; Costa Morais, D. Water distribution network segmentation based on group multi-criteria decision approach. Production 2017, 27, 1–13. [Google Scholar] [CrossRef]
- Scholten, L.; Scheidegger, A.; Reichert, P.; Mauer, M.; Lienert, J. Strategic rehabilitation planning of piped water networks using multi-criteria decision analysis. Water Res. 2014, 49, 124–143. [Google Scholar] [CrossRef] [PubMed]
- Weistroffer, H.R.; Smith, C.H.; Narula, S.C. Chapter 24. Multiple Criteria Decision Support Software. In Multiple Criteria Decision Analysis: State of the Art Surveys; Salvatore, G., Ed.; Springer: New York, NY, USA, 2005; pp. 989–1018. ISBN 978-0-387-23081-8. [Google Scholar]
- Așchilean, I. Reabilitarea si modernizarea sistemelor de alimentare cu apă a localitătilor urbane (Rehabilitation and Modernization of the Water Supply Systems of Towns); Editura Risoprint: Cluj-Napoca, Romania, 2014; pp. 304–309. ISBN 978-973-53-1212-1. (In Romanian) [Google Scholar]
- Marek, C.; Vojtěch, V.; Tomáš, D. Rehabilitation of asbestos cement water mains for potable water in the Czech Republic. In Proceedings of the 14th International Multidisciplinary Scientific GeoConference SGEM 2014, Albena, Bulgaria, 17–26 June 2014. [Google Scholar]
- Perju, S.; Bratu, P.; Mănescu, A.; Ou, I.; Racoviţeanu, G.; Androne, C.; Sandu, M.; Ion, D.; Vulpaşu, E.; Dineţ, E.; Chicu, A. Ghid Privind Reabilitarea Conductelor Pentru Transportul Apei. Indicativ GP 127-2014 (Guidelines on the Rehabilitation of Pipes Used for Water Distribution. Code GP 127-2014); Ministerul Dezvoltării Regionale si Administratiei Publice: Bucharest, Romania, 2014; pp. 13–18. (In Romanian)
- Aşchilean, I. Contribuţii teoretice şi experimentale la reabilitarea şi modernizarea sistemelor de alimentare cu apă a localităţilor urbane (Theoretical and Experimental Contributions Regarding the Rehabilitation and Modernization of Urban Water Supply). Ph.D. Thesis, Technical University of Cluj-Napoca, Cluj-Napoca, Romania, 2010. (In Romanian). [Google Scholar]
- Zhao, J.Q.; Rajani, B. Construction and Rehabilitation Costs for Buried Pipe with a Focus on Trenchless Technologies; National Research Council Canada; Institute for Research in Construction: Ottawa, ON, Canada, 2002. [Google Scholar]
- Morrison, R.; Sangster, T.; Downey, D.; Matthews, J.; Condit, W.; Sinha, S.; Maniar, S.; Sterling, R.; Selvakumar, A. State of Technology for Rehabilitation of Water Distribution Systems; U.S. Environmental Protection Agency: Cincinnati, OH, USA, 2013.
- Nedjatia, A.; Izbirak, G. Evaluating the Intellectual Capital by ANP Method in a Dairy Company. Procedia Soc. Behav. Sci. 2013, 107, 136–144. [Google Scholar] [CrossRef]
- Saaty, T.L. Decision Making with Dependence and Feedback: The Analytic Network Process; RWS Publications: Pittsburgh, PA, USA, 1996; ISBN 0-9620317-9-8. [Google Scholar]
- Dağdeviren, M.; Yüksel, İ. Personnel selection using analytic network Process. İstanbul Ticaret Üniversitesi Fen Bilimleri Dergisi 2007, 6, 99–118. [Google Scholar]
- Cheng, E.; Li, H. Analytic Network Process Applied to Project Selection. J. Constr. Eng. Manag. 2005, 131, 459–466. [Google Scholar] [CrossRef]
- Lee, Y.-T.; Wu, W.-W.; Tzeng, G.-H. An effective decision-making method using a combined QFD and ANP approach. WSEAS Trans. Bus. Econ. 2008, 12/5, 541–551. [Google Scholar]
- Chen, Z.; Clements-Croome, D.; Hong, J.; Li, H.; Xu, Q. A multicriteria lifespan energy efficiency approach to intelligent building assessment. Energy Build. 2006, 38, 393–409. [Google Scholar] [CrossRef]
- Bu-Qammaz, A.S. Risk assessment of international construction projects using the Analytic Network Proces. Master’s Thesis, Middle East Technical University, Ankara, Turkey, 2007. [Google Scholar]
- Aghilone, G.; De Felice, F.; Petrillo, A. Comparative analysis based on analytic network process for selection of a mini wind station plant. In Proceedings of the International Symposium on the Analytic Hierarchy Process, Sorrento, Italy, 15–18 June 2011; pp. 1–16. [Google Scholar]
- Ioja, I.; Cristian, N.; Mihai, R.; Vanau, G.O.; Onose, D.A.; Gavrilidis, A.A.; Hossu, C.A. Managementul Conflictelor de Mediu (Management of Environment Conflicts); Bucharest University Publishing House: Bucharest, Romania, 2015; pp. 105–108. ISBN 978-606-16-0617-7. (In Romanian) [Google Scholar]
- Gasiea, Y.; Emsley, M.; Mikhailov, L. Rural Telecommunications Infrastructure Selection Using the Analytic Network Process. J. Telecommun. Inf. Technol. 2010, 2, 28–42. [Google Scholar]
- Khedkar, P.T.; Subramanyan, H. Equipment selection by using analytical network process approach. In Proceedings of the National Conference on Recent Innovations in Science, Engineering & Technology (NCRISET), Pune, India, 16 Novmber 2014; pp. 61–65. [Google Scholar]
- Reis dos Santos, M.A.; Pamplona, S.V.A.; Augusto Silva, M.F. Analytic Network Process and balanced scorecard applied to the performance evaluation of public health systems. Pesqui. Oper. 2015, 35, 353–361. [Google Scholar] [CrossRef]
- Niemira, M.P.; Saaty, T.L. An Analytic Network Process model for financial-crisis forecasting. Int. J. Forecast. 2004, 20, 573–587. [Google Scholar] [CrossRef]
- Staš, D.; Lenort, R.; Wicher, P.; Holman, D. Green Transport Balanced Scorecard Model with Analytic Network Process Support. Sustainability 2015, 7, 15243–15261. [Google Scholar] [CrossRef]
- Babu, K.D.; Rajulu, P.G.; Reddy, A.R.; Aruna Kumari, A.N. Selection of Architecture Styles using Analytic Network Process for the Optimization of Software Architecture. Int. J. Comput. Sci. Inf. Secur. 2010, 8, 281–288. [Google Scholar]
- Erdoğmus, S.; Aras, H.; Koc, E. Evaluation of alternative fuels for residential heating in Turkey using analytic network process (ANP) with group decision-making. Renew. Sustain. Energy Rev. 2006, 10, 269–279. [Google Scholar] [CrossRef]
- Abdullah, L.; Atiqah Abd Rahman, N. Analytic Network Process for Developing Relative Weight of Wastewater Treatment Technology Selection. Mod. Appl. Sci. 2017, 11, 64–72. [Google Scholar] [CrossRef]
- Reza, V.A.; Sarvari, H.; Yahaya, N.; Md Noor, N.; Safuan, A.; Rashid, A. Analytic Network Process (ANP) to Risk Assessment of Gas Refinery EPC Projects in Iran. J. Appl. Sci. Res. 2013, 9, 1359–1365. [Google Scholar]
- Chen, C.-C.; Shih, H.-S. A Study of the Acceptance of Wearable Technology for Consumers—An Analytical Network Process Perspective. Int. J. Anal. Hierarchy Process 2014, 1, 1–5. [Google Scholar]
- Jayant, A.; Paul, V.; Kumar, U. Application of Analytic Network Process (ANP) in Business Environment: A Comprehensive Literature Review. Int. J. Res. Mech. Eng. Technol. 2015, 5, 29–37. [Google Scholar]
- Kroener, M.U. Multi-level analytic network process model to mitigate supply chain disruptions in disaster recovery planning. Master’s Thesis, Polytechnic State University, San Luis Obispo, CA, USA, 2016. [Google Scholar]
- Thangamani, G. Technology Selection for Product Innovation Using Analytic Network Process (ANP)–A Case Study. Int. J. Innov. Manag. Technol. 2012, 3, 560–565. [Google Scholar]
- Ozdemir, Y.; Basligil, H.; Karaca, M. Aircraft Selection Using Analytic Network Process: A Case for Turkish Airlines. In Proceedings of the World Congress on Engineering 2011, London, UK, 6–8 July 2011. [Google Scholar]
- Hussey, L.K. Analytic Network Process (ANP) for Housing Quality Evaluation: A Case Study in Ghana. Master’s Thesis, University of Western Ontario London, Ontario, ON, Canada, 2014. [Google Scholar]
- Sakthivel, G.; Ilangkumaran, M.; Gaikwad, A. A hybrid multi-criteria decision modeling approach for the best biodiesel blend selection based on ANP-TOPSIS analysis. Ain Shams Eng. J. 2015, 6, 239–256. [Google Scholar] [CrossRef]
- Chen, K.-Y.; Wu, W.-T. Applying analytic network process in logistics service provider selection—A case study of the industry investing in southeast Asia. Int. J. Electron. Bus. Manag. 2011, 9, 24–36. [Google Scholar]
- Saaty, T.L. The Analytic Hierarchy Process; McGraw-Hill: New York, NY, USA, 1980; ISBN 0070543712 9780070543713. [Google Scholar]
- Yazgan, E.; Üstün, A.K. Application of analytic network process: Weighting of selection criteria for civil pilots. J. Aeronaut. Space Technol. 2011, 5, 1–12. [Google Scholar]
- Bana e Costa, C.A.; Vansnick, J.C. A critical analysis of the eigenvalue method used to derive priorities in AHP. Eur. J. Oper. Res. 2008, 187, 1422–1428. [Google Scholar] [CrossRef]
- Calizaya, A.; Meixner, O.; Bengtsson, L.; Berndtsson, R. Multi-criteria Decision Analysis (MCDA) for Integrated Water Resources Management (IWRM) in the Lake Poopo Basin, Bolivia. Water Resour. Manag. 2010, 24, 2267–2289. [Google Scholar] [CrossRef]
- Giurca, I. Alegerea centralelor termice cu ajutorul metodelor multicriteriale (Choosing thermal plants using multicriteria methods). Revista Tehnologiile Energiei producerea, transportul şi distribuţia energiei electrice şi termice 2009, 11, 1–8. (In Romanian) [Google Scholar]
- Giurca, I. Alegerea optimă a radiatoarelor utilizând metodele multicriteriale (Optimal selection of radiators using the multicriteria methods). Revista Tehnologiile energiei producerea, transportul şi distribuţia energiei electrice şi termice 2009, 11, 9–25. (In Romanian) [Google Scholar]
- Giurca, I. Contribuţii privind alimentarea cu energie termică a ansamblurilor de locuinţe, utilizând agenţi termici cu parametrii scăzuţi (Contributions to thermic energy supplies of building assemblies by using thermic agents with low parameters). Ph.D. Thesis, Technical University of Cluj-Napoca, Cluj-Napoca, Romania, 2009. (In Romanian). [Google Scholar]
- Naghiu, G.S.; Giurca, I. Choosing heating units using the utility function. J. Appl. Eng. Sci. 2015, 5, 47–52. [Google Scholar] [CrossRef]
- Giurca, I. Selection of radiators using the method of degree of belonging to the optimal variant. J. Appl. Eng. Sci. 2014, 4, 29–34. [Google Scholar]
- Naghiu, G.S.; Giurca, I.; Aşchilean, I.; Badea, G. Multicriterial analysis on selecting solar radiation concentration ration for photovoltaic panels using Electre-Boldur method. Procedia Technol. 2016, 22, 773–780. [Google Scholar] [CrossRef]
- Giurca, I.; Căldare, I.; Muntea, C.; Năstac, D.C. Choosing Heating Units Using the Electre Function. In Proceedings of the Recent Advances in Circuits, Systems and Automatic Control: 12th WSEAS International Conference (CSECS ’13), Budapest, Hungary, 10–12 December 2013; Schwarz, M., Ed.; WSEAS Press: Athens, Greece, 2013; pp. 316–323. [Google Scholar]
- Naghiu, G.S.; Badea, G.; Aşchilean, I.; Giurca, I. Selecting the right photovoltaic system using the Entropy method. In Proceedings of the 9th International Management Conference “Management and Innovation for Competitive Advantage”, Bucharest, Romania, 5–6 November 2015; Popa, I., Dobrin, C., Ciocoiu, C.N., Eds.; Editura ASE: Bucharest, Romania, 2015; pp. 976–989. [Google Scholar]
- Lahby, M.; Attioui, A.; Sekkaki, A. An Optimized Vertical Handover Approach Based on M-ANP and TOPSIS in Heterogeneous Wireless Networks. In Advances in Ubiquitous Networking 2; Springer: New York, NY, USA, 2017; pp. 15–29. [Google Scholar]
- Dobrea, R. Eficienta modernizării sistemelor tehnico-economice (Efficiency of modernization of technical and economical systems). Ph.D. Thesis, The Bucharest University of Economic Studies, Bucharest, Romania, 2006. (In Romanian). [Google Scholar]
- Winston, W.L. Operations Reseach. Applications and Algorithms, 2rd ed.; Duxbury Press: Pacific Grove, CA, USA, 1994; p. 1400, ISBN 0534230490, 9780534230494. [Google Scholar]
- Ünver, S.B.S. Threat Evaluation in Air Defense Systems Using Analytic Network Process. Master’s Thesis, Institute of Science and Engineering of Galatasaray Uniuniversity, Istanbul, Turkey, July 2015. [Google Scholar]
- Zhang, X.; Gao, L.; Barrett, D.; Chen, Y. Evaluating Water Management Practice for Sustainable Mining. Water 2014, 6, 414–433. [Google Scholar] [CrossRef]
- Gigović, L.; Pamučar, D.; Bajić, Z.; Drobnjak, S. Application of GIS-Interval Rough AHP Methodology for Flood Hazard Mapping in Urban Areas. Water 2017, 9, 360. [Google Scholar] [CrossRef]
- Piantanakulchai, M. Analytic Network Process Model for Highway Corridor Planning. In Proceedings of the ISAHP 2005, Honolulu, HI, USA, 8–10 July 2005. [Google Scholar]
- Huang, J.-J.; Tzeng, G.-H.; Ong, C.-S. Multidimensional data in multidimensional scaling using the analytic network process. Pattern Recognit. Lett. 2005, 26, 755–767. [Google Scholar] [CrossRef]
- Lin, C.-T.; Hung, K.-P.; Hu, S.-H. A Decision-Making Model for Evaluating and Selecting Suppliers for the Sustainable Operation and Development of Enterprises in the Aerospace Industry. Sustainability 2018, 10, 735. [Google Scholar] [CrossRef]
- Poh, K.L.; Liang, Y. Multiple-Criteria Decision Support for a Sustainable Supply Chain: Applications to the Fashion Industry. Informatics 2017, 4, 36. [Google Scholar] [CrossRef]
- Dehdasht, G.; Zin, R.M.; Ferwati, M.S.; Abdullahi, M.M.; Keyvanfar, A.; McCaffer, R. DEMATEL-ANP Risk Assessment in Oil and Gas Construction Projects. Sustainability 2017, 9, 1420. [Google Scholar] [CrossRef]
- Chou, Y.-C.; Yang, C.-H.; Lu, C.-H.; Dang, V.T.; Yang, P.-A. Building Criteria for Evaluating Green Project Management: An Integrated Approach of DEMATEL and ANP. Sustainability 2017, 9, 740. [Google Scholar] [CrossRef]
- Khademia, N.; Mohaymany, A.S.; Shahi, J.; Zerguini, S. An algorithm for the analytic network process (ANP) structure design. J. Multi-Criteria Decis. Anal. 2012, 19, 33–55. [Google Scholar] [CrossRef]
- Peykarjou, K.; Safavi, N.N. Using Analytic Network Process (ANP) in evaluation and prioritization the barriers of credit rating insurance companies in Iran. Eur. Online J. Nat. Soc. Sci. 2015, 4, 219–229. [Google Scholar]
- Abastante, F.; Lami, I.M. Quality Function Deployment (QFD) and Analytic Network Process (ANP): An application to analyze a cohousing intervention. J. Appl. Oper. Res. 2012, 4, 14–27. [Google Scholar]
Figure 1.
Pipeline type distribution [28].
Figure 1.
Pipeline type distribution [28].

Figure 2.
Water loss distribution broken down by pipeline type [28].
Figure 2.
Water loss distribution broken down by pipeline type [28].

Figure 3.
Ranking structure of the network analytical process for selecting the optimal alternative.
Figure 3.
Ranking structure of the network analytical process for selecting the optimal alternative.

Figure 4.
Relationships between the decision-making criteria.

Figure 5.
The questionnaire used for pair comparison between the seven decision-making criteria.

Table 1.
Multi-criteria analysis methods used in the field of water distribution networks.
| No. | Method | References |
|---|---|---|
| 1 | AHP (Analytic Hierarchy Process) | [26,30,34,35,36,37,38] |
| 2 | The hybrid method of AHP and ANN (Artificial Neural Network) | [39] |
| 3 | Copeland | [40] |
| 4 | Electre II | [40,41] |
| 5 | Electre III | [16,30] |
| 6 | Electre TRI | [41,42] |
| 7 | Leader | [28] |
| 8 | PROMETHEE I | [16] |
| 9 | PROMETHEE II | [1,43,44] |
| 10 | PROMETHEE III | [30] |
| 11 | PROMETHEE GDSS (Group Decision Support System) | [45] |
| 12 | TOPSIS | [30] |
| 13 | Multiattribute value model (MAVM) | [46] |
| 14 | WSM (Weighted Sum Model) | [30] |
| 15 | Weighted Utopian Approach | [17] |
| Alternative’s Symbol | Alternative Name | Material of the Pipe to Be Rehabilitated | Material of the Rehabilitated Pipe | The Nominal Diameter of the Pipe (mm) | Distance (m) | Observations |
|---|---|---|---|---|---|---|
| A1 | Compact Pipe | Concrete, asbestos cement, cast iron, steel, PVC | PE | 100 ÷ 500 | 700 | The PE inliner is delivered on site as molded in the form of “C”. It is recommended for crowded urban areas. |
| A2 | Slipline | Concrete, asbestos cement, cast iron, steel, PVC | PE, PVC | 50 ÷ 1000 | long | |
| A3 | Subline | Concrete, asbestos cement, cast iron, steel, PVC | PE 80 or PE 100 with SDR 26 or SDR 80 | 75 ÷ 1600 | long | The PE inliner is delivered on site as molded in the form of “U”. |
| A4 | Swagelining | Concrete, asbestos cement, cast iron, steel, PVC | PE, PVC | 65 ÷ 1000 | 1000 | |
| A5 | Pilot Pipe | Concrete, asbestos cement, cast iron, steel, PVC | Steel, PE or other materials with high tensile strength | 80 ÷ 1600 | 60 ÷ 80 m trenchless term |
Table 3.
Values of the average stochastic coefficient depending on the rank of the matrix [94,95,96,97].
| (Order of Matrix) | 1 | 2 | 3 | 4 | 5 | 6 | 7 | 8 | 9 | 10 | 11 | 12 | 13 | 14 | 15 |
| R | 0 | 0 | 0.58 | 0.9 | 1.12 | 1.24 | 1.32 | 1.41 | 1.45 | 1.49 | 1.51 | 1.48 | 1.56 | 1.57 | 1.59 |
| Criterion | Name of Criteria | Type | Description |
|---|---|---|---|
| C1 | Diameter of the pipe | maximized | It is advisable to select that alternative that can be used for the entire range of pipes used in water distribution networks. |
| C2 | Length of the pipe | maximized | It is advisable to select that alternative that can be used for the longest possible pipelines. |
| C3 | Period of time required for installation | minimized | It is preferable the installation to be as quick as possible. |
| C4 | Lifespan | maximized | The lifespan of the rehabilitated pipe must be higher than the lifespan of the replaced pipe. |
| C5 | Pressure losses | minimized | The pressure losses should be as low as possible. |
| C6 | Price | minimized | The price for replacing the pipes should be as low as possible. |
| C7 | Installation conditions | minimized | The alternative should not set special installation conditions. |
Table 5.
Interaction between the elements of the decision-making process.
| Cluster | 1. Goal | 2. Criteria | 3. Alternatives | |||||||||||
| C1 | C2 | C3 | C4 | C5 | C6 | C7 | A1 | A2 | A3 | A4 | A5 | |||
| 1. Goal | ||||||||||||||
| 2. Criteria | C1 | x | ||||||||||||
| C2 | x | x | ||||||||||||
| C3 | x | x | x | |||||||||||
| C4 | x | |||||||||||||
| C5 | x | x | ||||||||||||
| C6 | x | x | x | |||||||||||
| C7 | x | x | ||||||||||||
| 3. Alternatives | A1 | x | x | x | x | x | x | x | ||||||
| A2 | x | x | x | x | x | x | x | |||||||
| A3 | x | x | x | x | x | x | x | |||||||
| A4 | x | x | x | x | x | x | x | |||||||
| A5 | x | x | x | x | x | x | x | |||||||
Remark: The symbol x represents the interaction between the elements of the decision-making process.
Table 6.
Matrix of pair comparison between the criteria in relation with the goal.
| Criteria Code | C1 | C2 | C3 | C4 | C5 | C6 | C7 |
|---|---|---|---|---|---|---|---|
| C1 | 1.00 | 1/2 | 1.00 | 1/2 | 1/3 | 1/3 | 1/2 |
| C2 | 2.00 | 1.00 | 2.00 | 1.00 | 1/2 | 1/2 | 1.00 |
| C3 | 1.00 | 1/2 | 1.00 | 1/2 | 1/3 | 1/3 | 1/2 |
| C4 | 2.00 | 1.00 | 2.00 | 1.00 | 1/2 | 1/2 | 1.00 |
| C5 | 3.00 | 2.00 | 3.00 | 2.00 | 1.00 | 1.00 | 2.00 |
| C6 | 3.00 | 2.00 | 3.00 | 2.00 | 1.00 | 1.00 | 2.00 |
| C7 | 2.00 | 1.00 | 2.00 | 1.00 | 0.50 | 0.50 | 1.00 |
Table 7.
Supermatrix form for this case study (W Value).
| Cluster | 1. Goal | 2. Criteria | 3. Alternatives |
|---|---|---|---|
| 1. Goal | 0 | 0 | 0 |
| 2. Criteria | W21 | W22 | W23 |
| 3. Alternatives | 0 | W32 | 0 |
Table 8.
Alternative rankings.
| Alternative Name | Global Priority | Place |
|---|---|---|
| A1 Compact Pipe | 0.1804 | 3 |
| A2 Slipline | 0.1813 | 2 |
| A3 Subline | 0.3664 | 1 |
| A4 Swagelining | 0.1691 | 4 |
| A5 Pilot Pipe | 0.1028 | 5 |
© 2018 by the authors. Licensee MDPI, Basel, Switzerland. This article is an open access article distributed under the terms and conditions of the Creative Commons Attribution (CC BY) license (http://creativecommons.org/licenses/by/4.0/).
Share and Cite
MDPI and ACS Style
Așchilean, I.; Giurca, I. Choosing a Water Distribution Pipe Rehabilitation Solution Using the Analytical Network Process Method. Water 2018, 10, 484. https://doi.org/10.3390/w10040484
AMA Style
Așchilean I, Giurca I. Choosing a Water Distribution Pipe Rehabilitation Solution Using the Analytical Network Process Method. Water. 2018; 10(4):484. https://doi.org/10.3390/w10040484
Chicago/Turabian StyleAșchilean, Ioan, and Ioan Giurca. 2018. "Choosing a Water Distribution Pipe Rehabilitation Solution Using the Analytical Network Process Method" Water 10, no. 4: 484. https://doi.org/10.3390/w10040484
Note that from the first issue of 2016, this journal uses article numbers instead of page numbers. See further details here.