Effect of Variations in Long-Duration Rainfall Intensity on Unsaturated Slope Stability


Department of Resources of Engineering, National Cheng Kung University, Tainan 701, Taiwan
*
Author to whom correspondence should be addressed.
Water 2018, 10(4), 479; https://doi.org/10.3390/w10040479
Submission received: 3 March 2018
/
Revised: 9 April 2018
/
Accepted: 11 April 2018
/
Published: 13 April 2018
(This article belongs to the Special Issue Landslide Hydrology)
Abstract
:In recent years, many scientific methods have been used to prove that the Earth’s climate is changing. Climate change can affect rainfall patterns, which can in turn affect slope safety. Therefore, this study analyzed the effects of climate change on rainfall patterns from the perspective of rainfall intensity. This analysis was combined with numerical model analysis to examine the rainfall patterns of the Zengwen reservoir catchment area and its effects on slope stability. In this study, the Mann–Kendall test and the Theil–Sen estimator were used to analyze the rainfall records of rainfall stations at Da-Dong-Shan, Ma-To-Shan, and San-Jiao-Nan-Shan. The rainfall intensity of the Zengwen reservoir catchment area showed an increasing trend from 1990–2016. In addition, the analysis results of rainfall intensity trends were used for qualitative analysis of seepage and slope stability. The trend analysis result showed that in the future, from 2017–2100, if the amount of rainfall per hour continues to rise at about 0.1 mm per year, the amount of seepage will increase at the slope surface boundary and significantly change pore water pressure in the soil. As a result, the time of the occurrence of slope instability after the start of rainfall will decrease from 20 to 13 h, and the reduction in the safety coefficient will increase from 32 to 41%. Therefore, to decrease the effects of slope disasters on the safety of the Zengwen reservoir and its surrounding areas, changes in rainfall intensity trends should be considered for slope safety in this region. However, the results of trend analyses were weak and future research is needed using a wider range of precipitation data and detailed hydrological analysis to better predict rainfall pattern variations.
1. Introduction
In recent years, attention has gradually shifted from global warming to climate change as a topic of concern. The effects of climate change on slope safety are such that changes in rainfall patterns affect rainwater seepage behavior and cause changes in slope water content [1,2]. An increase in the water content of slope soil generally leads to decreases in the effective stress and shear strength of the soil, which results in slope vulnerability to landslides, rockfalls, and mudflows [3,4,5]. Therefore, understanding the effects of climate change on future rainfall patterns will aid in preventing slope disasters that threaten the lives of people and property. Strauch et al. [6] investigated climatic changes in Hawaii and showed that changes in tropical patterns caused an increase in rainfall intensity, decrease in rainfall frequency, and extreme changes in rainfall patterns in that region. Loo et al. [7] predicted that Southeast Asia will be affected by global warming in the future, with a 15 day delay in the rainy season and a 70% decrease in the amount of monsoon rainfall in Indonesia. However, owing to the effects of terrain in some areas, an increase in rainfall intensity was also predicted. Their study indicates that the future climate will gradually become more extreme, with intense flooding or severe droughts occurring at different times and locations. Kristo et al. [8] employed statistical methods to analyze rainfall intensity trends and found that rainfall intensity in Singapore showed an increasing trend. Therefore, it is crucial to prevent the damages from flooding and slope failure caused by rain.
To examine the effects of rainfall patterns on slope safety, we need to understand the mechanisms by which rainfall causes landslides. When rainfall occurs on slopes, the hydraulic properties of soil and rainfall patterns control rainfall infiltration behavior. The saturated hydraulic conductivity of soil limits the rainfall infiltration rate, and rainfall intensity and duration control the rainfall amount that can infiltrate into the soil [9]. The rain that infiltrates into the soil increases the water content of the soil and the water pressure of the pores. When the pore water pressure of soil increases, its effective stress decreases, resulting in a decrease in the shear strength of the soil and a decrease in slope stability [10,11,12]. Therefore, rainfall seepage is considered to be a factor that causes slope damage. In addition, rainfall patterns affect infiltration behavior, and the effects of different rainfall patterns on slope hydrological status also vary [13,14]. Many recent studies have examined the complex relationship between rainfall patterns and slope safety [15,16,17,18]. In Italy, slopes are stable and safe during the warm and dry season. During the wet and cold season, however, the incidence of slope disasters increases, owing to increases in the rainfall amount and rainfall intensity, both of which show a direct relationship to slope instability [19,20,21,22]. Moreover, slope stability analysis is used to predict future trends in slope stability in Singapore, in response to an increasing trend in rainfall intensity. If Singapore experiences heavy rainfall during the next 50 years, slope instability is expected to increase [8]. Further, Lin et al. [23] reported that the average temperature in Taiwan in 2100 will be higher than that in 2000 by 2–3 °C, and the average monsoon rainfall will increase by 2–26%. Therefore, a careful evaluation of climate change and slope safety in Taiwan should be conducted.
Mountains account for 75% of the area in Taiwan. Although this region experiences abundant rainfall, it is difficult to continuously store water, owing to rapidly flowing rivers on slopes. Therefore, reservoirs, dams, river weirs, and other water conservancy facilities are important for storing water. Because slope failures and landslides cause accumulation of large amounts of gravel in the reservoirs and decrease their effective storage capacity, evaluation of the slope failure potential at reservoir catchment areas has become an important issue. Taiwan’s first large reservoir, the Zengwen reservoir, is vulnerable to slope failure. In 2009, this dam was severely damaged by Typhoon Morakot, which brought about 3000 mm of cumulative rainfall to the catchment area in five days. This high rainfall intensity caused large-scale collapses at the slopes around the catchment area of the Zengwen reservoir and resulted in 91.08 million m3 of gravel deposition in the reservoir. This increase in gravel load far exceeded the 5.61 million m3 of gravel of the original design. Therefore, the present study used statistical methods to analyze the variation trends in rainfall intensity in the Zengwen reservoir catchment area to understand the effects of climate change on rainfall intensity in this area. This research was combined with slope stability analysis to investigate the changes in slope stability under the influence of climate change.
2. Study Area
Located at the boundary between Tainan City and Chiayi County, the Zengwen reservoir catchment area belongs to the upper and middle reaches of the Zengwen watershed in Taiwan. The area of catchment and the reservoir are 481 km2 and 7.1 km2, respectively, which make this Taiwan’s largest reservoir (Figure 1). The Zengwen reservoir catchment area is located in the Western Foothills geological area. The strata in this region are mainly from the Miocene epoch of the Tertiary Period to the Pleistocene epoch of the Quaternary Period and consist mostly of gray fine sandstone and shale. Due to the high mud content in the formation, and the relatively young geological age and poor consolidation, it is easily affected by weathering. As a result, the river terrace on both sides of the stream is well developed and there are many rainfall-triggered collapses that have occurred in this area. The terrain in this region decreases in altitude from the northeast to the southwest, with elevations ranging from 100 m to 2600 m. The geographical location of the Nan-Laio-Yeh-Hsi slope is between the Da-Dong-Shan and Ma-To-Shan rainfall stations. The overburden of the slope is composed of sand, and the bedrock is sandstone.
3. Materials and Methods
3.1. Mann–Kendall Test
The Mann–Kendall test [24,25] is a type of non-parametric test in which the relationships between continuous data are compared to determine changes in trends in a data series. The ability to handle outliers and missing values is an advantage of this method; therefore, it is often employed for the statistical analysis of hydrological data [26,27,28]. This method is described below.
Assume that the corresponding time-series of the data series x1, x2, x3, …, xn is t1, t2, t3, …, tn; then, the test statistic of the Mann–Kendall test S is defined as:
When the number of data samples is sufficient (n ≥ 10), S will approach a normal distribution, and its mean value will be 0. Its variation will be:
In the Mann–Kendall test, the null hypothesis H0 and the alternative hypothesis H1 are set up to assume that the time-series data does not and does show significant trends, respectively. The Z value is used to determine whether to reject H0 and accept H1 and is defined as:
When |Z| > Z(α/2), we accept the alternative hypothesis H1 and reject the null hypothesis H0, which means that the time-series data shows significant trends. A positive S value indicates an increasing trend and vice versa. α is the significance level, and different significance levels correspond to different Z(α/2) means and statistically different thresholds for identifying significant trends. This study set α = 0.05 as the significance level for trend determination, so that Z(α/2) = 1.96. Therefore, when |Z| > Z(α/2), the time-series data shows significant increasing or decreasing trends.
3.2. Theil–Sen Estimator
This study used the Theil–Sen estimator to calculate the slope of rainfall intensity linear trends. The Theil–Sen estimator is a method, proposed by Sen in 1968 [29], for calculating the actual slope of time-series data trends. His research showed that when one time-series dataset shows a linear trend, the median of the slope can be obtained by calculating the slopes of various data points and this value can be used as the slope for the trend, as shown in Equation (4). This method is not limited to whether the data is normally distributed and is not easily affected by outliers, such as with linear regression methods, that result in overestimation or underestimation of the trend slope value:
where β is the slope between the two points xj and xk in the time-series and correspond to the time-points j and k (j > k).
After obtaining the trend slope by using the Theil–Sen estimator, the linear trend can be expressed by:
where It represents the data, the value of which was estimated from the trends equation and represents rainfall intensity in this study; t represents time; and b is the intercept. Therefore, the linear trends formula can be used to predict future changes in rainfall intensity.
3.3. Rainfall Data
The rainfall data used in this study were obtained from the database of the Water Resources Agency of the Ministry of Economic Affairs in Taiwan. The 1990–2016 data from the rainfall stations of Da-Dong-Shan, Ma-To-Shan, and San-Jiao-Nan-Shan were used for statistical analysis because these records are complete and the stations are in close proximity to the Zengwen reservoir catchment area. Figure 1 shows the distribution of the rainfall stations. In addition, the model construction in the present study was based on the Nan-Laio-Yeh-Hsi slope survey results at the Zengwen reservoir catchment area reported by Lee [30].
3.4. Seepage Analysis and Qualitative Analysis of Slope Stability
Coupled analyses were conducted to estimate the performance of the slope at rainfall intensity changes. At first, this study used the SEEP/W module from the GeoStudio numerical analysis software (Company of GEO-SLOPE, Calgary, AB, Canada) [31] to conduct seepage analysis of two-dimensional homogenous slopes, examining the effects of changes in rainfall intensity on the water content in unsaturated slope layers. SEEP/W employs Richard’s equation [32] to analyze the transfer behavior of elements in two-dimensional soils:
where H is the hydraulic head (L); and are the hydraulic conductivity coefficients in the x and y directions (L T−1), respectively; Q is the boundary flux (L3 T−1); is the volumetric water content (-); and t is time (T). “L“, “T“, “M“ are the physical dimension of length, time, and mass, respectively. Also, “-“ means dimensionless. This equation describes the summation of changes in the flow rate and boundary flux in unit soil elements in the x-y two-dimensional plane, which is equivalent to changes in the volumetric water content in soil elements per unit time.
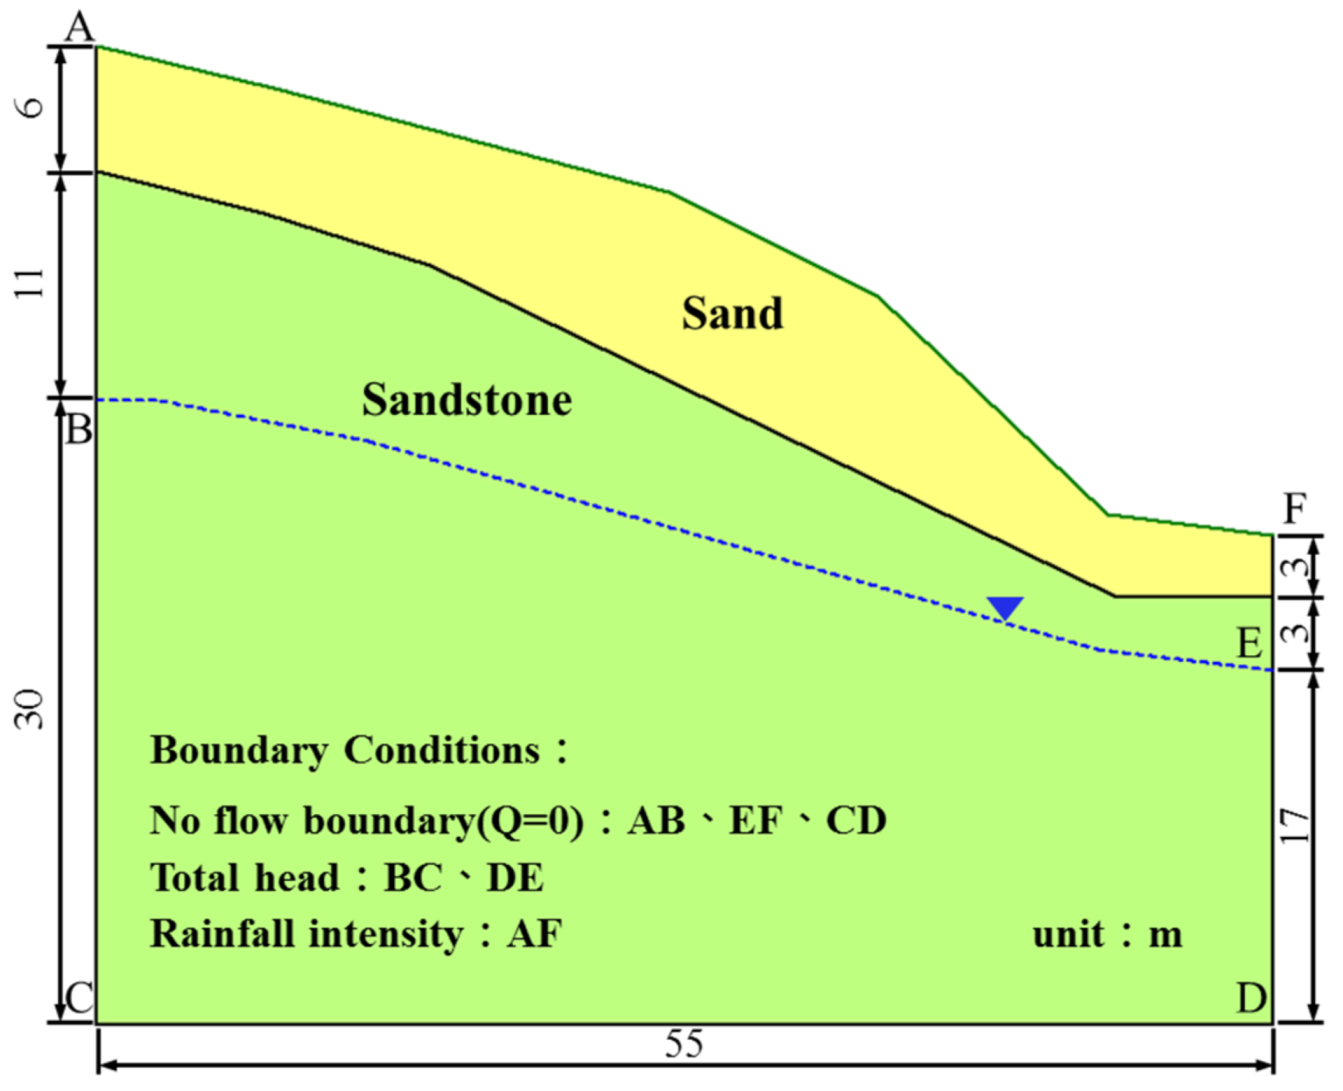
This study used the profile of the Nan-Laio-Yeh-Hsi slope in the Zengwen reservoir catchment area [30] for construction of the slope model (Figure 2). The boundary of the slope surface (A–F boundary) was set as the rainfall infiltration boundary, and the sides of the slope (B–C and D–E boundaries) were set as the boundaries of the fixed water level to maintain the depth of the original groundwater level in the slope. A–B, C–D, and E–F are the boundaries of zero-flow; the inflows and outflows at these three boundaries control seepage not occurring underground. The Nan-Laio-Yeh-Hsi slope consists of jointed sandstone with an overburden of a 3 to 9 m thick layer of sand (Figure 2). Sand can have very different properties in nature. With regard to the present study, grain structure, density, hydraulic conductivity, and shear strength are of particular importance. For practical reasons, these parameters were determined by means of tests in situ or on undisturbed soil samples.
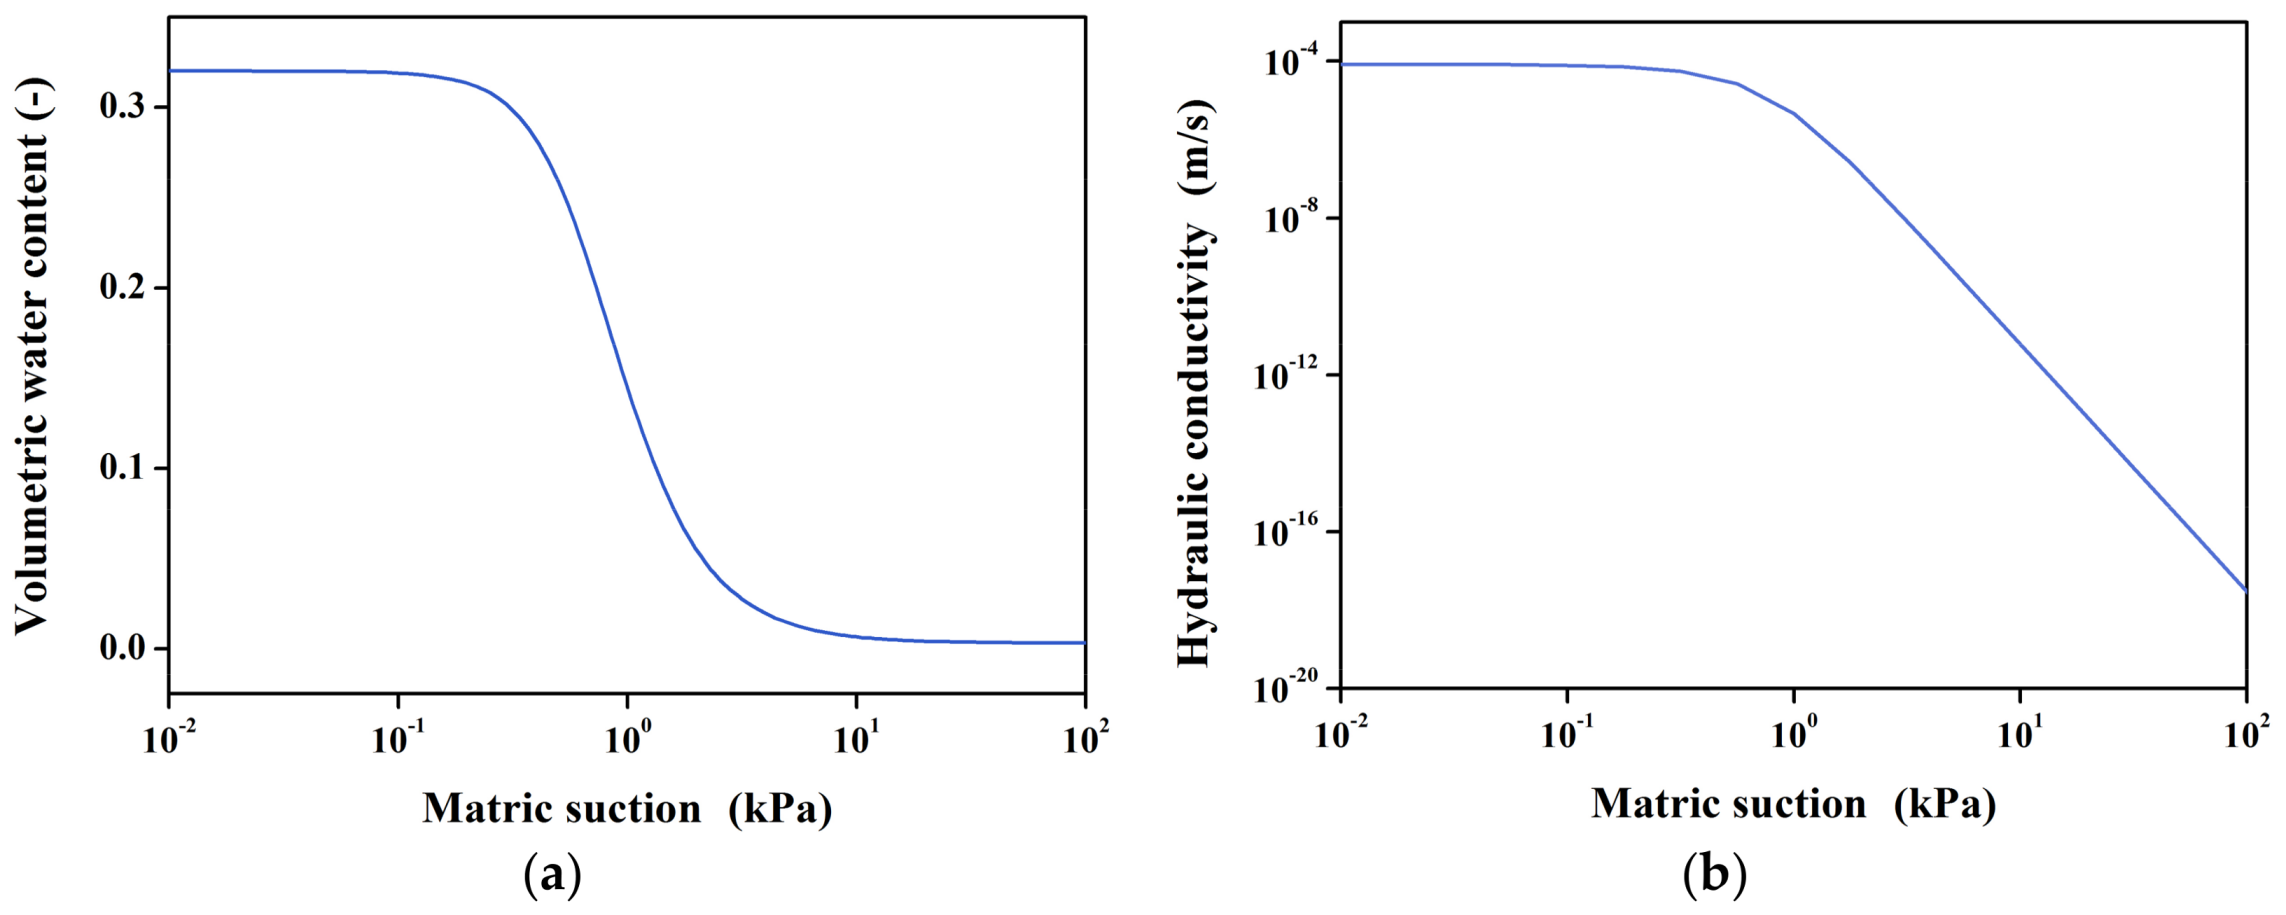
Our study referenced the study of Carsel and Parrish [33] to set the hydraulic parameters for sand (Table 1) and the empirical formula developed by van Genuchten [34] to estimate the soil-water retention curve (SWRC) and hydraulic conductivity coefficient function. The hydraulic parameters for sandstone are referenced from the results of a geological survey from the Central Geological Survey [35]. The formula for this is given as:
where is the residual water content (-); is the saturated water content (-); is the negative pore water pressure (ML−1 T−2); a, n, and m are fitting parameters including the soil air-entry value, the gradient of the soil water retention curve, and the gradient of the curve at which time the soil enters the residual water content state, respectively; and is the saturated hydraulic conductivity coefficient (L T−1). From this equation, we can obtain the corresponding pore water pressure and soil water permeability of sand under different water content conditions (Figure 3).
After conducting seepage analysis, the SEEP/W analysis results could be input into the submodule SLOPE/W in GeoStudio for slope stability analysis [36]. The extent Mohr–Coulomb criterion was proposed to describe the effect of pore water pressure on soil shear strength [37]. The equation for unsaturated shear strength is as follows:
where is the shear strength of unsaturated soil; is the total normal stress; is the pore air pressure; is the pore water pressure; represents the net normal stress; represents the matric suction; c′ represents the effective cohesion; represents the angle of shearing resistance; and is the rate if change in shear strength due to matric suction change.
The slice method was used in this submodule for dividing the damaged surfaces to analyze the stress status of each slice. Finally, the theory of limit equilibrium was used to calculate the safety coefficient of the damaged surface:
where Sr represents the summation of shear strength of the slices, and Sm represents the shear stress experienced by the damaged surface.
This study used the Morgenstern and Price analysis method [38] in SLOPE/W to calculate the safety coefficient of the damaged surface. The advantages of this method are that it considers the stress factors of various slices and can calculate the safety coefficients for torque and horizontal force equilibria. Table 2 shows the compiled mechanical characteristic parameters of sand and sandstone [30], where represents the dry unit weight of soil or stone, and represents the unit weight of soil or stone at saturation.
4. Results and Discussion
4.1. Trends in Rainfall Intensity
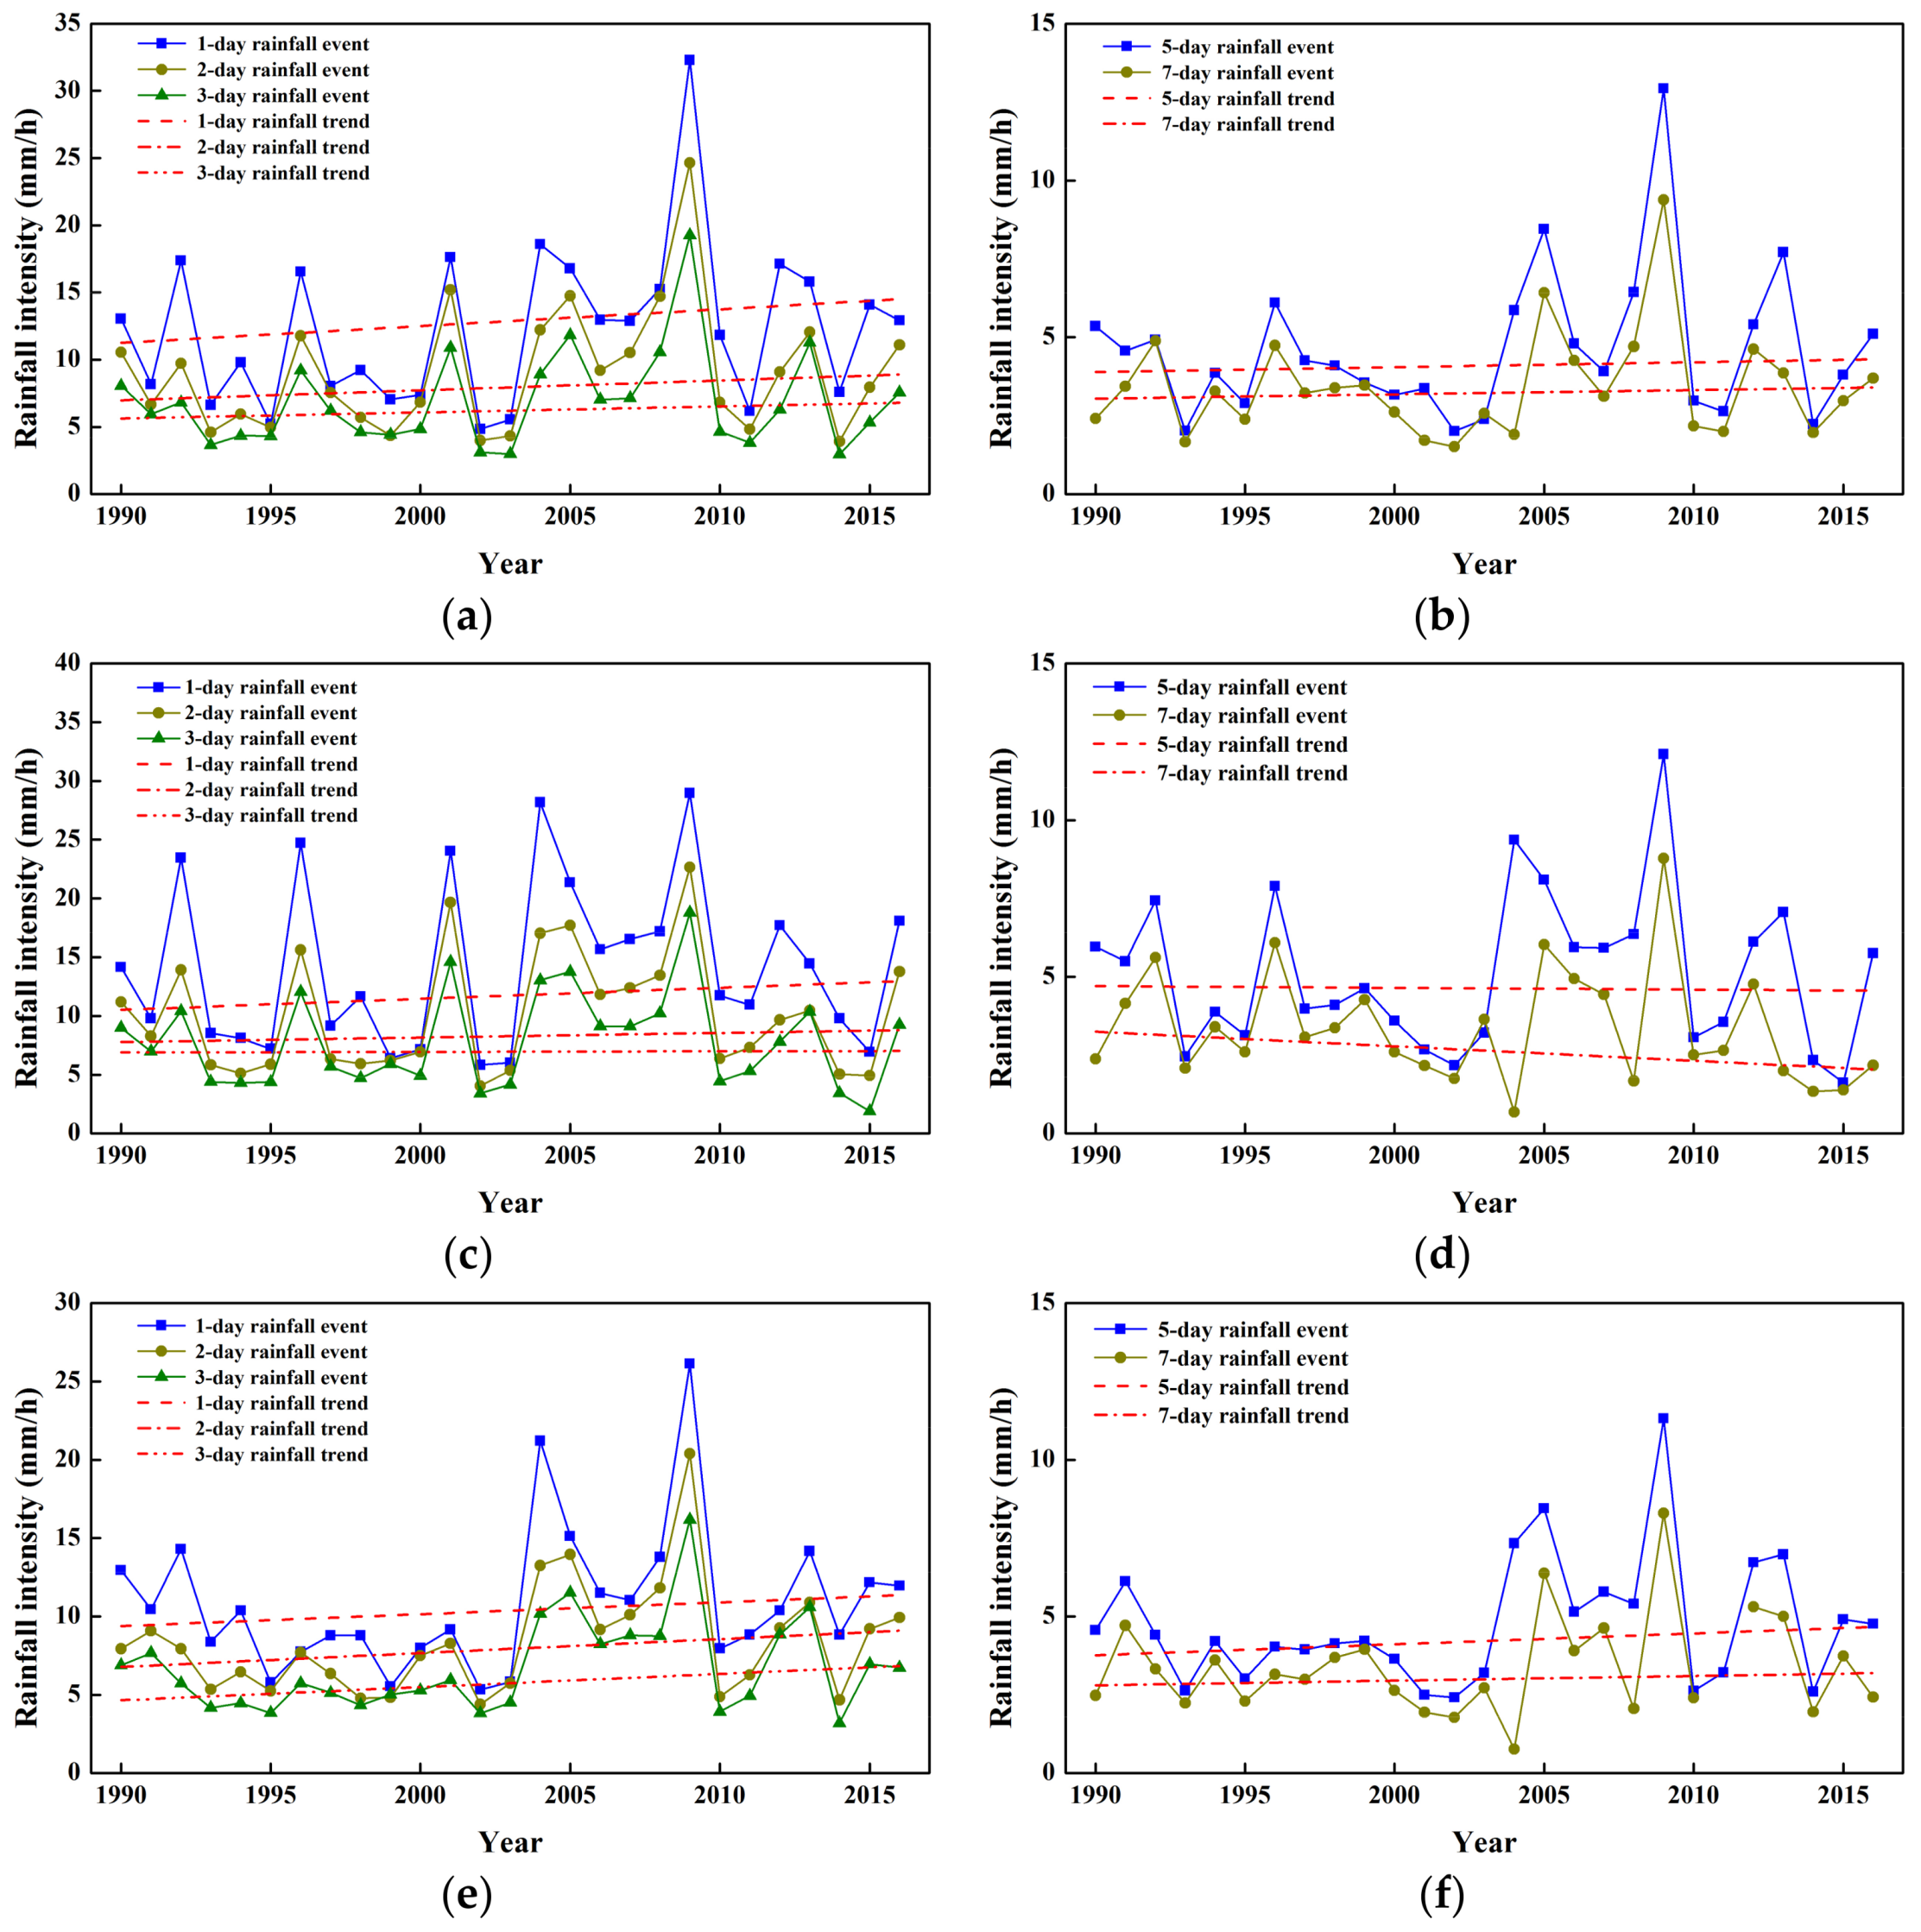
This study collected daily rainfall data (1990–2016) from the Water Resources Agency of the Ministry of Economic Affairs [39] and used the Mann–Kendall test and Theil–Sen estimator to estimate rainfall intensity trends in the Zengwen reservoir catchment area. For each rainfall duration, the maximum rainfall event per year was converted into rainfall intensity to facilitate comparison of the effects of rainfall duration on rainfall intensity at different time scales, as shown in Figure 4.
The results of the study revealed that the rainfall data of Da-Dong-Shan, Ma-To-Shan, and San-Jiao-Nan-Shan all showed increasing trends in almost all rainfall events. Table 3 shows the result of trend and slope analysis, including the Z value from Mann-Kendall test and the trend’s slope from the Theil–Sen estimator. Among these events, the increasing trend in rainfall intensity for one, two, and three days of rain was the most significant (Figure 4); however, these levels did not reach the significance threshold of α = 0.1 (Z(α/2) = 1.645) (Table 3). This result was compared with Jung et al. [40]. Their study reported that rainfall patterns showed a phenomenon of decreased rainfall duration and increased rainfall intensity in the Zengwen watershed from 1966 to 2007. This showed an increasing trend in extreme rainfall events and their intensity in this region. The Theil–Sen estimator results in this study revealed that the slope of rainfall intensity also showed an increasing trend from 1990 to 2016, and the trend slope of the one-day rainfall events at all three rainfall stations was the largest, with an average slope of 0.1 mm/h per year (Figure 4).
To investigate the effects of rainfall trends on slope safety, this study selected the linear trend of one-day rainfall events, which had the most significant increasing trend, to estimate the maximum rainfall intensity of one-day rainfall events in the future (2050–2100). The results were combined with the one-day maximum rainfall intensity in 2016 as rainfall conditions for qualitative analysis of slope stability (Table 4) to conduct slope seepage and stability analyses.
4.2. Seepage Analysis
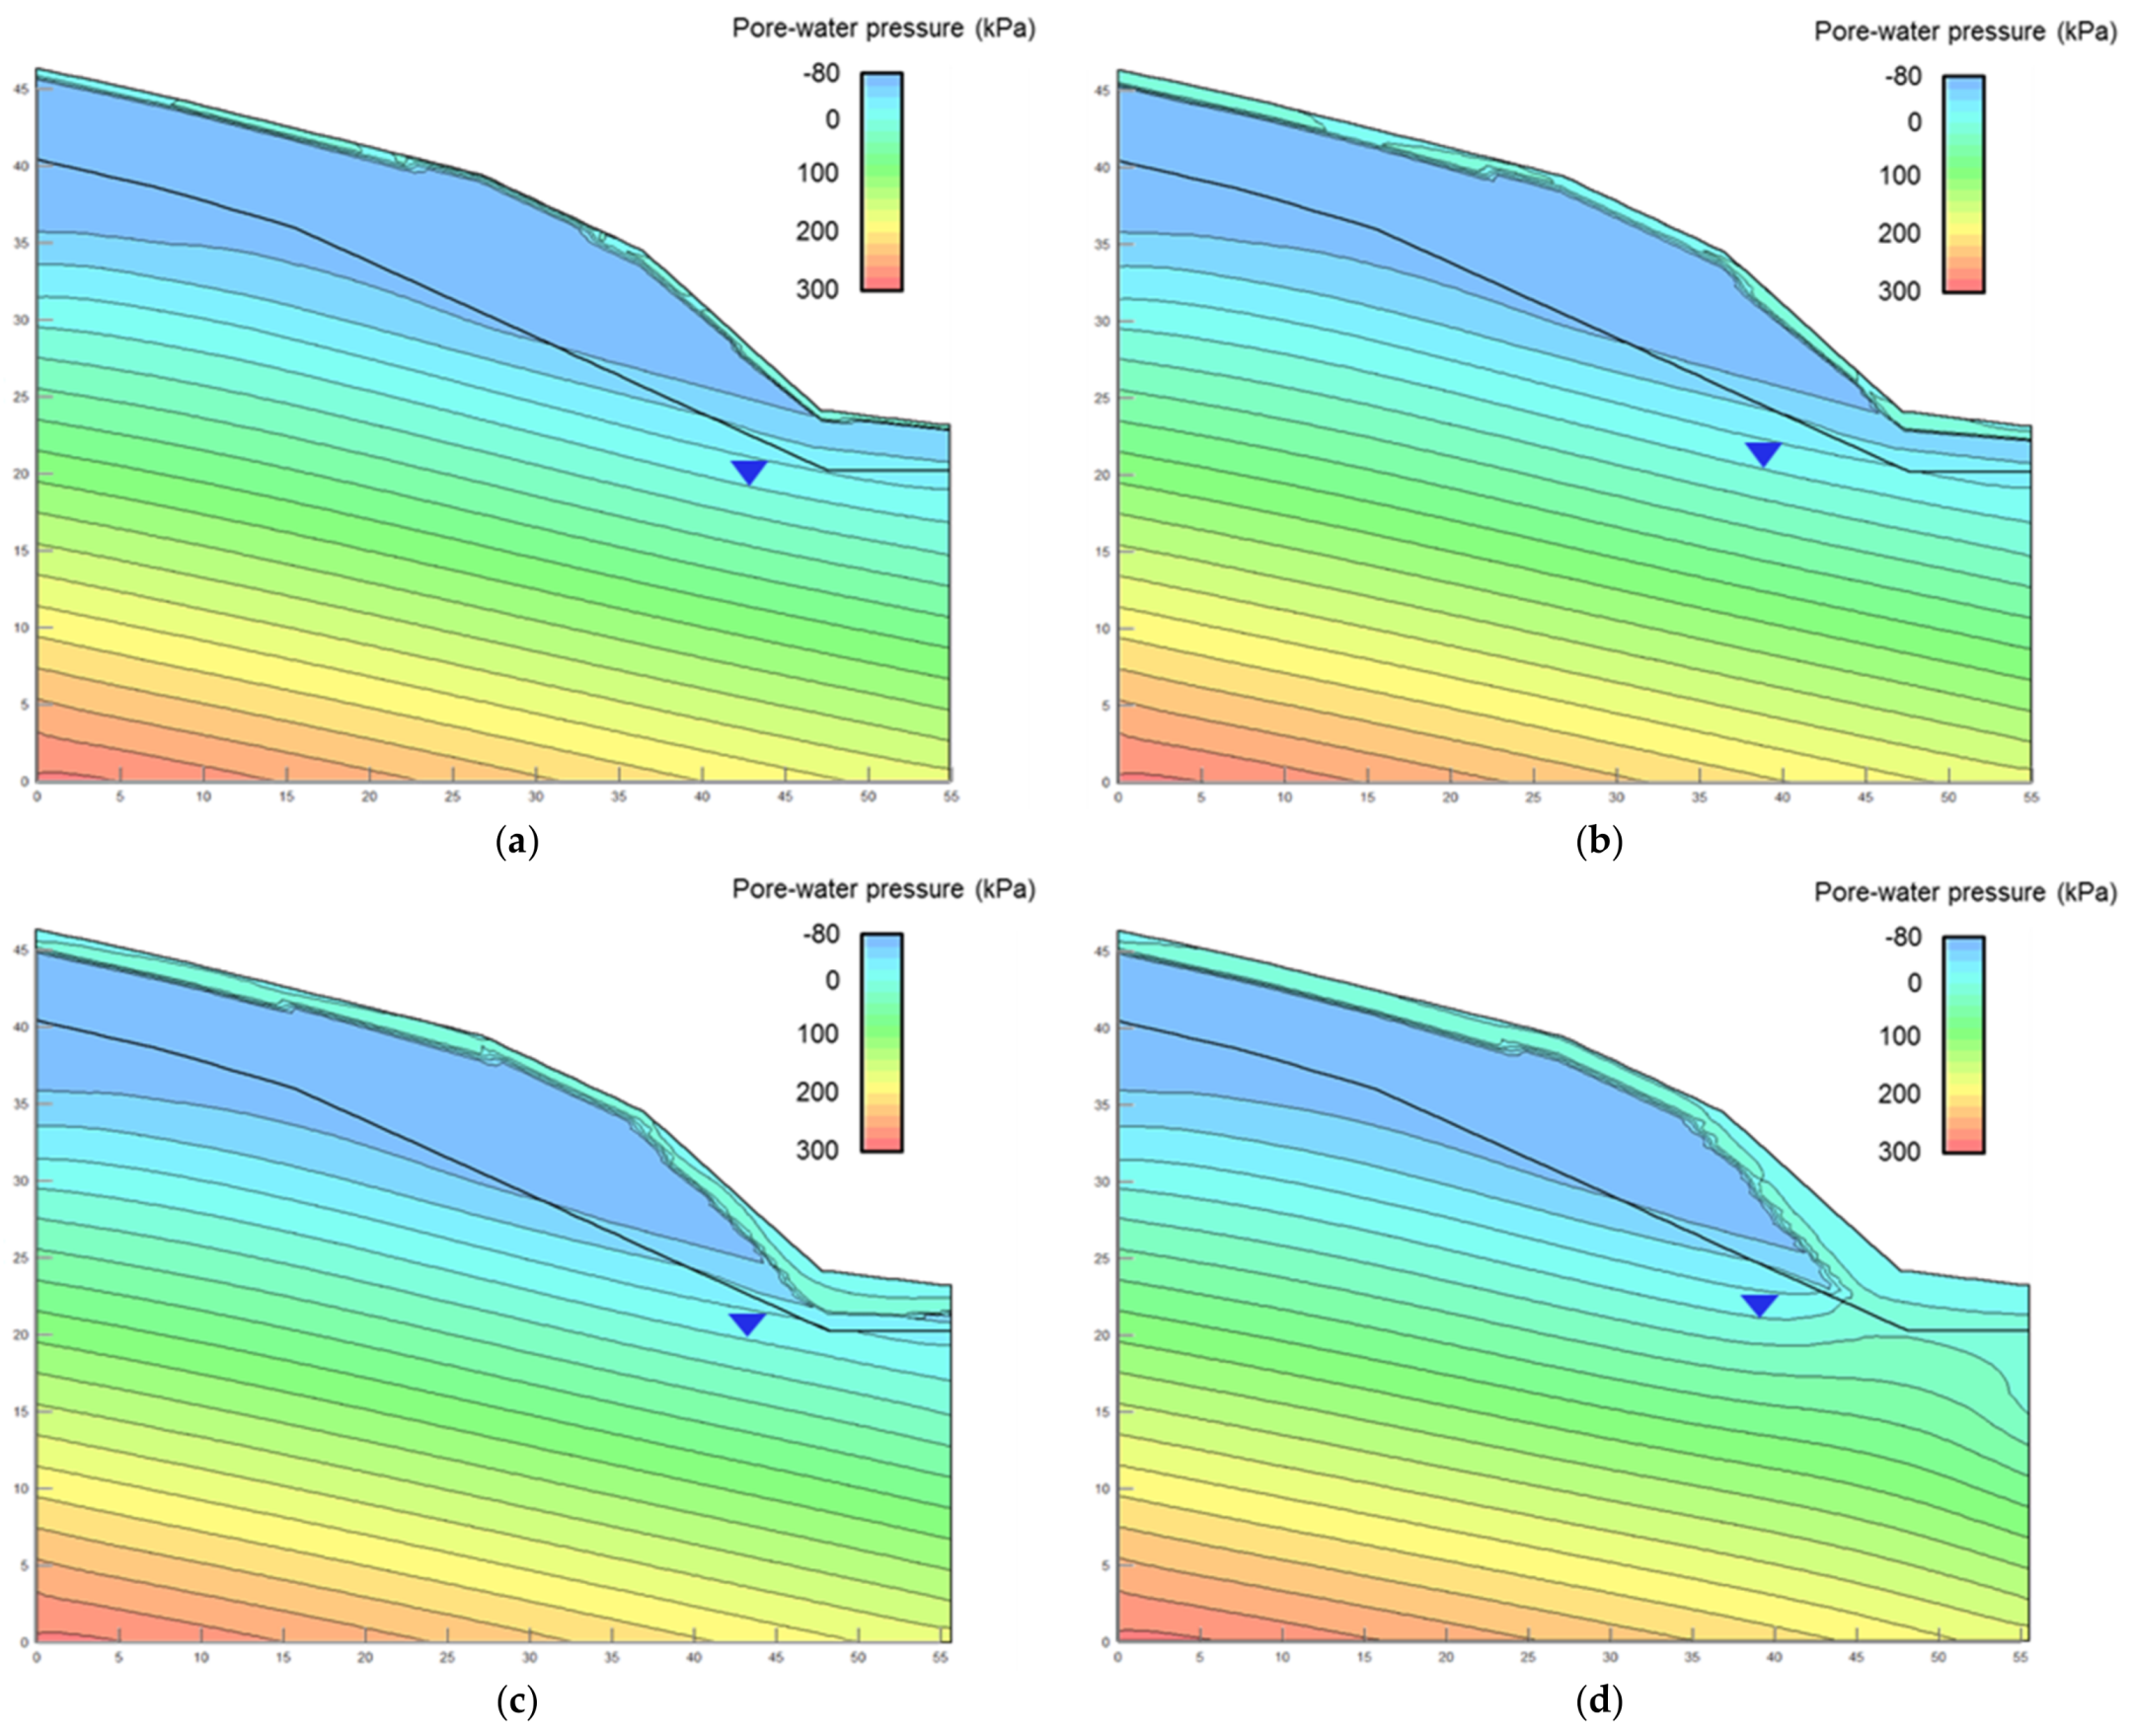
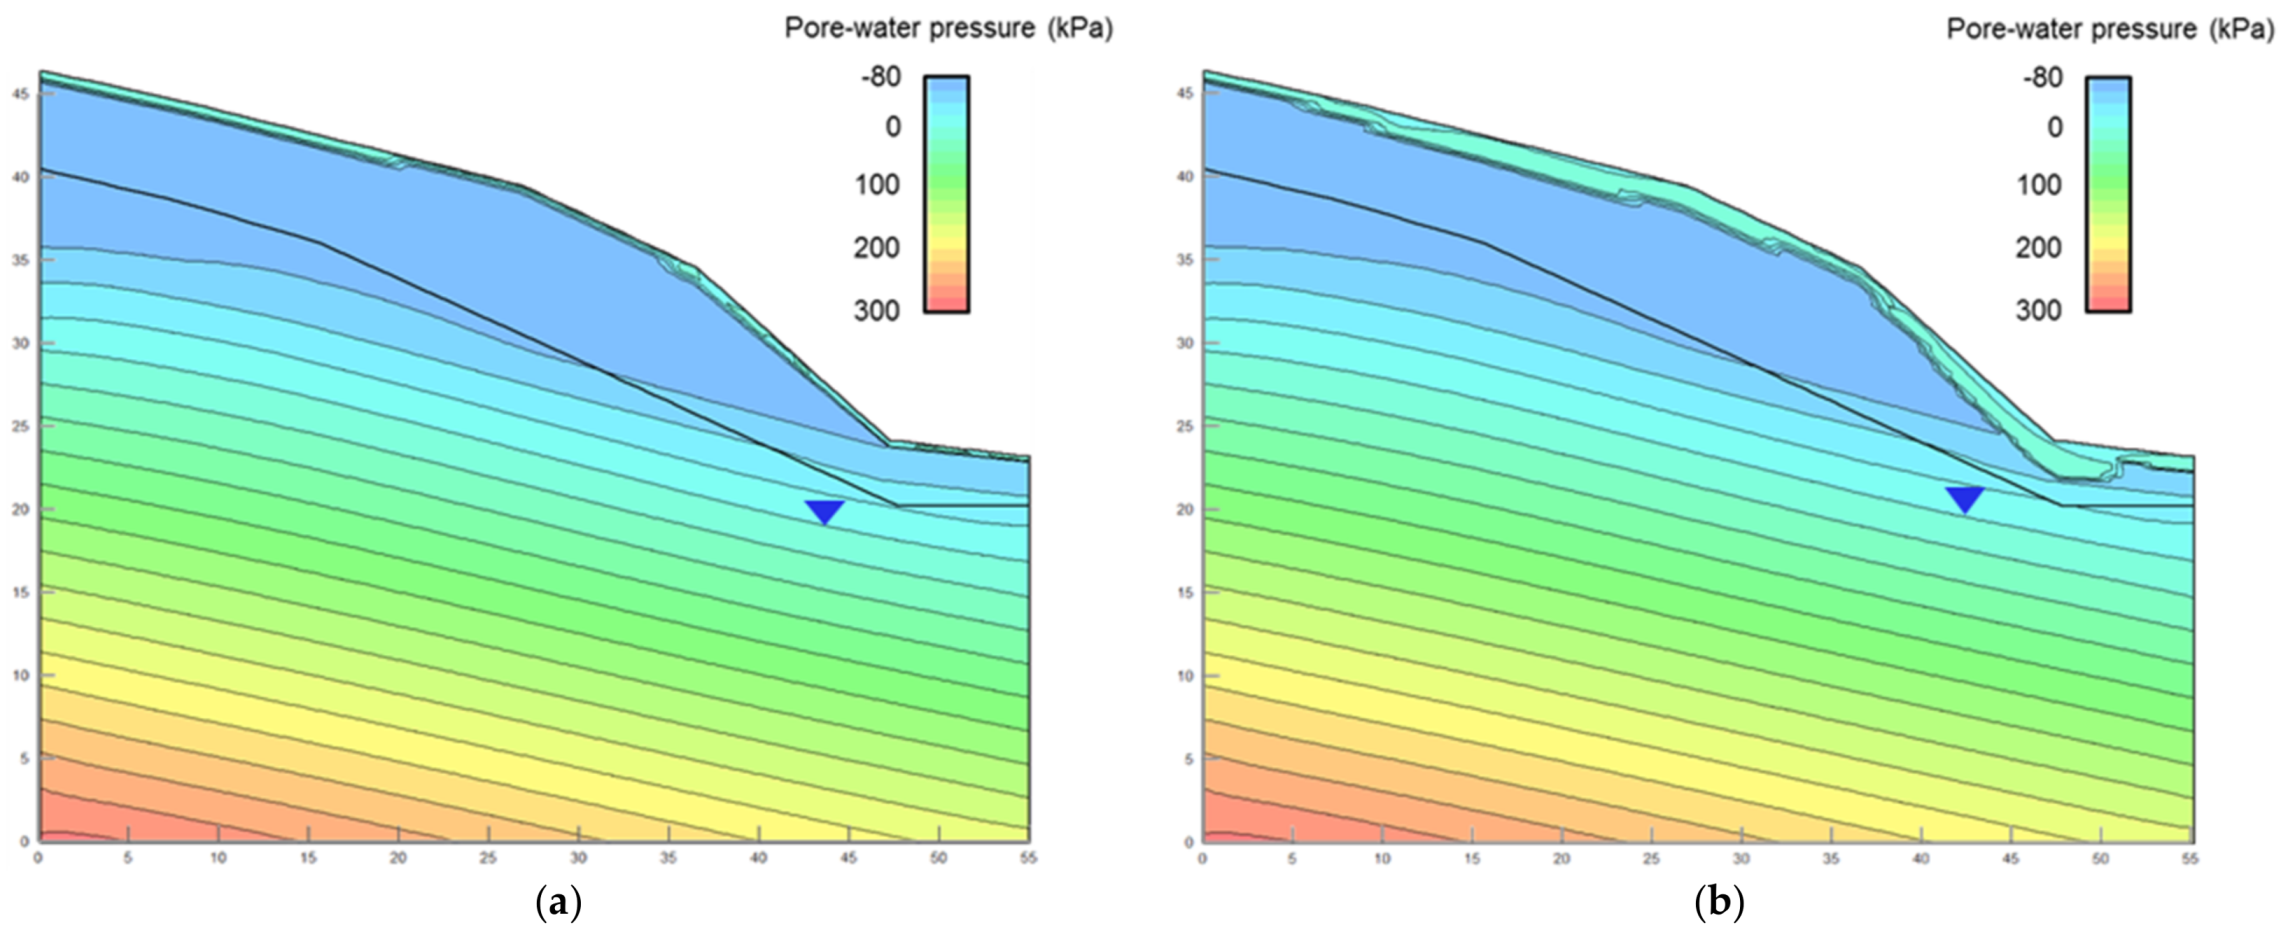
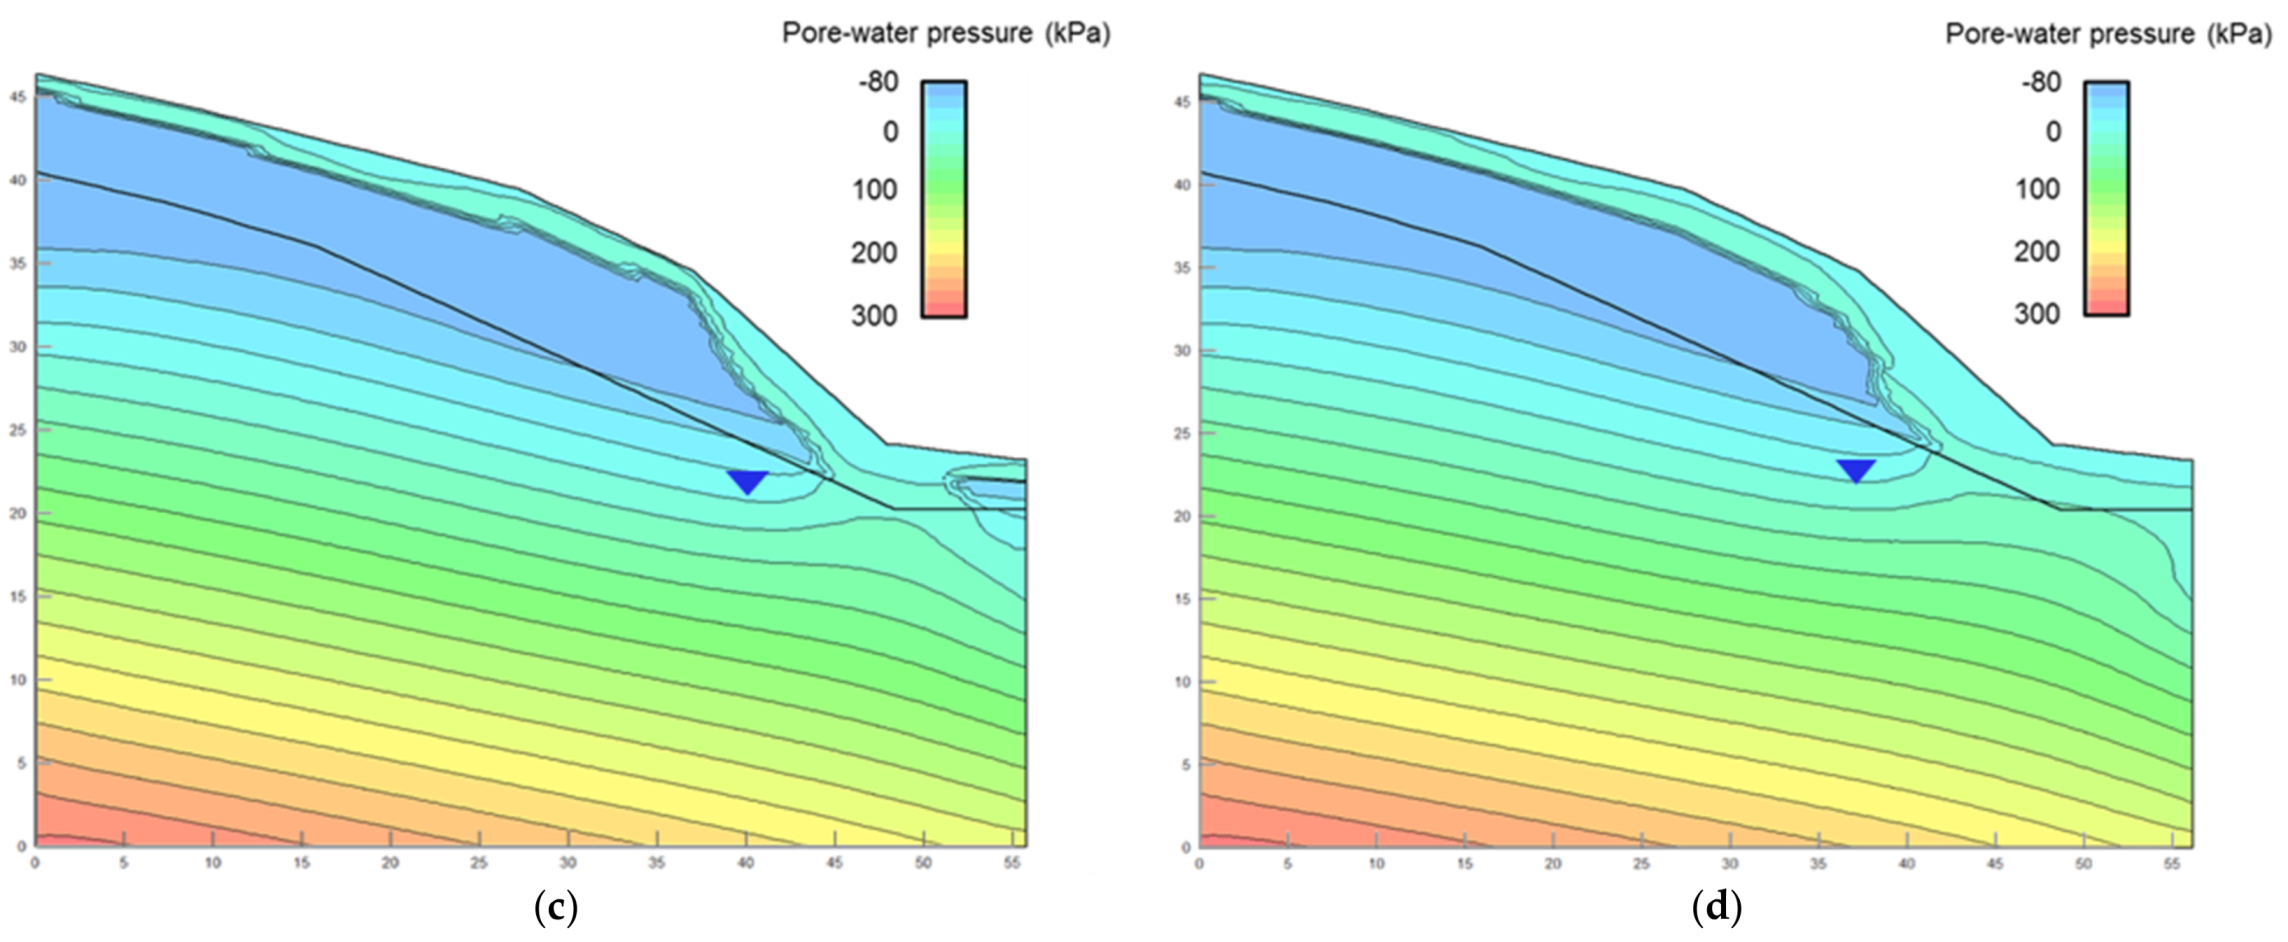
This study used the SEEP/W module of the GeoStudio (Company of GEO-SLOPE, Calgary, AB, Canada) [31] numerical analysis software to conduct two-dimensional transient seepage analysis of slopes with homogenous soil to analyze the effects of rainfall intensity changes in 2016, 2050, and 2100 on the hydrological status of the slope. By using the maximum one-day rainfall intensity of the Da-Dong-Shan rainfall station in 2016, 2050, and 2100 as an example, this study simulated the average rainfall for a continuous period of 24 h. Figure 5 shows the distribution status of pore-water pressure in the slope soil after 6, 12, 18, and 24 h of continuous rainfall in 2016. Figure 5a indicates that after 6 h of rainfall, the surface soil of the slope was affected by rainfall, and the soil water content approached saturation. Therefore, the soil pore-water pressure approached 0, forming a 0.5-m-deep transient saturation belt. A comparison of the pore-water pressure distribution status at 12, 18, and 24 h revealed that as the rainfall duration increased, the depth of the soil affected by rainfall, which also experienced changes in pore-water pressure, increased from 0.5 m to an average of 3 m, ultimately causing the phenomenon of elevated groundwater levels. The seepage analysis results of 2016, 2050, and 2100 showed that after 6 h of rainfall, the slope surface soil in 2050 and 2100 was affected by rainfall and that the depth at which the pore-water pressure = 0 was 0.7 m and 1 m, respectively. In addition, the pore-water pressure distribution map at 18 h indicates that the groundwater level increased as a result of rainfall, as shown in Figure 6 and Figure 7. This phenomenon indicates that future increasing trends in rainfall intensity will increase the rainfall infiltration rate and decrease the duration required for slope soil to reach saturation, if the hydraulic conductivity of the soil is higher than the rainfall intensity. The pore-water pressure of saturated soil is 0, which causes the soil to lose shear strength. Therefore, the results indicate that in the future, slopes will be rapidly affected by rainfall and will lose stability.
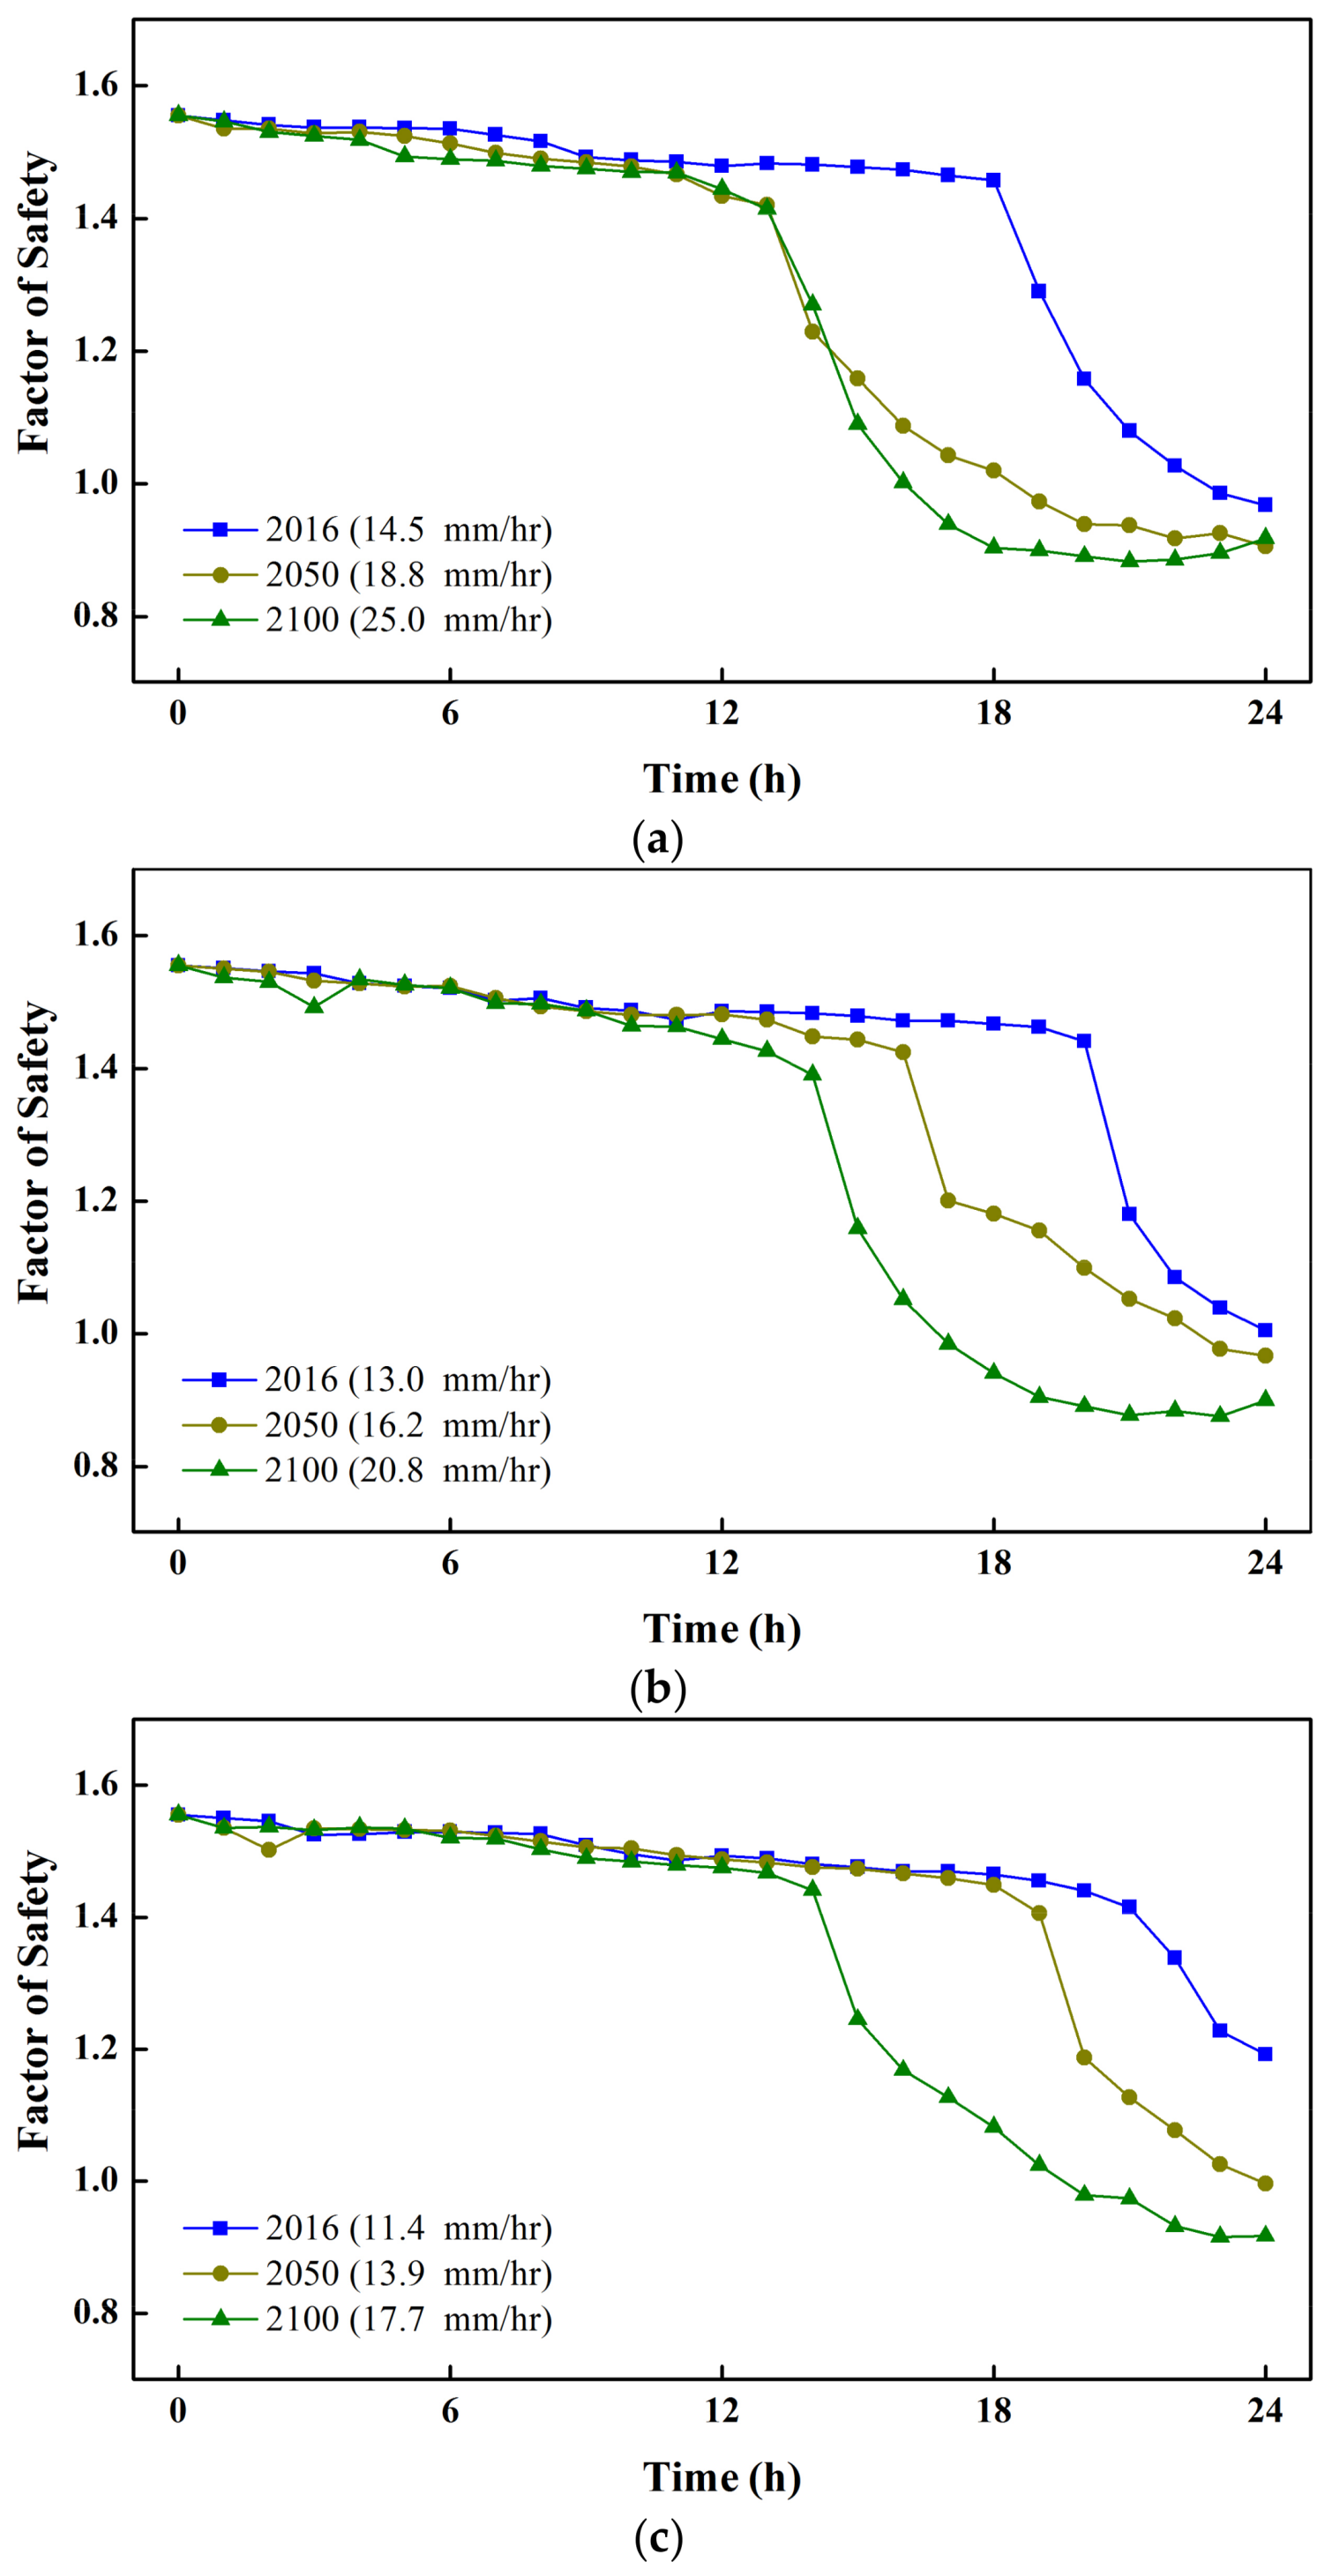
4.3. Qualitative Analysis of Slope Stability
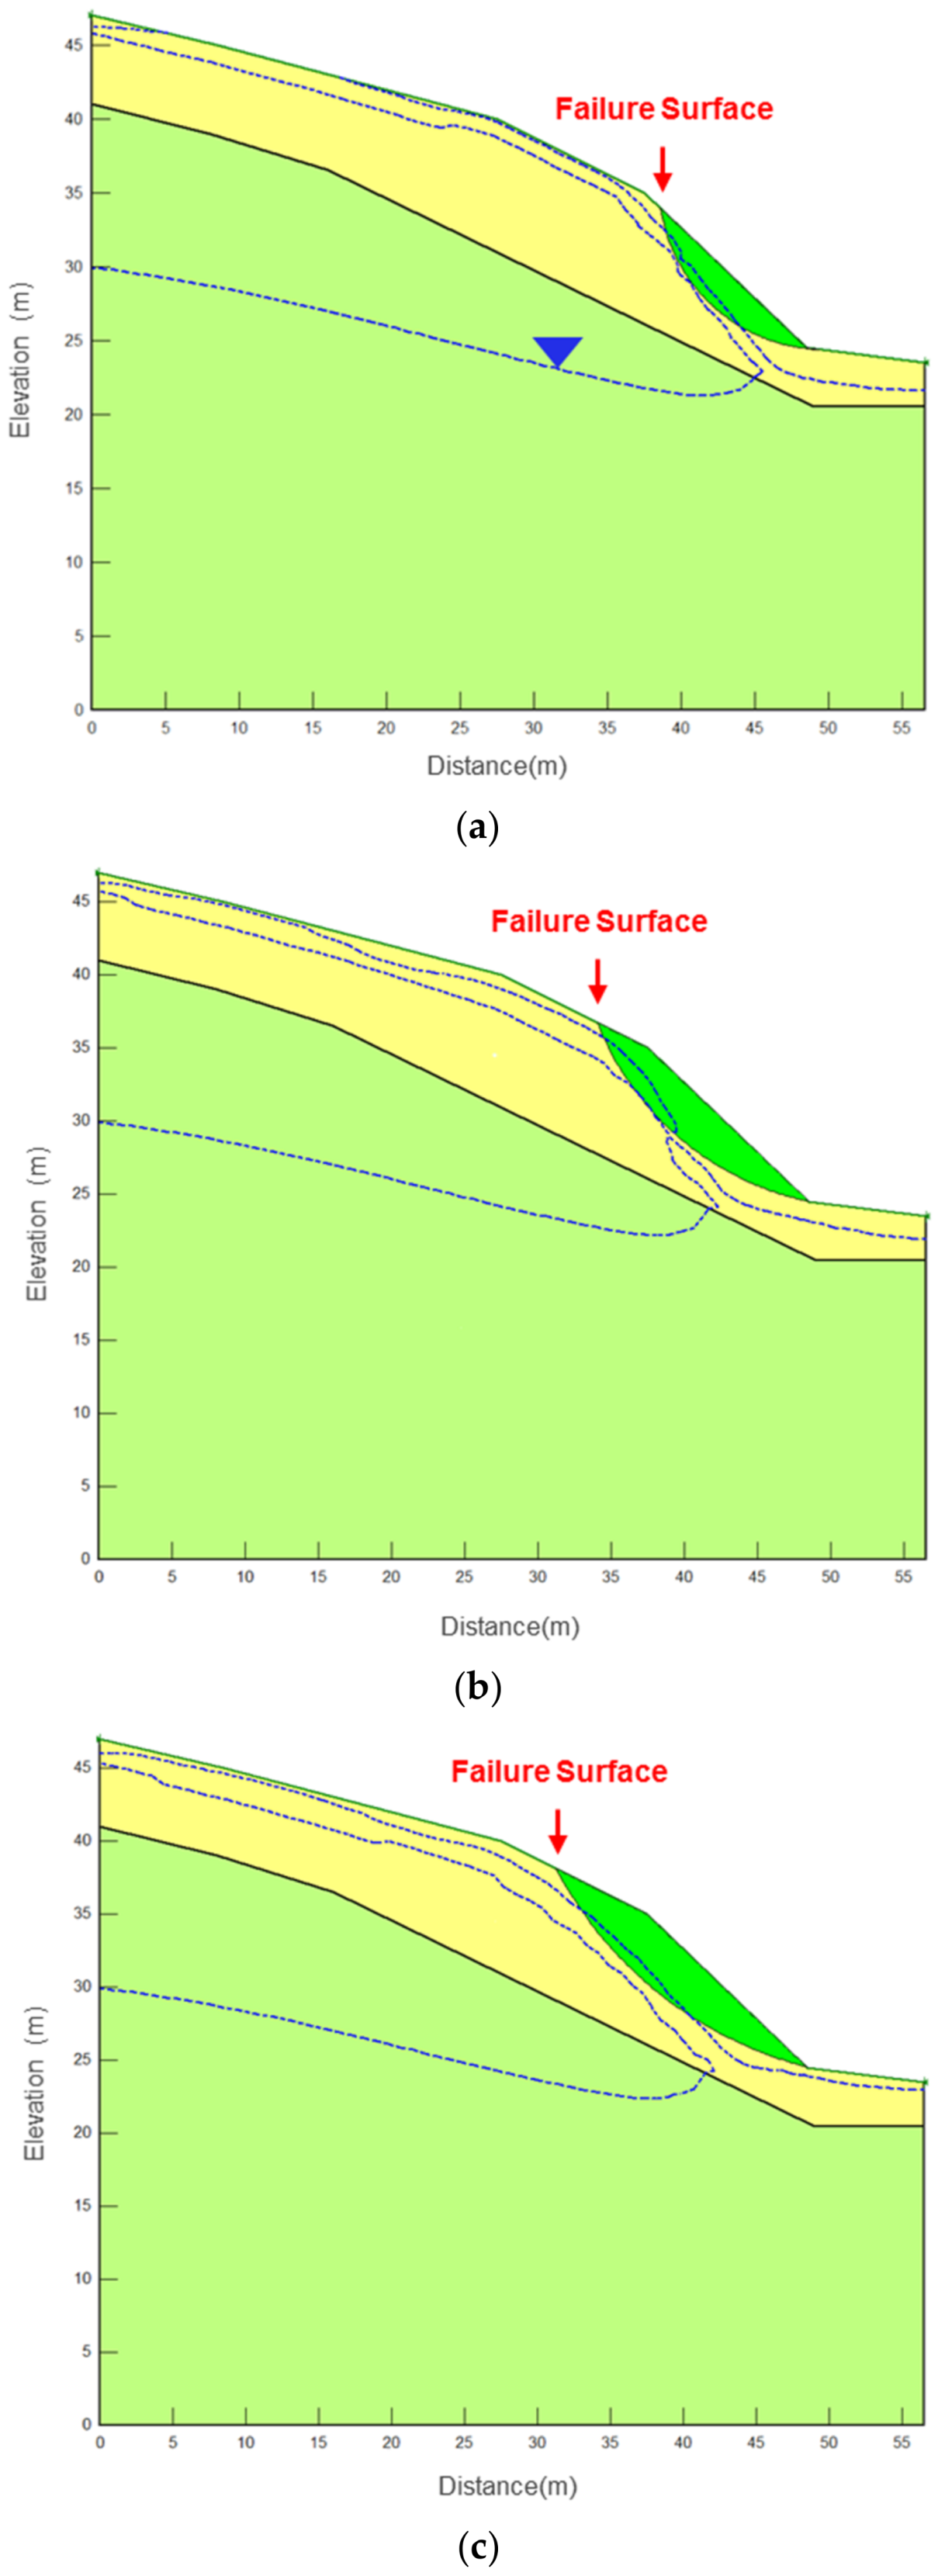
To understand the effects of rainfall intensity changes in 2016, 2050, and 2100 on slope stability, the seepage analysis results were input into the SLOPE/W module in the GeoStudio [36] numerical analysis software to calculate the slope safety coefficient. Figure 8 shows the corresponding changes in the slope safety coefficient owing to changes in rainfall intensity at the various rainfall stations. Figure 9 shows the result of failure surface analysis under 2016, 2050, and 2100 rainfall conditions, taking Da-Dong-Shan rainfall station for example. This study used a Factor of Safety decreasing rate to compare the slope stability variation for each case, with the formula:
where FSint is the Factor of Safety of the slope when the rainfall begins; and FS′ is the Factor of Safety of the slope when the rainfall stops.
The results indicated that the relatively low rainfall intensity of about 11.4–14.5 mm/h in 2016 enabled slope stability to be maintained for a longer duration. After an average rainfall duration of about 20 h, the safety coefficient showed a dramatic decrease, and the average reduction in the safety coefficient was 32%. In 2050, an increase in rainfall intensity to 13.9–18.8 mm/h resulted in a 4 h earlier average in the time of slope stability decline, and the safety coefficient reduction increased to 38.5%. In 2100, rainfall intensity of about 17.7–25 mm/h was the highest, and the slope stability showed a dramatic reduction after 13–14 h. In addition, the reduction in the safety coefficient after 24 h of rain was the greatest, with an average decrease of 41%. Table 5 shows the compiled slope stability reduction phenomenon, which corresponds to the seepage analysis results. This shows that a gradual increase in rainfall intensity in the Zengwen reservoir catchment area will accelerate the rate of pore water pressure increase in the surface soil of the slopes. This will, in turn, result in a rapid decrease in soil shear strength, a shorter time for slope stability to decline, and an increase in safety coefficient reduction.
By combining the trend analysis and the numerical model analysis, it is helpful to realize the effect of rainfall intensity variations on slope stability in the Zengwen reservoir catchment. The result of seepage and slope stability analyses indicate that increasing rainfall intensity would be disastrous for the Nan-Laio-Yeh-Hsi slope. However, it’s difficult to understand the return period of extreme rainfall events, such as typhoon Morakot in 2009, by using trend analysis. Thus, future research could collect and record hourly rainfall, and use frequency analysis to investigate the relationship between rainfall intensity and return period, so as to assess the probability of the slope collapsing due to rainfall in the future. Moreover, conducting geological surveys to determine soil mechanical and hydraulic parameters in the numerical model could make the results of seepage and slope stability analyses more reliable.
5. Conclusions
This study analyzed rainfall intensity trends based on daily rainfall data from three test stations at Da-Dong-Shan, Ma-To-Shan, and San-Jiao-Nan-Shan in the Zengwen reservoir catchment area. The analysis results from the Mann–Kendall test and the Theil–Sen estimator showed an increasing trend in rainfall intensity at the study site from 1990–2016 with one-, two-, and three-day rainfall events showing the most significant trends compared to five- and seven-day rainfall events. In addition, the rainfall intensity analysis results of one-day rainfall events showed that after 2050, the one-day maximum rainfall at the study site will complete the threshold value for long-duration extreme events, as defined by the National Science and Technology Center for Disaster Reduction, which means the rainfall duration is longer than 1 day and rainfall amount in 1 day is bigger than 350 mm [41]. This shows that under the effects of climate change, rainfall events in the Zengwen reservoir catchment area will experience extreme trends. Therefore, to protect the lives of local residents and the lifespan of the reservoir, evaluating the potential for future slope failures has become an extremely important topic. The investigated slope consisted of jointed sandstone with an overburden of a 3 to 9 m thick layer of sand. For practical applications, soil mechanical and hydraulic parameters, e.g., grain structure, density, hydraulic conductivity, and shear strength of the sand, were determined by means of tests in situ or on undisturbed soil samples.
This study used a combination of seepage and slope stability qualitative analyses to examine the effects of increased rainfall intensity on slope stability. Because the 2016 rainfall intensity of about 11.4–14.5 mm/h was low, the time required for the surface soil of slopes to be affected by rainfall infiltration and increases in pore water pressure was comparatively slow. A significant decrease in the slope Safety Factor occurred only after 18–21 h. In 2050, the predicted rainfall intensity was 13.9–18.8 mm/h, which is higher than that in 2016. Therefore, the surface soil of the slopes will rapidly reach saturation and lose their shear strength, which will cause the slope Safety Factor to decline at 14–19 h. In 2100, the rainfall intensity of about 17.7–25 mm/h was the highest, and the effects on soil pore water pressure owing to rainfall infiltration were the most obvious and occurred most rapidly. This caused the time of the slope Safety Factor to decline (at 13–14 h) at a faster rate than other cases. In addition, a comparison of the rate of decline in safety coefficients from 2016, 2050, and 2100 revealed that a gradual increase in rainfall intensity will result in increased slope instability, which will in turn increase the probability of slope disasters. Therefore, this study suggests the need for slope protection works at the Zengwen reservoir catchment area. Based on the slope failure record, although some slopes have retaining walls, the slopes are still subject to failure during heavy rainfall due to poor drainage. Thus, reinforcing drainage systems may be a method to protect slopes from failure in future work. To decrease the effects of slope disasters on the safety of this dam and its surrounding areas in the future, rainfall intensity trends should be included as a consideration for slope safety in the region.
Moreover, the results of trends analyses were showed weak significance in this study, and the variations in rainfall intensity may be related to the phenomenon of ENSO (El Niño-Southern Oscillation). Therefore, future research could collect more precipitation data for more detailed hydrological analysis so as to better predict rainfall patterns and assess the effect of rainfall pattern change on slope stability.
Acknowledgments
The authors are grateful for the support of the Research Project of the Ministry of Science and Technology (MOST 106-2625-M-006-014).
Author Contributions
Hsin-Fu Yeh conceived the subject of the article, literature review and contributed to the writing of the paper; and Yi-Jin Tsai participated in data processing, and elaborated the statistical analysis and figures.
Conflicts of Interest
The authors declare no conflict of interest.
References
- Jemec, M.; Komac, M. Rainfall patterns for shallow landsliding in perialpine Slovenia. Nat. Hazards 2013, 67, 1011–1023. [Google Scholar] [CrossRef]
- Zhang, J.; Li, J.; Lin, H. Models and influencing factors of the delay phenomenon for rainfall on slope stability. Eur. J. Environ. Civ. Eng. 2018, 22, 122–136. [Google Scholar] [CrossRef]
- Sidle, R.C.; Bogaard, T.A. Dynamic earth system and ecological controls of rainfall-initiated landslides. Earth Sci. Rev. 2016, 159, 275–291. [Google Scholar] [CrossRef]
- Ahmadi-adli, M.; Huvaj, N.; Toker, N.K. Rainfall-triggered landslides in an unsaturated soil: A laboratory flume study. Environ. Earth Sci. 2017, 76, 735. [Google Scholar] [CrossRef]
- Kim, J.; Kim, Y.; Jeong, S.; Hong, M. Rainfall-induced landslides by deficit field matric suction in unsaturated soil slopes. Environ. Earth Sci. 2017, 76, 808. [Google Scholar] [CrossRef]
- Strauch, A.M.; MacKenzie, R.A.; Giardina, C.P.; Bruland, G.L. Climate driven changes to rainfall and streamflow patterns in a model tropical island hydrological system. J. Hydrol. 2015, 523, 160–169. [Google Scholar] [CrossRef]
- Loo, Y.Y.; Billa, L.; Singh, A. Effect of climate change on seasonal monsoon in Asia and its impact on the variability of monsoon rainfall in southeast Asia. Geosci. Front. 2015, 6, 817–823. [Google Scholar] [CrossRef]
- Kristo, C.; Rahardjo, H.; Satyanaga, A. Effect of variations in rainfall intensity on slope stability in Singapore. Int. Soil Water Conserv. Res. 2017, 5, 258–264. [Google Scholar] [CrossRef]
- Yeh, H.-F.; Wang, J.; Shen, K.-L.; Lee, C.-H. Rainfall characteristics for anisotropic conductivity of unsaturated soil slopes. Environ. Earth Sci. 2015, 73, 8669–8681. [Google Scholar] [CrossRef]
- Bogaard, T.A.; Greco, R. Landslide hydrology: From hydrology to pore pressure. Wiley Interdiscip. Rev. 2016, 3, 439–459. [Google Scholar] [CrossRef]
- Cho, S.E. Prediction of shallow landslide by surficial stability analysis considering rainfall infiltration. Eng. Geol. 2017, 231, 126–138. [Google Scholar] [CrossRef]
- Wu, Y.; Miao, F.; Li, L.; Xie, Y.; Chang, B. Time-varying reliability analysis of Huangtupo Riverside No. 2 landslide in the Three Gorges Reservoir based on water-soil coupling. Eng. Geol. 2017, 226, 267–276. [Google Scholar] [CrossRef]
- Rahimi, A.; Rahardjo, H.; Leong, E.-C. Effect of antecedent rainfall patterns on rainfall-induced slope failure. J. Geotech. Geoenviron. Eng. 2010, 137, 483–491. [Google Scholar] [CrossRef]
- Chang, J.-M.; Chen, H.; Jou, B.J.-D.; Tsou, N.-C.; Lin, G.-W. Characteristics of rainfall intensity, duration, and kinetic energy for landslide triggering in Taiwan. Eng. Geol. 2017, 231, 81–87. [Google Scholar] [CrossRef]
- Collins, B.D.; Znidarcic, D. Stability analyses of rainfall induced landslides. J. Geotech. Geoenviron. Eng. 2004, 130, 362–372. [Google Scholar] [CrossRef]
- Conte, E.; Donato, A.; Troncone, A. A simplified method for predicting rainfall-induced mobility of active landslides. Landslides 2017, 14, 35–45. [Google Scholar] [CrossRef]
- Sun, G.; Yang, Y.; Cheng, S.; Zheng, H. Phreatic line calculation and stability analysis of slopes under the combined effect of reservoir water level fluctuations and rainfall. Can. Geotech. J. 2017, 54, 631–645. [Google Scholar] [CrossRef]
- Conte, E.; Troncone, A. A performance-based method for the design of drainage trenches used to stabilize slopes. Eng. Geol. 2018, 239, 158–166. [Google Scholar] [CrossRef]
- Segoni, S.; Rosi, A.; Rossi, G.; Catani, F.; Casagli, N. Analysing the relationship between rainfalls and landslides to define a mosaic of triggering thresholds for regional-scale warning systems. Nat. Hazards Earth Syst. Sci. 2014, 14, 2637. [Google Scholar] [CrossRef]
- Rosi, A.; Lagomarsino, D.; Rossi, G.; Segoni, S.; Battistini, A.; Casagli, N. Updating EWS rainfall thresholds for the triggering of landslides. Nat. Hazards 2015, 78, 297–308. [Google Scholar] [CrossRef]
- Ciabatta, L.; Camici, S.; Brocca, L.; Ponziani, F.; Stelluti, M.; Berni, N.; Moramarco, T. Assessing the impact of climate-change scenarios on landslide occurrence in Umbria region, Italy. J. Hydrol. 2016, 541, 285–295. [Google Scholar] [CrossRef]
- Piciullo, L.; Gariano, S.L.; Melillo, M.; Brunetti, M.T.; Peruccacci, S.; Guzzetti, F.; Calvello, M. Definition and performance of a threshold-based regional early warning model for rainfall-induced landslides. Landslides 2017, 14, 995–1008. [Google Scholar] [CrossRef]
- Lin, M.L.; Lin, S.C.; Lin, Y.C. Review of landslide occurrence and climate change in Taiwan. In Slope Safety Preparedness for Impact of Climate Change; CRC Press: Boca Raton, FL, USA, 2016; pp. 409–436. [Google Scholar]
- Mann, H.B. Nonparametric tests against trend. Econometrica 1945, 13, 245–259. [Google Scholar] [CrossRef]
- Kendall, M.G. Rank Correlation Methods; Charles Griffin: London, UK, 1975. [Google Scholar]
- Longobardi, A.; Villani, P. Trend analysis of annual and seasonal rainfall time series in the Mediterranean area. Int. J. Climatol. 2010, 30, 1538–1546. [Google Scholar] [CrossRef]
- Dindang, A.; Taat, A.; Phuah, E.; Alwi, A.; Mandai, A.; Adam, S.; Othman, F.; Bima, D.A.; Lah, D. Statistical and trend analysis of rainfall data in Kuching, Sarawak from 1968–2010. J. Med. Microbiol. 2013, 6, 17. [Google Scholar]
- Yeh, C.-F.; Wang, J.; Yeh, H.-F.; Lee, C.-H. Spatial and temporal streamflow trends in northern Taiwan. Water 2015, 7, 634–651. [Google Scholar] [CrossRef]
- Sen, P.K. Estimates of the regression coefficient based on Kendall’s tau. J. Am. Stat. Assoc. 1968, 63, 1379–1389. [Google Scholar] [CrossRef]
- Lee, J.Z. The Study on the Slope Safety of Tseng-Wen Reservoir. Master Thesis, National Cheng Kung University, Tainan, Taiwan, 2005. (In Chinese). [Google Scholar]
- Geo-Slope International Ltd. Seep/W for Finite Element Seepage Analysis; Geo-Slope International Ltd.: Calgary, AB, Canada, 2004. [Google Scholar]
- Richards, L.A. Capillary conduction of liquids through porous mediums. Physics 1931, 1, 318–333. [Google Scholar] [CrossRef]
- Carsel, R.F.; Parrish, R.S. Developing joint probability distributions of soil water retention characteristics. Water Resour. Res. 1988, 24, 755–769. [Google Scholar] [CrossRef]
- Van Genuchten, M.T. A closed-form equation for predicting the hydraulic conductivity of unsaturated soils. Soil Sci. Soc. Am. J. 1980, 44, 892–898. [Google Scholar] [CrossRef]
- Central Geological Survey. The Investigation and Assessment Program of the Effect of Catchment Hydrogeology on Slope Stability; Central Geological Survey: Taipei, Taiwan, 2007. (In Chinese)
- Geo-Slope International Ltd. Slope/W for Slope Stability Analysis; Geo-Slope International Ltd.: Calgary, AB, Canada, 2004. [Google Scholar]
- Fredlund, D.; Morgenstern, N.R.; Widger, R. The shear strength of unsaturated soils. Can. Geotech. J. 1978, 15, 313–321. [Google Scholar] [CrossRef]
- Morgenstern, N.; Price, V.E. The analysis of the stability of general slip surfaces. Geotechnique 1965, 15, 79–93. [Google Scholar] [CrossRef]
- Water Resources Agency. Hydrological Year Book of Taiwan Republic of China; Ministry of Economic Affairs: Taipei, Taiwan, 1990. (In Chinese)
- Jung, Y.D.; Kuo, C.C.; Chen, C.S. The temporal variation of regional rainfall characteristics in Taiwan. J. Taiwan Agric. Eng. 2009, 55, 1–18. (In Chinese) [Google Scholar]
- National Science and Technology Center for Disaster Reduction. Taiwan Extreme Rainfall Events: Summary of Important Events from 1992 to 2013; National Science and Technology Center for Disaster Reduction: New Taipei, Taiwan, 2015. (In Chinese)
Figure 1.
Location of the Zengwen reservoir and the distribution of rainfall stations.

Figure 2.
Slope model of Nan-Laio-Yeh-Hsi slope.

Figure 3.
(a) Soil-water retention curve (SWRC) and (b) Hydraulic conductivity function of sand.

Figure 4.
Rainfall intensity variation patterns from 1990 to 2016: (a) 1, 2 and 3 day rainfall events at Da-Dong-Shan rainfall station; (b) 5 and 7 day rainfall events at Da-Dong-Shan rainfall station; (c) 1, 2 and 3 day rainfall events at Ma-To-Shan weather station; (d) 5 and 7 day rainfall events at Ma-To-Shan rainfall station; (e) 1, 2 and 3 day rainfall events at San-Jiao-Nan-Shan rainfall station; (f) 5 and 7 day rainfall events at San-Jiao-Nan-Shan rainfall station.

Figure 5.
Pore-water pressure change with time in 2016 (Da-Dong-Shan rainfall station, 14.5 mm/h): (a) 6 h; (b) 12 h; (c) 18 h; (d) 24 h.
Figure 5.
Pore-water pressure change with time in 2016 (Da-Dong-Shan rainfall station, 14.5 mm/h): (a) 6 h; (b) 12 h; (c) 18 h; (d) 24 h.

Figure 6.
Pore-water pressure change with time in 2050 (Da-Dong-Shan rainfall station, 18.8 mm/h): (a) 6 h; (b) 12 h; (c) 18 h; (d) 24 h.
Figure 6.
Pore-water pressure change with time in 2050 (Da-Dong-Shan rainfall station, 18.8 mm/h): (a) 6 h; (b) 12 h; (c) 18 h; (d) 24 h.


Figure 7.
Pore-water pressure change with time in 2100 (Da-Dong-Shan rainfall station, 25 mm/h): (a) 6 h; (b) 12 h; (c) 18 h; (d) 24 h.
Figure 7.
Pore-water pressure change with time in 2100 (Da-Dong-Shan rainfall station, 25 mm/h): (a) 6 h; (b) 12 h; (c) 18 h; (d) 24 h.

Figure 8.
Results of slope stability analysis for the period 2016, 2050 and 2100: (a) Da-Dong-Shan rainfall station; (b) Ma-To-Shan rainfall station; (c) San-Jiao-Nan-Shan rainfall station.
Figure 8.
Results of slope stability analysis for the period 2016, 2050 and 2100: (a) Da-Dong-Shan rainfall station; (b) Ma-To-Shan rainfall station; (c) San-Jiao-Nan-Shan rainfall station.

Figure 9.
The failure surface under different rainfall conditions (Da-Dong-Shan rainfall station): (a) 2016; (b) 2050; (c) 2100.
Figure 9.
The failure surface under different rainfall conditions (Da-Dong-Shan rainfall station): (a) 2016; (b) 2050; (c) 2100.


Table 1.
Hydraulic properties of slope material.
| Material | a (kPa) | n | m | ks (m/s) | |
|---|---|---|---|---|---|
| Sand | 0.32 | 0.7 | 2.68 | 0.63 | |
| Sandstone | 0.2 | 100 | 1.8 | 0.44 |
Table 2.
Mechanical properties of slope material.
| Material | (kN/m3) | (kN/m3) | c’ (kN/m2) | (°) | (°) |
|---|---|---|---|---|---|
| Sand | 19.2 | 21.3 | 3 | 30 | 15 |
| Sandstone | 22.7 | 22.7 | 5100 | 63 | 30 |
Table 3.
Results of trend and slope analysis from 1990–2016.
| Rainfall Duration (day) | Da-Dong-Shan | Ma-To-Shan | San-Jiao-Nan-Shan | |||
|---|---|---|---|---|---|---|
| Mann–Kendall Test Result | Slope Estimator | Mann–Kendall Test Result | Slope Estimator | Mann–Kendall Test Result | Slope Estimator | |
| 1 | 0.79 | 0.13 | 0.48 | 0.09 | 1.10 | 0.08 |
| 2 | 0.63 | 0.07 | 0.42 | 0.04 | 1.31 | 0.09 |
| 3 | 0.67 | 0.05 | 0.1 | 0.00 | 1.29 | 0.08 |
| 5 | 0.25 | 0.02 | −0.17 | −0.01 | 0.71 | 0.03 |
| 7 | 0.25 | 0.01 | −1.23 | −0.05 | 0.4 | 0.01 |
| Average | - | 0.06 | - | 0.02 | - | 0.06 |
Table 4.
One-day maximum rainfall intensity for the period of 2016, 2050 and 2100.
| Rainfall Station | Rainfall Intensity in 2016 (mm/h) | Rainfall Intensity in 2050 (mm/h) | Rainfall Intensity in 2100 (mm/h) | ||
|---|---|---|---|---|---|
| β | b | ||||
| Da-Dong-Shan | 0.13 | −237.5 | 14.5 | 18.8 | 25 |
| Ma-To-Shan | 0.09 | −176 | 13 | 16.2 | 20.8 |
| San-Jiao-Nan-Shan | 0.08 | −141.4 | 11.4 | 13.9 | 17.7 |
Table 5.
The decreasing time and rate of slope Factor of Safety (FS) for the period 2016, 2050 and 2100.
Table 5.
The decreasing time and rate of slope Factor of Safety (FS) for the period 2016, 2050 and 2100.
| Rainfall Station | FS Decreasing Phenomenon | 2016 | 2050 | 2100 |
|---|---|---|---|---|
| Da-Dong-Shan | FS decreasing point of time (h) | 18 | 13 | 13 |
| FS decreasing rate (%) | 37.7 | 41.7 | 41 | |
| Ma-To-Shan | FS decreasing point of time (h) | 20 | 16 | 14 |
| FS decreasing rate (%) | 35.4 | 37.8 | 42.1 | |
| San-Jiao-Nan-Shan | FS decreasing point of time (h) | 21 | 19 | 14 |
| FS decreasing rate (%) | 23.3 | 35.9 | 41 |
© 2018 by the authors. Licensee MDPI, Basel, Switzerland. This article is an open access article distributed under the terms and conditions of the Creative Commons Attribution (CC BY) license (http://creativecommons.org/licenses/by/4.0/).
Share and Cite
MDPI and ACS Style
Yeh, H.-F.; Tsai, Y.-J. Effect of Variations in Long-Duration Rainfall Intensity on Unsaturated Slope Stability. Water 2018, 10, 479. https://doi.org/10.3390/w10040479
AMA Style
Yeh H-F, Tsai Y-J. Effect of Variations in Long-Duration Rainfall Intensity on Unsaturated Slope Stability. Water. 2018; 10(4):479. https://doi.org/10.3390/w10040479
Chicago/Turabian StyleYeh, Hsin-Fu, and Yi-Jin Tsai. 2018. "Effect of Variations in Long-Duration Rainfall Intensity on Unsaturated Slope Stability" Water 10, no. 4: 479. https://doi.org/10.3390/w10040479
Note that from the first issue of 2016, this journal uses article numbers instead of page numbers. See further details here.