A Flood Risk Assessment of Quang Nam, Vietnam Using Spatial Multicriteria Decision Analysis


1
School of Architecture and Built Environment, University of Newcastle, Newcastle, NSW 2308, Australia
2
Faculty of Hydraulic Engineering, National University of Civil Engineering, Hanoi 112000, Vietnam
*
Author to whom correspondence should be addressed.
Water 2018, 10(4), 461; https://doi.org/10.3390/w10040461
Submission received: 9 February 2018
/
Revised: 3 April 2018
/
Accepted: 8 April 2018
/
Published: 11 April 2018
Abstract
:Vietnam is highly vulnerable to flood and storm impacts. Holistic flood risk assessment maps that adequately consider flood risk factors of hazard, exposure, and vulnerability are not available. These are vital for flood risk preparedness and disaster mitigation measures at the local scale. Unfortunately, there is a lack of knowledge about spatial multicriteria decision analysis and flood risk analysis more broadly in Vietnam. In response to this need, we identify and quantify flood risk components in Quang Nam province through spatial multicriteria decision analysis. The study presents a new approach to local flood risk assessment mapping, which combines historical flood marks with exposure and vulnerability data. The flood risk map output could assist and empower decision-makers in undertaking flood risk management activities in the province. Our study demonstrates a methodology to build flood risk assessment maps using flood mark, exposure and vulnerability data, which could be applied in other provinces in Vietnam.
1. Introduction
A flood is a complex phenomenon that links the natural environment, people, and the social system [1]. Flood exposure and flood frequency are forecasted to increase, particularly in the low latitudes of Asia and Africa [2]. The impacts of flood risk are expected to increase globally due to population growth, economic development, and climate change [3,4]. Despite efforts to reduce adverse impacts through structural and non-structural measures, flooding remains a significant threat to communities [5].
Vietnam is located in tropical monsoon zone with more than 3450 rivers and streams and 3260 km of coastline. Many inhabitants live in riverine and coastal areas, and their livelihoods are dependent on the natural world; therefore, they are vulnerable to the impacts of climate-related hazards. Between 1989 and 2014, floods caused significant damages in Vietnam, with at least 14,867 people dead and missing, and total economic losses being equivalent to 1% of the nation’s gross domestic product [6].
It is critical that Vietnamese decision-makers in flood-prone areas are equipped with the best tools that are available to prepare communities and mitigate disaster losses. Flood risk mapping is a particularly valuable activity. The primary objective of flood risk maps is to provide information on flood hazards combined with other relevant information that can support decision-making process in flood risk management [7].
The incorporation of flood risk assessment into a Geographic Information System (GIS) framework has been applied at global, regional, and local scales in many recent studies. GIS can process the spatial data, is a beneficial tool to handle spatial data on flood risks [8]. GIS has been widely applied to flood risk assessments as a critical instrument for spatial analysis [9]. Spatial flood risk assessment is a useful tool to indicate risk levels and an essential reference to define specific flood risk management action plans [10,11,12].
At the global scale, Jongman et al. [13] used two approaches, the population method and land-use method, to estimate global flooding exposure; while Winsemius et al. [14] proposed a river flood risk assessment framework on a global scale. At the regional level, de Moel et al. [15] developed a framework for assessing and mapping flood risk for Europe. At the local level, Ward et al. [16] established a GIS-based model to simulate flooded areas and exposed assets to evaluate the current and future coastal flood hazard of northern Jakarta, and Budiyono et al. [17] investigated flood risk assessment in Jakarta by using Damagescanner model, which combined three flood risk components in a flood risk map.
Flood risk can be measured by determining the three flood risk components of hazard, exposure and vulnerability [7,14,15,17,18,19]. A comprehensive flood risk assessment takes into account all the constituents of flood risk, combining many individual parameters [15,20]. Spatial multicriteria decision analysis can combine and transform different geographical data layers into a decision map [21]. Geospatial techniques have significant potential support in the field of flood risk assessment in a spatial context [22]. Geospatial multicriteria decision-making (MCDM) methods have been investigated and applied, including Analytic Hierarchy Process (AHP), Weighted Linear Combination (WLC), outranking methods, and ideal point methods [23].
Spatial multicriteria decision analysis has been gaining more and more attention in the field of flood risk assessment. Meyer et al. [8] used the analysis for assessing flood risk for River Mulde in Saxony, Germany. Kubal et al. [24] built criteria for three dimensions of economic, social, and ecological indicators to assess the urban flood risk of Leipzig, Germany. Scheuer et al. [25] measured flood risk by integrating multicriteria of flood vulnerability. Dewan [22] utilised AHP and WLC to assess flood vulnerability by combining physical vulnerability, social vulnerability, and coping capacity. Hansson et al. [26] proposed a MCDM framework for flood risk management in Bac Hung Hai polder.
Studies on flood risk analysis have been increasing in Vietnam (e.g., Tran et al. [27], Razafindrabe et al. [28], Chau et al. [29], Chau et al. [30], Chinh et al. [31], Vu et al. [32], and Dang et al. [33]). Tran et al. [27] and Razafindrabe et al. [28] adapted a flood risk management framework of AS/NZS 4360:1999 standard for Thua Thien Hue province and Da Nang city, respectively. Chau et al. [29] applied GIS techniques to map flood impacts on agriculture in Quang Nam province. Chau et al. [30] used a cost-benefit analysis tool to assess the economic impact of floods on agricultural production in Quang Nam province. Chinh et al. [31] built a flood loss model for residential buildings in Can Tho city. Vu et al. [32] integrated an FLO-2D hydraulic model with several indicators (residential area and road network) to assess the annual flood damage for Quang Ngai province. Dang et al. [33] used AHP approach to assess flood risk for Day river flood diversion area; however, a flood risk map was not displayed in this research.
This study aims to produce a detailed assessment of flood risk levels for Quang Nam province using a spatial multicriteria decision analysis approach. Quang Nam province is selected as the case study given its particular vulnerability and exposure to flood hazards in Vietnam. Severe floods frequently occur and seriously impact communities [28]. The core approach of this study is to integrate AHP with GIS mapping to create a flood risk assessment map. AHP is an analytical decision-making method established by Saaty [34] and is the most applied MCDM method for flood risk analysis [35]. The study first identifies components of flood risk including hazard, exposure, and vulnerability indicators; and then integrates these components into a hierarchy model using AHP method. Second, the scores of flood risk components are measured by decision-makers’ judgements via AHP pairwise comparisons. Finally, a flood risk assessment map is generated from the integration of spatial data on flood hazard, exposure, and vulnerability.
2. Research Area and Data Used
2.1. Research Area
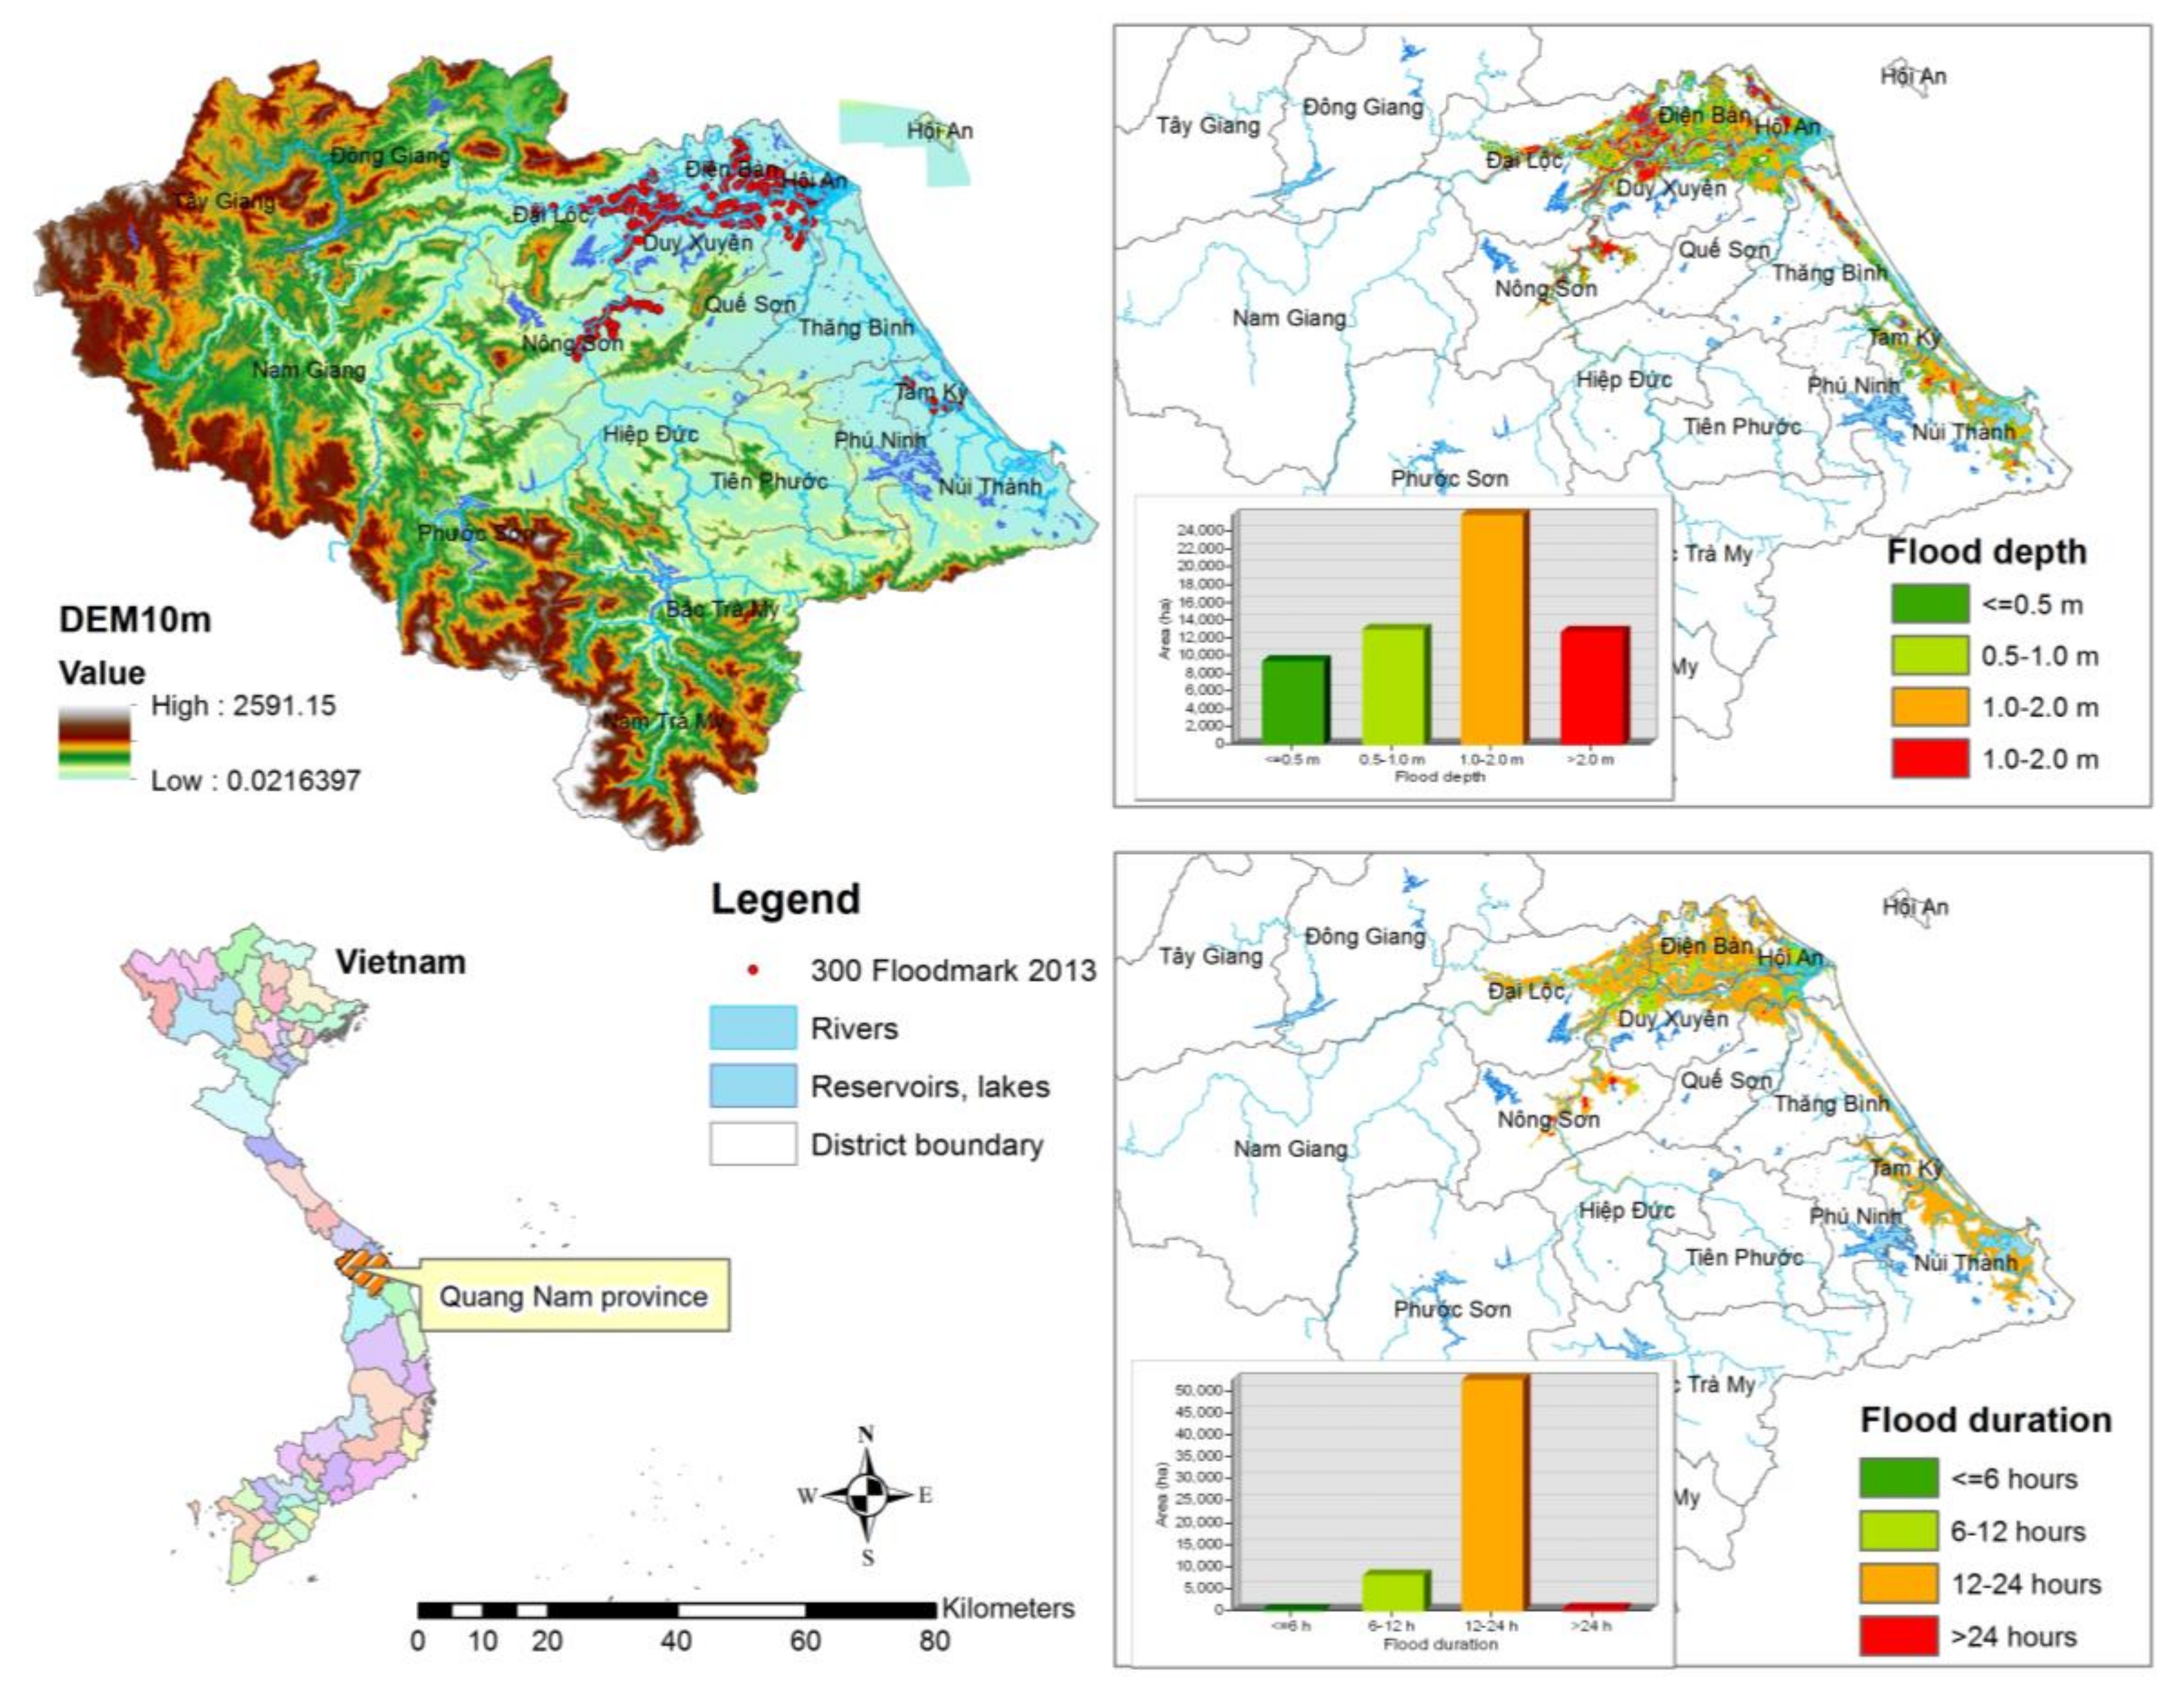
Quang Nam province is located at 14°57′10″ N to 16°03′50″ N and 107°12′50″ E to 108°44′20″ E on the south-central coast of Vietnam (Figure 1), with the area of 10,440 km2, and the population of over 1.4 million in 2015. The province has Vu Gia-Thu Bon river basin with the area of 5290 km2 and over 100 km of coastline. Dense hydropower reservoirs are allocated along this river basin. The west of Quang Nam is mountainous and sparsely populated, while the east is flat plains that are favourable for agricultural population and urban development. The province has a high exposure to climate events (mainly storms, floods, flash floods, and typhoons) and a relatively high level of poverty at 28% [36].
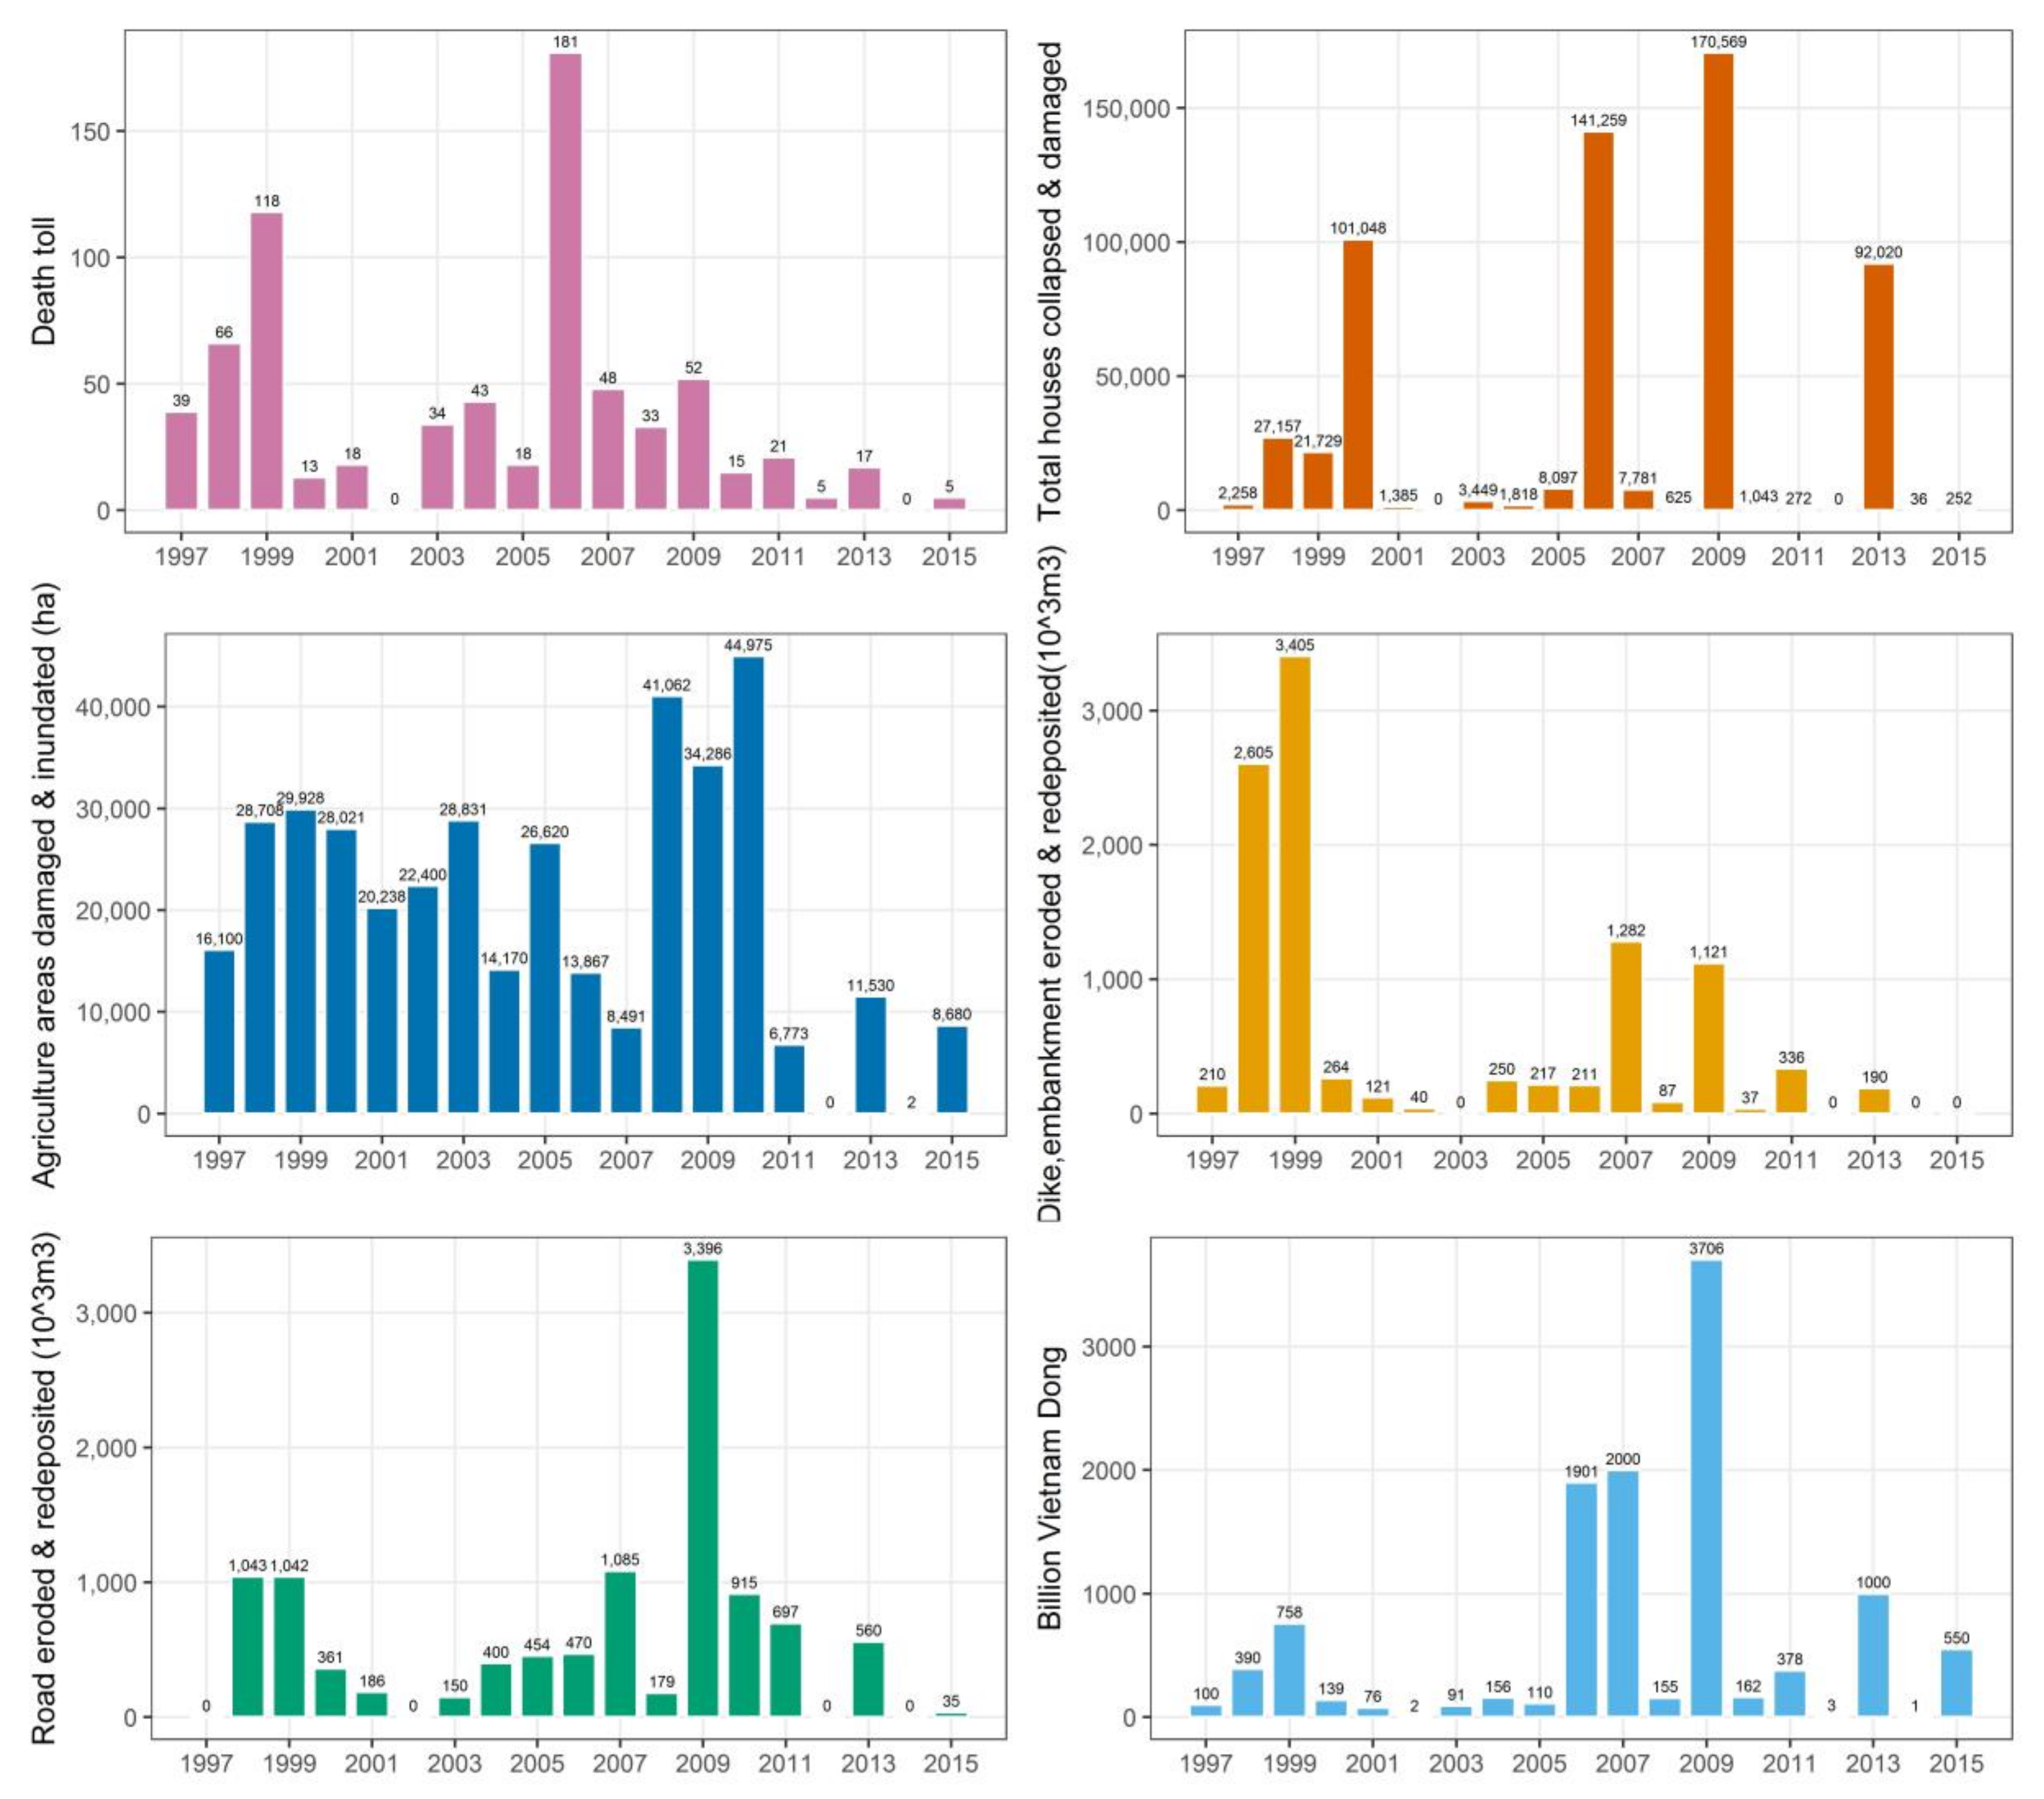
Vu Gia-Thu Bon river basin’s tributaries originate in elevated mountain ranges and then flow through narrow plains before emptying into the sea (Figure 1). Due to the increase of rainfall intensity, water-related disasters are growing in the river basin, such as large-scale floods in the rainy season [38]. Floods have severely affected communities’ livelihood and social-economic development in Quang Nam province over the years (Figure 2). Severe floods are increasing due to the pressure of population growth and economic development, with the human interference leading to environmental damage and the influence of climate change [39].
2.2. Data Used
The input data was collected via fieldwork in Quang Nam province in June and August 2016 by the first author. The field work had three main tasks: (1) semi-structured interviews with local staff working in Steering Committees on Natural Disaster Prevention and Control at commune, district and provincial levels to investigate flood risk management activities at their localities, (2) AHP questionnaires with the local staff for their judgements on flood risk factors, and (3) the collection of secondary data, including flood marks, flood damage data, and GIS data. The data of population density, poverty rate, and numbers of doctors and nurses were collected from 2015 Statistical Yearbooks of 17 districts in Quang Nam province. This study was approved by the University of Newcastle Human Research Ethics Committee in June 2016, approval No. H-2016-0125.
3. Methodology
3.1. AHP Method
AHP was initially developed by Thomas L. Saaty [34]. It is a flexible technique for facilitating the process of setting priorities and decision-making. AHP has been broadly applied in making decisions in economics, education, transportation, planning, resources allocation, and integrated management [40,41], and more recently in flood risk management [35].
Several of the advantages of using AHP include direct Decision-Makers (DMs) or experts’ opinion involvement, simple GIS integration [21], criteria and sub-criteria systematisation [42], and consistency in judgement [43]. Besides these advantages, this approach has three main limitations. The first one relates to the evaluation and ranking of indicators based on the personal choice and the knowledge of DMs or experts, which lead to subjectivity in evaluation [44]. The second weakness is that this approach requires a large number of pairwise comparisons and the high number of alternatives or criteria can make it overwhelming for participants [45,46]. The third drawback is that the pairwise comparisons of this method are based on very general and vague criteria [47]. However, these shortcomings present in almost MCDM methods [42].
AHP can be summarised in the following main steps:
- Step 1: Creating a hierarchical system by decomposing the goal into a hierarchy of interrelated clusters;
- Step 2: Making pairwise comparisons between criteria of the decision clusters to form pairwise comparison matrix A = [aij]; and,
- Step 3: Synthesizing individual subjective judgments and computing relative weights.
The assignment of weights has a fundamental role in risk decision-making process. Weighting articulates the importance or preference of criteria and is often a subjective process [48]. The weights of criteria can be determined by direct judgements of an expert group [49,50] or by statistical methods, such as linear regression [51], non-parametric resampling [52], and principal component analysis.
AHP operates by setting priorities for multi-criteria, which are judged by groups (DMs, experts, or stakeholders) involved in decision-making process to derive the best decision [53]. The weights of criteria in AHP method rely upon the judgment of experts or DMs, so the method focuses on quality instead of quantity of experts. AHP assessment could operate with a small group of experts, for example, one expert [54], three experts [49], four experts [50], five experts [55], six experts [56], and nine experts [57]. AHP could also run with the author experience-based assessment, for example, Kandilioti and Makropoulos [58], Li et al. [59], and Dewan [22].
3.2. Flood Risk Components
Flood risk is a common threat to many populous cities, and riverine and coastal regions [60]. Flood risk was first quantified by a combination of flood hazard, exposure, and vulnerability, as in Equation (1) in the studies of Crichton [61] and Kron [18]. After that, the application has been formalised in many studies and frameworks, such as Winsemius et al. [14], Budiyono et al. [17], Jongman et al. [3], and UNISDR [62]. Flood hazard can be determined as the probability of occurring a certain level of danger at one location and as natural and man-made triggers [18,63]. Exposure is defined by the extent to which people, property, and infrastructure are exposed to a hazard event [14,61,63]. Vulnerability is specified by the extent to which people are susceptible to, or unable to cope with, the impacts [13,18,60,64].
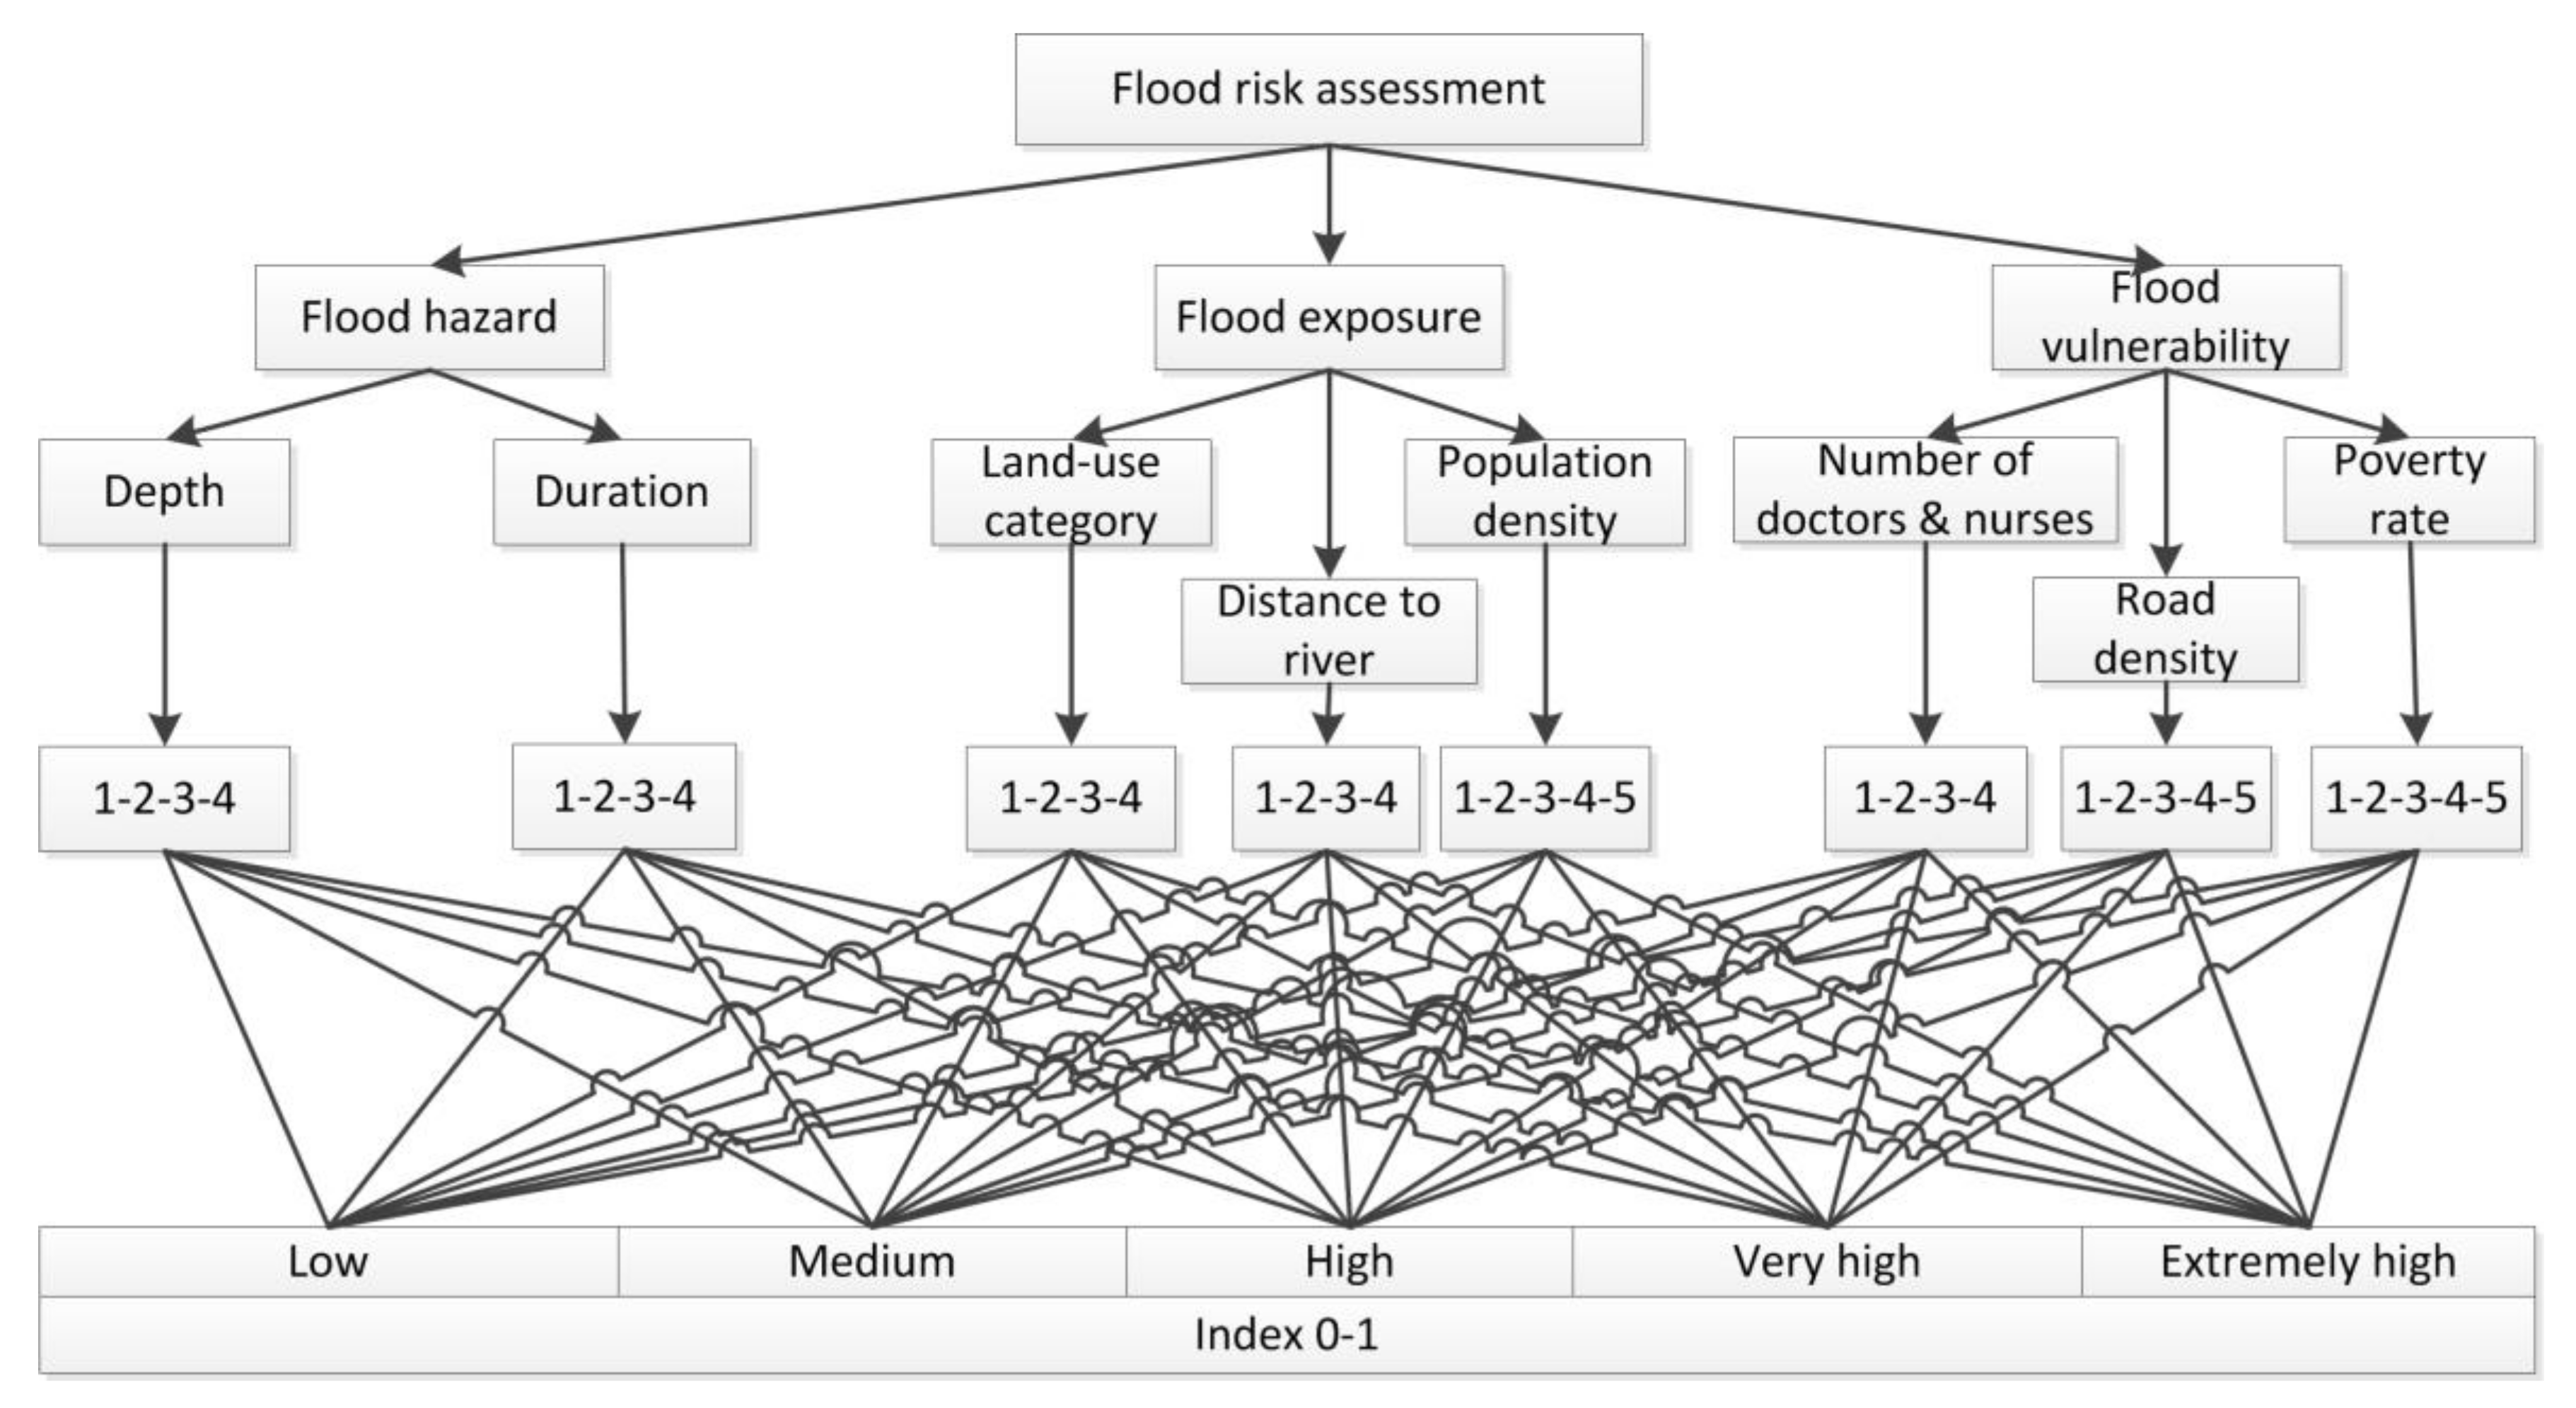
This study aims to incorporate flood hazard information within the context of data on flood exposure and vulnerability to a hazard event as in Equation (1). A hierarchy model using AHP method is designed to integrate the three components. Each component has several criteria; in turn, each criterion contains several sub-criteria. The criteria of flood risk components are adapted from the various studies that are cited in Table 1. The hierarchy framework is used to assess flood risk (Figure 3). Criteria are weighted based on DMs’ judgment via AHP pairwise comparisons.
Flood hazard data, including flood depth and flood duration data, from Luu et al. [37] (Figure 1) is used in conjunction with flood exposure and vulnerability data to provide a flood risk map for Quang Nam province.
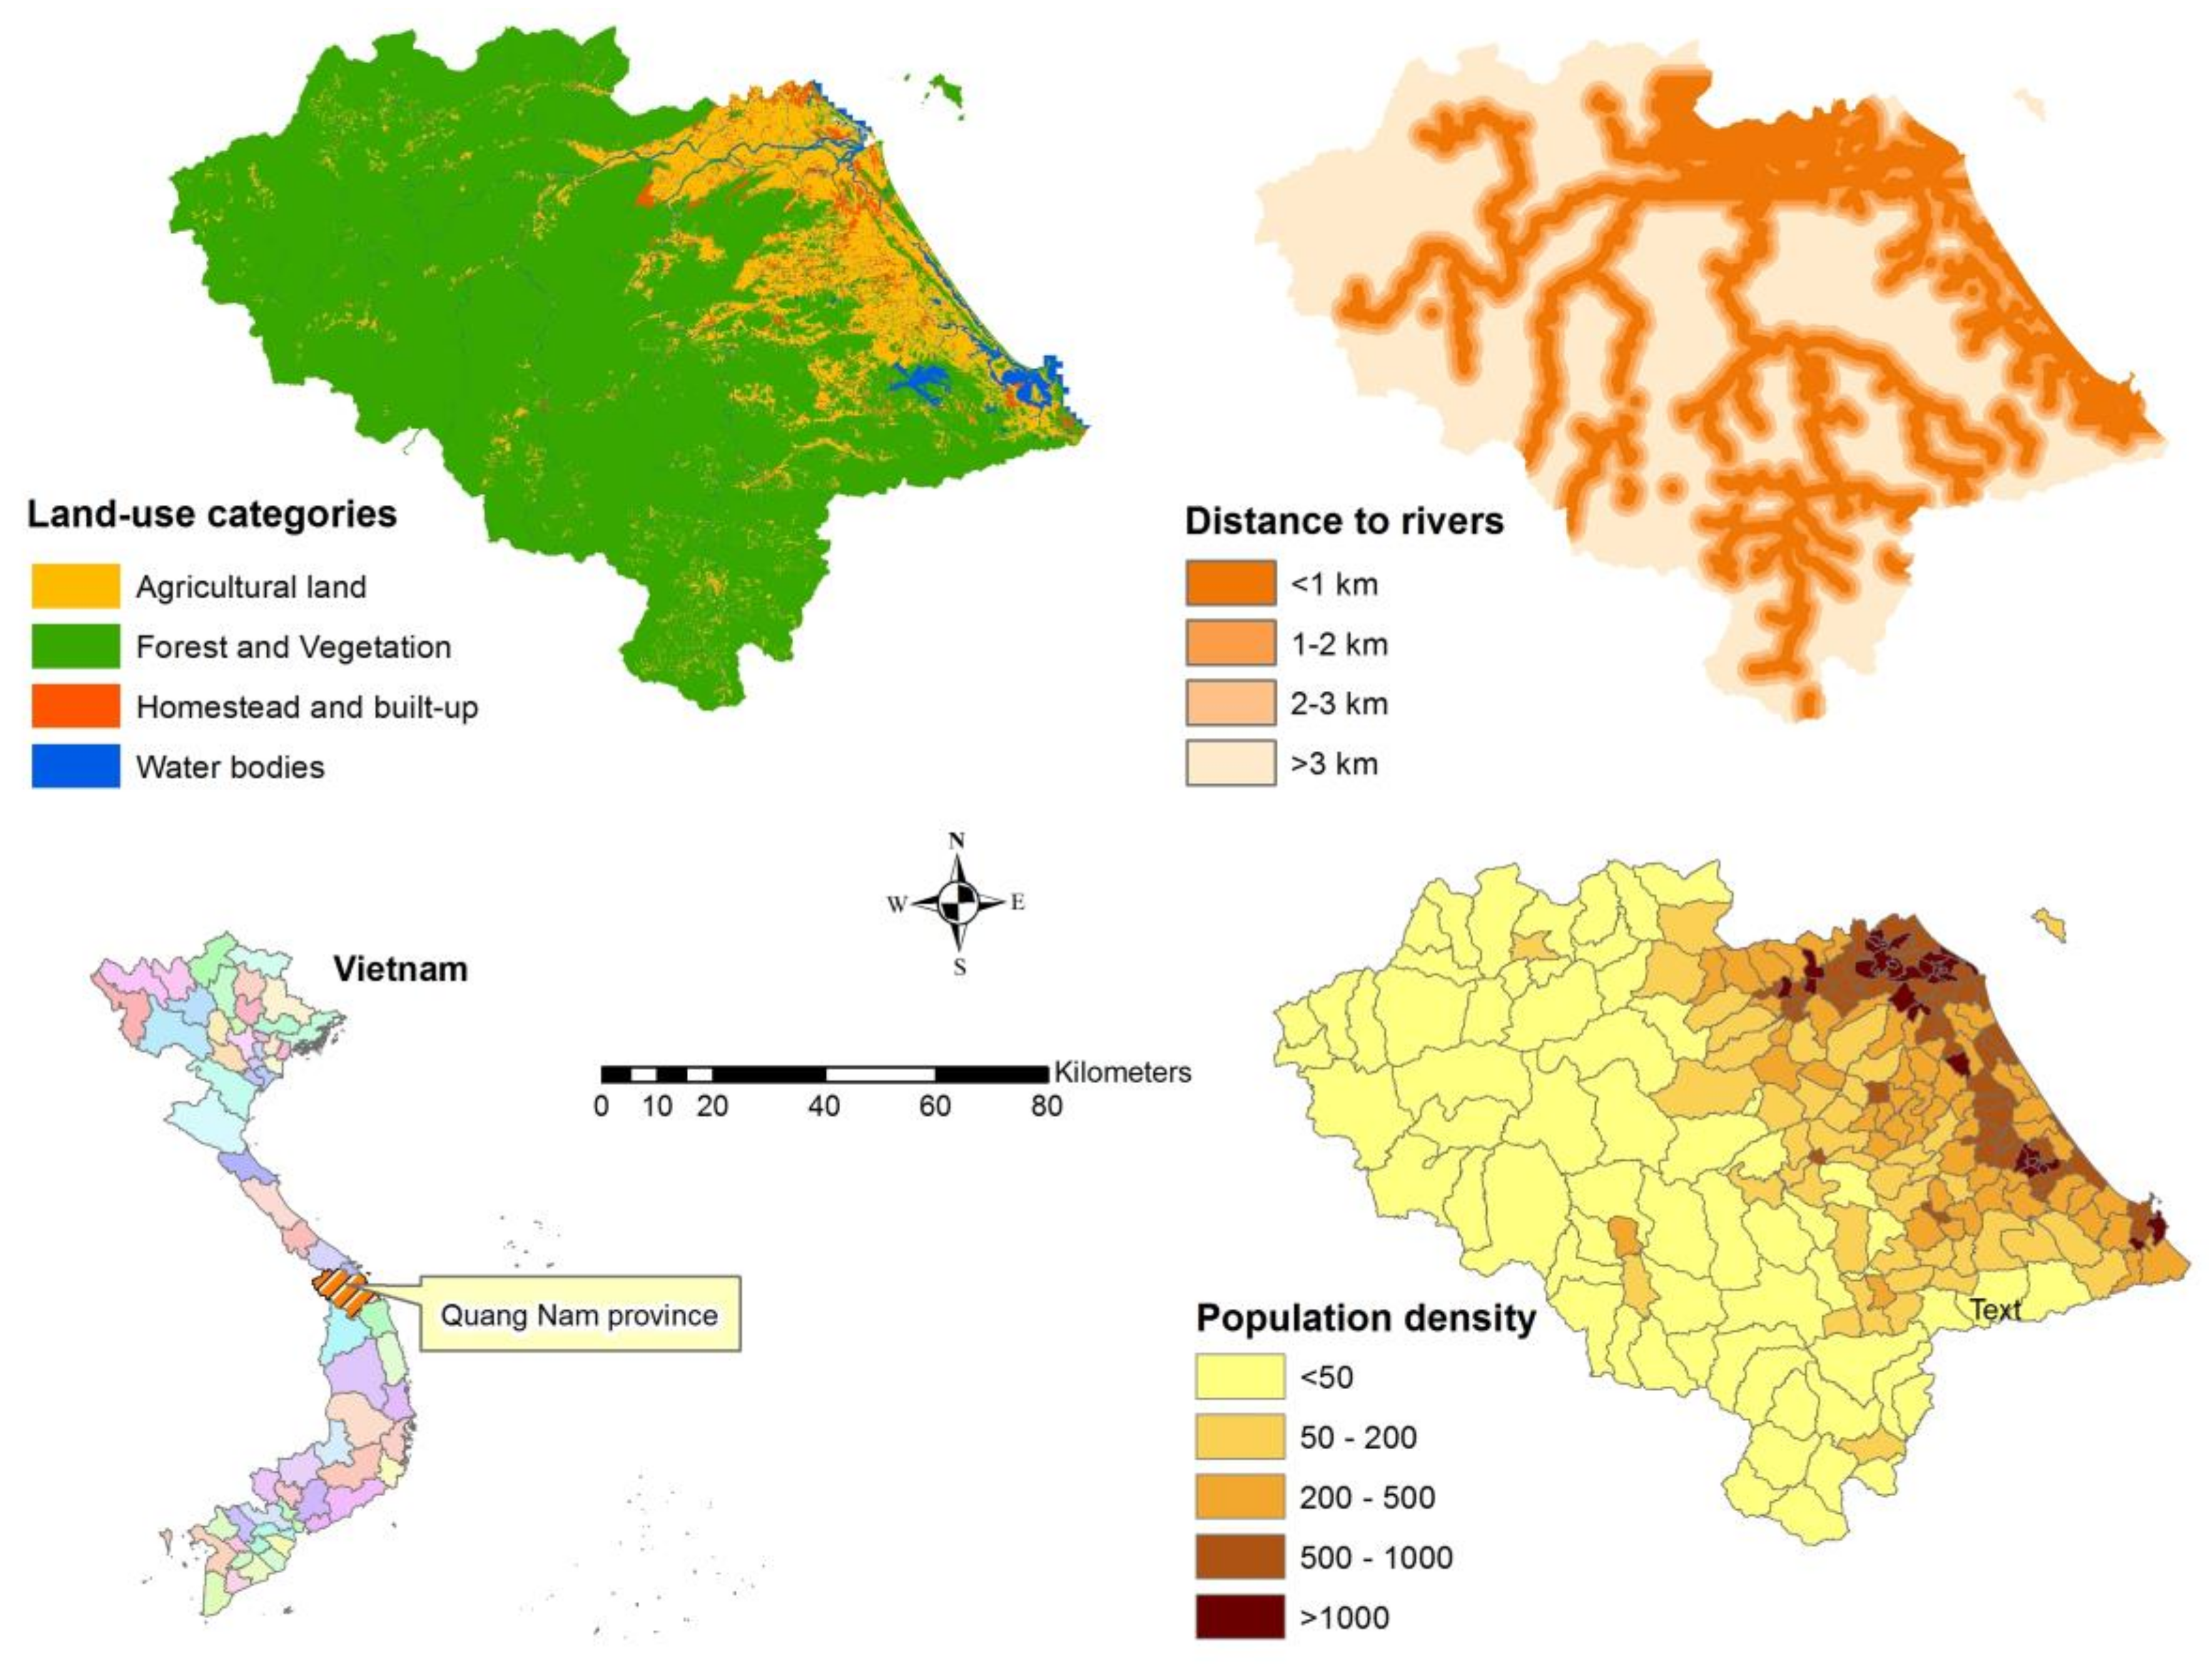
Three criteria—land-use categories, distance to rivers, and population density—were considered in this study in order to estimate flood exposure. Land-use categories are often used to calculate the losses in flood risk assessment models [75]. The distance to rivers criteria is derived from river network data. It is assumed that people living close to river systems are at higher risk than those who do not [22]. The population density is the most critical criterion in assessing flood risk since it is defined by human settlements. More densely populated areas are at higher risk when floods occur [73].
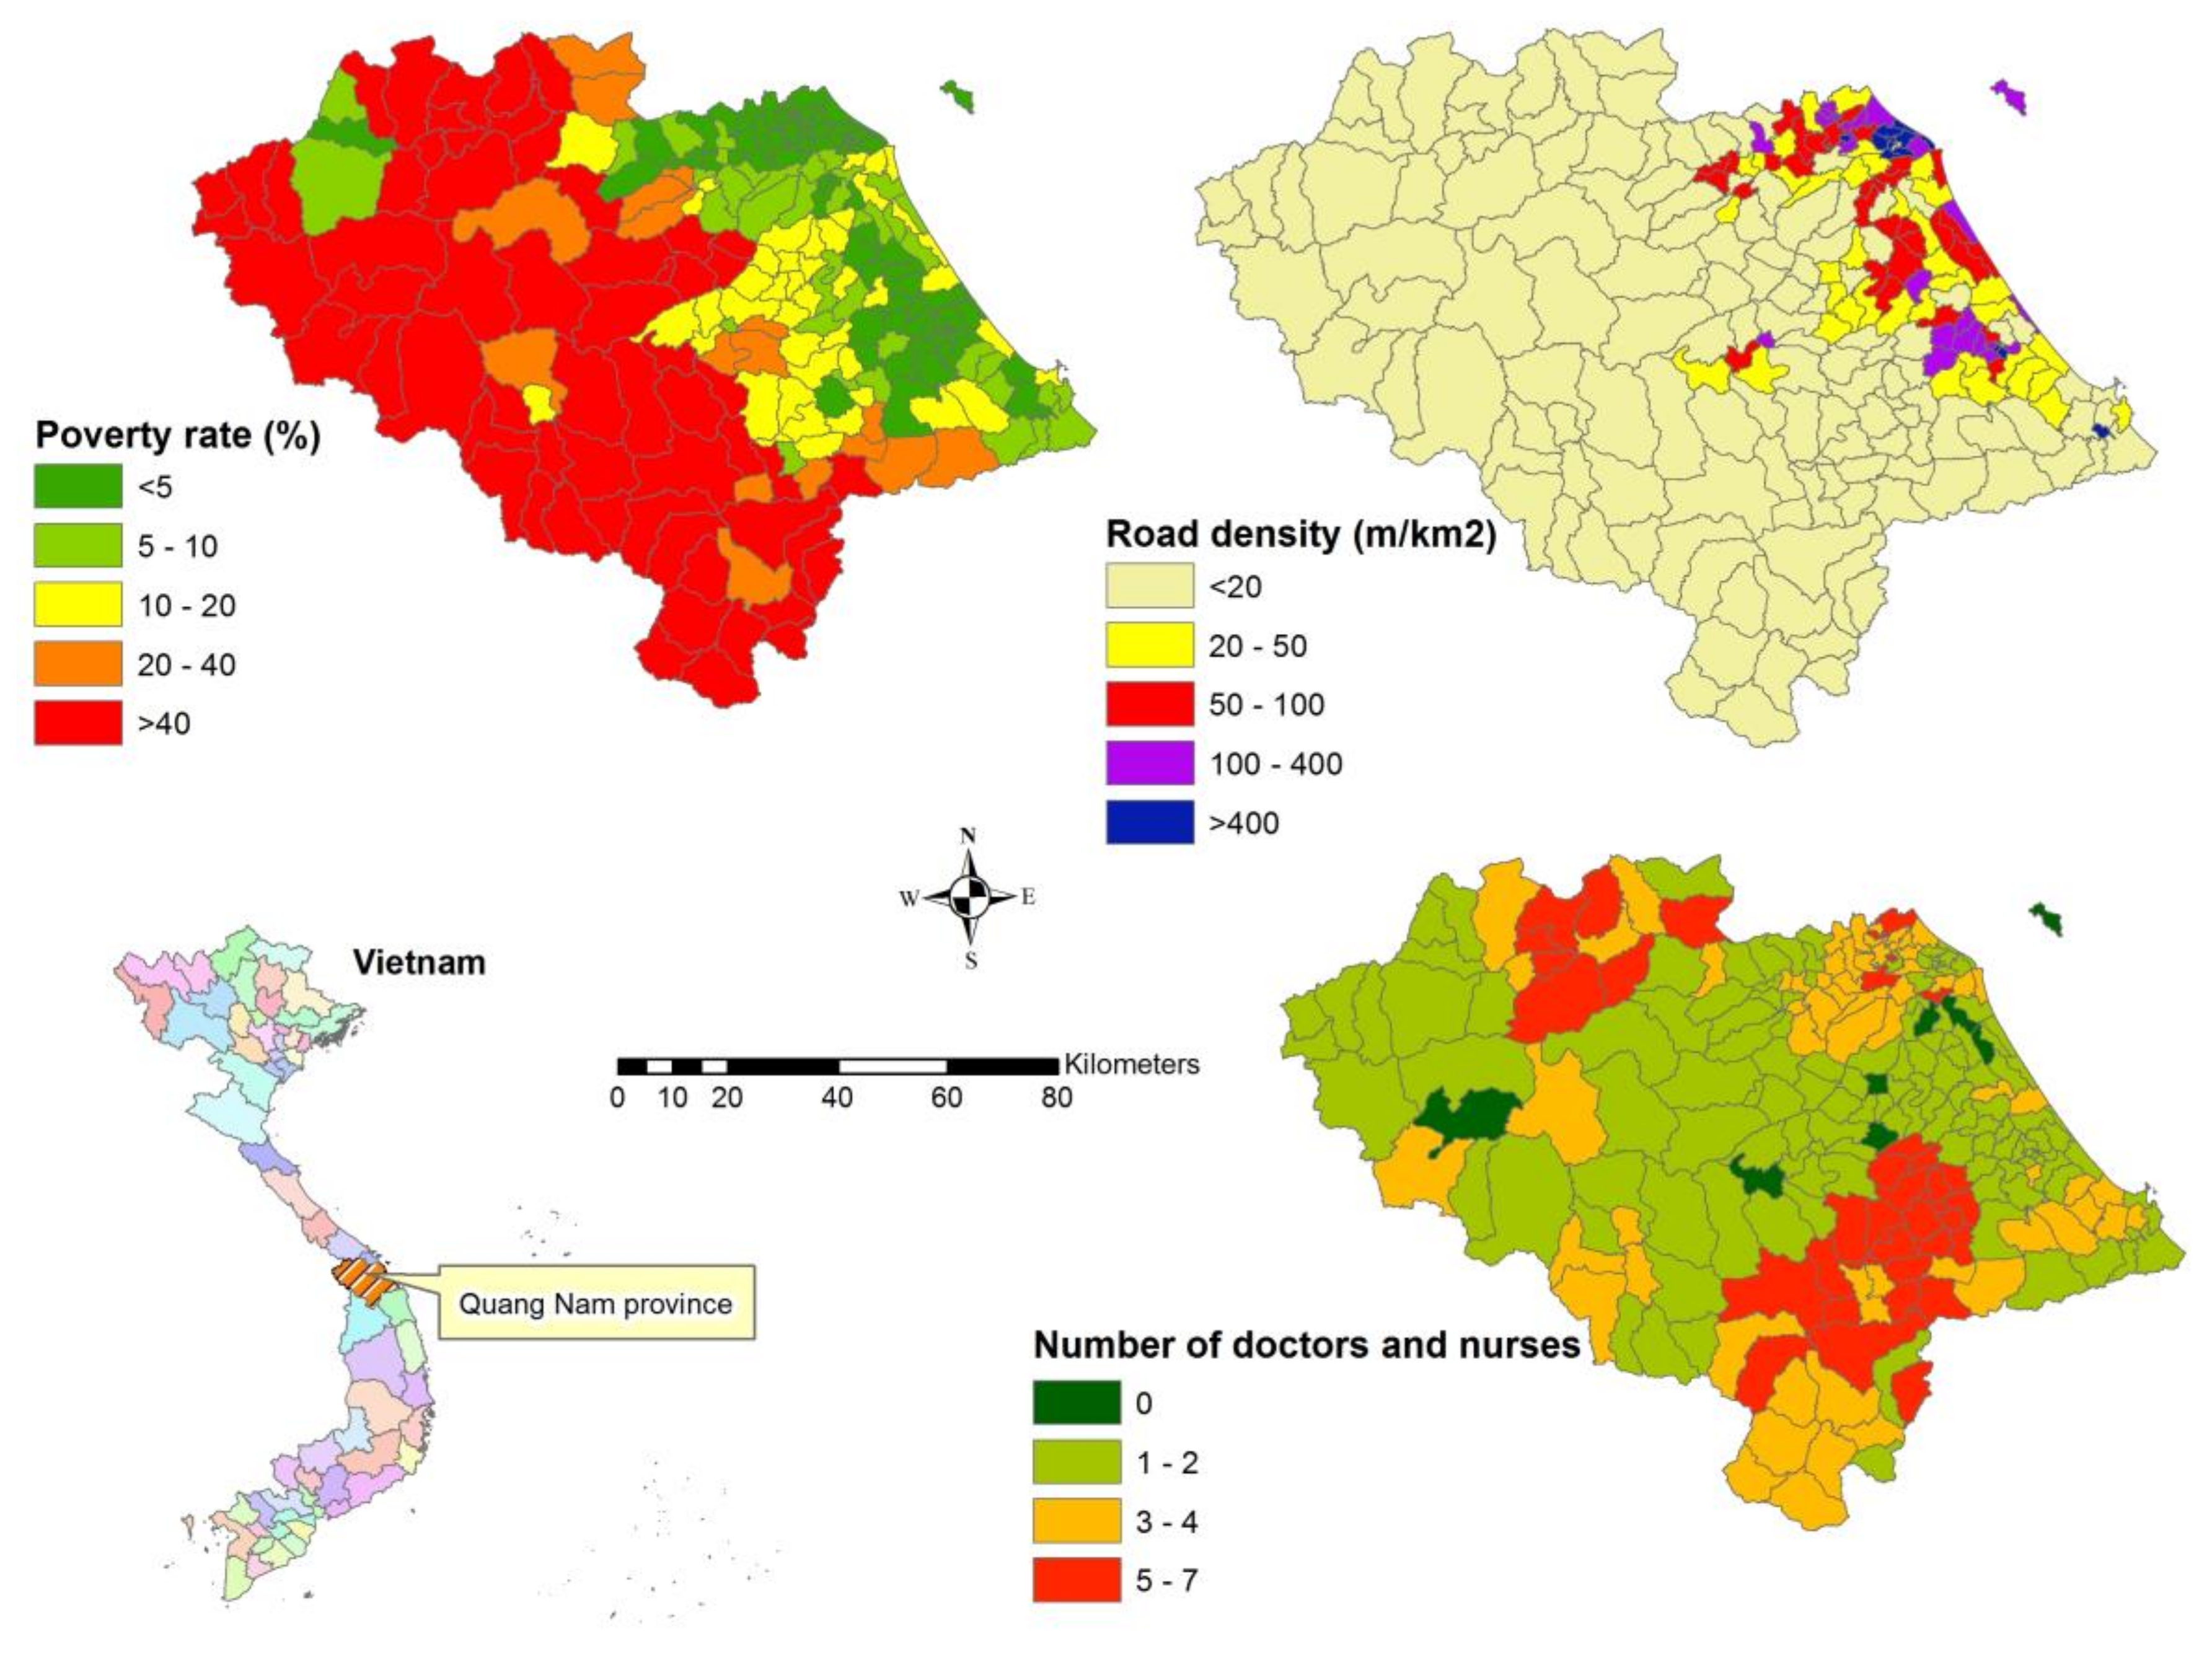
Three criteria are also used in this study to estimate vulnerability; poverty rate, road density, and the number of doctors and nurses. The poor are more likely to be affected by disasters [74], and poverty is often seen as a structural cause of vulnerability. The poverty rate criterion is therefore critical to this study. Infrastructure, such as roads, play a significant role in response (e.g., evacuation) and recovery activities [22], and locations without infrastructure suffer. Meanwhile, understanding the number of healthcare facilities in flood-prone areas is critical to our knowledge of the level of preparedness in an area [22]. Quang Nam province lacks data on the number of hospitals but has data on the number of doctors and nurses in each commune, so this criterion is considered in analysing flood vulnerability. More criteria could be added to analyse flood vulnerability, such as gender, age and persons with disabilities; however, such data is lacking in the research area.
3.3. AHP Judgements
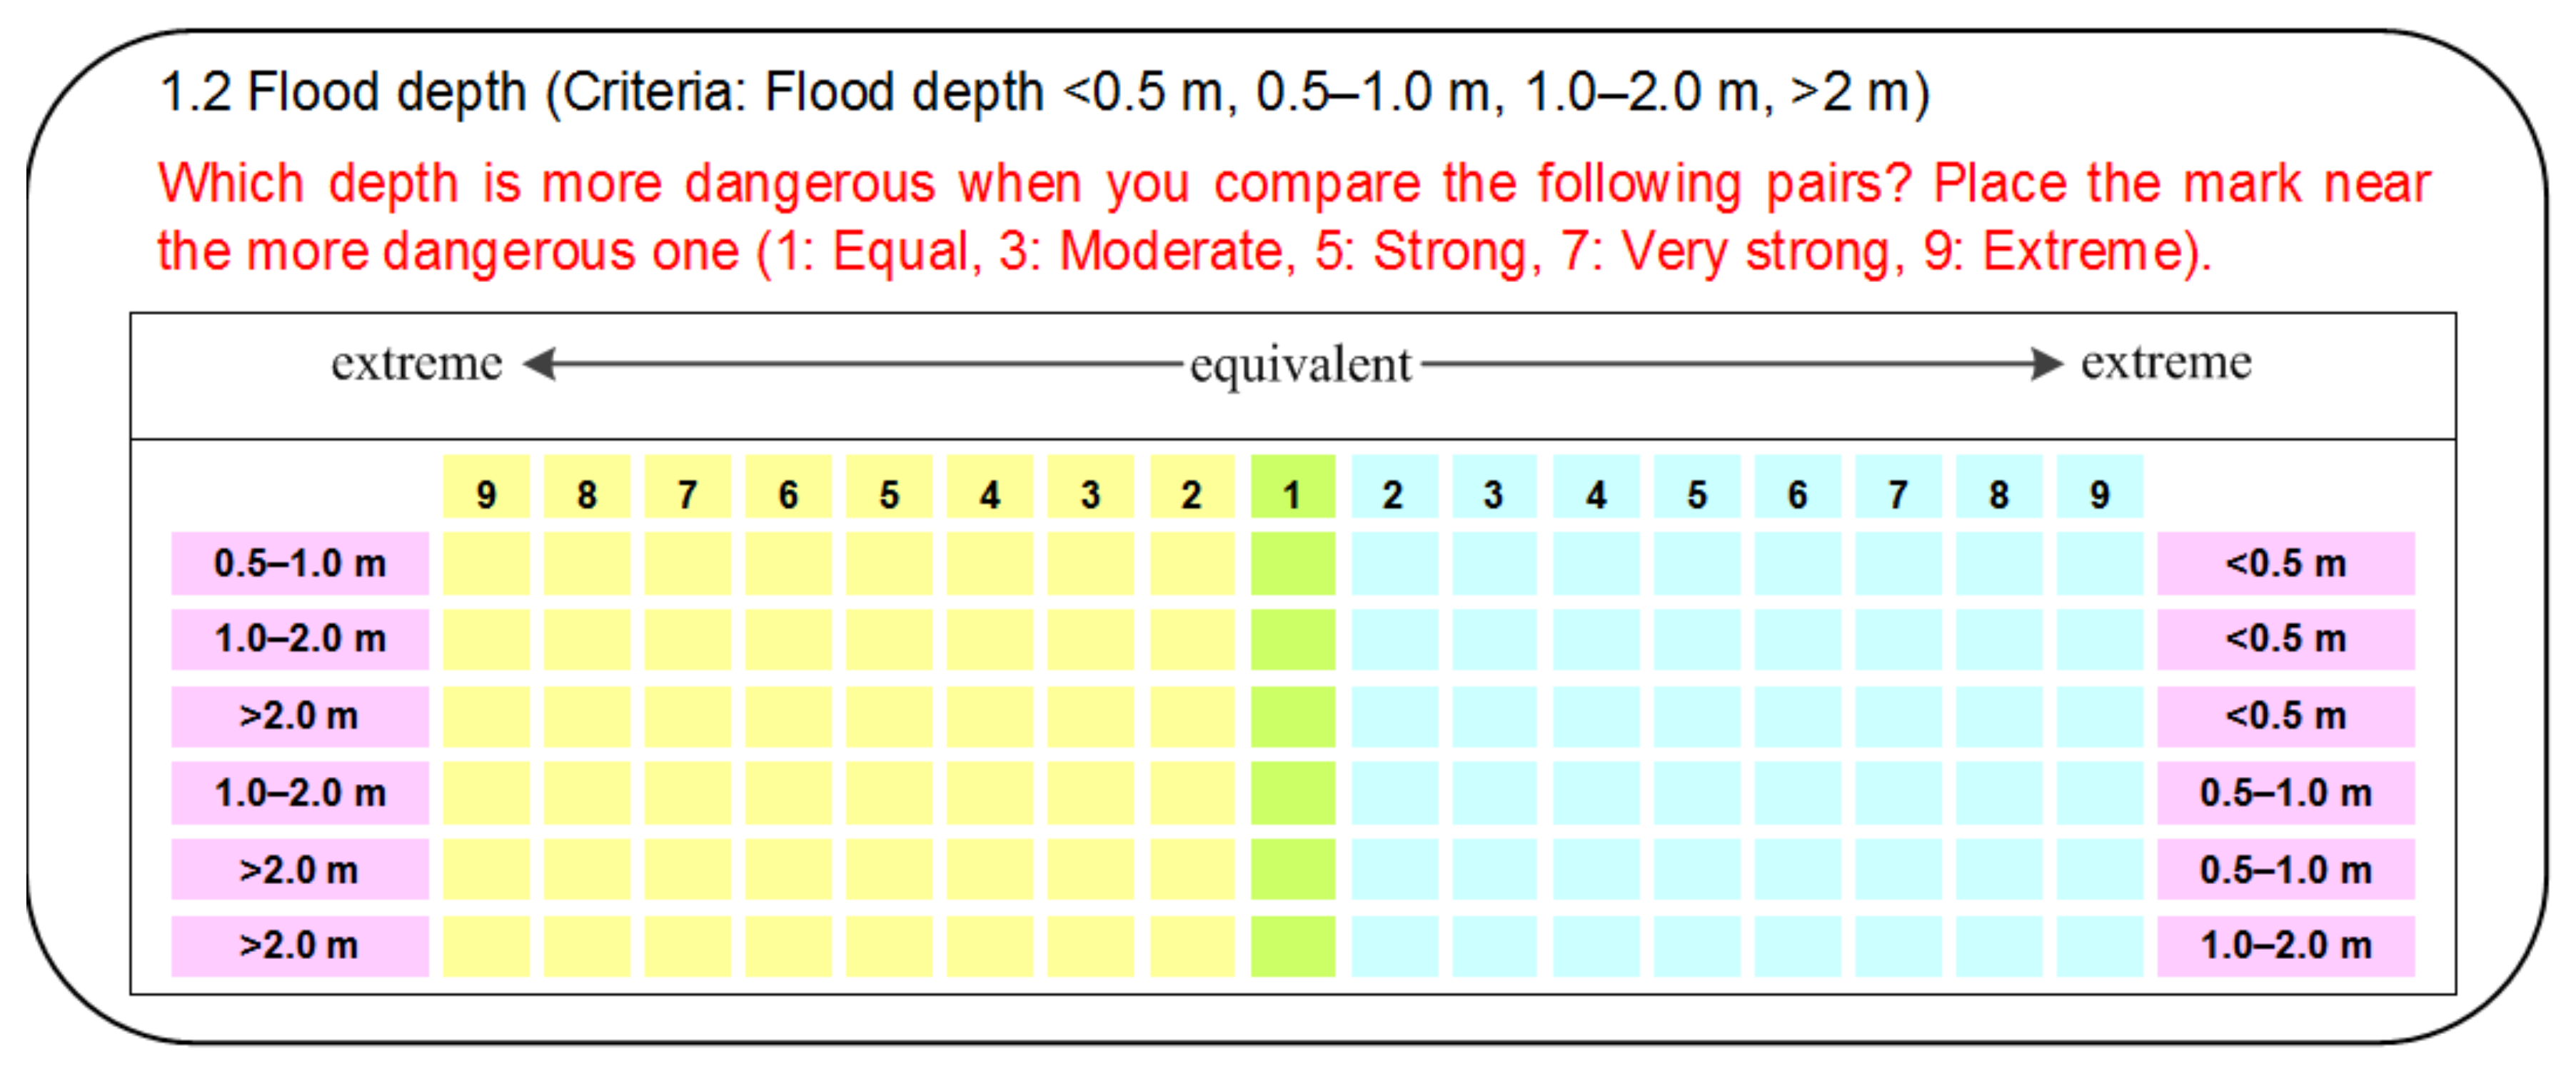
Staff that were working in the local Steering Committees of Natural Disaster Prevention and Control in Quang Nam province were invited to participate in the study and asked to judge the criteria. The invited staff were the heads or vice-heads of committees. The rationale for this is that they are the most knowledgeable and have the most responsibility for local flood risk management activities. The information statements informed invitees that their participation was entirely voluntary and anonymous. We could only recruit two staff suitable for participation; however, AHP can work with a small group. The staff completed the pairwise comparisons via a questionnaire (Figure 4).
After pairwise comparison judgements of each DM meet the consistency requirement of less than 0.1 [76], it is required to combine the judgements of the group. The AHP allows for each DM to specify a value and then combine all of the individual judgements for the final assessment result according to the geometric mean rule of Saaty [77] as in Equation (2).
where
- 1…N are decision makers.
- are judgements of decision makers from 1 to N.
AHP algorithms are calculated via Supperdecisons software [78]. The flood risk indicators weighted by AHP are to be integrated into GIS framework using spatial analysis techniques to produce mapping outputs. WLC is used to aggregate all of the weighted layers by the corresponding criteria and sub-criteria weights [22]. The integrated AHP-WLC approach is employed for creating flood hazard, exposure, vulnerability, and risk maps in the present study.
4. Results
4.1. Flood Exposure
The flood exposure criteria and sub-criteria are displayed in Figure 5, and their weights from AHP judgements are shown in Table 2. The distance to rivers is derived from river network data. The distance to rivers is calculated via the Euclidian Distance tool in ArcGIS software (Figure 5). The more close to rivers is the more severe for flood exposure. Therefore, the highest score is given to the distance of less than 1 km from river systems, and the lowest score is allocated to the distance of greater than 3 km (Table 2). The land-use data contained four categories of homestead and built-up, agricultural land, forest and vegetation, and water bodies. The potential impact of floods is high for homestead and built-up regarding humans and infrastructure, so its relative weight is the highest for this land-use category. The agricultural land has the second highest weight when considering the impact on the community’s livelihood. The water bodies and forest and vegetation have the lowest weights since they do not pose a threat to residents. The population density is calculated as the total population of a commune over its total area (km2). This criterion is directly related to human populations, so it is judged to be more important than the other criteria of the land-use category and distance to rivers. The higher the population density, the higher weight is allocated (Table 2).
4.2. Flood Vulnerability
The flood vulnerability criteria and sub-criteria are shown in Figure 6, and their weights from the AHP judgements are presented in Table 3. Poverty and vulnerability to floods are closely related and mutually reinforced in Vietnam [79]. Table 3 shows that the higher relative importance is allocated to higher poverty rate. The road density is calculated by intersecting road network database with commune boundary feature. The lower road density areas have higher vulnerability scores (Table 3). The lower number of doctors and nurses that the areas has, the higher the vulnerability (Table 3).
4.3. Flood Risk Assessment
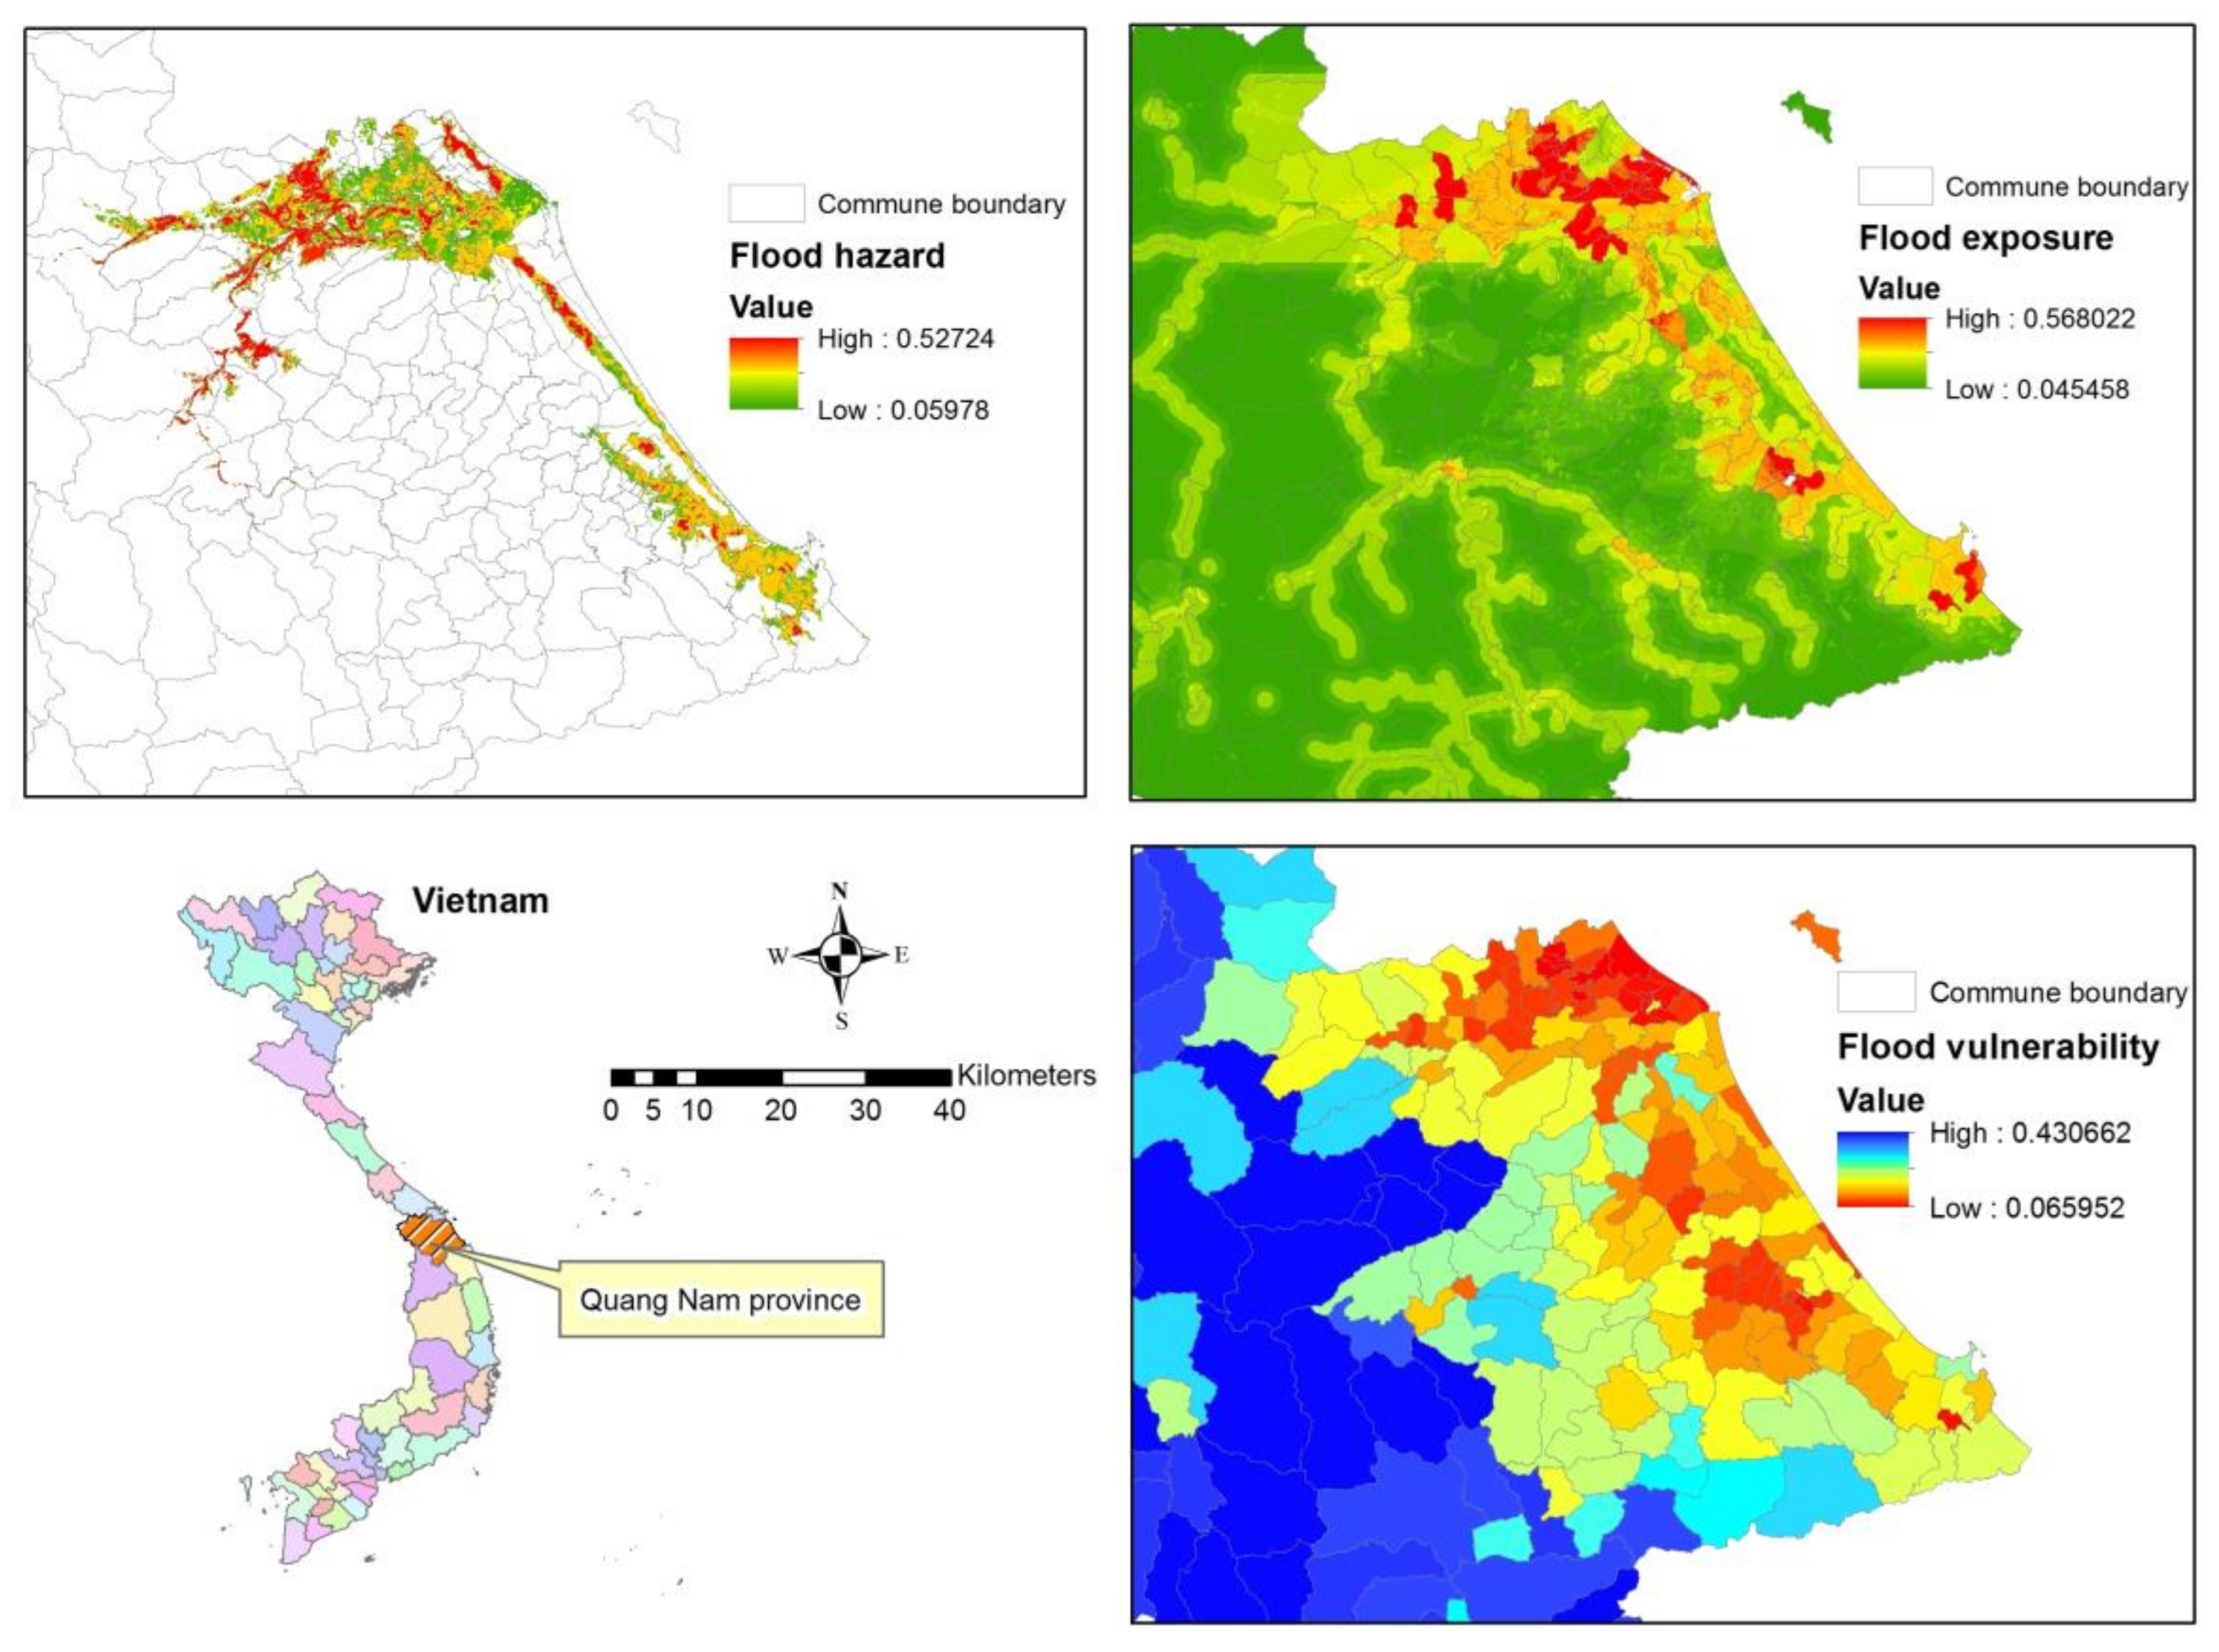
The AHP assessments are integrated into a GIS environment using the Weighted Sum technique in ArcGIS software to create flood hazard, exposure, and vulnerability maps, as in Figure 7. A flood risk map is generated based on a combination of flood hazard, exposure, and vulnerability maps.
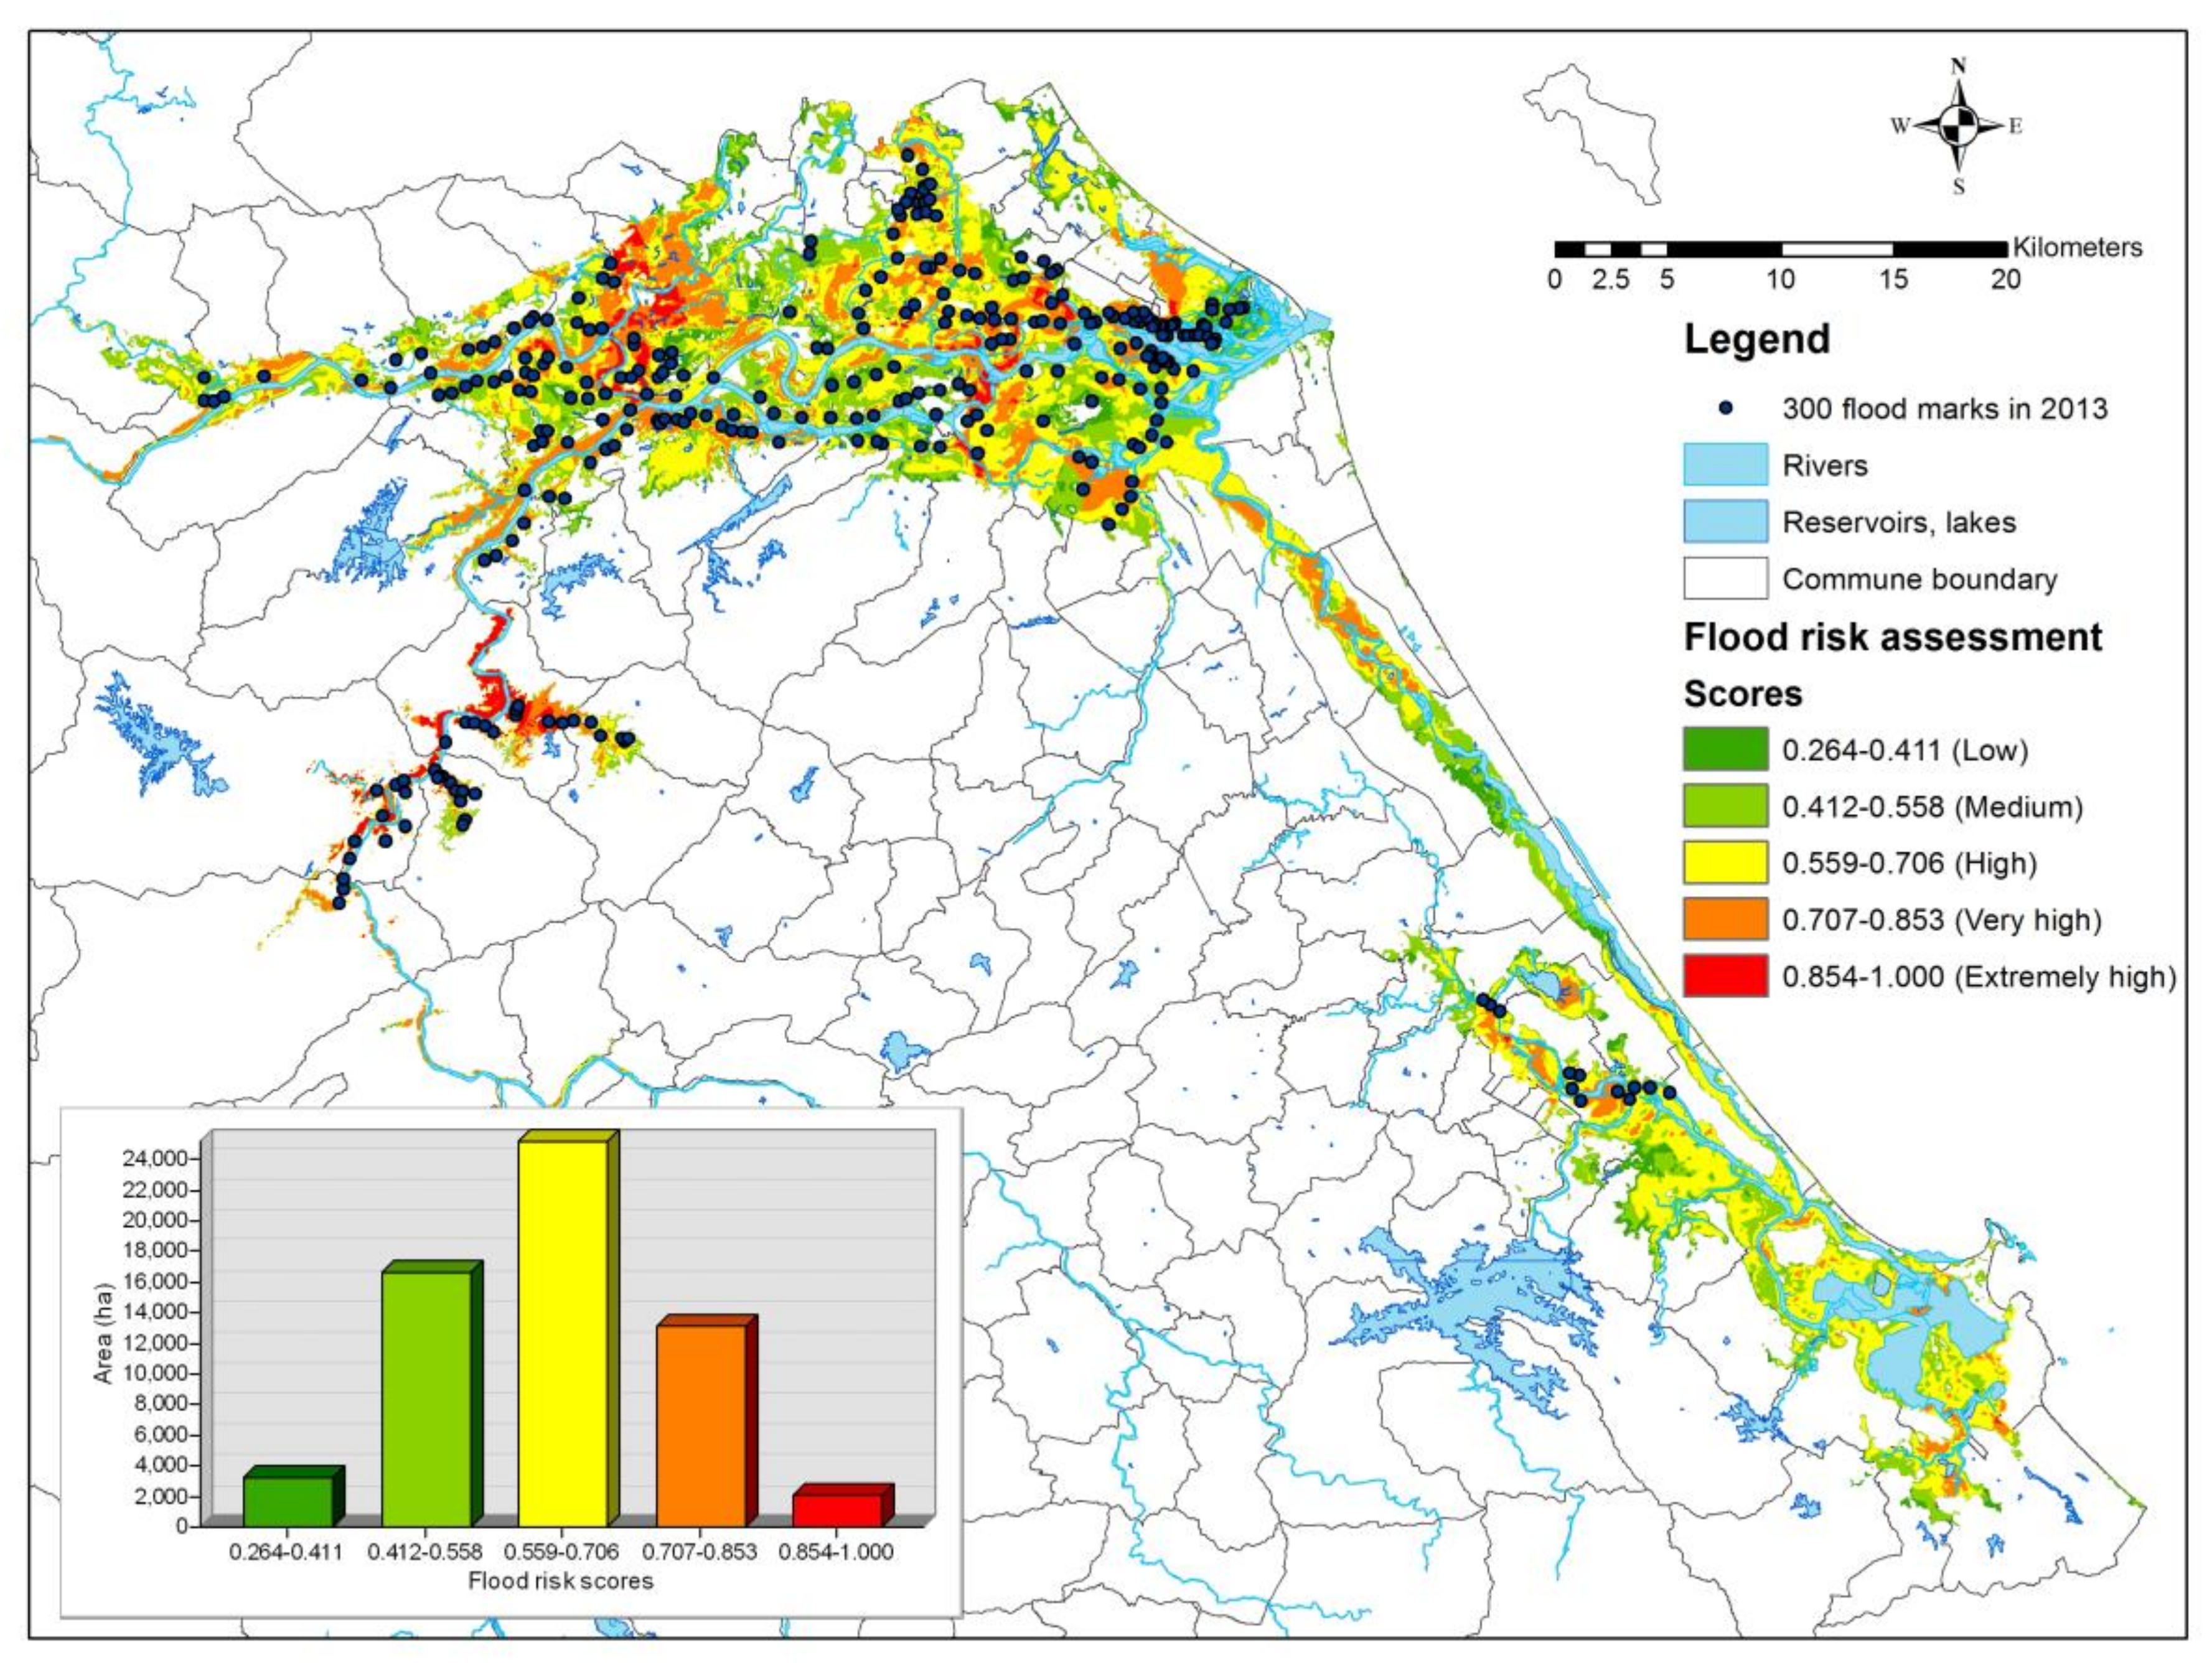
The final flood risk assessment map (Figure 8) is created by integrating flood hazard, exposure, and vulnerability maps. In the map, flood risk scores are normalised to a range of 0–1. Areas that are located near and along rivers are at higher risk of flooding. The total inundation area is 60,327 ha, in which 3291 ha of low risk (0.264–0.411), 16,608 ha of medium risk (0.412–0.558), 25,193 ha of high risk (0.559–0.706), 13,163 ha of very high risk (0.707–0.853), and 2071 ha of extremely high risk (0.854–1.000).
5. Discussion
Flood risk assessment is required to develop effective flood mitigation measures [11]. Understanding risk through risk assessments is essential to the field of disaster risk management. The spatial flood risk assessment is a useful tool for flood risk mitigation measures since the at-risk areas are prioritised [10]. The present study provides a new approach to assess flood risk for a local area, which combines historical flood marks with exposure and vulnerability data in the assessment using spatial multicriteria decision analysis. The applicability of this approach is demonstrated in a case study of Quang Nam, Vietnam in relation to the 2013 flood event.
In this study, flood risk is assessed with the integration of various indicators of flood depth, duration, population density, land use category, distance to rivers, poverty rate, number of doctors and nurses, and road density using AHP and spatial analysis techniques. The AHP model is selected to combine the flood risk components for four reasons: (1) direct DMs opinion involvement, (2) criteria and sub-criteria systematisation, (3) multicriteria decision analysis and GIS combination, and (4) consistency in judgement. Dang et al. [33] used the AHP approach to assess the flood risk for Day river flood diversion area in the North of Vietnam, however, this work did not extend to flood risk mapping. Chau et al. [29] used 86 flood marks of the hazardous 2009 flood and a 30 m DEM resolution to produce a flood inundation map for Quang Nam province, and applied the result for assessing the agricultural impacts. The present study goes further, using the AHP method and spatial techniques to assess flood hazard with flood depth and duration indicators, and combining with flood exposure and vulnerability data to provide an integrated flood risk assessment map.
Floods have severely affected people’s livelihoods and socio-economic development in Quang Nam over the years (Figure 2). Low-land areas along Vu Gia-Thu Bon river basin, including agricultural areas with high population densities, are often subjected to flooding in annual rainy seasons (Figure 8). A local flood risk assessment map is essential, since it can support decision-makers and planners to recognise high-risk areas, develop flood risk management strategies, have appropriate flood risk mitigation measures, and raise public awareness on flood risk [80]. Flood hazard maps can be created via a hydraulic modelling approach, which requires various input data, such as updated river cross-sections and time series meteorological and streamflow data. This is hardly ever applied to data-scarce areas, especially in developing countries, which often lack gauging stations. The present study uses spatial multicriteria decision analysis to integrate historical flood mark data with flood exposure and vulnerability data into a flood risk assessment map. The final flood risk assessment map can enable policy makers and government departments to make judgments about setting priorities for flood mitigation works and to provide potential support for the preparation of flood risk management plans. The map is also essential for accurate communication about the local flood risk situation within floodplain areas; this affects not only government managers but also the affected communities.
This study combines flood mark data with flood exposure and vulnerability data to produce a flood risk assessment map for Quang Nam province. This province is lacking this kind of assessment map [81], and it can be used by local decision-makers in defining specific flood risk management plans. The methodology can also potentially be applied to other provinces to generate flood risk assessment maps using flood mark data.
However, the present study must be interpreted in the context of three main limitations, similar to other MCDM models. First, we could only recruit two DMs in the local steering committees that are suitable for participation, but this limitation is within the acceptable limits of other published studies. The reason is that the AHP model requires a significant number of pairwise comparisons of 55 for our model. This requires much time to read and answer the questionnaires and is particularly difficult for non-academic participants. In Vietnam, the staff working in the local steering committees are local government officials, who work in the committees as a part-time job. While they make key decisions on local flood risk management activities, and always take cognisance of the local flood hazard features to make the most appropriate assessment, they are not academic persons. Second, our model lacks validation, which belongs to the MCDM approach of subjective judgments in weighting indicators [44] and subjective model validation [82]. Third, more data could be added to analyse flood vulnerability, such as gender and persons with disabilities; however, such data is not available in the research area.
6. Conclusions
This study provides a new approach to assess flood risk for Quang Nam province and present the analysis on a GIS-based map, which combines historical flood marks with exposure and vulnerability data in the assessment using spatial multicriteria decision analysis. We develop a flood risk assessment model that is capable of rapidly simulating a flood risk map. The result produces a comprehensive flood risk assessment map for Quang Nam province, which can be utilised by planners and managers to develop flood risk mitigation measures. Our study contributes to a methodology to build flood risk assessment maps using flood mark data, which can be applicable to other provinces in Vietnam. This approach is potentially of particular interest in areas where there is inadequate data for hydraulic modelling.
Acknowledgments
We thank the Quang Nam Provincial Steering Committee of Natural Disaster Prevention and Control and Search and Rescue for providing us with the valuable data. Further thanks go to the officers in the steering committees at provincial, district and commune levels for their sharing of practices and experiences in flood risk management activities. Chinh Luu acknowledges the University of Newcastle International Postgraduate Research Scholarship for her research.
Author Contributions
Chinh Luu developed the concept of this study under the supervision of Jason von Meding. The analysis was carried out by Chinh Luu. Chinh Luu drafted the first version of the manuscript; both authors worked on improving and finalising the manuscript.
Conflicts of Interest
The authors declare no conflict of interest.
References
- Slobodan, P.S. Floods in a Changing Climate: Risk Management; Cambridge University Press: Cambridge, UK, 2012. [Google Scholar]
- Hirabayashi, Y.; Mahendran, R.; Koirala, S.; Konoshima, L.; Yamazaki, D.; Watanabe, S.; Kim, H.; Kanae, S. Global flood risk under climate change. Nat. Clim. Chang. 2013, 3, 816–821. [Google Scholar] [CrossRef]
- Jongman, B.; Winsemius, H.C.; Aerts, J.C.J.H.; Coughlan de Perez, E.; van Aalst, M.K.; Kron, W.; Ward, P.J. Declining vulnerability to river floods and the global benefits of adaptation. Proc. Natl. Acad. Sci. USA 2015, 112, 2271–2280. [Google Scholar] [CrossRef] [PubMed]
- Tanoue, M.; Hirabayashi, Y.; Ikeuchi, H. Global-scale river flood vulnerability in the last 50 years. Sci. Rep. 2016, 6, 36021. [Google Scholar] [CrossRef] [PubMed]
- Brody, S.D.; Zahran, S.; Highfield, W.E.; Grover, H.; Vedlitz, A. Identifying the impact of the built environment on flood damage in Texas. Disasters 2008, 32, 1–18. [Google Scholar] [CrossRef] [PubMed]
- Luu, C.; Von Meding, J.; Kanjanabootra, S.; Pham, D. A Proposed Flood Risk Assessment Method for Central Vietnam. In Proceedings of the 5th International Conference on Building Resilience, Newcastle, Australia, 10–15 July 2015. [Google Scholar]
- WMO. Flood Mapping—Integrated Flood Management Tools Series No. 20; World Meteorological Organization (WMO): Geneva, Switzerland, 2013. [Google Scholar]
- Meyer, V.; Scheuer, S.; Haase, D. A multicriteria approach for flood risk mapping exemplified at the Mulde river, Germany. Nat. Hazards 2009, 48, 17–39. [Google Scholar] [CrossRef]
- Finn, M.P.; Thunen, D. Recent literature in cartography and geographic information science. Cartogr. Geogr. Inf. Sci. 2014, 41, 393–410. [Google Scholar] [CrossRef]
- Foudi, S.; Osés-Eraso, N.; Tamayo, I. Integrated spatial flood risk assessment: The case of Zaragoza. Land Use Policy 2015, 42, 278–292. [Google Scholar] [CrossRef]
- Directive 2007/60/EC. On the Assessment and Management of Flood Risks; European Commission: Brussels, Belgium, 2007. [Google Scholar]
- Dewan, A.; Islam, M.M.; Kumamoto, T.; Nishigaki, M. Evaluating Flood Hazard for Land-Use Planning in Greater Dhaka of Bangladesh Using Remote Sensing and GIS Techniques. Water Resour. Manag. 2007, 21, 1601–1612. [Google Scholar] [CrossRef]
- Jongman, B.; Ward, P.J.; Aerts, J.C.J.H. Global exposure to river and coastal flooding: Long term trends and changes. Glob. Environ. Chang. 2012, 22, 823–835. [Google Scholar] [CrossRef]
- Winsemius, H.C.; Van Beek, L.P.H.; Jongman, B.; Ward, P.J.; Bouwman, A. A framework for global river flood risk assessments. Hydrol. Earth Syst. Sci. 2013, 17, 1871–1892. [Google Scholar] [CrossRef] [Green Version]
- De Moel, H.; van Alphen, J.; Aerts, J.C.J.H. Flood maps in Europe methods, availability and use. Nat. Hazards Earth Syst. Sci. 2009, 9, 289–301. [Google Scholar] [CrossRef] [Green Version]
- Ward, P.J.; Marfai, M.A.; Yulianto, F.; Hizbaron, D.R.; Aerts, J.C.J.H. Coastal inundation and damage exposure estimation: A case study for Jakarta. Nat. Hazards 2010, 56, 899–916. [Google Scholar] [CrossRef]
- Budiyono, Y.; Aerts, J.; Brinkman, J.; Marfai, M.A.; Ward, P. Flood risk assessment for delta mega-cities: A case study of Jakarta. Nat. Hazards 2014, 75, 389–413. [Google Scholar] [CrossRef]
- Kron, W. Flood Risk = Hazard • Values • Vulnerability. Water Int. 2005, 30, 58–68. [Google Scholar] [CrossRef]
- De Moel, H.; Jongman, B.; Kreibich, H.; Merz, B.; Penning-Rowsell, E.; Ward, P.J. Flood risk assessments at different spatial scales. Mitig. Adapt. Strateg. Glob. Chang. 2015. [Google Scholar] [CrossRef]
- De Bruijn, K.M.; Klijn, F.; van de Pas, B.; Slager, C.T.J. Flood fatality hazard and flood damage hazard: Combining multiple hazard characteristics into meaningful maps for spatial planning. Nat. Hazards Earth Syst. Sci. 2015, 15, 1297–1309. [Google Scholar] [CrossRef]
- Malczewski, J. GIS and Multicriteria Decision Analysis; John Wiley & Sons: New York, NY, USA, 1999. [Google Scholar]
- Dewan, A. Floods in a Megacity: Geospatial Techniques in Assessing Hazards, Risk and Vulnerability; Springer: Dordrecht, The Netherlands, 2013. [Google Scholar]
- Malczewski, J.; Rinner, C. Multicriteria Decision Analysis in Geographic Information Science; Springer: Berlin/Heidelberg, Germany, 2015. [Google Scholar]
- Kubal, C.; Haase, D.; Meyer, V.; Scheuer, S. Integrated urban flood risk assessment—Adapting a multicriteria approach to a city. Nat. Hazards Earth Syst. Sci. 2009, 9, 1881–1895. [Google Scholar] [CrossRef]
- Scheuer, S.; Haase, D.; Meyer, V. Exploring multicriteria flood vulnerability by integrating economic, social and ecological dimensions of flood risk and coping capacity: From a starting point view towards an end point view of vulnerability. Nat. Hazards 2011, 58, 731–751. [Google Scholar] [CrossRef]
- Hansson, K.; Danielson, M.; Ekenberg, L.; Buurman, J. Multiple Criteria Decision Making for Flood Risk Management. In Integrated Catastrophe Risk Modeling; Amendola, A., Ermolieva, T., Linnerooth-Bayer, J., Mechler, R., Eds.; Springer: Dordrecht, The Netherlands, 2013; Volume 32, pp. 53–72. [Google Scholar]
- Tran, P.; Marincioni, F.; Shaw, R.; Sarti, M.; Van An, L. Flood risk management in Central Vietnam: Challenges and potentials. Nat. Hazards 2008, 46, 119–138. [Google Scholar] [CrossRef]
- Razafindrabe, B.H.N.; Kada, R.; Arima, M.; Inoue, S. Analyzing flood risk and related impacts to urban communities in central Vietnam. Mitig. Adapt. Strateg. Glob. Chang. 2012, 19, 177–198. [Google Scholar] [CrossRef]
- Chau, V.N.; Holland, J.; Cassells, S.; Tuohy, M. Using GIS to map impacts upon agriculture from extreme floods in Vietnam. Appl. Geogr. 2013, 41, 65–74. [Google Scholar] [CrossRef]
- Chau, V.N.; Cassells, S.; Holland, J. Economic impact upon agricultural production from extreme flood events in Quang Nam, central Vietnam. Nat. Hazards 2014, 75, 1747–1765. [Google Scholar] [CrossRef]
- Chinh, D.T.; Dung, N.V.; Gain, A.K.; Kreibich, H. Flood Loss Models and Risk Analysis for Private Households in Can Tho City, Vietnam. Water 2017, 9, 313. [Google Scholar] [CrossRef]
- Vu, T.V.; Nguyen, H.T.; Nguyen, T.V.; Nguyen, H.V.; Pham, H.T.T.; Nguyen, L.T. Effects of ENSO on Autumn Rainfall in Central Vietnam. Adv. Meteorol. 2015, 2015, 264373. [Google Scholar] [CrossRef]
- Dang, N.M.; Babel, M.S.; Luong, H.T. Evaluation of flood risk parameters in the Day River Flood Diversion Area, Red River Delta, Vietnam. Nat. Hazards 2010, 56, 169–194. [Google Scholar] [CrossRef]
- Saaty, T.L. What is the Analytic Hierarchy Process? In Mathematical Models for Decision Support; Mitra, G., Greenberg, H., Lootsma, F., Rijkaert, M., Zimmermann, H., Eds.; Springer: Berlin/Heidelberg, Germany, 1988; Volume 48, pp. 109–121. [Google Scholar]
- De Brito, M.M.; Evers, M. Multi-criteria decision-making for flood risk management: A survey of the current state of the art. Nat. Hazards Earth Syst. Sci. 2016, 16, 1019–1033. [Google Scholar] [CrossRef]
- Bruun, O. Sending the Right Bill to the Right People: Climate Change, Environmental Degradation, and Social Vulnerabilities in Central Vietnam. Weather Clim. Soc. 2012, 4, 250–262. [Google Scholar] [CrossRef]
- Luu, C.; Von Meding, J.; Kanjanabootra, S. Assessing flood hazard using flood marks and analytic hierarchy process approach: A case study for the 2013 flood event in Quang Nam, Vietnam. Nat. Hazards 2018, 90, 1031–1050. [Google Scholar] [CrossRef]
- Nam, D.H.; Mai, D.T.; Udo, K.; Mano, A. Short-term flood inundation prediction using hydrologic-hydraulic models forced with downscaled rainfall from global NWP. Hydrol. Process. 2014, 28, 5844–5859. [Google Scholar] [CrossRef]
- Duc Le, A.; Thi Thu Vu, L. Climate Change’s Impact on Natural Hazards in Quang Nam Province, Mid-Central Vietnam. In On the Frontiers of Climate and Environmental Change; Bruun, O., Casse, T., Eds.; Springer: Berlin/Heidelberg, Germany, 2013; pp. 91–98. [Google Scholar]
- Ramanathan, R. A note on the use of the analytic hierarchy process for environmental impact assessment. J. Environ. Manag. 2001, 63, 27–35. [Google Scholar] [CrossRef] [PubMed]
- Vaidya, O.S.; Kumar, S. Analytic hierarchy process: An overview of applications. Eur. J. Oper. Res. 2006, 169, 1–29. [Google Scholar] [CrossRef]
- Ishizaka, A.; Labib, A. Analytic Hierarchy Process and Expert Choice: Benefits and limitations. OR Insight 2009, 22, 201–220. [Google Scholar] [CrossRef] [Green Version]
- Koczkodaj, W.W.; Magnot, J.P.; Mazurek, J.; Peters, J.F.; Rakhshani, H.; Soltys, M.; Strzałka, D.; Szybowski, J.; Tozzi, A. On normalization of inconsistency indicators in pairwise comparisons. Int. J. Approx. Reason. 2017, 86, 73–79. [Google Scholar] [CrossRef]
- Schmoldt, D.; Kangas, J.; Mendoza, G.A. Basic Principles of Decision Making in Natural Resources and the Environment. In The Analytic Hierarchy Process in Natural Resource and Environmental Decision Making; Schmoldt, D., Kangas, J., Mendoza, G., Pesonen, M., Eds.; Springer: Dordrecht, The Netherlands, 2001; Volume 3, pp. 1–13. [Google Scholar]
- Carmone, F.J., Jr.; Kara, A.; Zanakis, S.H. A Monte Carlo investigation of incomplete pairwise comparison matrices in AHP. Eur. J. Oper. Res. 1997, 102, 538–553. [Google Scholar] [CrossRef]
- Harker, P.T. Incomplete pairwise comparisons in the analytic hierarchy process. Math. Model. 1987, 9, 837–848. [Google Scholar] [CrossRef]
- Velasquez, M.; Hester, P.T. An analysis of multi-criteria decision making methods. Int. J. Oper. Res. 2013, 10, 56–66. [Google Scholar]
- Chen, K.; Blong, R.; Jacobson, C. MCE-RISK: Integrating multicriteria evaluation and GIS for risk decision-making in natural hazards. Environ. Model. Softw. 2001, 16, 387–397. [Google Scholar] [CrossRef]
- Kokangül, A.; Polat, U.; Dağsuyu, C. A new approximation for risk assessment using the AHP and Fine Kinney methodologies. Saf. Sci. 2017, 91, 24–32. [Google Scholar] [CrossRef]
- Kienberger, S.; Lang, S.; Zeil, P. Spatial vulnerability units—Expert-based spatial modelling of socio-economic vulnerability in the Salzach catchment, Austria. Nat. Hazards Earth Syst. Sci. 2009, 9, 767–778. [Google Scholar] [CrossRef]
- Olson, D.L. Comparison of weights in TOPSIS models. Math. Comput. Model. 2004, 40, 721–727. [Google Scholar] [CrossRef]
- Mojtahedi, S.M.H.; Oo, B.L. Coastal buildings and infrastructure flood risk analysis using multi-attribute decision-making. J. Flood Risk Manag. 2016, 9, 87–96. [Google Scholar] [CrossRef]
- Saaty, T.L. How to make a decision: The analytic hierarchy process. Eur. J. Oper. Res. 1990, 48, 9–26. [Google Scholar] [CrossRef]
- Godfrey, A.; Ciurean, R.L.; van Westen, C.J.; Kingma, N.C.; Glade, T. Assessing vulnerability of buildings to hydro-meteorological hazards using an expert based approach—An application in Nehoiu Valley, Romania. Int. J. Disaster Risk Reduct. 2015, 13, 229–241. [Google Scholar] [CrossRef]
- Plattner, T.; Plapp, T.; Hebel, B. Integrating public risk perception into formal natural hazard risk assessment. Nat. Hazards Earth Syst. Sci. 2006, 6, 471–483. [Google Scholar] [CrossRef]
- Zou, Q.; Zhou, J.; Zhou, C.; Song, L.; Guo, J. Comprehensive flood risk assessment based on set pair analysis-variable fuzzy sets model and fuzzy AHP. Stoch. Environ. Res. Risk Assess. 2012, 27, 525–546. [Google Scholar] [CrossRef]
- Papaioannou, G.; Vasiliades, L.; Loukas, A. Multi-Criteria Analysis Framework for Potential Flood Prone Areas Mapping. Water Resour. Manag. 2014, 29, 399–418. [Google Scholar] [CrossRef]
- Kandilioti, G.; Makropoulos, C. Preliminary flood risk assessment: The case of Athens. Nat. Hazards 2012, 61, 441–468. [Google Scholar] [CrossRef]
- Li, G.-F.; Xiang, X.-Y.; Tong, Y.-Y.; Wang, H.-M. Impact assessment of urbanization on flood risk in the Yangtze River Delta. Stoch. Environ. Res. Risk Assess. 2013, 27, 1683–1693. [Google Scholar] [CrossRef]
- Maaskant, B.; Jonkman, S.N.; Bouwer, L.M. Future risk of flooding: An analysis of changes in potential loss of life in South Holland (The Netherlands). Environ. Sci. Policy 2009, 12, 157–169. [Google Scholar] [CrossRef]
- Crichton, D. The Risk Triangle. In Natural Disaster Management; Ingleton, J., Ed.; Tudor Rose Holdings Limited: Leicester, UK, 1999; pp. 102–103. [Google Scholar]
- UNISDR. Global Assessment Report on Disaster Risk Reduction. 2015. Available online: https://www.unisdr.org/we/inform/publications/42809 (accessed on 5 June 2017).
- Field, C.B.; Barros, V.; Stocker, T.F.; Qin, D.; Dokken, D.J.; Ebi, K.L.; Mastrandrea, M.D.; Mach, K.J.; Plattner, G.-K.; Allen, S.K.; et al. Managing the Risks of Extreme Events and Disasters to Advance Climate Change Adaptation. A Special Report of Working Groups I and II of the Intergovernmental Panel on Climate Change (IPCC); Cambridge University Press: Cambridge, UK; New York, NY, USA, 2012. [Google Scholar]
- Kobayashi, Y.; Porter, J.W. Flood Risk Management in the People’s Republic of China: Learning to Live with Flood Risk; Asian Development Bank: Mandaluyong City, Philippines, 2012. [Google Scholar]
- Gain, A.K.; Mojtahed, V.; Biscaro, C.; Balbi, S.; Giupponi, C. An integrated approach of flood risk assessment in the eastern part of Dhaka City. Nat. Hazards 2015, 79, 1499–1530. [Google Scholar] [CrossRef]
- Ronco, P.; Bullo, M.; Torresan, S.; Critto, A.; Olschewski, R.; Zappa, M.; Marcomini, A. KULTURisk regional risk assessment methodology for water-related natural hazards—Part 2: Application to the Zurich case study. Hydrol. Earth Syst. Sci. 2015, 19, 1561–1576. [Google Scholar] [CrossRef] [Green Version]
- Boudou, M.; Lang, M.; Vinet, F.; Cœur, D. Comparative hazard analysis of processes leading to remarkable flash floods (France, 1930–1999). J. Hydrol. 2016, 541, 533–552. [Google Scholar] [CrossRef]
- Te Linde, A.H.; Bubeck, P.; Dekkers, J.E.C.; de Moel, H.; Aerts, J.C.J.H. Future flood risk estimates along the river Rhine. Nat. Hazards Earth Syst. Sci. 2011, 11, 459–473. [Google Scholar] [CrossRef] [Green Version]
- Ouma, Y.; Tateishi, R. Urban Flood Vulnerability and Risk Mapping Using Integrated Multi-Parametric AHP and GIS: Methodological Overview and Case Study Assessment. Water 2014, 6, 1515–1545. [Google Scholar] [CrossRef]
- Penning-Rowsell, E.; Floyd, P.; Ramsbottom, D.; Surendran, S. Estimating Injury and Loss of Life in Floods: A Deterministic Framework. Nat. Hazards 2005, 36, 43–64. [Google Scholar] [CrossRef]
- Terti, G.; Ruin, I.; Gourley, J.J.; Kirstetter, P.; Flamig, Z.; Blanchet, J.; Arthur, A.; Anquetin, S. Toward Probabilistic Prediction of Flash Flood Human Impacts. Risk Anal. 2017. [Google Scholar] [CrossRef] [PubMed]
- Wang, Y.; Li, Z.; Tang, Z.; Zeng, G. A GIS-Based Spatial Multi-Criteria Approach for Flood Risk Assessment in the Dongting Lake Region, Hunan, Central China. Water Resour. Manag. 2011, 25, 3465–3484. [Google Scholar] [CrossRef]
- Peduzzi, P.; Dao, H.; Herold, C.; Mouton, F. Assessing global exposure and vulnerability towards natural hazards: The Disaster Risk Index. Nat. Hazards Earth Syst. Sci. 2009, 9, 1149–1159. [Google Scholar] [CrossRef]
- Winsemius, H.C.; Jongman, B.; Veldkamp, T.; Hallegatte, S.; Bangalore, M.; Ward, P. Disaster Risk, Climate Change, and Poverty: Assessing the Global Exposure of Poor People to Floods and Droughts; The World Bank: Washington, DC, USA, 2015. [Google Scholar]
- Bouwer, L.M.; Bubeck, P.; Aerts, J.C.J.H. Changes in future flood risk due to climate and development in a Dutch polder area. Glob. Environ. Chang. 2010, 20, 463–471. [Google Scholar] [CrossRef]
- Saaty, T.L. A scaling method for priorities in hierarchical structures. J. Math. Psychol. 1977, 15, 234–281. [Google Scholar] [CrossRef]
- Saaty, T.L. Group Decision Making and the AHP. In The Analytic Hierarchy Process; Golden, B., Wasil, E., Harker, P., Eds.; Springer: Berlin/Heidelberg, Germany, 1989; pp. 59–67. [Google Scholar]
- Whitaker, R.; Adams, W. Developers of Superdecisions Software; Decisions Foundation: Pittsburgh, PA, USA, 2005. [Google Scholar]
- Tran, P.; Shaw, R.; Chantry, G.; Norton, J. GIS and local knowledge in disaster management: A case study of flood risk mapping in Viet Nam. Disasters 2009, 33, 152–169. [Google Scholar] [CrossRef] [PubMed]
- Vojinovic, Z. Flood Risk: The Holistic Perspective—From Integrated to Interactive Planning for Flood Resilience; IWA Publishing: London, UK, 2015. [Google Scholar]
- Luu, C.; Von Meding, J.; Kanjanabootra, S. Flood risk management activities in Vietnam: A study of local practice in Quang Nam province. Int. J. Disaster Risk Reduct. 2018. [Google Scholar] [CrossRef]
- De Brito, M.M.; Evers, M.; Almoradie, A.D.S. Participatory flood vulnerability assessment: A multi-criteria approach. Hydrol. Earth Syst. Sci. 2018, 22, 373–390. [Google Scholar] [CrossRef]
Figure 1.
The location of study area, Quang Nam province and flood hazard mapping created by Luu et al. [37].
Figure 1.
The location of study area, Quang Nam province and flood hazard mapping created by Luu et al. [37].

Figure 2.
Flood impacts in Quang Nam province between 1997 and 2015 (compiled from flood damage data provided by Quang Nam Provincial Steering Committee on Natural Disaster Prevention and Control).
Figure 2.
Flood impacts in Quang Nam province between 1997 and 2015 (compiled from flood damage data provided by Quang Nam Provincial Steering Committee on Natural Disaster Prevention and Control).

Figure 3.
Decision hierarchy model to measure the flood risk for Quang Nam province.

Figure 4.
An example of Analytic Hierarchy Process (AHP) pairwise comparisons.

Figure 5.
Distribution of flood exposure criteria and sub-criteria.

Figure 6.
Distribution of flood vulnerability criteria and sub-criteria.

Figure 7.
Spatial analysis of flood hazard, exposure and vulnerability for Quang Nam province.

Figure 8.
Spatial flood risk assessment of Quang Nam province.


Table 1.
Criteria and its sources for assessing flood hazard, vulnerability, and exposure.
| Component | Criteria | Source |
|---|---|---|
| Flood hazard | Depth | Zou et al. [56], Dewan [22], Foudi et al. [10], Gain et al. [65], Ronco et al. [66] |
| Duration | Boudou et al. [67], Chinh et al. [31] | |
| Flood exposure | Land-use | te Linde et al. [68], Zou et al. [56], Dewan [22], Ouma and Tateishi [69], Gain et al. [65], Ronco et al. [66] |
| Distance to rivers | Penning-Rowsell et al. [70], Dewan [22], Terti et al. [71] | |
| Population density | Wang et al. [72], Peduzzi et al. [73], Zou et al. [56], Dewan [22], Gain et al. [65], Ronco et al. [66] | |
| Flood vulnerability | Poverty rate | Tran et al. [27], Dewan [22], Winsemius et al. [74] |
| Road density | Scheuer et al. [25], Dewan [22], Ronco et al. [66] | |
| Number of doctors and nurses | Scheuer et al. [25], Dewan [22] |
Table 2.
Decision hierarchy model for flood exposure indicators.
| Component | Criteria | Weight | Sub-Criteria | Weight |
|---|---|---|---|---|
| Flood exposure | Land-use category | 0.135 | Homestead and built-up | 0.670 |
| Agricultural land | 0.201 | |||
| Water bodies | 0.082 | |||
| Forest and vegetation | 0.047 | |||
| Distance to rivers (km) | 0.253 | <1 | 0.608 | |
| 1–2 | 0.229 | |||
| 2–3 | 0.110 | |||
| >3 | 0.053 | |||
| Population density (km2) | 0.612 | <=50 | 0.042 | |
| 51–200 | 0.065 | |||
| 201–500 | 0.114 | |||
| 501–1000 | 0.250 | |||
| >1000 | 0.529 |
Table 3.
Decision hierarchy model for flood vulnerability indicators.
| Component | Criteria | Weight | Sub-Criteria | Weight |
|---|---|---|---|---|
| Flood vulnerability | Poverty rate (%) | 0.577 | <5 | 0.062 |
| 5–10 | 0.097 | |||
| 10–20 | 0.160 | |||
| 20–40 | 0.262 | |||
| >40 | 0.419 | |||
| Road density (m/km2) | 0.298 | <20 | 0.438 | |
| 20–50 | 0.256 | |||
| 50–100 | 0.149 | |||
| 100–400 | 0.096 | |||
| >400 | 0.061 | |||
| Number of doctors and nurses | 0.125 | 0 | 0.467 | |
| 1–2 | 0.277 | |||
| 3–4 | 0.160 | |||
| 5–7 | 0.096 |
© 2018 by the authors. Licensee MDPI, Basel, Switzerland. This article is an open access article distributed under the terms and conditions of the Creative Commons Attribution (CC BY) license (http://creativecommons.org/licenses/by/4.0/).
Share and Cite
MDPI and ACS Style
Luu, C.; Von Meding, J. A Flood Risk Assessment of Quang Nam, Vietnam Using Spatial Multicriteria Decision Analysis. Water 2018, 10, 461. https://doi.org/10.3390/w10040461
AMA Style
Luu C, Von Meding J. A Flood Risk Assessment of Quang Nam, Vietnam Using Spatial Multicriteria Decision Analysis. Water. 2018; 10(4):461. https://doi.org/10.3390/w10040461
Chicago/Turabian StyleLuu, Chinh, and Jason Von Meding. 2018. "A Flood Risk Assessment of Quang Nam, Vietnam Using Spatial Multicriteria Decision Analysis" Water 10, no. 4: 461. https://doi.org/10.3390/w10040461
Note that from the first issue of 2016, this journal uses article numbers instead of page numbers. See further details here.