Meteorological Driving Mechanisms and Human Impacts of the February 1979 Extreme Hydro-Geomorphological Event in Western Iberia


1
Instituto Dom Luiz, Faculdade de Ciências, Universidade de Lisboa, 1749-016 Lisboa, Portugal
2
Centre for Geographical Studies, Institute of Geography and Spatial Planning, Universidade de Lisboa, 1600-276 Lisboa, Portugal
*
Author to whom correspondence should be addressed.
Water 2018, 10(4), 454; https://doi.org/10.3390/w10040454
Submission received: 12 March 2018
/
Revised: 4 April 2018
/
Accepted: 5 April 2018
/
Published: 10 April 2018
(This article belongs to the Special Issue Selected Papers from the 1st International Electronic Conference on the Hydrological Cycle (ChyCle-2017))
Abstract
:The large number of floods and landslides that occurred on 5–16 February 1979 in Portugal was a major hydro-geomorphologic extreme event according to the DISASTER database in terms of number of displaced people. The February 1979 event is the top ranked episode in terms of the total number of evacuated people (4244), displaced people (14,322) and also on the number of days of event duration (12 days) for the period 1865–2015. In this event, 62 damaging floods and five damaging landslides causing eight fatalities were recorded in Portugal. This event was driven by an unusually intense atmospheric forcing mechanism acting at different time scales. Despite the intense magnitude and the widespread impact on the population, this event has not been studied in detail. In this study, we show that the precipitation period of February 1979 had produced several multi-day accumulated precipitation events over the Portuguese continental territory, ranking among the top 10 events observed between 1950–2008. Additionally, most of the precipitation from this event occured in days in which atmospheric circulation was dominated by “wet” circulation weather types (CWTs), namely, cyclonic (C), west (W) or southwest (SW) types.
1. Introduction
It has been well known that extreme precipitation events in Portugal occurring during the extended winter months (October-March) are often associated with landslides and flooding in the major river basins [1,2,3] and, with flash floods in small watersheds or urban areas [4,5] which can produce socio-economic impacts. Thus, in order to prevent and manage the associated effects and risks, there is a clear need for better characterization of the associated extreme meteorological metrics and the nature of likely unusual strong atmospheric driving mechanisms.
The characterization of past floods and landslides with important human consequences in Portugal since 1865 to present has been undertaken recently, within the context of the DISASTER project [1]. Using this database, some event specific studies [1,2,4,6] have been published with the purpose of characterizing the respective meteorological drivers and the related weather circulation conditions present at both the meso- and synoptic-scales. Flood and landslide DISASTER events with significant economic and human impacts are usually associated with precipitation events co-located with specific Circulation Weather Types (CWTs) and sometimes combined with Atmospheric Rivers (ARs). CWTs are composite-averaged characteristics of the synoptic scale patterns of circulation occurring over a given region of the globe, estimated using a set of indices associated with the direction and vorticity of the geostrophic flow. Several studies have shown that daily precipitation in Portugal in winter is strongly related to the occurrence of the three wettest CWTs, namely the cyclonic (C), south-westerly (SW) and westerly (W) types. These three CWTs occur on average 20% of the winter season days but are responsible for more than 50% of the winter mean monthly precipitation [7,8]. Most of the precipitation is produced by just a few CWTs that contribute to a large percentage of the mean monthly precipitation in most areas of the Iberian Peninsula. Their efficiency, however, can vary, with the Cyclonic and the Directional types (those with a western component) being the most efficient WTs [8].
In addition, ARs are often responsible for extreme precipitation over the Iberian Peninsula [9], being frequently associated with well-known DISASTER events, such as the December 1909 record flood in river Douro [1]. ARs are transient filamentary regions of highly concentrated water vapour affected by strong low-level winds that occur within the warm conveyor belt of extratropical cyclones. These moisture transport structures typically occur as long (about 2000 Km) and narrow (300–500 km) bands of enhanced water vapour flux at the lower troposphere and are responsible for most of the water vapour transported meridionally across the mid-latitudes, as well as for most of the poleward water vapour transport [10]. Additionally, due to their narrow nature, the ARs latitudinal location over the Iberian Peninsula is highly determinative of their contribution to extreme daily precipitation events over Minho, Douro and Tagus basins [9].
In this work, we have selected the top ranked event in the DISASTER database regarding the total number of affected people not only in Portugal but also in the Tagus basin (18,578 and 9861, respectively), that occurred in 5–16 February 1979. This extreme event had a major socio-economic impact in Portugal when compared with all the DISASTER events that occurred during the entire 150-year long period of data spanning between 1865–2015. Despite the relevance of the February 1979 major floods in the lower section of the Tagus river basin, this event was never evaluated in detail, to the best of our knowledge, in terms of the human impacts assessment, characterization of the spatial and temporal extent of the precipitation event, and the atmospheric circulation pattern characteristics that led to its occurrence.
Accordingly, this work has two main goals: (1) to perform a comprehensive characterization of the socio-economic impacts and spatial distribution of the February 1979 hydro-geomorphologic DISASTER event over Portugal and (2) to analyse the atmospheric circulation conditions associated with such an extreme event and the spatial distribution of the precipitation anomalies over Western Iberia.
2. Materials and Methods
2.1. Historical Data Sources
The description of the human impacts caused by the February 1979 event were obtained from the DISASTER Database, updated for the period 1865–2015. This is a comprehensive dataset of damaging flood and landslide cases in Portugal produced from information available in Portuguese newspapers with national and regional spatial incidence [11]. The entry criteria for this database is the following: any flood or landslide that, independently of the number of affected people, caused casualties, injuries, evacuated or homeless people as reported in national and/or regional newspapers [11]. In general, such large databases as the DISASTER which were built using newspapers have certain biases and can be incomplete [11]. According to previous studies, documental sources may stress catastrophic events and present inconsistencies in the quality and quantity of the disasters reported that can either result from the triggering factors changing or from the database incompleteness [12,13]. However, the DISASTER database is a good source of information to obtain temporal and spatial distribution of impacts caused by damaging floods and landslides. Data collection of disaster impacts based on documentary sources showed higher reliability in temporal distribution than for the spatial distribution of cases [1].
A DISASTER case is a unique hydro-geomorphologic occurrence which fulfils the DISASTER database criteria and is related to a unique space location and a specific period. Each DISASTER case includes details on the physical process (flood or landslide) characteristics and on its associated human and structural damages. Additionally, DISASTER cases are presented using a point shapefile [11]. DISASTER cases are further grouped into a more restricted number of DISASTER events sharing the same mechanism trigger in time, according to the following criteria: (1) include at least three DISASTER cases; (2) include DISASTER cases with three or fewer interval days; and (3) DISASTER events must have spatial coherence [14].
In this work, two daily newspapers were explored for the February 1979 flood and landslide cases data collection. The oldest is the “Diário de Notícias” (1865–2015) newspaper, which has a national distribution and a spatial incidence of news located mainly in the Lisbon metropolitan area and Tagus valley region. The other newspaper, “Jornal de Notícias” (1888–2015) has a more regional distribution in the North of the country, especially in the Porto metropolitan area. More than a half of the DISASTER cases relative to this event were collected from the “Diário de Notícias”. Additionally, all DISASTER cases were located with a point shapefile in GIS and 65.7% were located with very high accuracy (≥1:10,000 scale).
2.2. River Flow Data
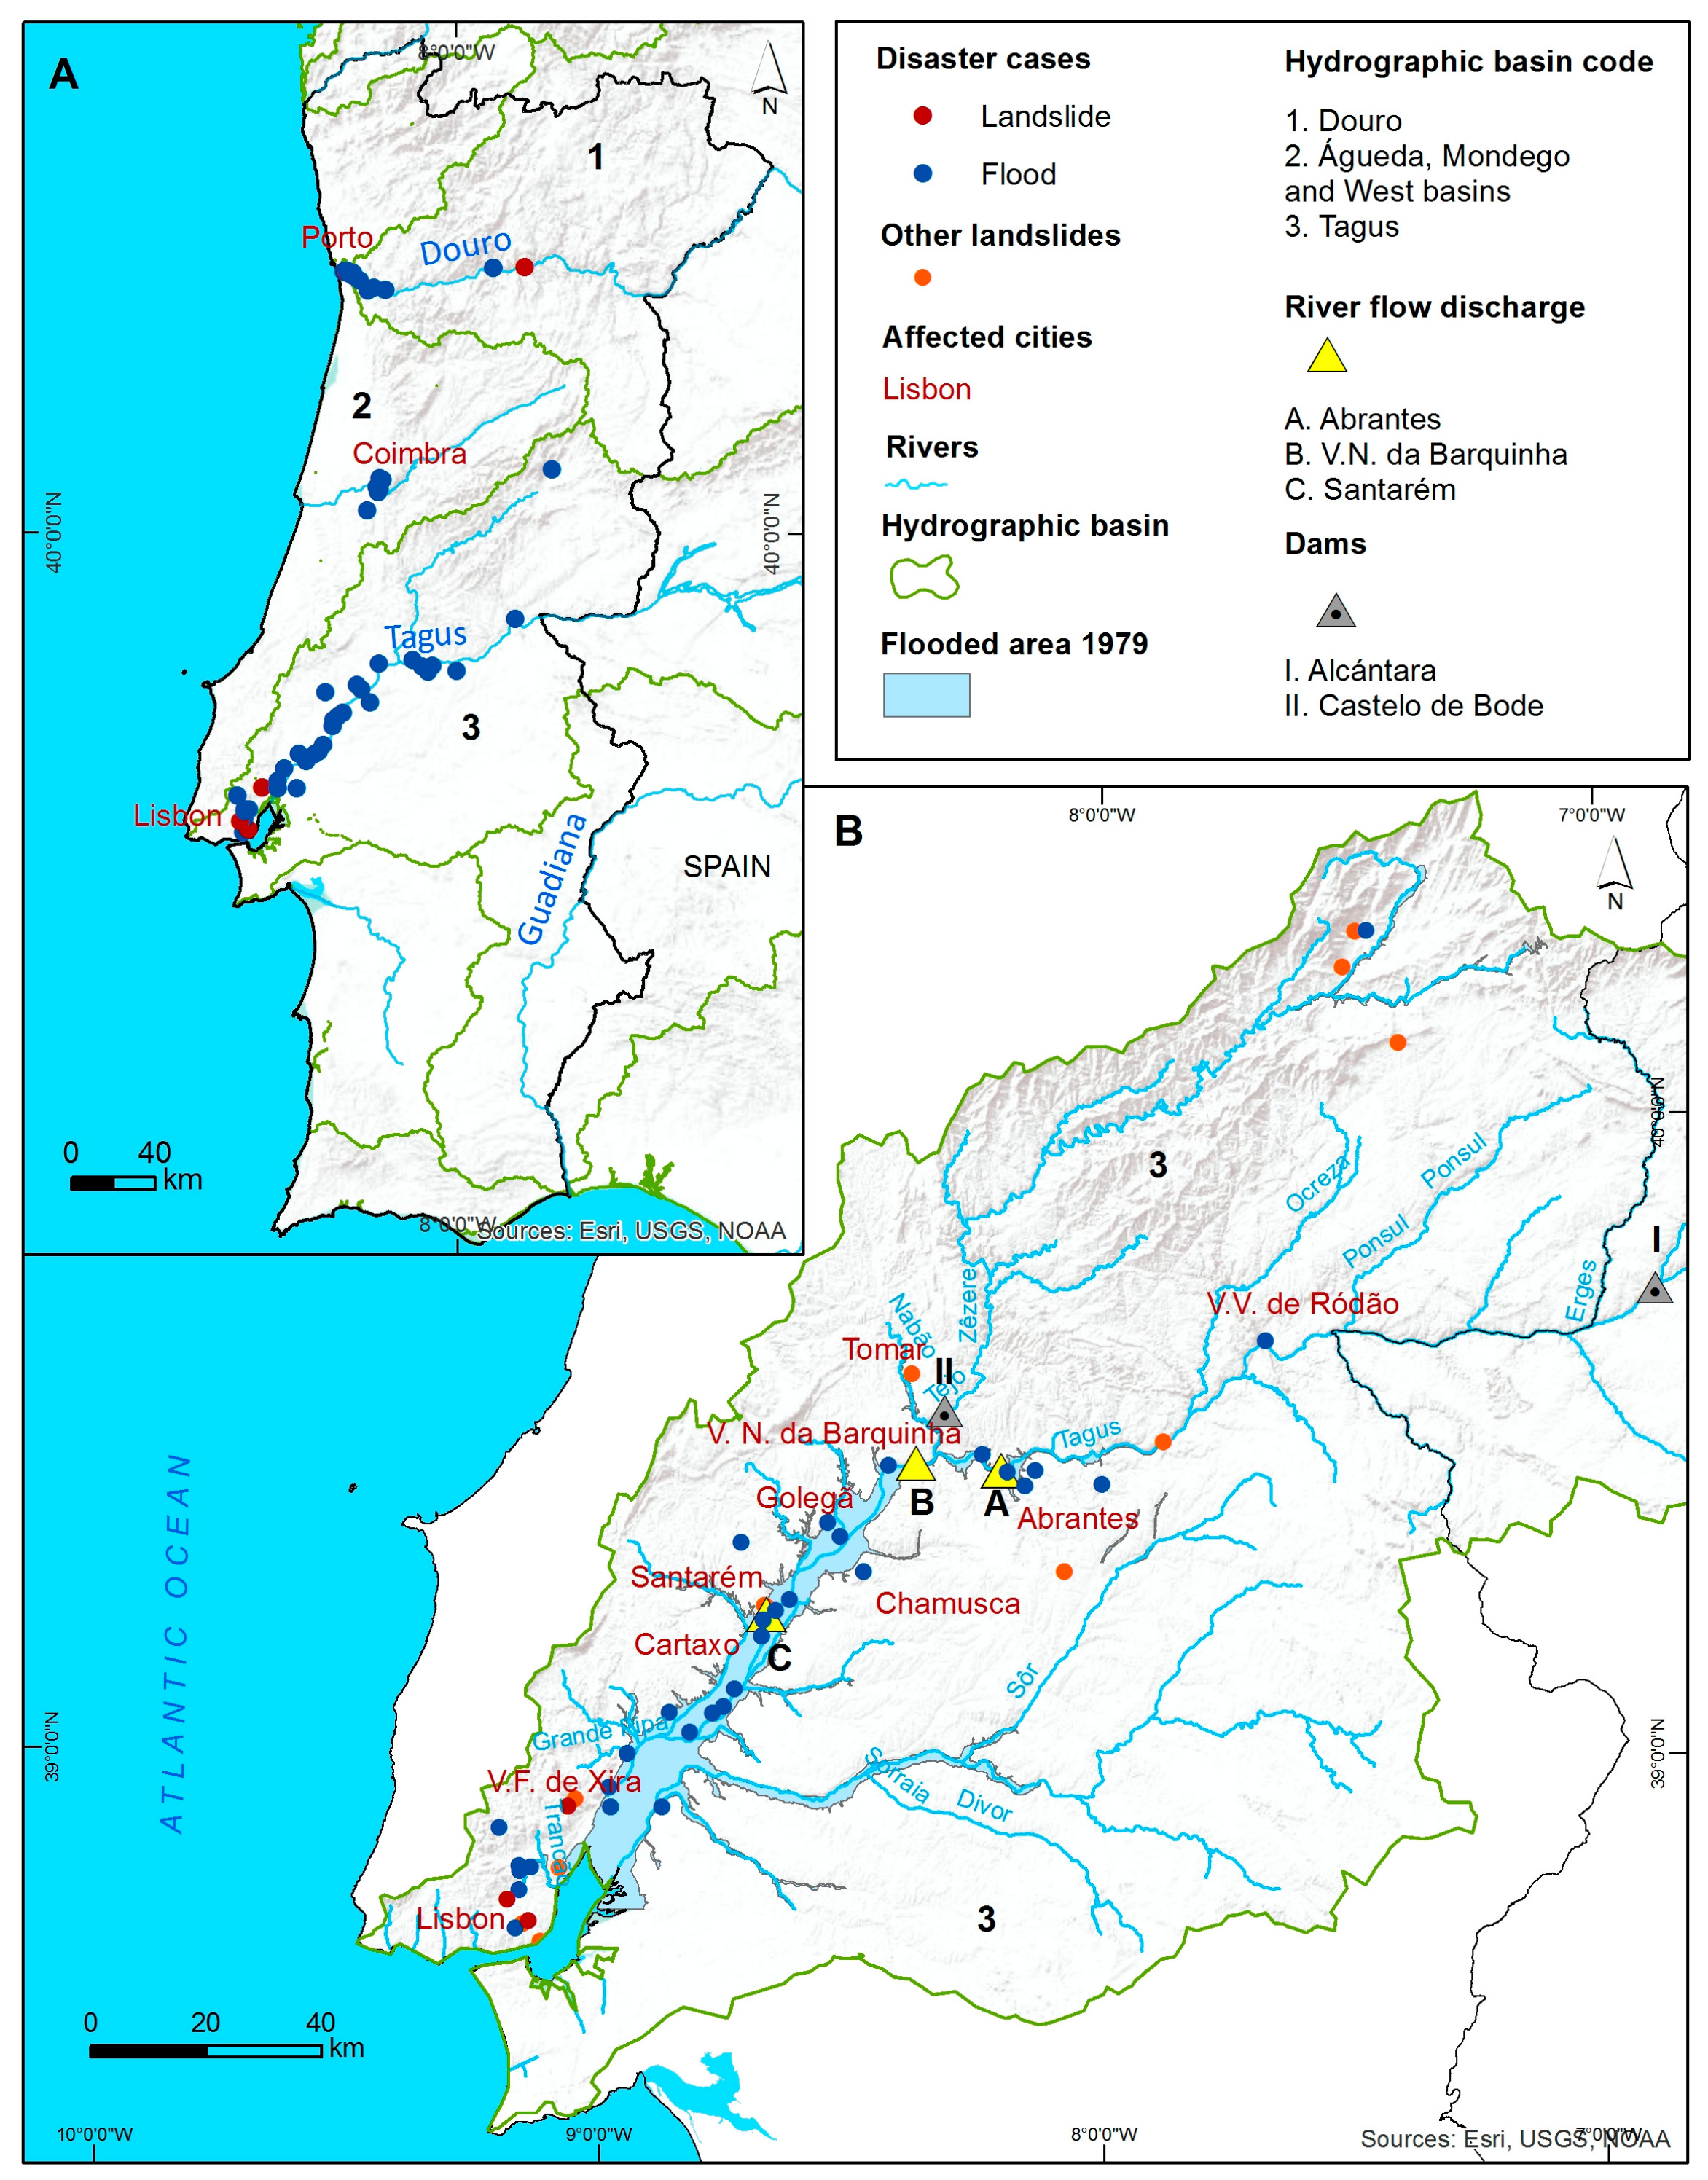
River flow data was only collected for the Tagus River in the Portuguese sector. This river presents two main sectors in Portugal, the first one has an ENE-WSW main direction with a narrow and embedded valley, starting in the border with Spain and stretching until V.N. da Barquinha (Figure 1). Downstream V.N. da Barquinha, the river changes its main direction to NE-SW when it enters the Cenozoic sedimentary basin (lower Tagus valley) where a larger and flattened alluvial plain can be found.
The monthly and daily river flow discharges of the Tagus River were collected for Abrantes (1973/74–2000/01), V.N. da Barquinha (1974/75–2000/01) and Santarém (1972/73–2000/01) using the National Information System on Water Resources (SNIRH) dataset available online (http://snirh.pt/index.php?idMain=) (Figure 1). The monthly river flow data series were used to compute the minimum flood rate (m3·s−1) using the 90th percentile of the month with the highest river flow average of the data series; the number of days above the minimum flood rate were also identified. Maximum and average annual river flow and water level in Abrantes (1973/74–2015), V.N. da Barquinha (1974–2015) and Santarém (1972–2015) were also collected in the same data source.
In order to analyse the spatial distribution of the February 1979 flooded areas in the Tagus basin, its boundaries were obtained from the Portuguese National Service of Environmental Information (http://sniamb.apambiente.pt) of the Portuguese Environment Agency, the limits of which were drawn over topographic maps by the National Laboratory of Civil Engineering (LNEC, Lisboa, Portugal) using 1:50,000 scale topographic maps, and by the Regional Direction of Environment and Territorial Management (DRAOT, Lisboa, Portugal)at 1:25,000 scale.
2.3. The 20th Century Reanalysis
The long-term 20th Century Reanalysis v2c Reanalysis (20CR) was obtained from the National Oceanic and Atmospheric Administration, Earth System Research Laboratory Physical Sciences Division (NOAA/OAR/ESRL PSD), spanning from 1851 to 2014. This dataset has been used in this study to estimate daily CWT classes, daily ARs, mean daily precipitation annual and long-term percentile series for event analysis.
The following fields were extracted at six-hourly resolution: precipitation (mm) and mean sea level pressure (hPa) at the surface level; specific moisture (g/kg); and both zonal and meridional wind components (ms−1) at the following levels: 1000 hPa, 950 hPa, 850 hPa, 700 hPa, 600 hPa, 500 hPa, 400 hPa and 300 hPa. The ensemble mean fields for all variables extracted were assessed using a global grid of 2° × 2° latitude-longitude resolution.
2.4. ECMWF Reanalysis
Additionally, we used finer resolution reanalyses for a better representation of the atmospheric circulation. The high-resolution large-scale meteorological fields used in this study were extracted from the ERA-Interim Reanalysis dataset, provided by the European Centre for Medium-Range Weather Forecasts (ECMWF) [15]. This dataset spans from 1979 to 2016, and for the aim of this work only the period covering January to the end of March 1979 was extracted. The mean level fields used in this study are gridded with a 0.75° × 0.75° global latitude-longitude resolution (T255 spectral/N128 gaussian grid), and the following fields were extracted at six-hourly resolution: precipitation rate (mm) and mean sea level pressure (hPa) at the surface level. We also extracted the specific moisture (g/kg) and both wind components (ms−1) at the lower tropospheric level (900 hPa) and the geopotential height (m) and air temperature (°C) and both wind components (ms−1) at the upper levels (500 and 250 hPa). Further, the specific moisture (g/kg) and both wind components were extracted at the following levels: 1000 hPa, 925 hPa, 850 hPa, 700 hPa, 600 hPa, 500 hPa, 400 hPa and 300 hPa for the estimation of daily ARs. This dataset provides better spatial resolution than other reanalysis and a more robust field estimation (e.g., compared with 20CR), since it incorporates in its forecast models a higher number of physical variables as inputs and a wider range of observation sources (e.g., satellite observations).
2.5. Iberian Peninsula High Resolution Precipitation
A daily gridded precipitation dataset for the Iberian Peninsula (IB02) was used in this study to characterize the daily and multi-day precipitation that occurred over Iberia during the 1–16 February 1979 period. This dataset consists of two precipitation datasets, studied and developed independently, albeit with similar methodology, that were subsequently joined together in a single dataset. The PT02 [16] for Portugal and the SPAIN02 [17] for Spain.
The IB02 dataset covers a period that spans from 1950 to March 2008, with a resolution of 0.2° × 0.2° on a latitude-longitude grid. The production of this dataset made use of a dense network of rain gauges (up to 2000 for Spain and 800 for Portugal) aimed at providing a meaningful regional assessment of the extreme precipitation over medium-sized river basins.
2.6. Precipitation Extremes
In order to analyse the precipitation extremes we have used a list of events already published by [18] for different domains in the Iberian Peninsula. This methodology provides an objective method for ranking a list of extreme precipitation episodes in different time scales over the Iberian Peninsula and major river basins. It relies on extensive use of the high-resolution (0.2°) gridded daily precipitation database available for the IP, spanning from 1950–2008 (Section 2.5). The key point of this method relies on the use of daily normalized precipitation anomalies, which is obtained for each grid point by subtracting the climatological mean (between 1950–2008) of each grid point and divided the anomaly by its climatological standard deviation (also computed between 1950–2008). With this we are able to take into account the widely different variability ranges observed in each grid point. Thus, for each grid point and day we will have a normalized anomaly of precipitation. In [18] the sum of the normalized anomalies is computed over different time scales (2–10 days) and updated here to 15 days in order to allow ranking the different anomalous precipitation on multi-day periods. The magnitude of a precipitation episode (R) is found by taking into account the total area (A, in percentage) that has precipitation anomalies above two standard deviations (std) and the mean values (M) of these anomalies over this area. With these criteria, we are able to evaluate the spatial extent of the precipitation episodes as well as their spatially integrated intensity over different time scales (2–15 days).
This method uses the 2 std threshold departure from climatological daily precipitation to identify where significant extreme precipitation phenomena occur over the Iberia Peninsula on each evaluated day. This threshold is justified since it corresponds approximately to the 95th percentiles of the daily precipitation distribution throughout the Iberia domain in the extended winter months, thus ensuring a robust limit for assessing daily precipitation extremeness [3,18].
We want to stress again that the magnitude of an event is given by the area (in percentage) that has precipitation normalized anomalies above 2 std and the mean values of these anomalies over this area. For each accumulated time period (2–15 days), different precipitation normalized anomalies are used, taking into account the sum of the individual days in each period; this methodology is explained in detailed in [18]. With the proposed methodology, we were able to put into context the February 1979 precipitation even in terms of normalized precipitation anomalies for different time scales.
2.7. Circulation Weather Types
CWTs for Portugal were classified using an algorithm previously developed for Iberia by one of the authors [7]. The daily CWTs for the period 1979–2016 were computed by means of the daily sea level pressure (SLP) on a 0.75° latitude-longitude grid retrieved from the ERA-Interim (see Section 2.4). Additionally, due to the use of the 20CR reanalysis precipitation to allow a long-term comparison with the 1978/1979 hydrological year, the daily CWTs were also computed by means of the daily sea level pressure (SLP) on a 2° latitude-longitude grid retrieved from the 20CR (see Section 2.3).
The circulation conditions were determined using geostrophic wind approximation and adopting physical or geometrical parameters, such as the direction and strength of airflow and degree of cyclonicity. The indices used were the following: southerly flow (SF); westerly flow (WF); total flow (F); southerly shear vorticity (ZS); westerly shear vorticity (ZW); and total shear vorticity (Z). All these indices were computed using SLP values obtained for the 16 grid points centred over Portugal; for additional information regarding the methodology please refer to [8].
This method produced 26 CWTs-eight directional types, 16 hybrid types and two types controlled by geostrophic vorticity. In this particular case for an easier visualization of the daily CWT, we replace the hybrid CWTs by the respective pure directional component [19]. This allowed for a clearer visual match between CWTs (especially wet CWTs) and significant/extreme precipitation days occurring during the hydrological year, while providing for a better explanation of the phenomena. Thus, in the current work, we adopted the 10-basic CWTs classification (anticyclonic, cyclonic, N, NE, E, SE, S, SW, W, NW) to estimate the daily frequencies of occurrence of the several CWTs present during the February 1979 precipitation event.
2.8. Atmospheric Rivers
A database of ARs [9] was obtained from both the 20CR datasets and from the ERA-Interim datasets and was used to identify the ARs that affected the Iberian Peninsula during this event. ARs were identified using the means of the vertically integrated horizontal water vapour transport (IVT) between 1000 hPa and 300 hPa for the latitudinal range 35°–45° N, at the meridian 10° W [9]. A minimum threshold of IVT was derived to identify the most intense 6-h ARs reaching the Iberian Peninsula, while also guaranteeing that each of these ARs stretch for the equivalent of 20° in contiguous longitude points above the IVT threshold. Furthermore, only persistent ARs are considered, meaning ARs that lasted for at least 18 h consecutively. Additional information regarding the ARs detection scheme has already been published [9].
3. Results
3.1. 5–16 February 1979 Event
According to the DISASTER database, a total of 130 DISASTER events were recorded in Portugal between 1865–2015. The February 1979 event recorded 67 DISASTER cases (62 floods and five landslides) that caused eight fatalities and injured three people in the country (Table 1). This event is the top ranked event in the DISASTER database, not only regarding the total number of affected people (18,578), number of evacuated people (4244) and homeless people (14,322), but also on the number of days of the event duration (12 days).
During this event Iberia was affected mainly along the margins of the Douro, Mondego and Tagus rivers (Figure 1). For the Douro and Mondego basins the damaging floods tend to concentrate in the cities of Porto and Coimbra, respectively, while in the Tagus basin the damaging floods were registered along several riverside localities of the lower Tagus valley, namely Santarém, Vila Franca de Xira and other smaller villages (Figure 1); there were also damaging landslides in the Northern area of Lisbon. Additionally, for the Tagus basin, seven flash flood cases were reported on the 10 February in the city of Lisbon and nearby cities of Loures and Odivelas. In total, the Tagus basin constituted 53.8% of the hydro-geomorphological DISASTER cases (Table 1) of the event.
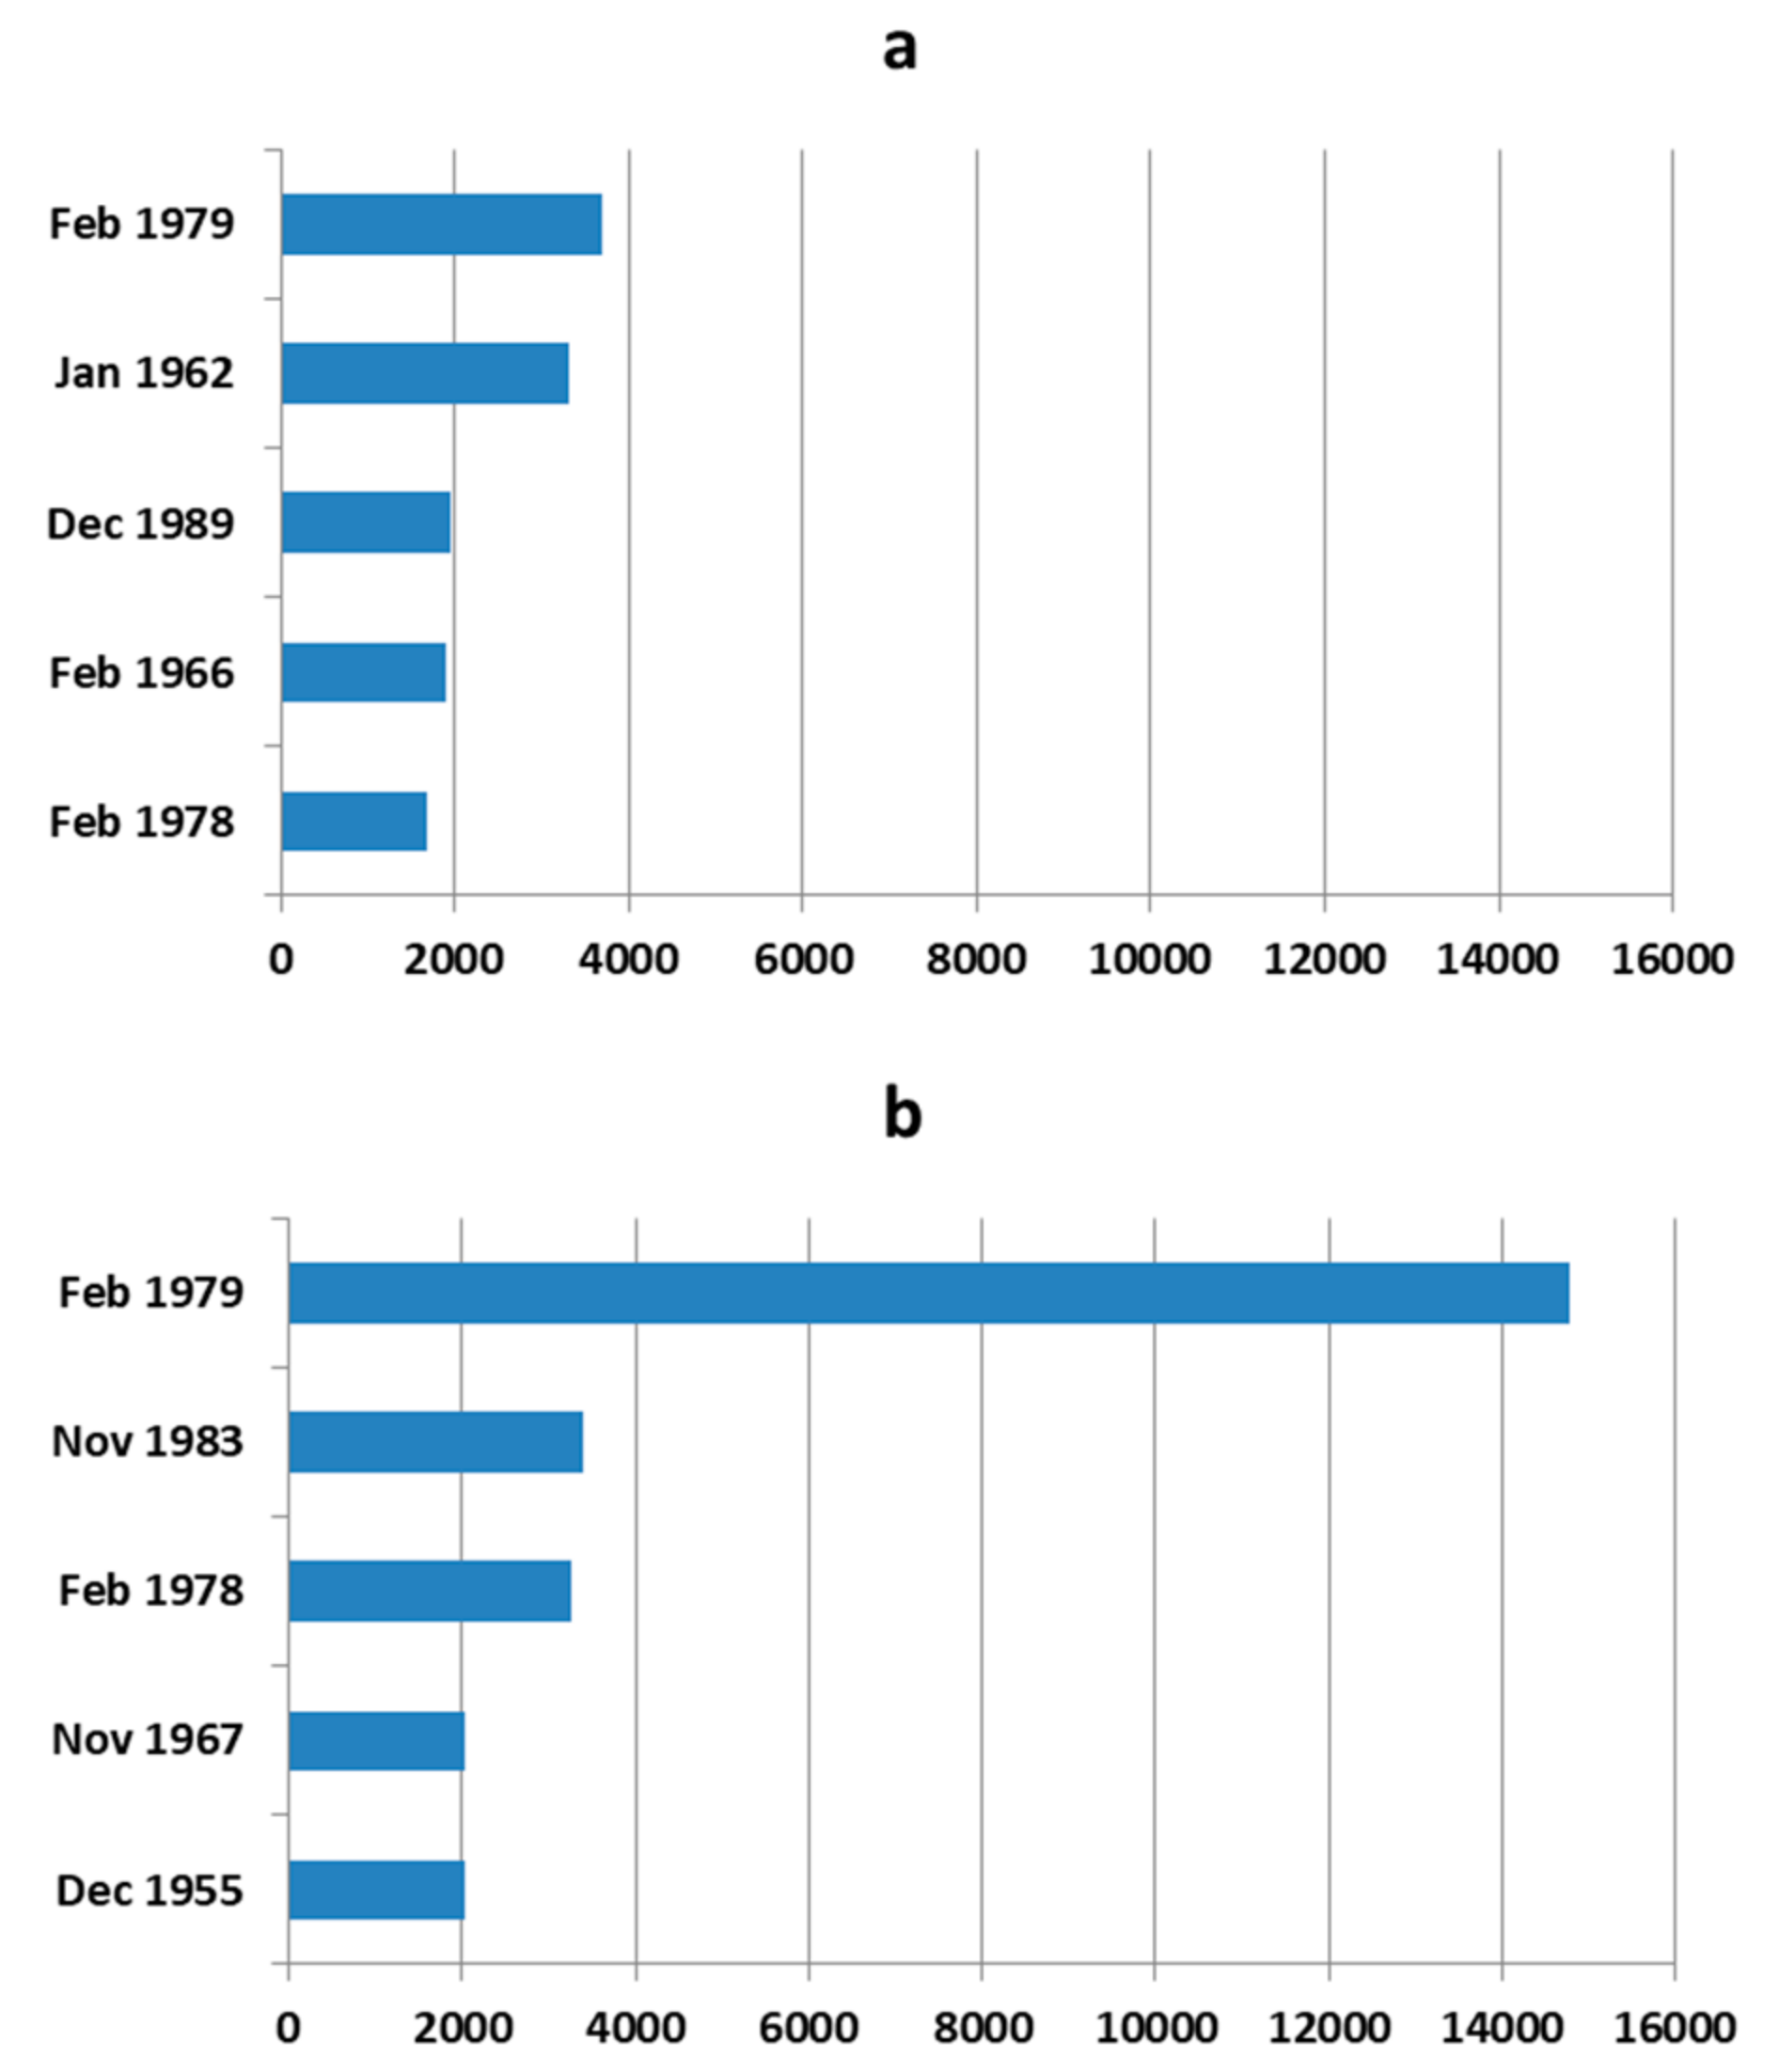
Moreover, when the top five DISASTER events are considered in both the Tagus and Douro river basins, the February 1979 event ranks first in terms of total affected people (Figure 2). In particular, it is important to note that the Tagus basin was heavily damaged with more than 14,000 total affected people (Figure 2).
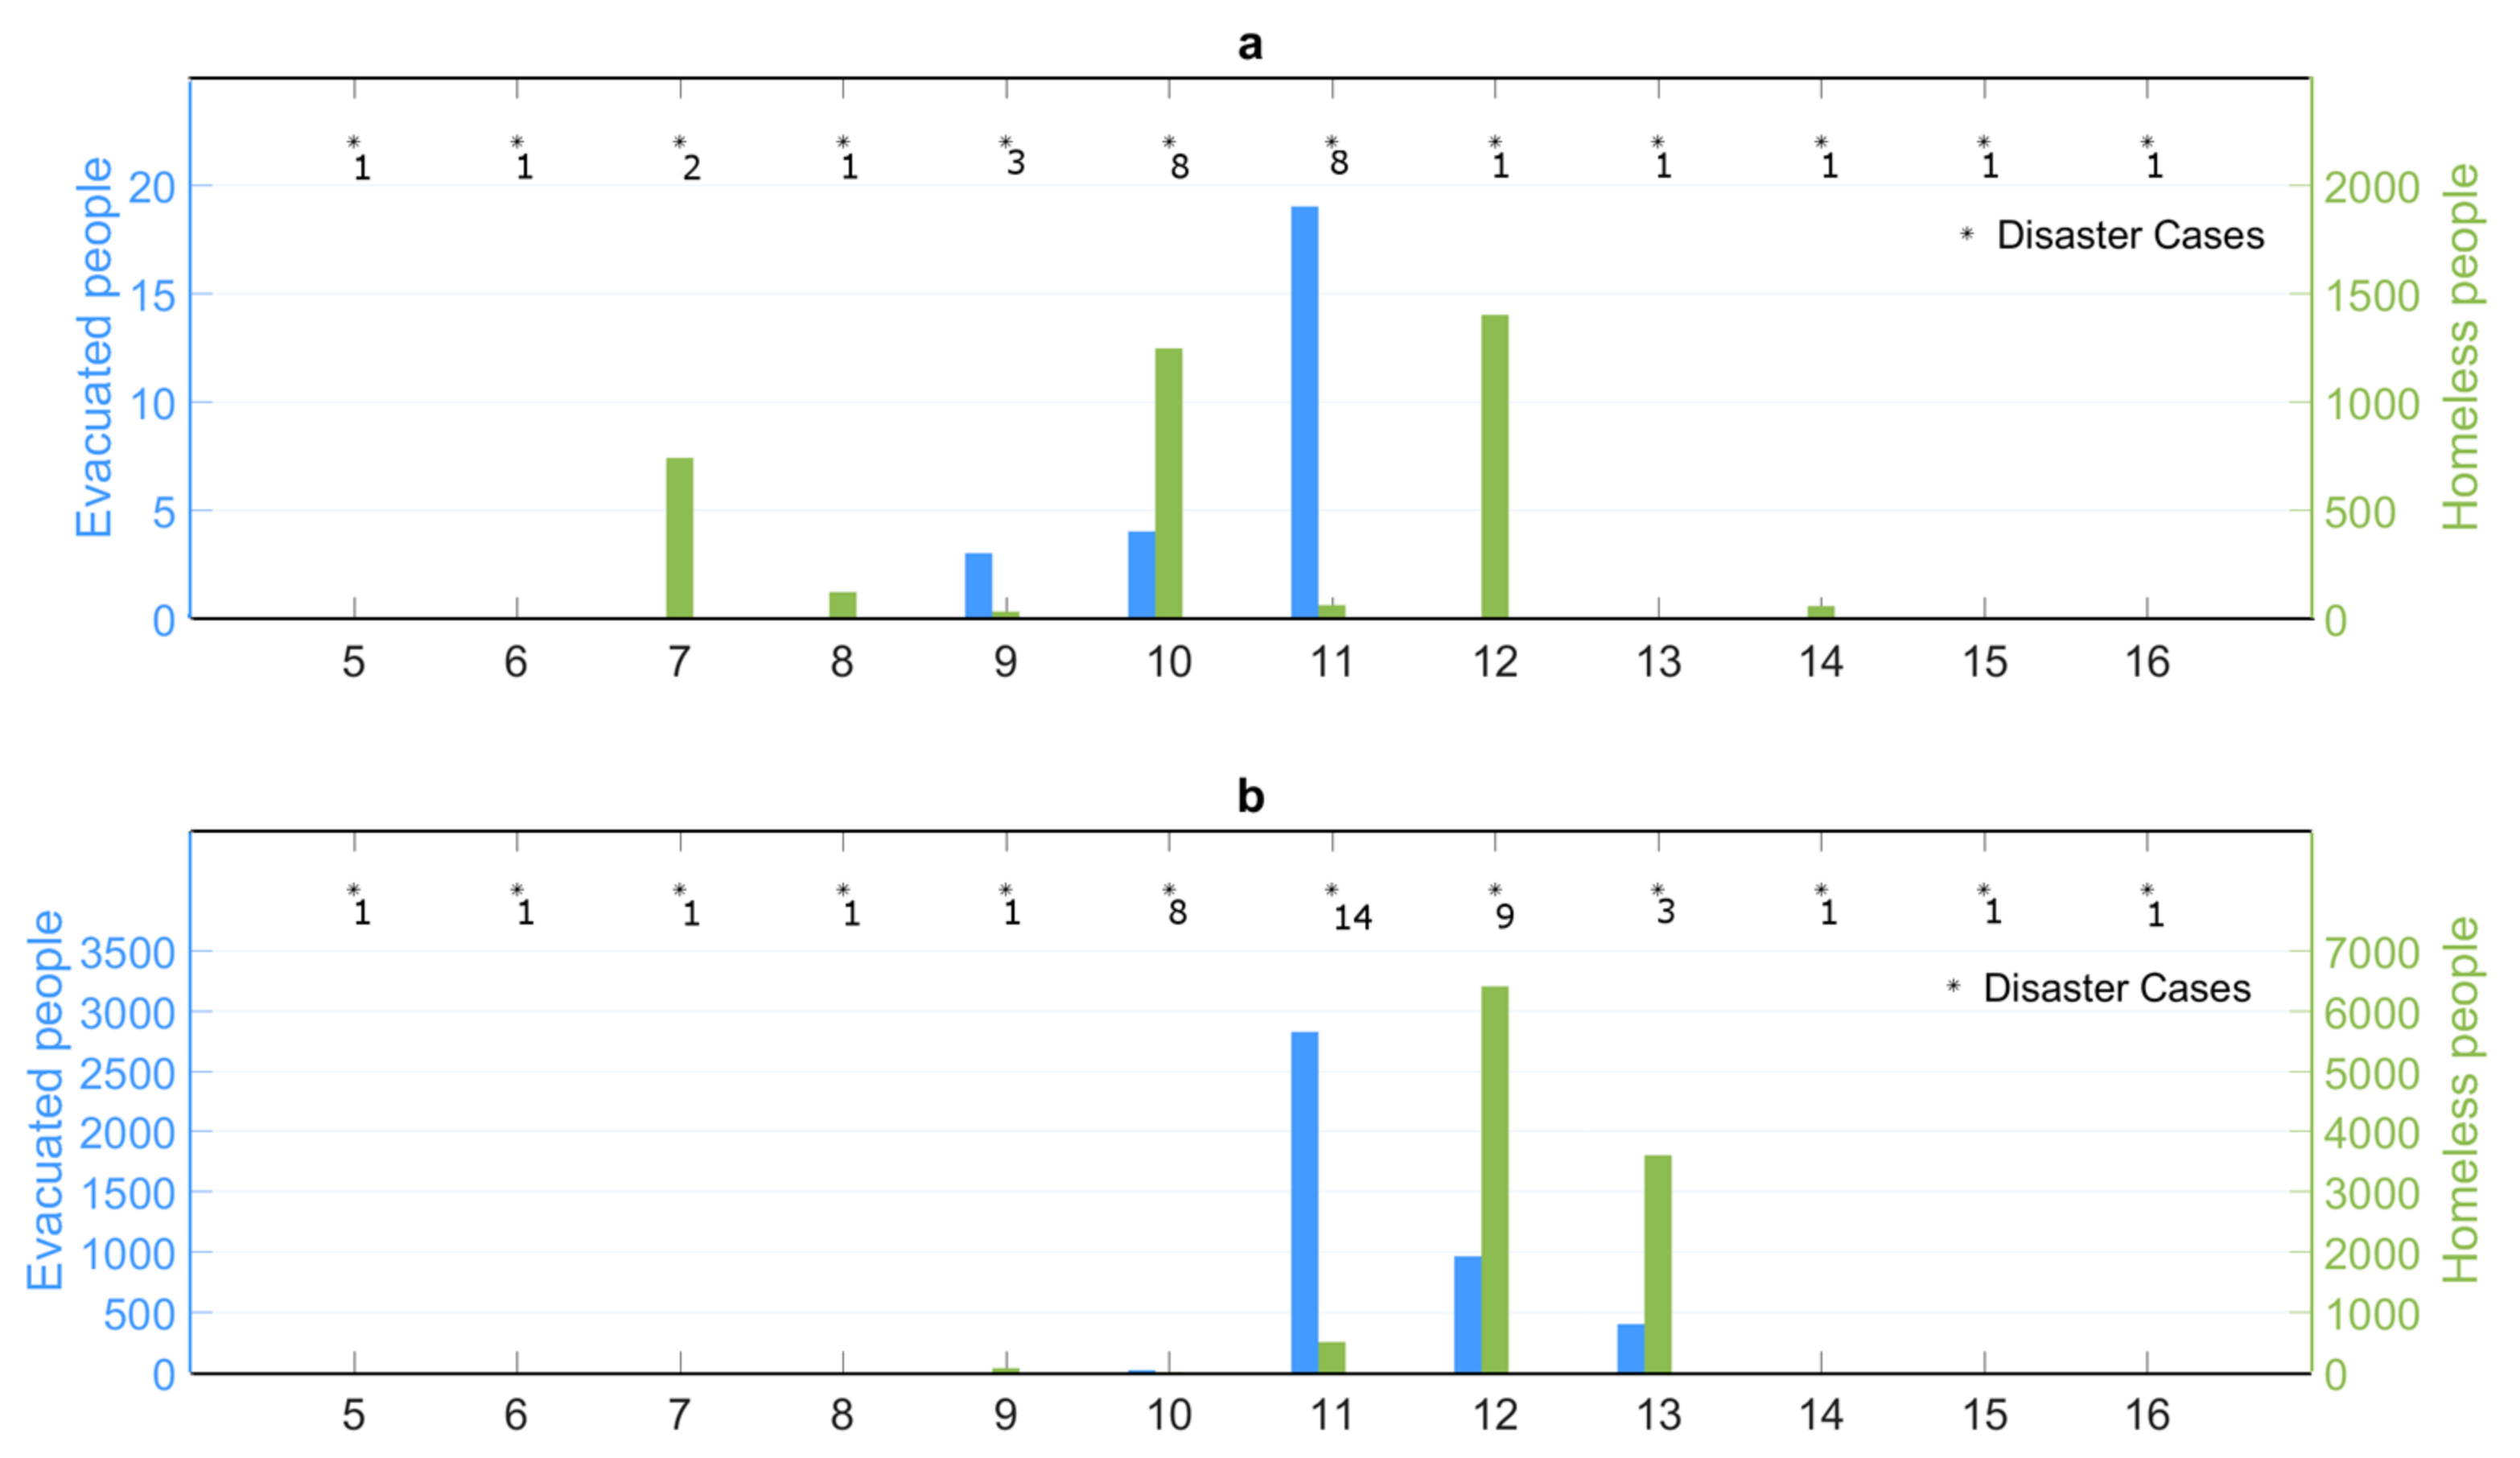
In Figure 3 we see that most of the DISASTER cases and associated evacuated and homeless people reported for the two most affected basins on the event (Tagus and Douro basins) took place between 7–14 February. However, in the case of the Tagus river, the concentration of floods and landslides began slightly later (9 February) and ended earlier (13 February) when compared with the corresponding timings for the Douro basin.
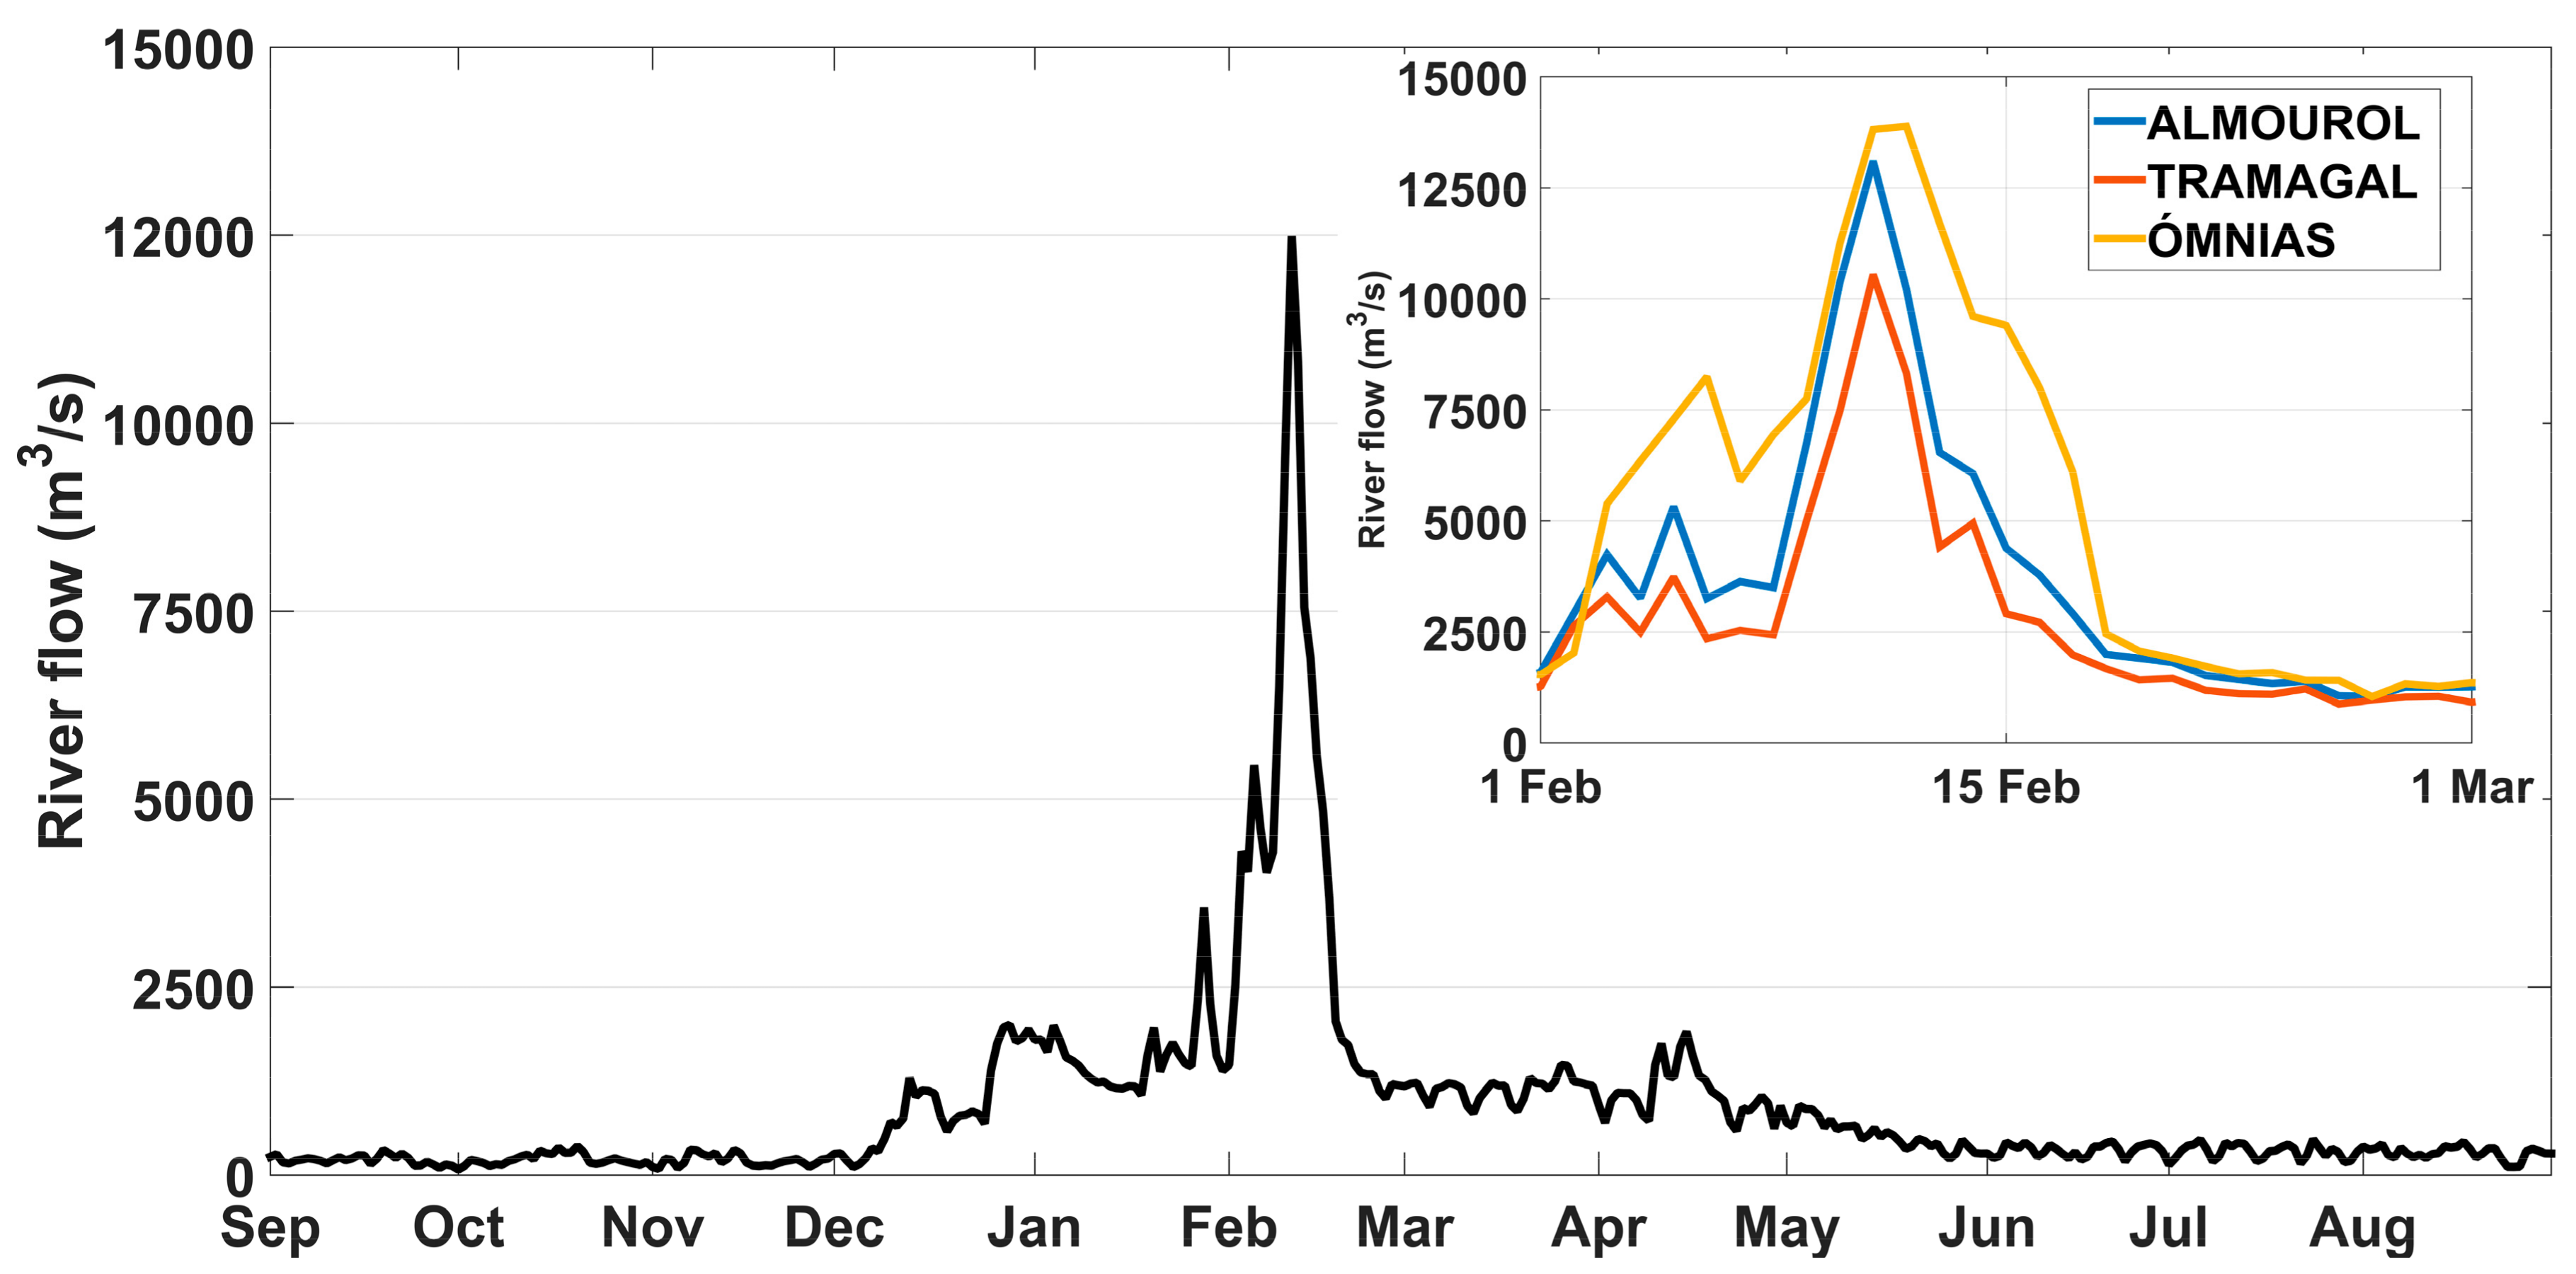
The relatively prolonged period of affected people in the lower Tagus River basin is directly related to the unusually high values of flow discharge registered in the first fortnight of February 1979. To confirm this, we have obtained for the hydrological year 1978/79 the daily river flow relative to three gauge stations located in the Tagus River (Abrantes, V.N. da Barquinha and Santarém, locations depicted in Figure 1). All three data series show some rise around 5–6 February, followed by a generalized rapid rise of the river flow on 9 February until reaching their maximum on 11 February. At Abrantes and V. N. da Barquinha, the peak in river flow discharge occurred between 9–12 February, while in Santarém, located more downstream where the valley is larger and flattened, this peak lasted until 16 February (Figure 4).
River flow data series comprising the hydrological years 1972/73–2000/01 show that these three stations recorded their maximum annual level on 11 February 1979, while the maximum daily flow rate was recorded on 11 February at Abrantes and V.N. da Barquinha and 12 February at Santarém (Table 2). When the water level reaches 6.4 m at Santarém, the Tagus river overflows [20], and during this event it reached a maximum water level of 10.45m (Table 3) on 11 February.
The water level return period computed for the Tagus river section in Santarém during this event was circa 220 years [21]. In the 20th century this was the most extreme flood event in Portugal in terms of flow rate and flooded area, taking place after the construction of the most important dams in the Tagus River. In 1979, the Tagus river flow in the Portuguese sector was already mainly controlled by the Alcântara dam located in Spain near the border with Portugal.
A deeper analysis shows that the daily river flow above the flood threshold was recorded since December 1978 (Table3) in the three stations. During the hydrological year 1978/79, Santarém recorded the highest number of continuous flood days (34), including the DISASTER event of February 1979 (Table 3).
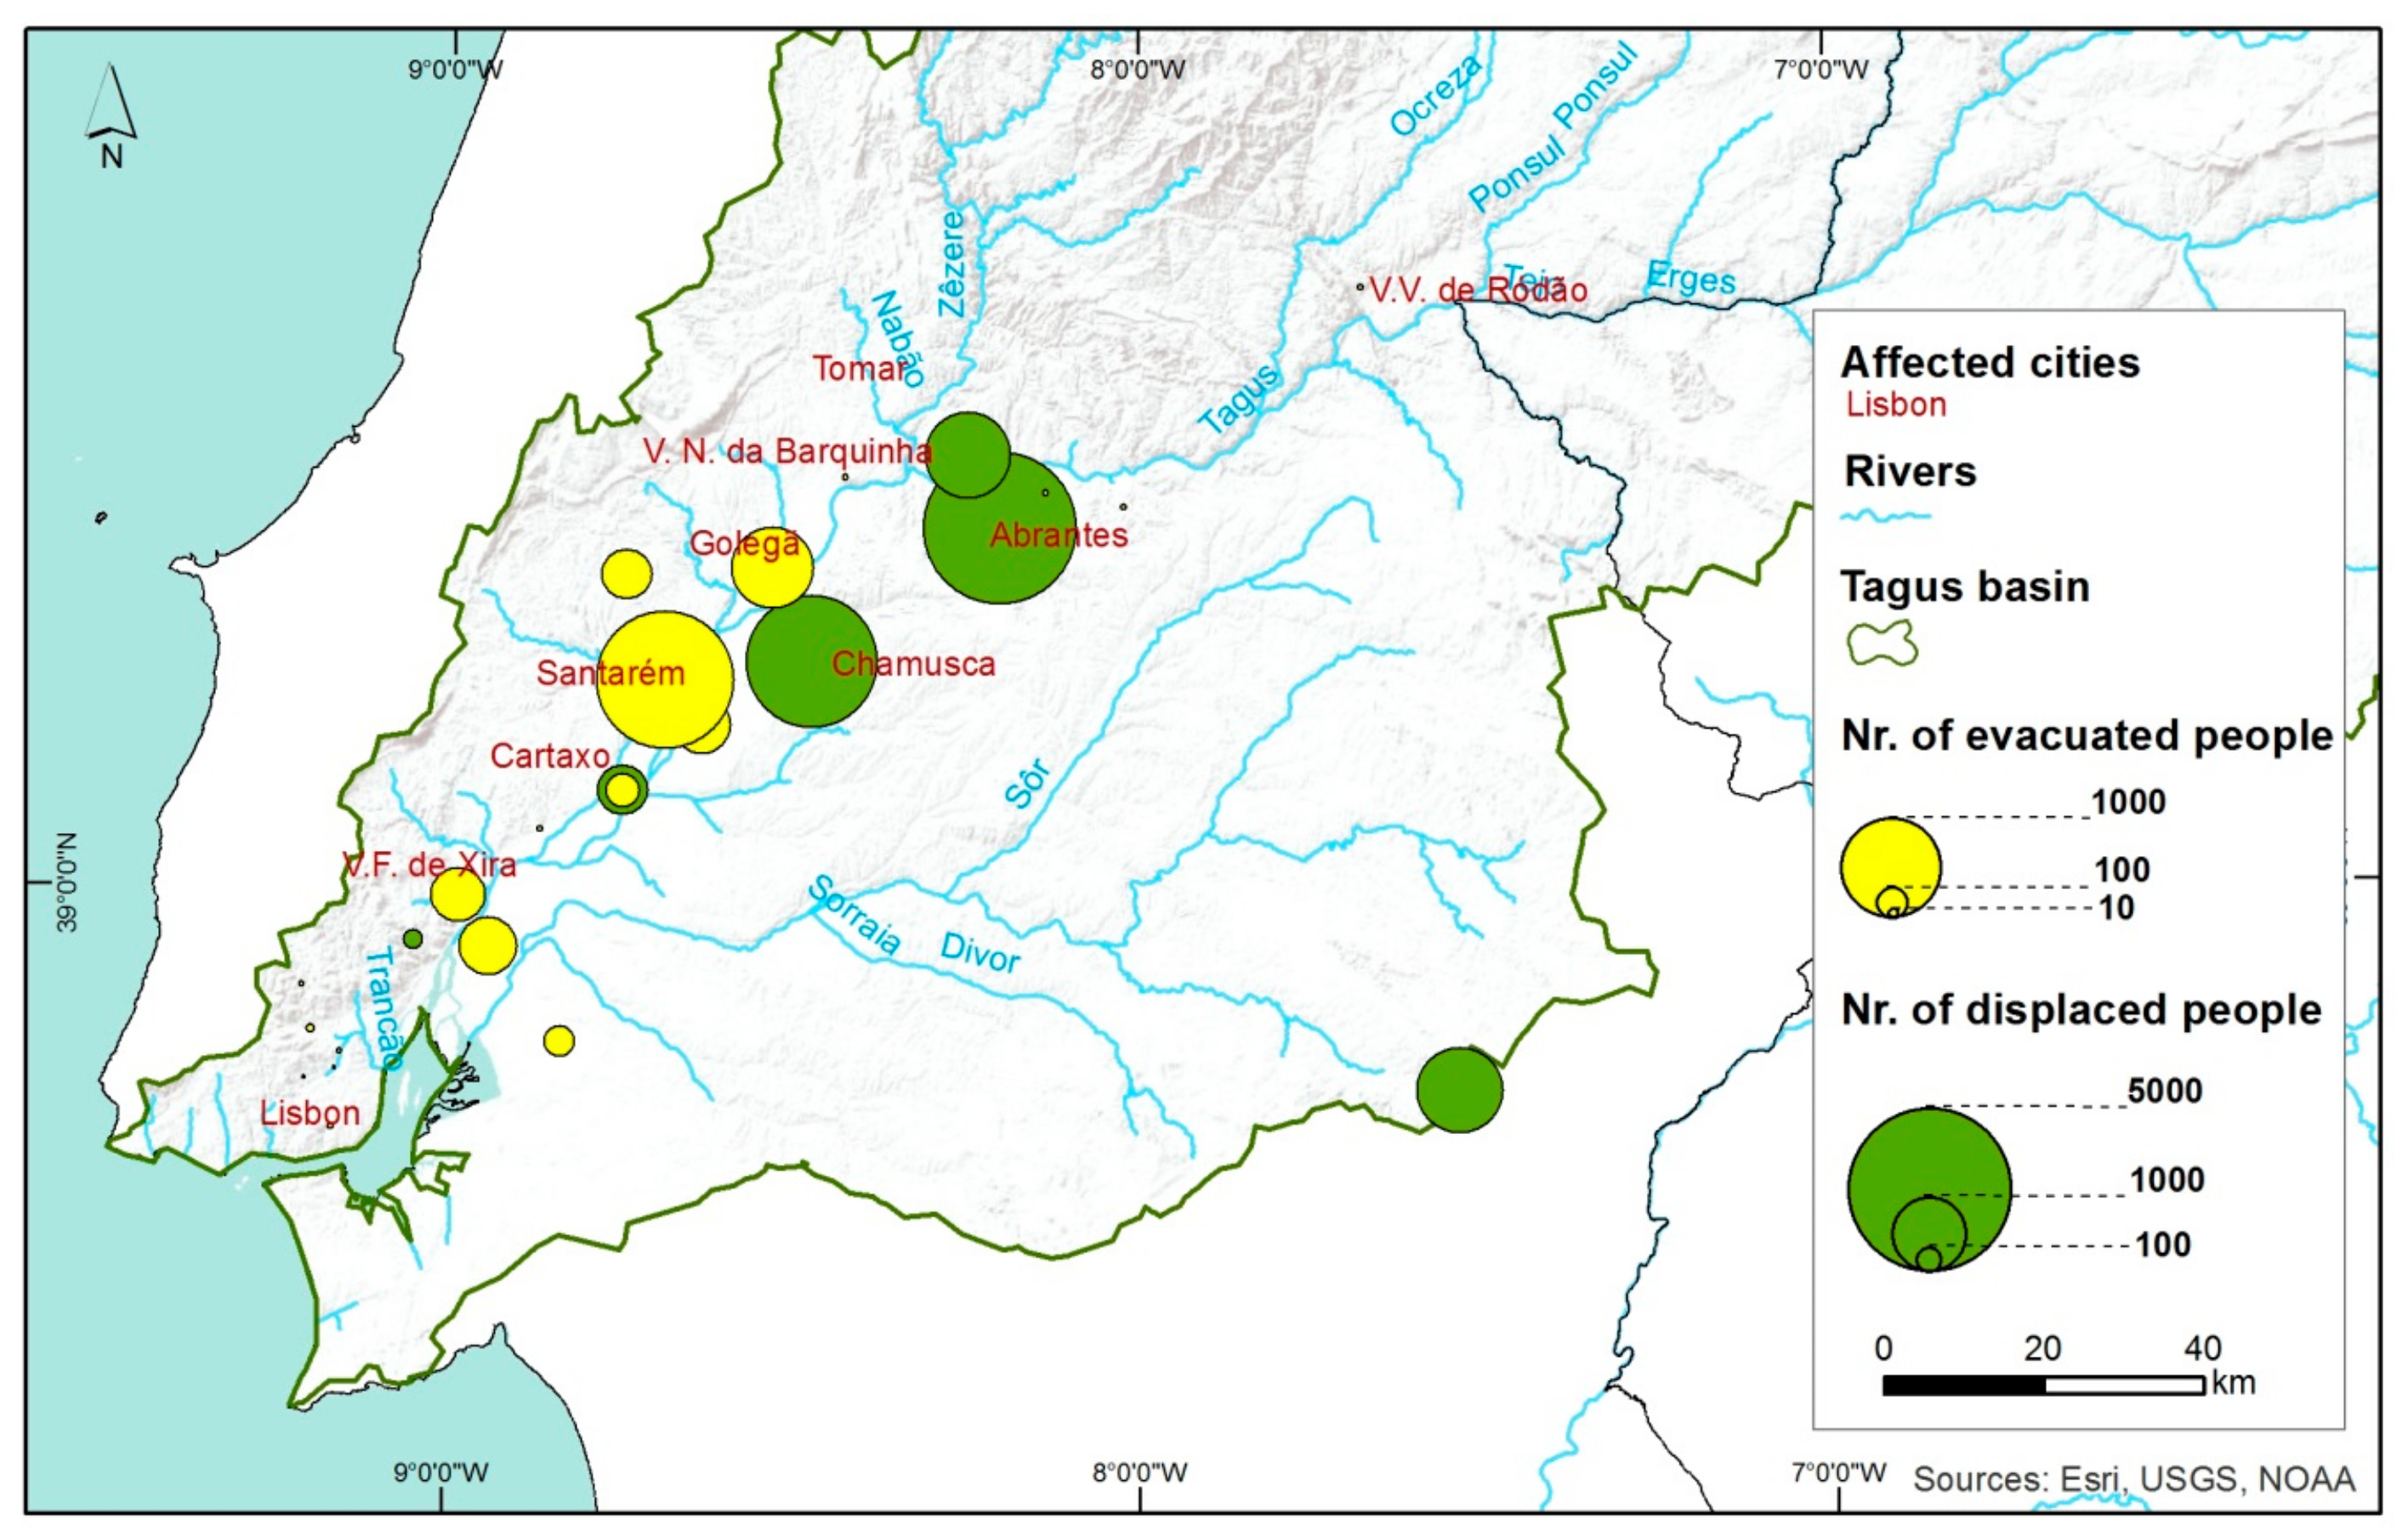
3.2. Socio-Economic Impacts in the Tagus Basin
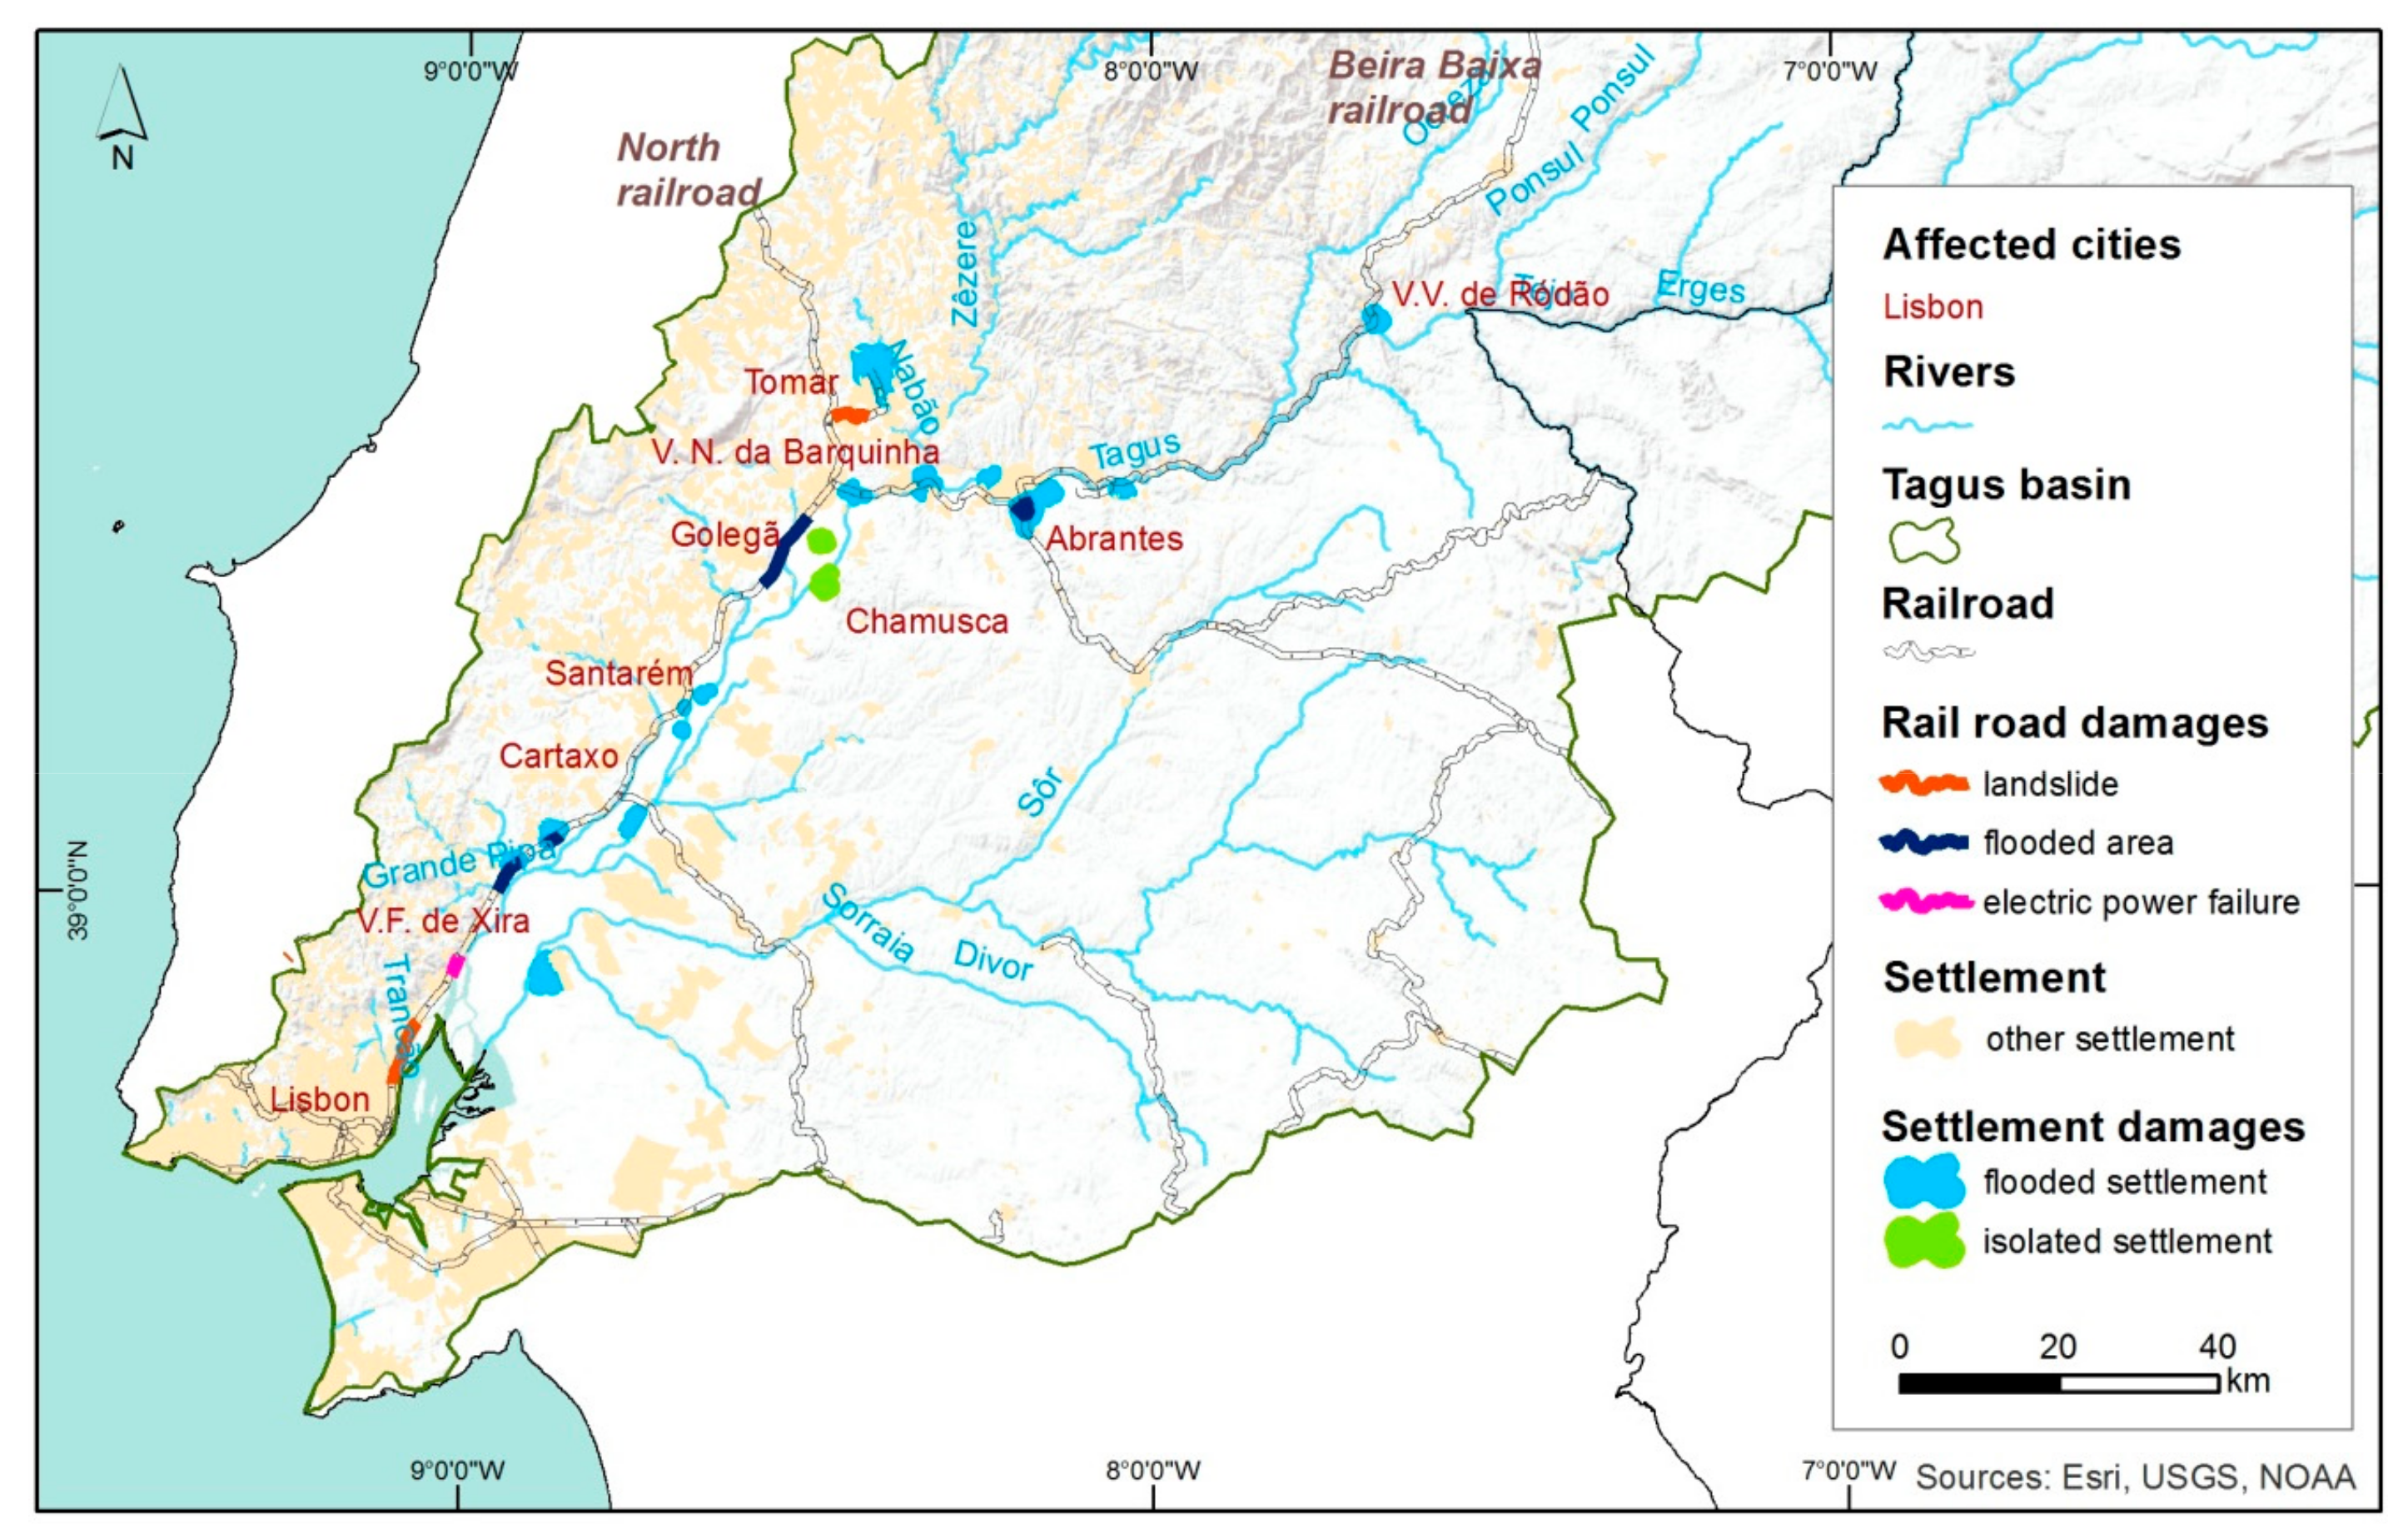
During the February 1979 event, dams were not able to control river flow peaks, causing floods along the lower Tagus valley. The most affected villages were located downstream of Abrantes where the riverine affected population were either displaced or evacuated (Figure 5). Most evacuated people (>3000) were mainly concentrated in the flooded areas of Santarém, Golegã and Vila Franca de Xira. Evacuation of the affected populations was carried out by boat and helicopter (Diário de Notícias, 12–13 February 1979). Abrantes and Chamusca recorded the highest number of displaced people (4900 and 3600, respectively). The small town of Chamusca was significantly affected by floods due to a dike rupture at five different breaches, which isolated Chamusca and Golegã villages and flooded the main railroad line of Portugal that connects the capital (Lisbon) to the north of the country (Porto) (Figure 6). Two additional dikes were overwhelmed in Vila Franca de Xira (Mouchão and Valada) and flooded settlements as well as the Northern (Entroncamento) and Beira Baixa railroad lines.
Besides the flooded areas, this event also triggered a large, complex landslide–mainly of the translational type–with a total area of 181,360 m2 and an estimated volume of 1,297,850 m3, occurring in Calhandriz, a part of the Vila Franca de Xira municipality [22]. The activity of this landslide began at 7:30 a.m. on 9 February and was active for 36 hours, reaching a maximum length of 1010 m, a maximum width of 316 m and an estimated depth of 12m. The Calhandriz landslide destroyed 7 houses that were also displaced from its original position and caused 67 homeless people [22]. Railroads were also blocked by landslides in several spots between Lisbon (Sacavém), Vila Franca de Xira (Póvoa de Santa Iria) and Tomar.
Floods in the lower section of the Tagus valley also had major consequences for the water supply for Lisbon and surrounding municipalities. At the time, half of all the water supply to Lisbon came from surface water abstractions (Valada do Ribatejo in Cartaxo village, Tagus) and the other half from underground water, particularly through the Alviela springs and wells located in Ota and Alenquer. During the February 1979 floods, the Valada do Ribatejo pumping station was flooded, which caused a power outage and a disruption in operation. The same happened with the existing pumping stations of water from springs (Alviela channel). As a consequence, the abstraction of water from the wells located in the Tagus floodplain was suspended and the Lisbon area suffered a severe lack of water between 11–19 February, where only 10% of the required water supply of the city was provided. At the time, Lisbon city counted more than 800,000 inhabitants according to the general population census [23] and the water supply of the city was only completely normalized on 27 February.
3.3. Precipitation Event
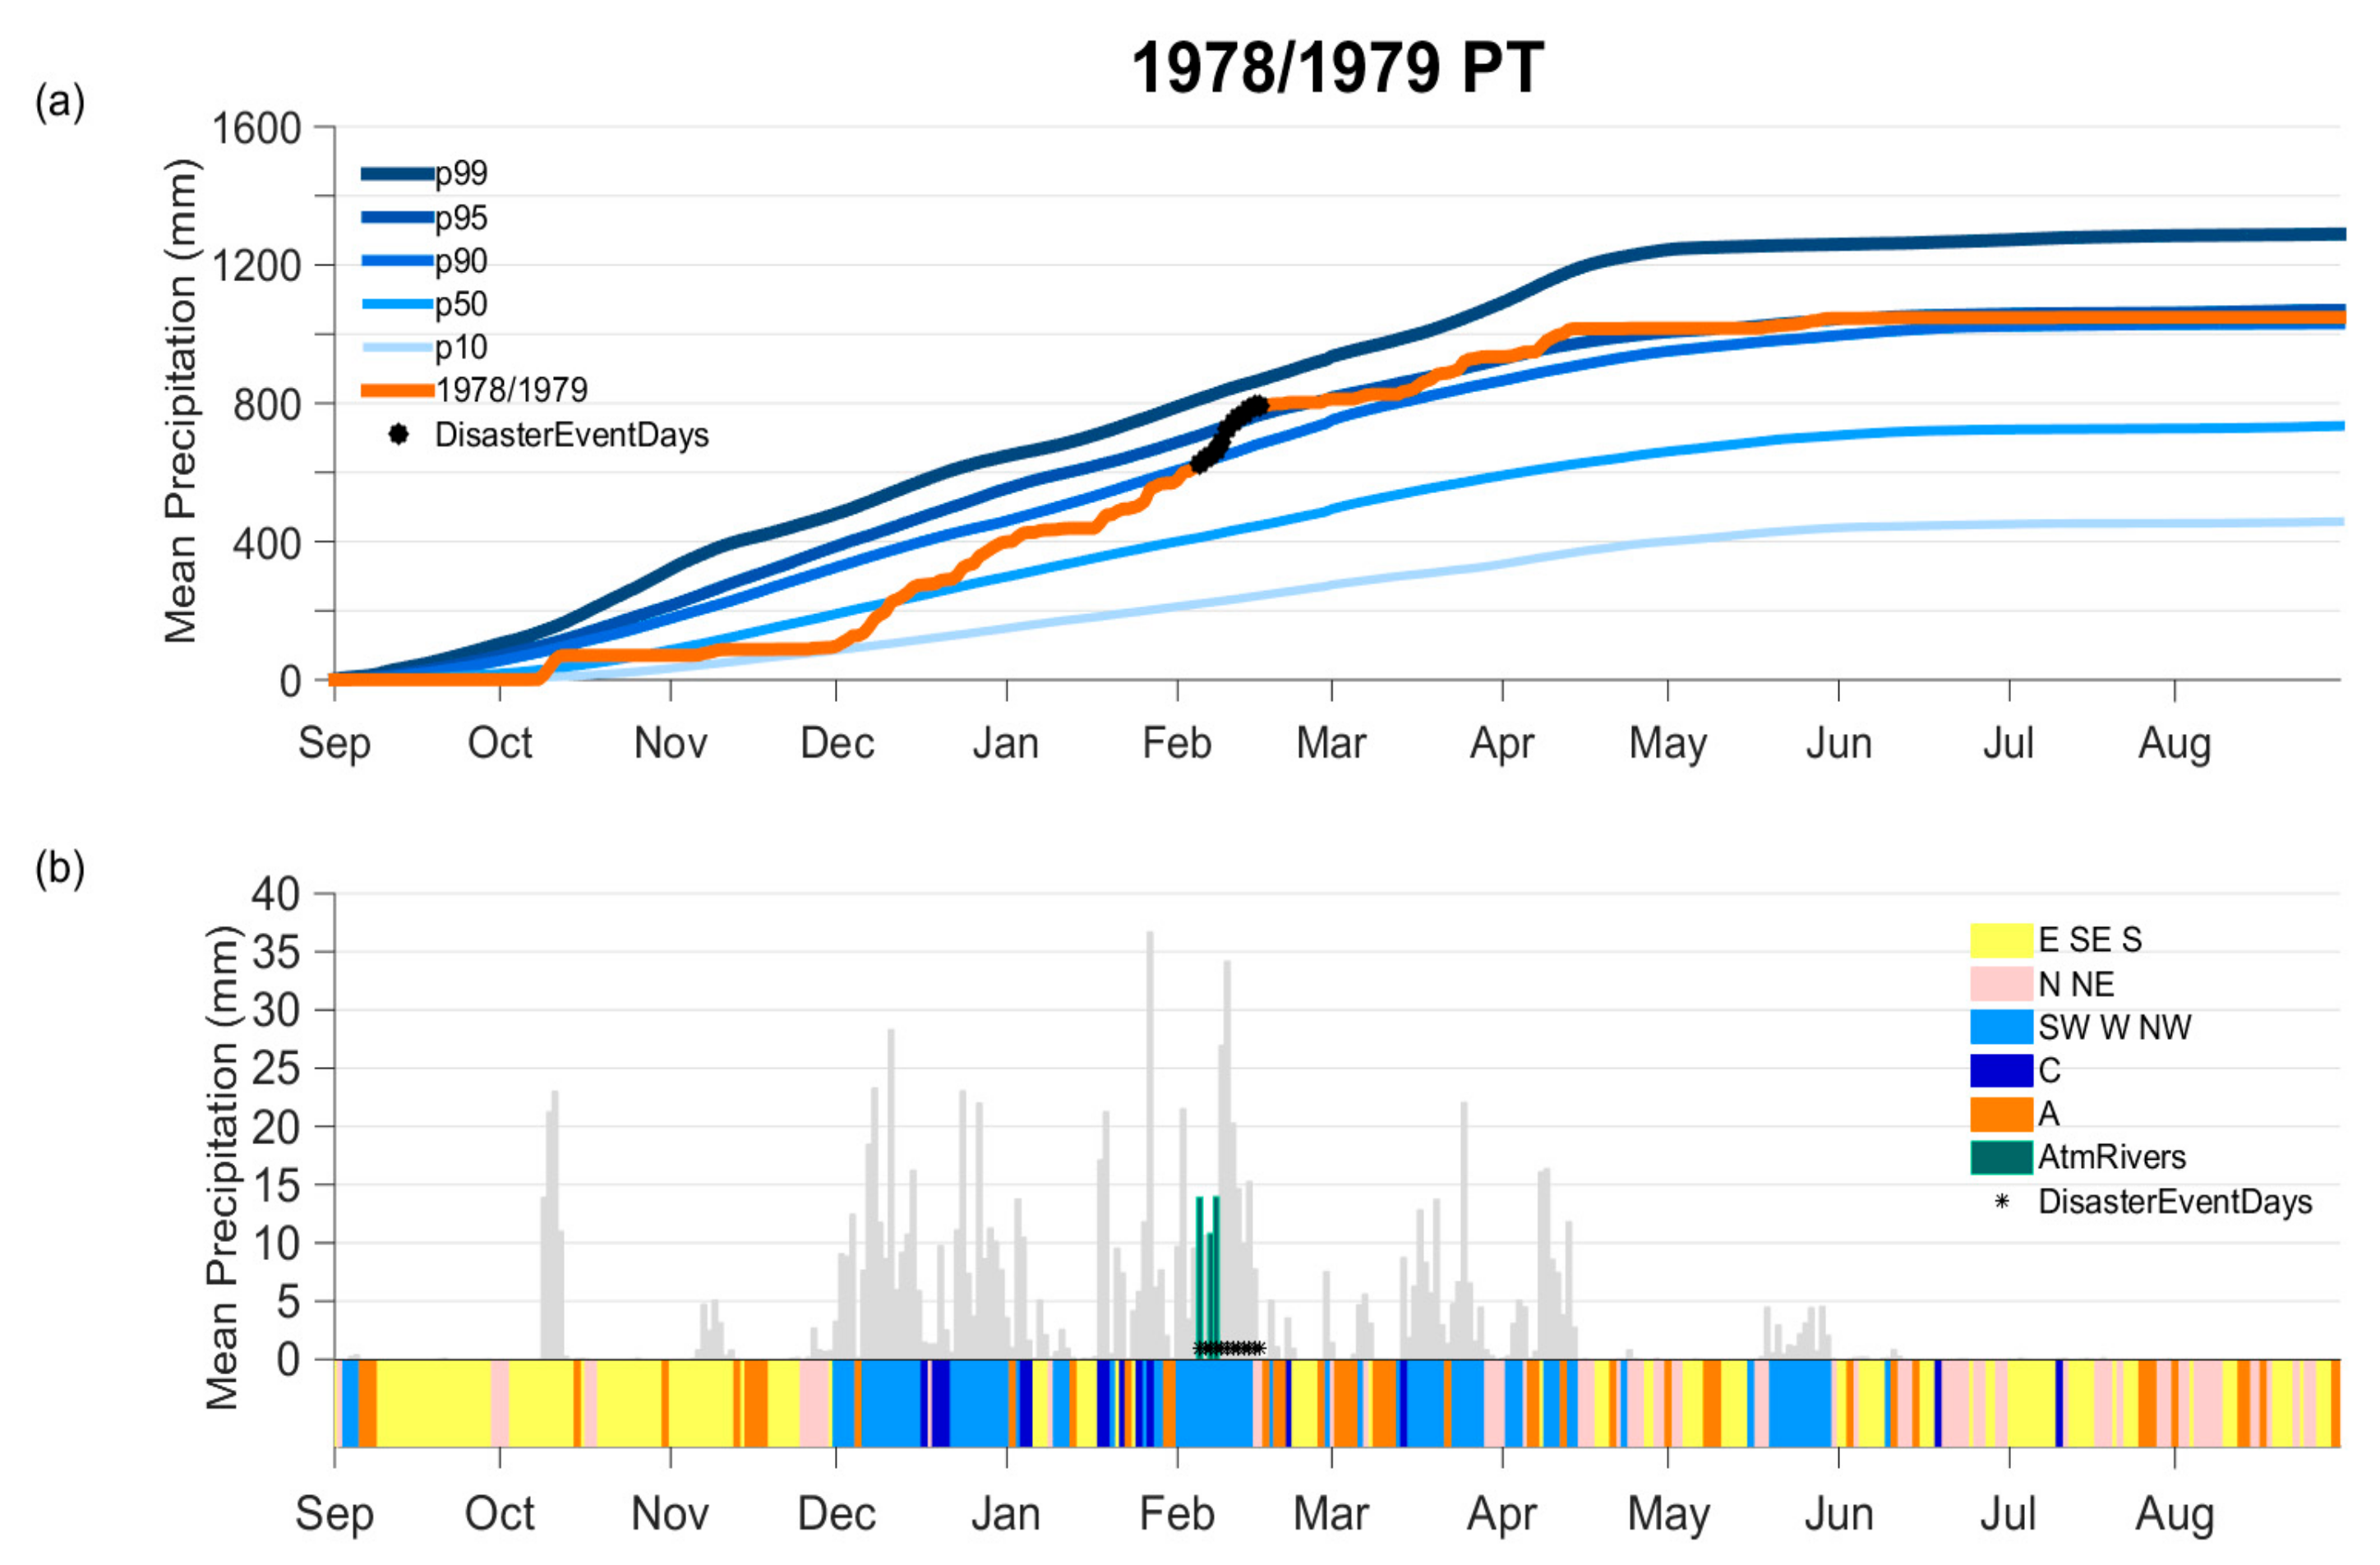
Accumulated precipitation affecting Portugal during February 1979 (Figure 7a) shows that this changed from roughly the 90th percentile threshold of the climatological series on 5 February to over the 95th percentile on 16 February. This suggests that a period of continuous intense precipitation occurred over Portugal during the event but also that the entire winter period (December–March) recorded above-average rainfall values, particularly taking into account that the hydrological year was relatively dry until late November (~10%).
As referenced in the introduction, winter precipitation over Portugal is generally well correlated with the occurrence of wet CWTs over western Iberia [7]. The same rationale holds for the 1979 winter period as shown by the evolution of daily CWTs and average precipitation for Portugal (Figure 7b). In particular, Figure 7b shows that from 20 January–16 February, the predominant daily CWTs affecting Iberia were the SW, W, NW and C (highlighted in bluish colours). These “wet” CWT match well with the prolonged period of high daily precipitation and aggregate multi-day precipitation. It is worth mentioning that the same relationship between wet CWTs and high precipitation values was observed on several other multi-day periods, particularly from the beginning of December 1978 to the beginning of January 1979, and between mid-March and mid-April 1979.
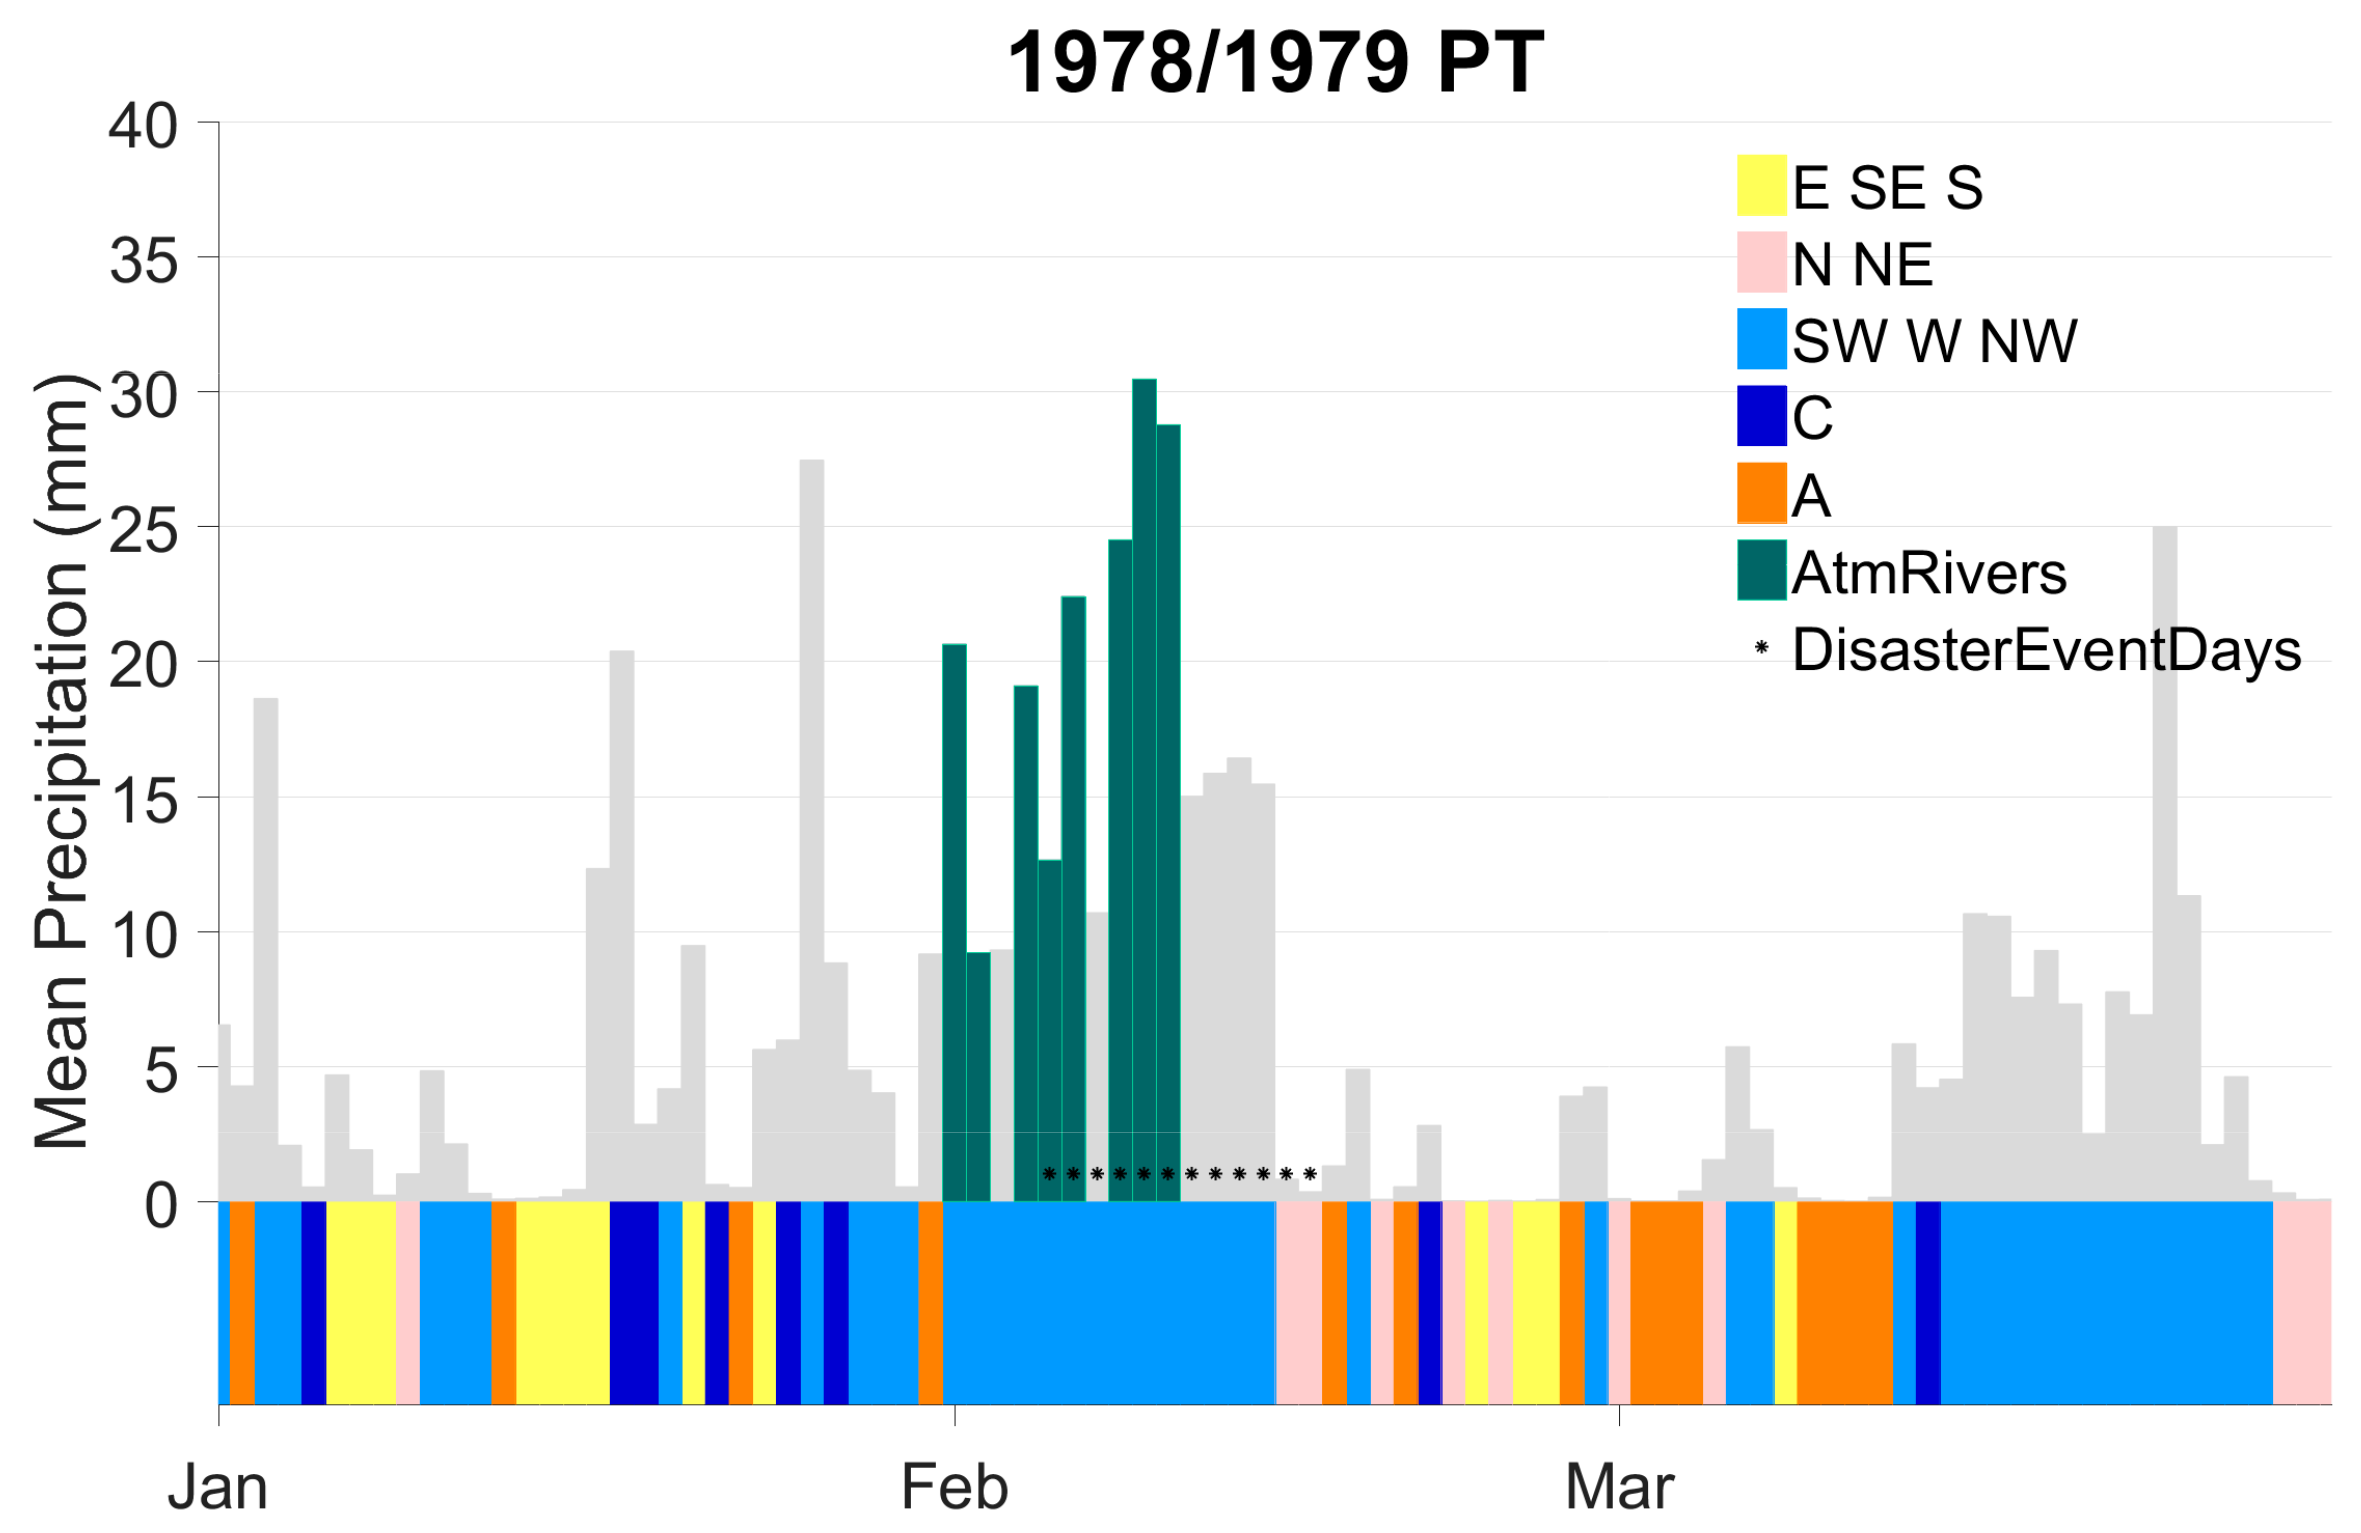
In Figure 8, the same event was depicted with greater detail and spatial resolution, focusing only on the short winter period (January–March). The daily CWT classes and ARs identified on this figure proceed from the use of ERA-I reanalysis datasets. The daily accumulated precipitation values are estimated from the IB02 precipitation dataset. The use of higher resolution datasets for this evaluation provides a more robust daily AR detection over western IP and a better representation of the actual precipitation on the central and northern river basins of Portugal. In Figure 8, we see that the number of days affected by ARs during the event doubles regarding the number obtained with the 20CR reanalysis (Figure 7b), and that the higher precipitation days of the event (8–10 February) benefit from the occurrence of ARs. Further, according to this Reanalysis, two additional days are classified as AR moisture, providing transport just prior to the DISASTER event, namely 2 and 3 February. Overall, the mean daily precipitation values obtained by the two datasets are similar, although they show a decrease on the most extreme precipitation day (10 February). The daily CWT indices are similar to the indices estimated from the 20CRv2 datasets, and the event days are still predominantly co-located with western directional CWTs regulating the weather over the Peninsula.
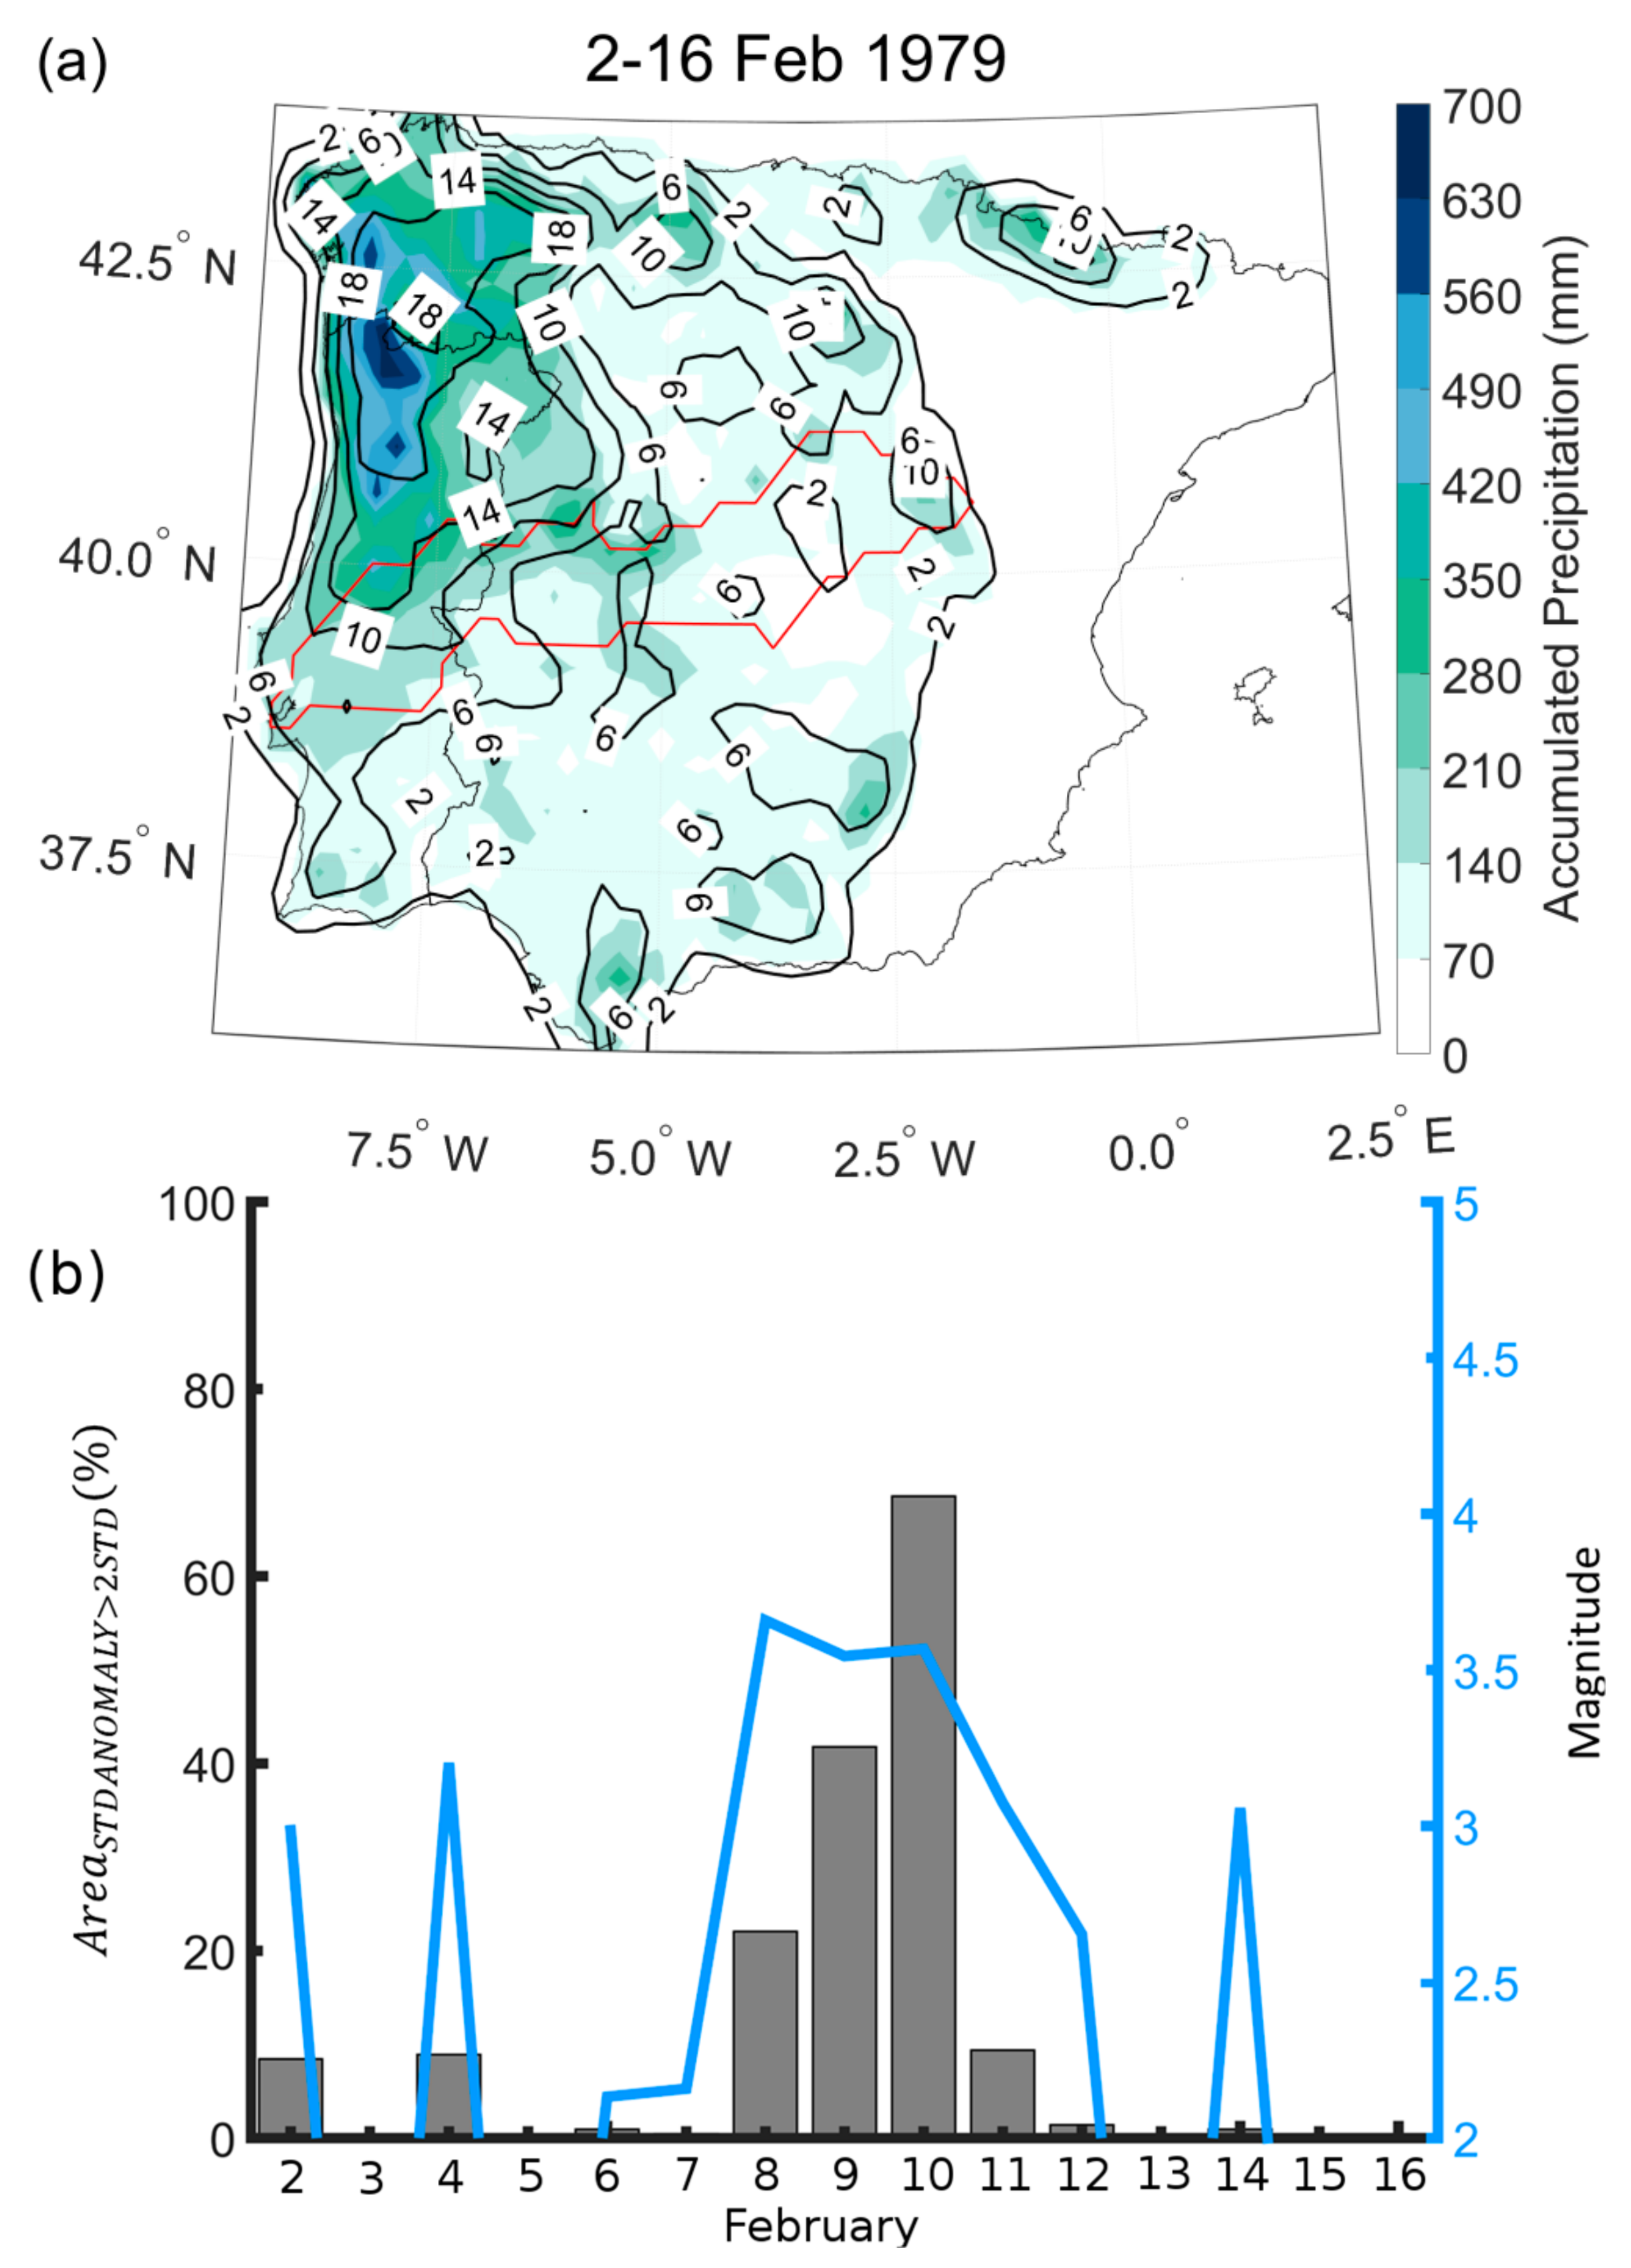
The pattern of anomalous precipitation produced by the accumulated rainfall observed during the 2–16 February period over the Iberian Peninsula domain is shown in Figure 9a, in units of mmt standard deviation anomalies [18]. This multiday event produced large anomalies for most of the Iberian Peninsula domain, with the highest standardized anomalies over Portugal being found on the Minho and Douro basins (>18 std), followed by the Águeda, Mondego, and West basins (>10 std and 14 std) and the Tagus basin (>6 std). This 15-day period marks the top event in the entire Iberian Peninsula and to the second top event in Portugal when the same methodology as [18] is applied to 15 day accumulated anomalies
The daily precipitation magnitude of the 2–16 February event over the Tagus region is shown in Figure 9b. In this event, there were eight days with high magnitude rainfall (8, 9, 10, 2, 4, 11, 12, and 14 February, by decreasing order). During the days of higher precipitation (i.e., 8, 9 and 10 February) the percentage of Tagus basin area affected by climatologically abnormal precipitation values (over 2 standard deviations) reaches 20%, 40% and nearly 70% of the Tagus total basin area, respectively.
The second set of days—2, 4, 11, 12 and 14 February—affected a smaller area over the Tagus basin with abnormal precipitation (near 10% of the basin area per day) but maintaining a relevant composite magnitude value. Also, the higher magnitude days for this event coincide with the higher daily mean accumulated precipitation (Figure 7b).
The spatial distribution of the daily accumulated precipitation over Iberia, from 1 February–16 February, is represented in supplementary Figure 1 (Figure S1), which shows the event precipitation evolution over the territory and the 75th, 90th and 95th percentile thresholds of climatological daily precipitation, wherever these are reached. During the initial phase of the event (4–6 February), precipitation was above the 95th percentile threshold, for the north and central regions of Portugal. From 8–10 February, extreme precipitation expanded regionally towards the south and centre of the Iberian Peninsula, producing abnormal precipitation over most of the Iberian Tagus basin. However, the centre-north and north of Portugal remained frequently above the 90th percentile threshold. Overall, 9 and 10 February were the two rainiest days of the event, as is confirmed in Figure 7b. By the end of the event (12–14 February), the intense precipitation retreated to the northwest of Iberia mostly over the Douro and Mondego basins (considering only Portuguese territory). By this time the Portuguese Tagus basin still registered some precipitation above the 75th precipitation threshold, mostly in the western sector.
3.4. Large Scale Atmospheric Circulation
The regional atmospheric circulation affecting this period has been briefly described in the previous section in terms of prevailing CWTs (Figure 7 and Figure 8). Here we intend to characterize the large atmospheric circulation affecting the North Atlantic Ocean and the Iberian Peninsula for the period between 1 February and 16 February. A special focus will be given to 9 and 10 February, which recorded the highest daily precipitation values for the entire event.
The six-hourly sequence of SLP and corresponding accumulated precipitation (both obtained from the ERA-I dataset) between 1 February at 00UTC and 16 February at 18UTC can be seen in the supplementary Video 1 (Video S1). During this 16-day period, the week between 1 February and 7 February was characterized by the presence of a strong baroclinic system over the North Atlantic Ocean, with a deep low-pressure core established near the Eastern USA coast, the influence of which regulated the Western Iberian weather for several days, and which originated several moderate to high 6-h precipitation events at the local and regional scales mostly over the centre and northern regions of Portugal.
On 7 February, a new deep low-pressure core replaced the previous one and formed off the Eastern USA coast progressing eastwards towards the Western Iberian Peninsula until 10 February, when it became stationary at a northwest position from the Iberian Peninsula. During this three-day stretch, an intensification of the six-hour precipitation values was observed over Portugal—where maxima 6-h precipitation values occurred for the entire event on 9 and 10 February.
From 11–14 February, the atmospheric circulation over Iberia remained cyclonic (compatible with class C in Figure 7) and was characterized by the sequential formation of several low-pressure cores north of the area, resulting in almost continuous precipitation until early 15 February.
From this date onwards until the end of the event at 16 February 18UTC, the two low pressure systems (the one over the Atlantic, near the Eastern USA coast, and the one over continental Europe) became separated from each other due to the presence of an anticyclonic stretching from Scandinavia to the eastern tropical North Atlantic Ocean, west from the African coast. This high-pressure band regulated the weather in the Western Iberia Peninsula during the last two days of the event (15–16 February), allowing for a shift in the regional circulation towards the anticyclonic type (A), with no significant precipitation being observed till the end of the event.
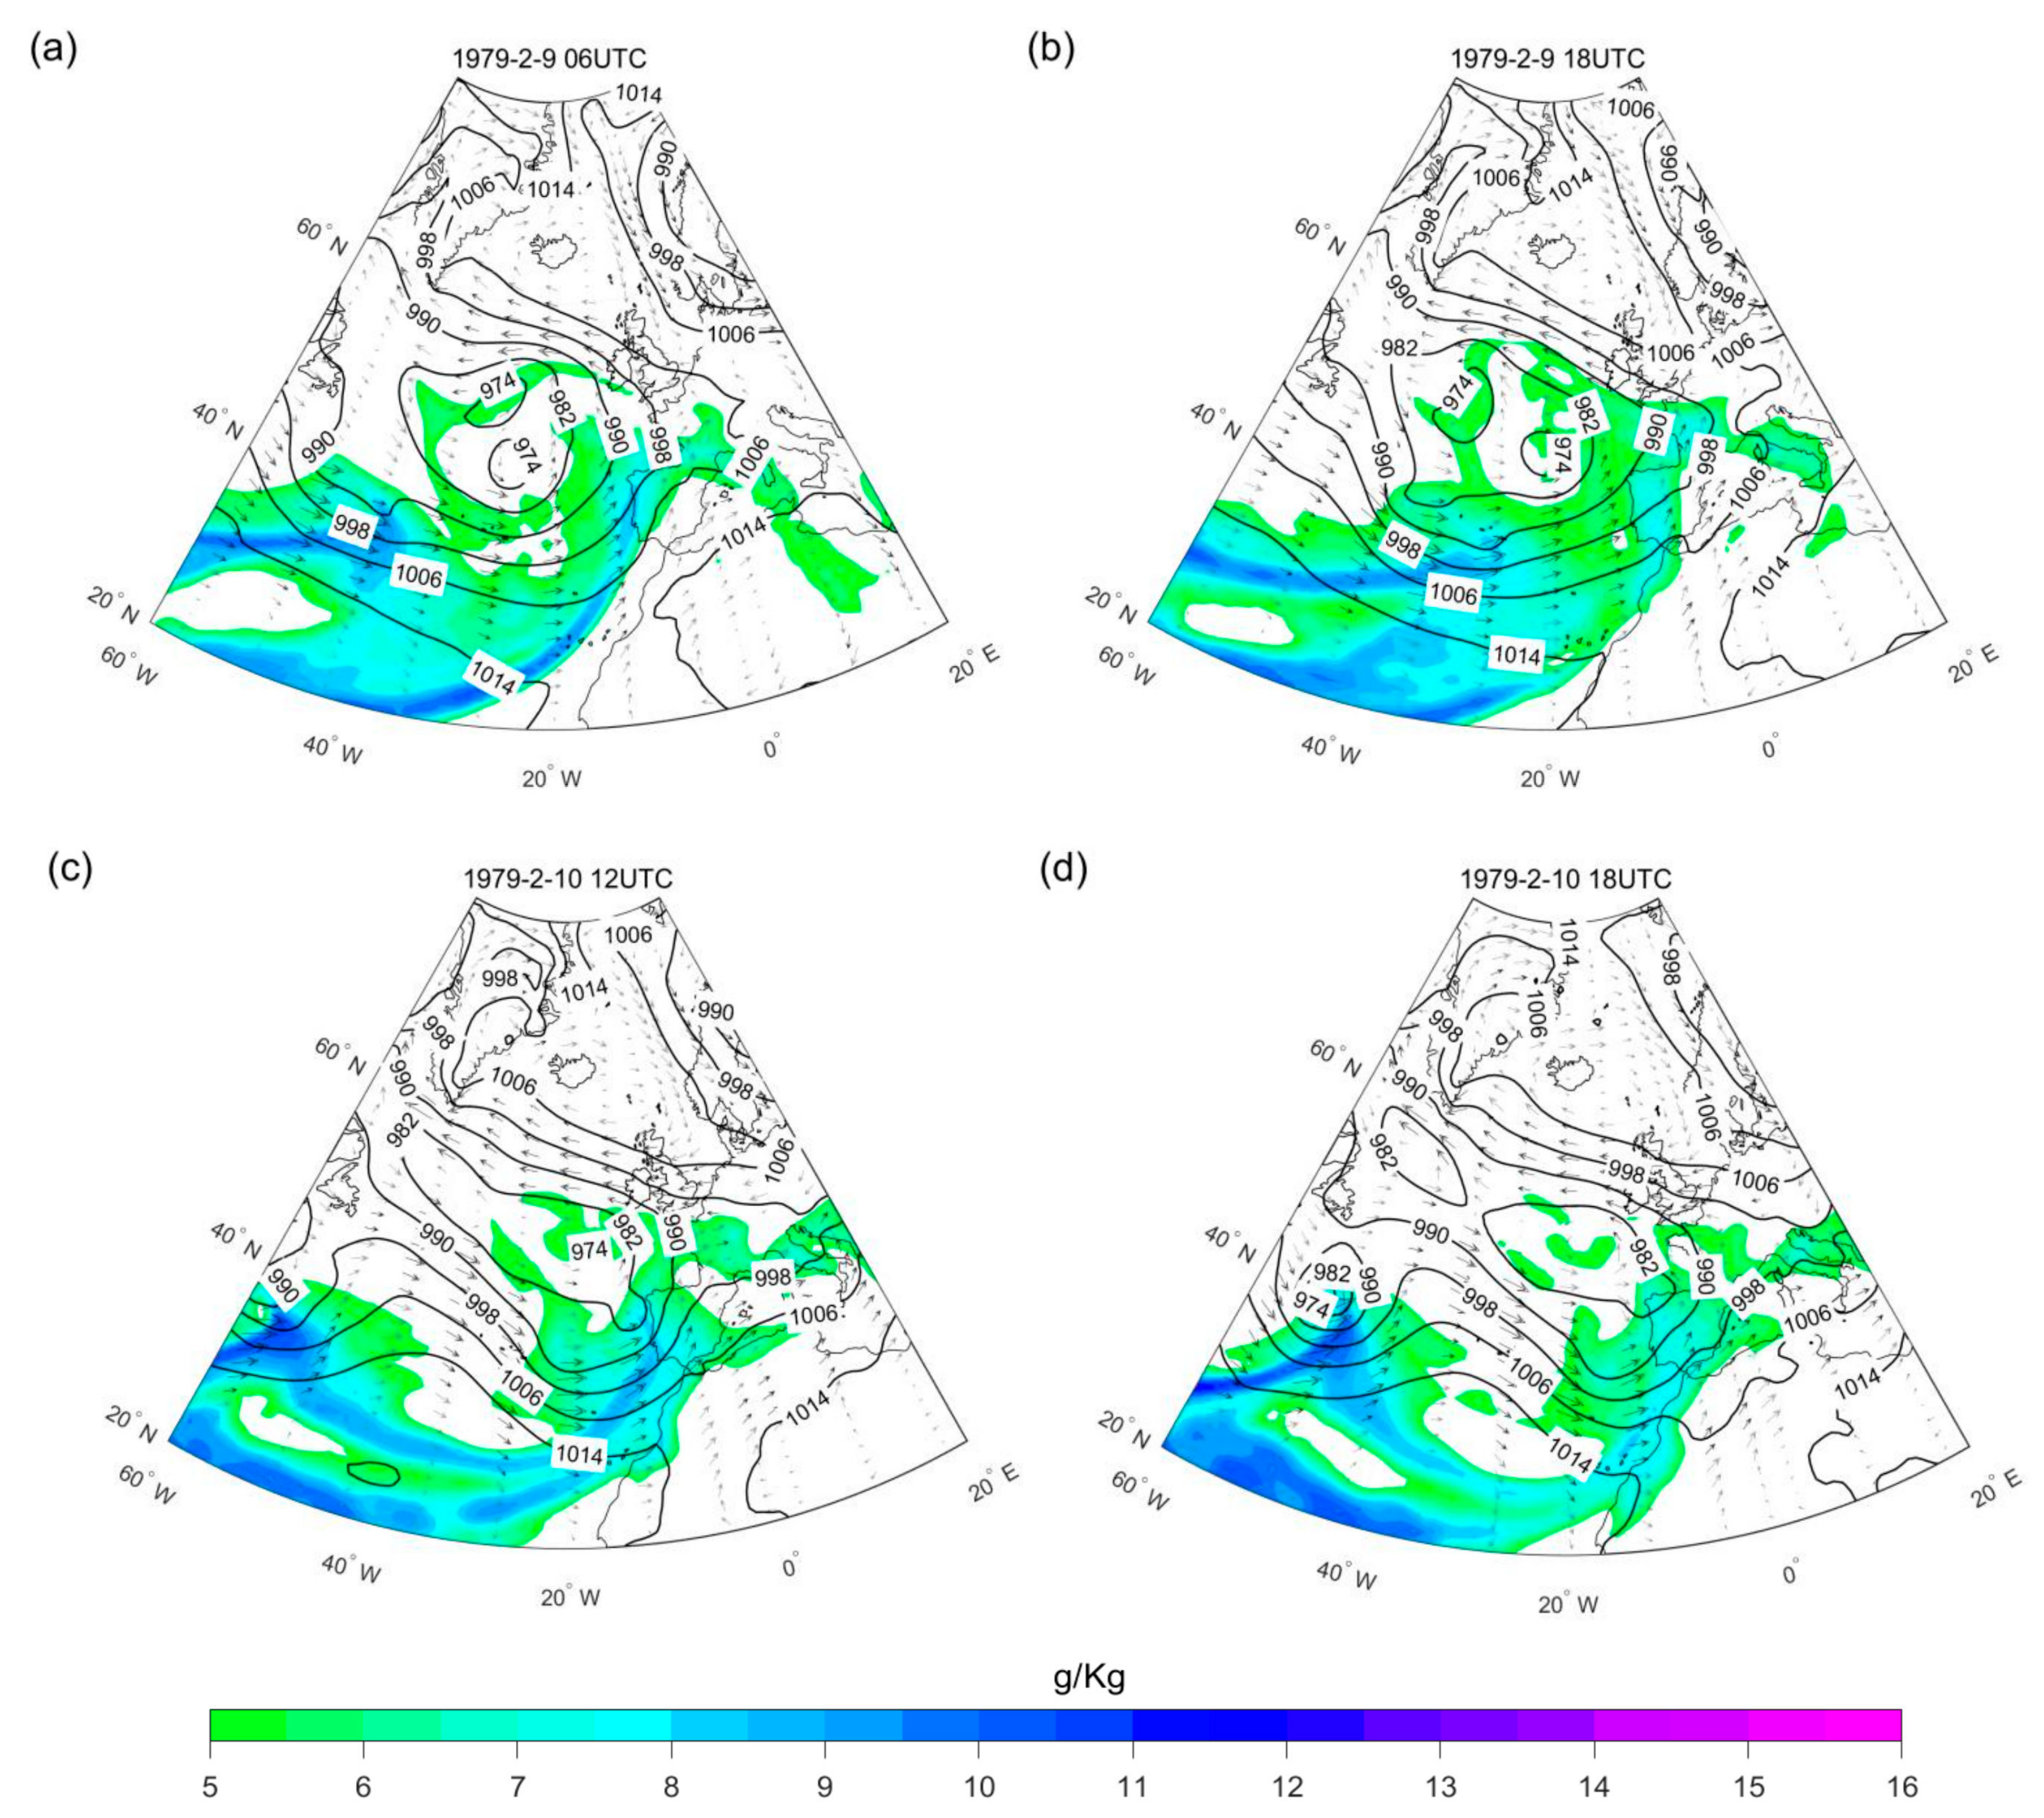
Figure 10 shows the mean 6 h SLP, specific humidity and wind vectors for 9 February 06UTC and 10 February 12UTC (the peak 6 h accumulated precipitation periods for each day) and for 9 February 18UTC and 10 February 18UTC. Here we confirm the presence of a large deep low-pressure system over the North Atlantic Ocean, located west from the Iberian Peninsula and extending from Greenland to the Canary Islands and from the Eastern USA to continental Western Europe as seen in Video S1. During this same period, a high-pressure plateau is present over North Africa, at 1014 hPa, which favours the production of a strong SW-NE pressure gradient over Iberia, bridging the North Africa high pressures with the cyclonic low-pressures present at centre of the North Atlantic.
To analyse moisture availability–which can enhance the intensity of precipitation events–the 6 h specific humidity and wind vectors at 900 hPa over the North Atlantic Ocean and continental extra-tropical latitudes are shown in supplementary Video 2 (Video S2, spanning the same 16-day period from 1 February 00UTC to 16 February 18UTC). From Video S2 it is possible to see that there is an almost continuous 6 h daily high moisture availability over the Western Iberia domain with specific humidity values rising frequently above 6 g/kg, and during certain days, reaching values near 9–10 g/kg. This high moisture availability derives from the continuous and very strong sea moisture advection produced towards Western Iberia by the daily presence of persistent large scale longitudinal transport winds extending across the North Atlantic Ocean, either related to the large-scale cyclonic circulation or to the presence of atmospheric rivers or both.
During this period, the North Atlantic Ocean is crossed several times by narrow and prolonged bands of high moisture concentration, with cores above 9 g/kg that originate near the Caribbean islands and move towards extratropical latitudes by the influence of a southwestern low-level jet associated with the frontal systems. For most of the period, these bands correspond to the presence of ARs reaching Western Iberia, and in Figure 8, we observe that only days 3, 7, 11–16 February miss the presence of persistent ARs at the west coast of Iberia. A closer look at 9 and 10 February (Figure 10) shows that during this period a strong low-level jet from the southwest is continually reaching Western Iberia, transporting high values of moisture from the tropical North Atlantic Ocean. These jets are aided by the presence of the previously mentioned SW-NE pressure gradient crossing the Iberia, but additionally are also part of the persistent ARs phenomena that keeps fuelling tropical moisture towards the Iberian coast during the event, helping to maintain the very high values of specific humidity over the Western Iberian Peninsula.
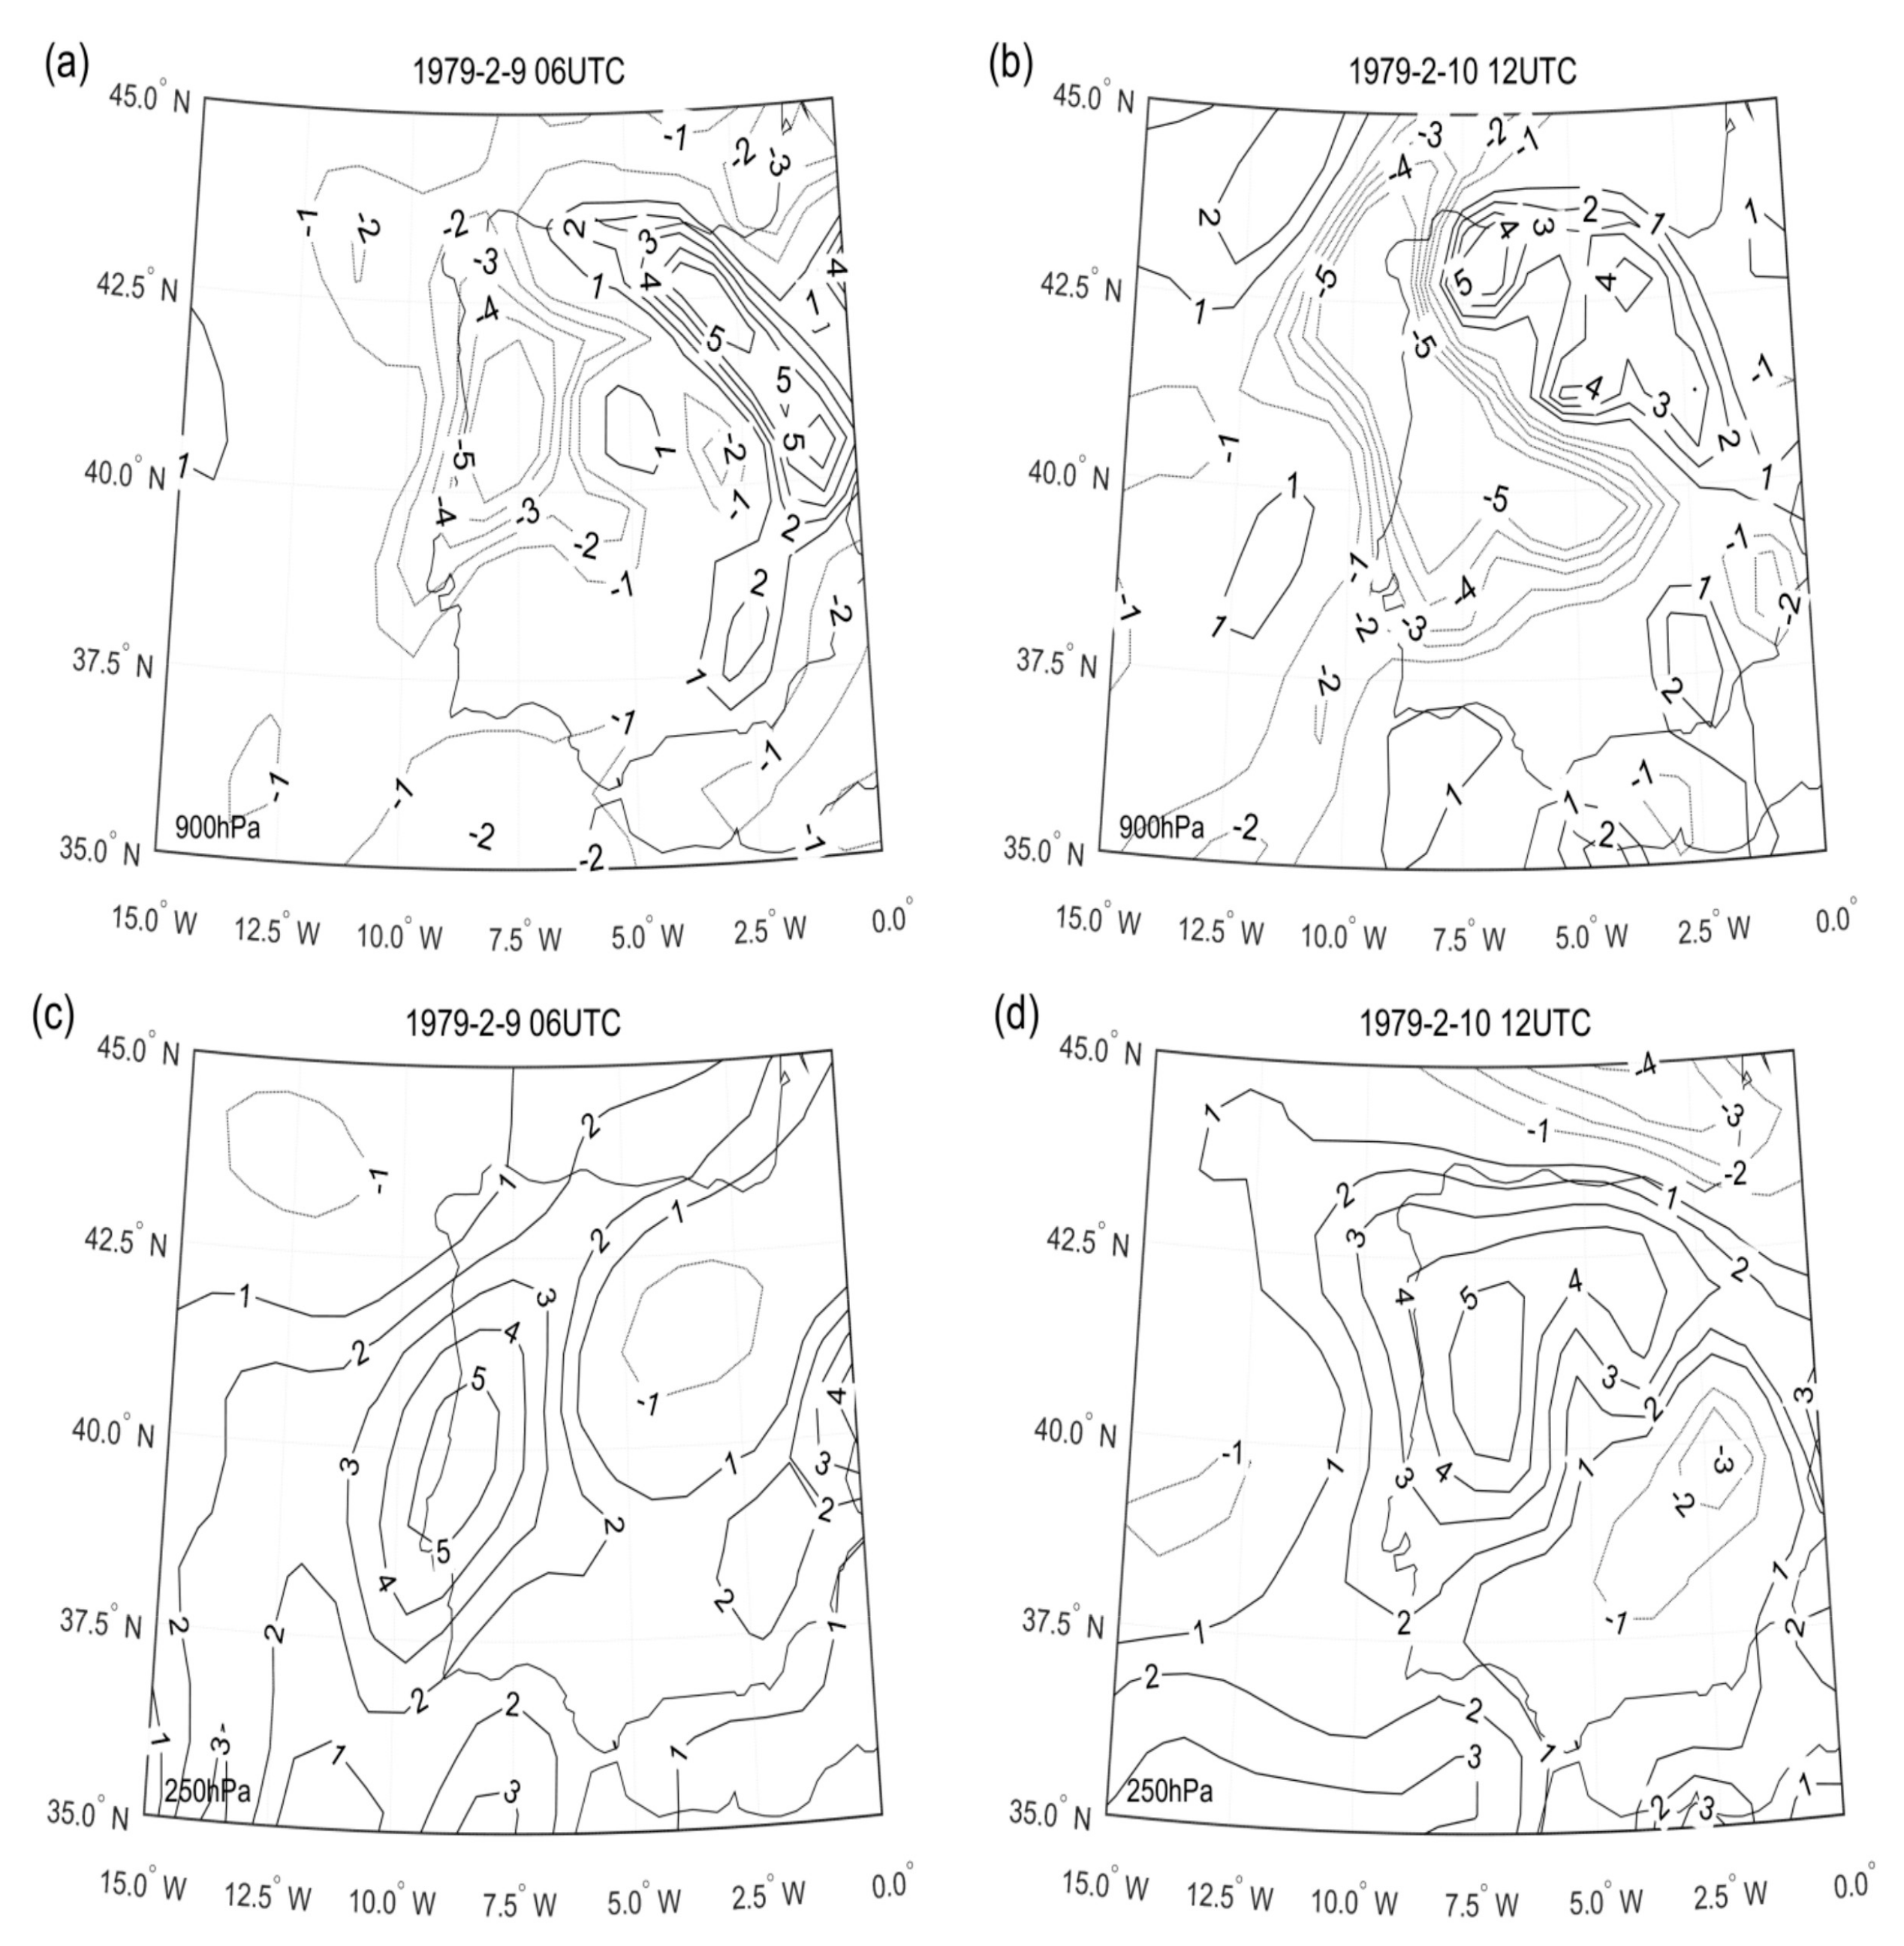
The wind vectors near the surface during these time steps suggest the existence of low-level convergence near Western Iberia, which may favour convective instability adding to the possibility of rainfall intensification during these days. To test this hypothesis, we computed the upper (250 hPa) and lower level (900 hPa) divergence fields over Iberia for the peak precipitation time steps (9 February at 06UTC and 10 February at 12UTC) (Figure 11).
Here we can see that at the lower levels (900 hPa) the divergence fields are negative over most of Western Iberia, reaching values below −5 × 10⁻⁵ s−1 on 9 February 06UTC and 10 February 12UTC, for vast regions in the centre and north of Portugal. This suggests very deep low-level convergence at the regional and local scales. The upper-level divergence field (250 hPa) shows that upper level divergence over Western Iberia remains positive, over 2 × 10⁻⁵ s−1 for large swaths of the Western Iberian Peninsula on both time steps. Overall, these results suggest the presence of deep convective instabilities over Western Iberia on the peak precipitation days.
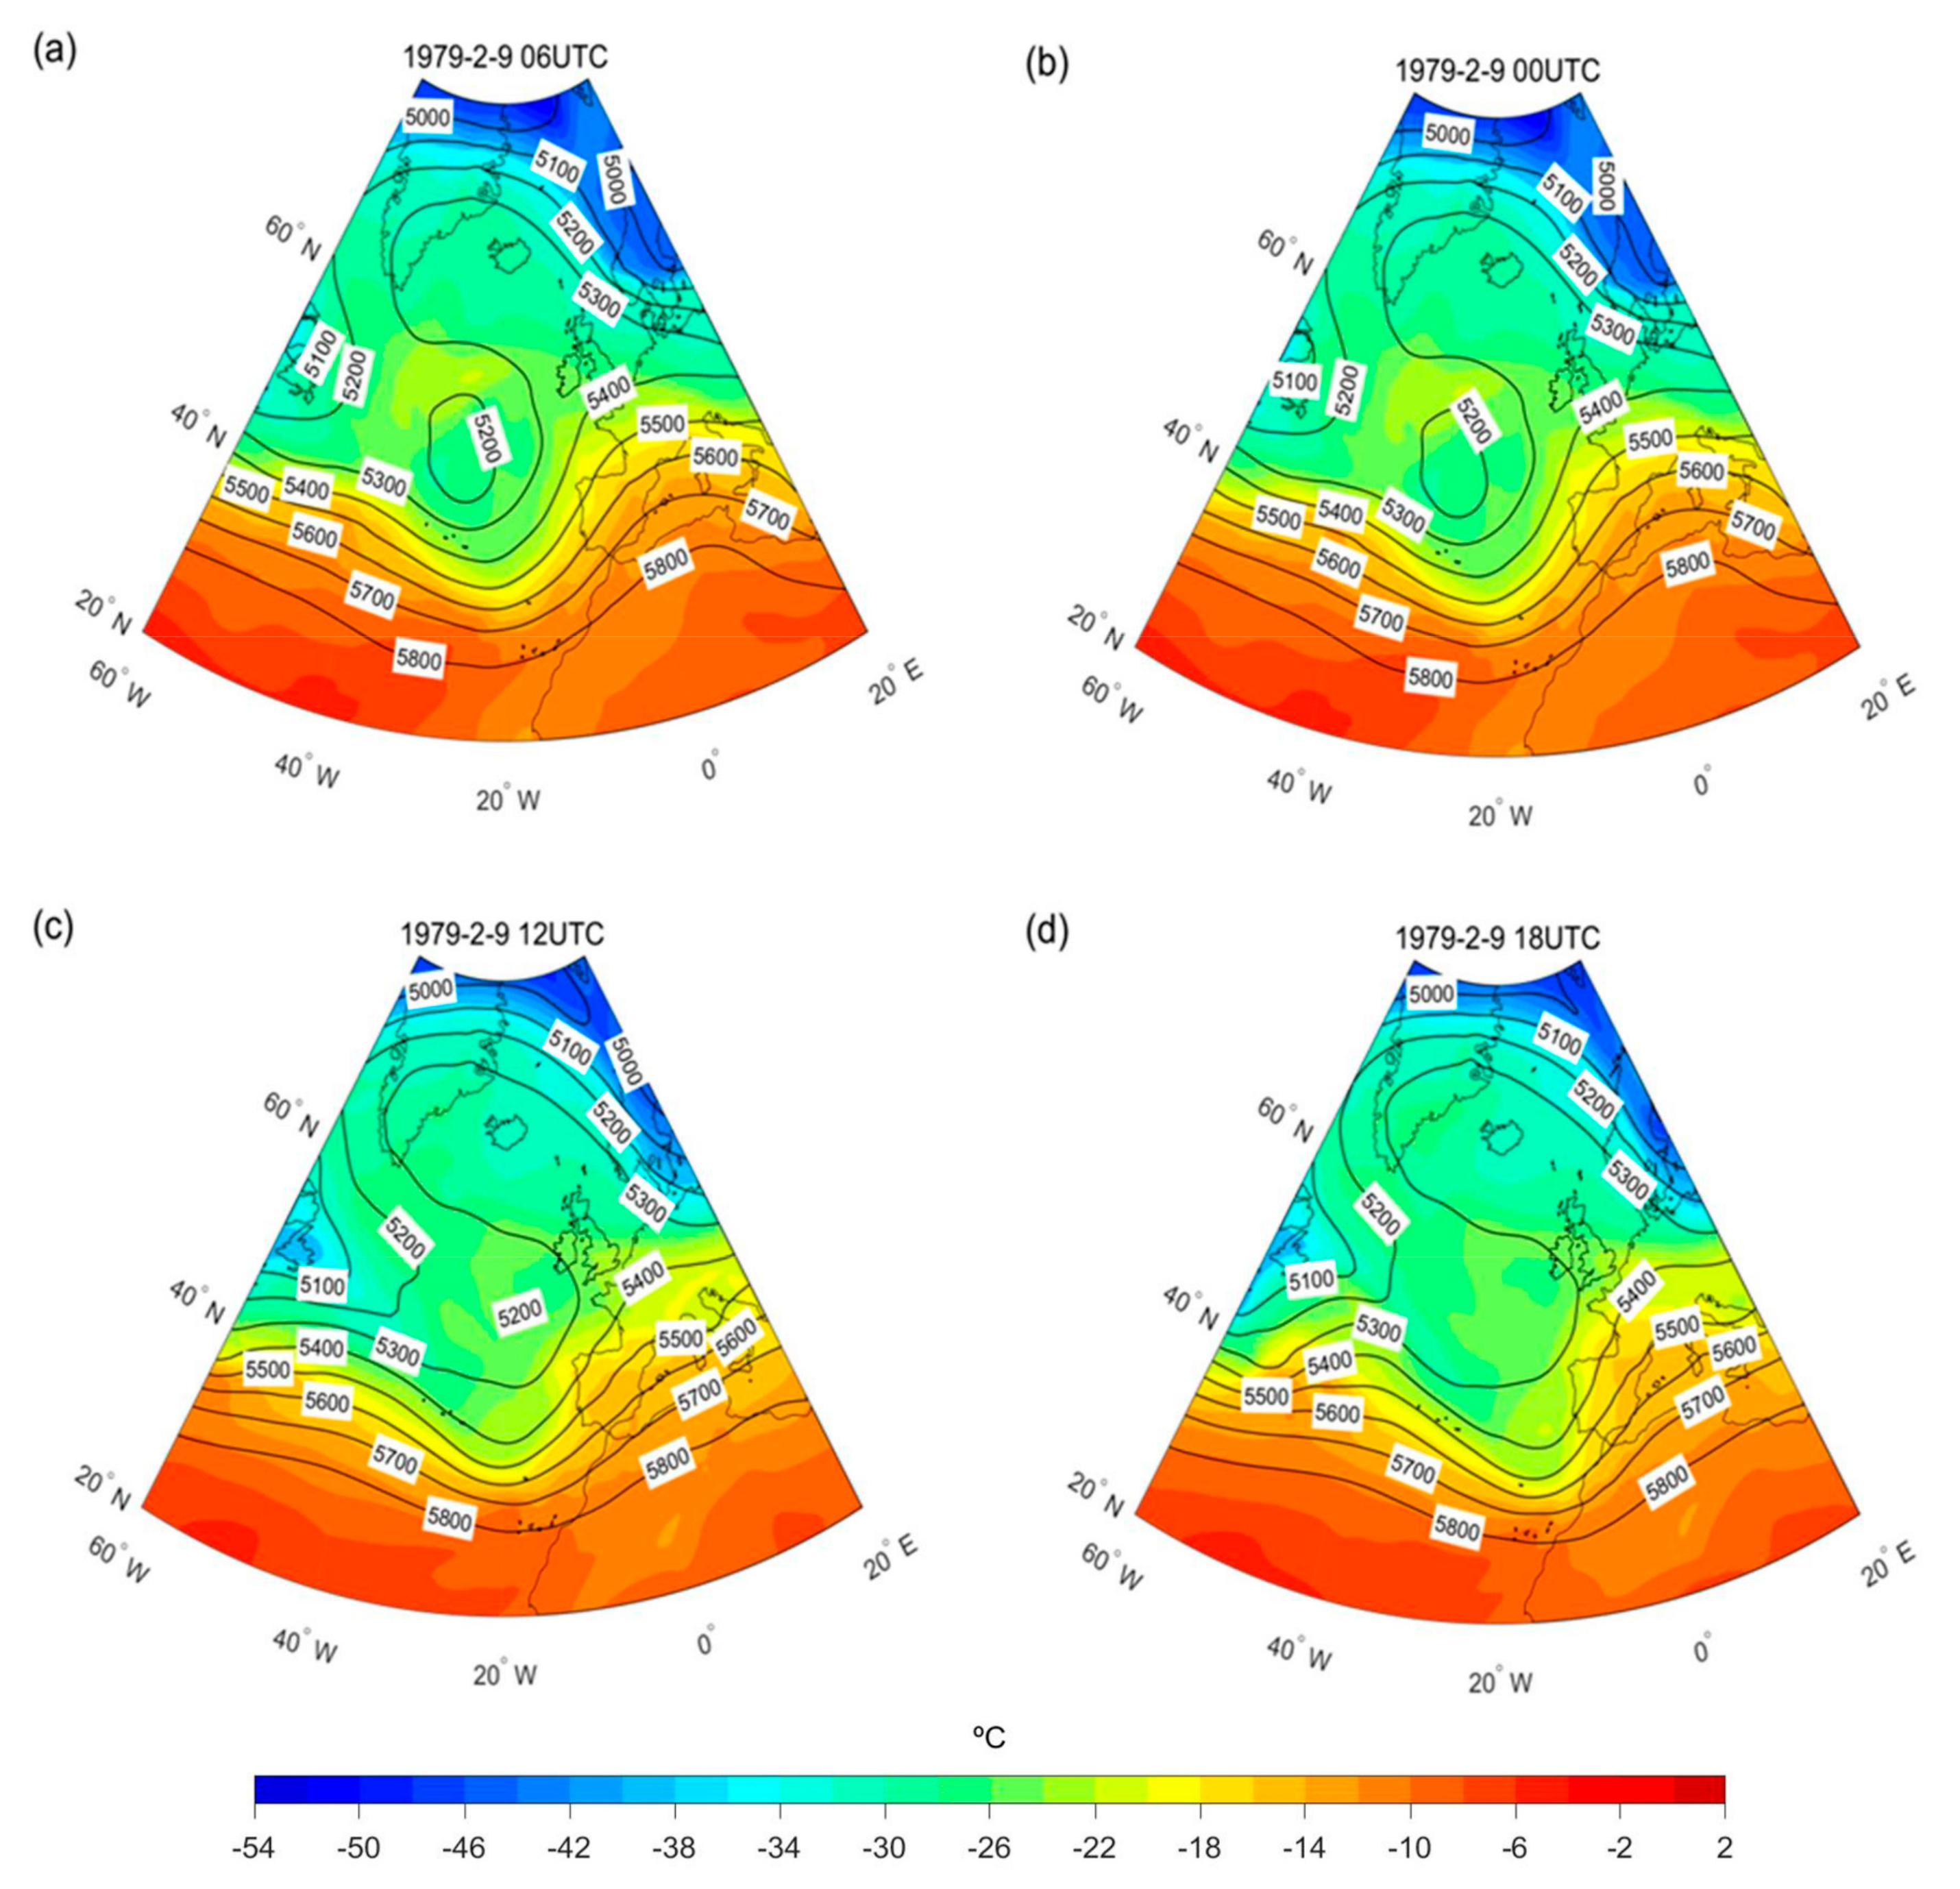
Finally, to further analyse the role of the upper- and lower- level dynamics of the event for the peak precipitation days of the event, we computed the geopotential height and temperature (°C) at 500 hPa for the 06/18 UTC and 12/18 UTC time steps for 9 and 10 February (Figure 12). The presence of a strong trough is visible over the Eastern North Atlantic, along the NW-SE direction, located near Madeira Island, while being associated with a cold air wedge inserting itself along the trough, from higher North Atlantic latitudes towards the Iberian Peninsula. This configuration of cold air inserting itself as a wedge on a relatively warmer air mass, while associated with a large scale cyclonic circulation over the North Atlantic, is indicative of the presence of a cold frontal system operating near the Western Iberia coast. This further explains the high precipitation values observed over the Iberian Peninsula’s western coast, specifically the Portuguese Tagus basin, during the peak precipitation days of the event.
4. Discussion
The 5–16 February 1979 event is the top ranked in the DISASTER database (since 1865) in terms of human impact for each one of the three Portuguese main hydrographic regions affected: Douro, Mondego and Tagus. This event was mainly characterized by progressive flooding occurring along the lowland sectors of each main river’s basin, with the majority of the cases and affected people concentrated along the Tagus river floodplain. The authors are aware that larger floods occurred in recent history, including record floods in Douro [1] and Tagus [2]. However, to the best of our knowledge, the 1979 event was the most extreme flood in the Tagus basin since major dams were built in these large international river basins, particularly between the 1950s and 1970s [24]. The 1979 event was responsible for 62 damaging floods and five damaging landslides in Portugal. However, it did not cause any loss of human life, despite resulting in the greatest number of evacuated (4244) and displaced (14,322) people recorded in the DISASTER database.
In the last two centuries, the various regions of the Iberian Peninsula have suffered major extreme precipitation events with significant socio-economic impact. While it is beyond the scope of this work to provide an extensive compilation of all these events, we do want to highlight two other studies of regions of Spain in order to put the February 1979 event into a wider context. The estimation of extreme flash flood evolution in Barcelona County from 1351 to 2005 was undertaken by [25], where the authors analysed all the floods that have occurred in Barcelona County (Catalonia) since the 14th century, as well as the flooded area, urban evolution, impacts and the weather conditions. The most severe events are mainly associated with flash floods that are often produced by a sudden thunderstorm that usually develops into a mesoscale convective system. In addition, [26] studied the large-scale patterns of daily precipitation extremes on the Iberian Peninsula, where it was found that extreme precipitation events on the Western Iberian Peninsula mainly occurred under strong zonal flow, with a long Atlantic fetch generating moisture advection towards that area. On the eastern sector of the Iberian Peninsula, the most important pattern associated with extreme precipitation is characterized by a cut-off low system at mid-levels together with easterly moisture flow from the Mediterranean.
Moreover, we want to highlight three additional studies where flash flood events had a major socio-economic impact on the Iberian Peninsula. The deadliest storm affecting Portugal since at least the early 19th century took place on 25 and 26 November 1967, causing more than 500 fatalities [4]. In addition, between 6–8 November 1982, there occurred one of the most catastrophic flash-flood events in the Eastern Pyrenees affecting Andorra and also Southern France and Eastern Spain with rainfall accumulations exceeding 400 mm in 24 h with 44 fatalities and widespread damage [27]. Finally, on 5 November 1997, extreme precipitation with values higher than 150 mm in 24 h in Southern Portugal and Extremadura province in Spain produced major flash flood events, causing major socio-economic impact with 11 deaths in Portugal and 21 in Spain [20].
While flash floods are mainly associated with heavy rain over a small period of time, persistent precipitation over several days can cause slow onset floods on river basins. In addition, slow onset floods struck Portugal in the last 200 years, such as the floods of the Tagus and Guadiana Rivers in December 1876 [2] and Douro in 1909 [1]. The first week of December 1876 was marked by extreme weather conditions that affected the south-western sector of the Iberian Peninsula, leading to an all-time record flow in these two large international rivers. As a direct consequence, several Portuguese and Spanish towns and villages located in the banks of both rivers suffered serious flood damage on 7 December 1876. These unusual floods were amplified by the particularly wet autumn months, with October 1876 presenting extremely high precipitation anomalies for all Western Iberian stations. The case of the record floods in Douro [1] corresponds with the combination of persistent precipitation over several days, culminating with heavy rain on the 22 December 1909, leading to 89 casualties (57 due to floods and 32 due to landslides) and a further total of 3876 affected people, including fatalities, injured, missing, evacuated and homeless people.
The February 1979 event was considered a major flood in the Tagus valley in the 20th century (even when river flow was controlled by dams) due to the flooded area extension and the human and economic impact. This flood falls into the category of slow onset floods due to persistent precipitation over the two-week period, with rising water levels causing dikes to rupture, as well as flooding and isolating settlements, main roads and railroads. Also, there were recorded electric power and water supply failures in Lisbon and the surrounding municipalities. All these human damages (displaced and evacuated people) and services ruptures referenced in the newspapers were felt in the life of the population beyond the days of the event.
The February 1979 event is framed within a 25-day period of very high and abnormal precipitation totals for most of the Portuguese continental territory, at the daily, multi-day and hydrological year scales, as shown in Section 3.3. In fact, this event corresponded to the third most significant event for the Iberian Peninsula and Portugal when using the 10-days accumulated ranking previous published [18]. In this work, we have updated this accumulated ranking to a 15-day period, and when using a larger accumulated period, the results show that it was the top event in the Iberian Peninsula and the second top event in Portugal. However, when we considered 10-days or 15-days accumulated precipitation for the Tagus basin (Figure 8b), this event was outside the top 20 ranking of events [18]. This is explained by the highest daily precipitation magnitudes for the Tagus region appearing on the period spanning between 8–11 February, coinciding with the greatest amount of human damage registered on this basin during the event (9–13 February).
The major Portuguese Rivers and tributaries located in the south are characterized by irregular regimes, with floods during the rainy autumn and winter months and droughts during the dry summer months. The rivers’ regimes are directly related to the annual and monthly rainfall variability that characterizes a Mediterranean climate [20]. Taking the example of the Tagus basin, after the dams construction, the river flow peaks reduced and also the frequency of floods [20]. This is particularly true during the autumn months when the water storage capacity of dams is being restored after the prolonged dry summer period.
The regional atmospheric circulation affecting the Iberian Peninsula throughout this specific event was analysed by means of CWT and by the analysis of different meteorological fields. Regarding the CWT, the daily precipitation on the Iberian Peninsula during the winter season is strongly related to the occurrence of a few “wet” CWTs, namely the C, SW, NW and W [7,8]. The analysis of Figure 7b from 20 January until 16 February shows that the predominant CWTs affecting the Iberian Peninsula were the SW, W, NW and C (highlighted in bluish colours). These CWTs match well with the prolonged period of high daily precipitation and aggregate multi-day precipitation.
Moreover, close attention was also given to different meteorological fields that were used in other case studies, e.g., [1,2], that provide meaningful insight into some of the meteorological mechanisms associated with an extreme event. Summarizing, this event was characterized by the passage of consecutive low-level pressure systems north-west of the Iberian Peninsula, while being reinforced by high North Atlantic moisture advection towards the Iberian Peninsula's western coast during the same period. The recurrent presence of persistent ARs reaching the Western Iberian Peninsula during or before extreme precipitation days for this event (Figure 10) significantly contributed to the North Atlantic moisture transport towards the Iberian Peninsula's western coast and to the local impact of precipitation events, since it helped concentrate moisture at more localized areas.
While all this precipitable water content hovering over the Iberian Peninsula's western coast during the event was available to precipitate, there were indeed favourable meteorological conditions for triggering floods and deep landslides. For example, the aforementioned passage of the frontal systems fuelled by ARs that were associated with the large synoptic scale low pressure system storm track established over the Atlantic (Figure 10), the local convective instabilities produced by low level wind convergences and upper level wind divergences over the continental Iberian Peninsula (Figure 11) and the orographic forced convections developed in rugged terrains, most significantly in the centre and north regions of Portugal.
Similar to other extreme events, part of the widespread socio-economic impact was due to human poor decisions. During the February 1979 DISASTER event, dams were not capable to efficiently control river flow peaks, resulting in flooding along the lower Tagus valley. In particular, the huge Spanish Alcántara Dam (3162 hm3 of capacity, located close to the Portuguese border, Figure 1) released significant amounts of water at the same time as the Castelo do Bode Dam (900 hm3 capacity, located in river Zêzere, the main tributary of Tagus within Portugal, Figure 1). Thus, it seems that the two most likely factors that contributed to this outcome were the prolonged precipitation period during that winter and the poor coordination of the dams’ discharges between the Portuguese and Spanish authorities.
Supplementary Materials
The following are available online at https://www.mdpi.com/2073-4441/10/4/454/s1, Figure S1: Spatial distribution of the daily accumulated precipitation (mm) over Iberia, for the period from 1 February to 16 February, Video S1: 6-hourly sequence of Sea Level Pressure (hPa) and corresponding accumulated precipitation (mm) between 1 February at 00UTC and 16 February at 18UTC, Video S2: 6-hourly sequence of specific humidity (g/Kg) and corresponding wind vectors at 900 hPa (m/s) between 1 February at 00UTC and 16 February at 18UTC.
Acknowledgments
This work was financed by national funds through FCT-Portuguese Foundation for Science and Technology, I.P., under the framework of the project FORLAND—Hydro-geomorphologic risk in Portugal: driving forces and application for land use planning (PTDC/ATPGEO/1660/2014). Alexandre M. Ramos was also supported by a FCT postdoctoral grant (FCT/DFRH/ SFRH/BPD/84328/2012). Finally the authors would like to thank two anonymous referees, who helped to improve the final version of the manuscript.
Author Contributions
Ricardo M. Trigo and Alexandre M. Ramos conceived and designed the experiments; Luis Rebelo, Alexandre M. Ramos and Susana Pereira performed the experiments. Luis Rebelo, Alexandre M. Ramos, Susana Pereira and Ricardo M. Trigo analysed the data and wrote the paper.
Conflicts of Interest
The authors declare no conflict of interest.
References
- Pereira, S.; Ramos, A.M.; Zêzere, J.L.; Trigo, R.M.; Vaquero, J.M. Spatial impact and triggering conditions of the exceptional hydro-geomorphological event of December 1909 in Iberia. Nat. Hazards Earth Syst. Sci. 2016, 16, 371–390. [Google Scholar] [CrossRef]
- Trigo, R.M.; Varino, F.; Ramos, A.M.; Valente, M.; Zêzere, J.L.; Vaquero, J.M.; Gouveia, C.M.; Russo, A. The record precipitation and flood event in Iberia in December 1876: Description and synoptic analysis. Front. Earth Sci. 2014, 2, 3. [Google Scholar] [CrossRef]
- Ramos, A.M.; Trigo, R.M.; Liberato, M.L.R. A ranking of high-resolution daily precipitation extreme events for the Iberian Peninsula. Atmos. Sci. Lett. 2014, 15, 328–334. [Google Scholar] [CrossRef]
- Trigo, R.M.; Ramos, C.; Pereira, S.S.; Ramos, A.M.; Zêzere, J.L.; Liberato, M.L.M.L.R. The deadliest storm of the 20th century striking Portugal; flood impacts and atmospheric circulation. J. Hydrol. 2016, 541, 597–610. [Google Scholar] [CrossRef]
- Santos, M.; Santos, J.A.; Fragoso, M. Atmospheric driving mechanisms of flash floods in Portugal. Int. J. Climatol. 2017, 37, 671–680. [Google Scholar] [CrossRef]
- Fragoso, M.; Trigo, R.M.; Pinto, J.G.; Lopes, S.; Lopes, A.; Ulbrich, S.; Magro, C. The 20 February 2010 Madeira flash-floods: Synoptic analysis and extreme rainfall assessment. Nat. Hazards Earth Syst. Sci. 2012, 12, 715–730. [Google Scholar] [CrossRef] [Green Version]
- Trigo, R.M.; DaCamara, C.C. Circulation weather types and their influence on the precipitation regime in Portugal. Int. J. Climatol. 2000, 20, 1559–1581. [Google Scholar] [CrossRef]
- Ramos, A.M.; Cortesi, N.; Trigo, R.M. Circulation weather types and spatial variability of daily precipitation in the Iberian Peninsula. Front. Earth Sci. 2014, 2, 25. [Google Scholar] [CrossRef]
- Ramos, A.M.; Trigo, R.M.; Liberato, M.L.R.; Tomé, R. Daily Precipitation Extreme Events in the Iberian Peninsula and Its Association with Atmospheric Rivers. J. Hydrometeorol. 2015, 16, 579–597. [Google Scholar] [CrossRef]
- Gimeno, L.; Nieto, R.; Vázquez, M.; Lavers, D.A. Atmospheric rivers: A mini-review. Front. Earth Sci. 2014, 2. [Google Scholar] [CrossRef]
- Zêzere, J.L.; Pereira, S.; Tavares, A.O.; Bateira, C.; Trigo, R.M.; Quaresma, I.; Santos, P.P.; Santos, M.; Verde, J. DISASTER: A GIS database on hydro-geomorphologic disasters in Portugal. Nat. Hazards 2014, 72, 503–532. [Google Scholar] [CrossRef]
- Guzzetti, F. Landslide fatalities and the evaluation of landslide risk in Italy. Eng. Geol. 2000, 58, 89–107. [Google Scholar] [CrossRef]
- Pereira, S.; Zêzere, J.L.; Quaresma, I.D.; Bateira, C. Landslide incidence in the North of Portugal: Analysis of a historical landslide database based on press releases and technical reports. Geomorphology 2014, 214, 514–525. [Google Scholar] [CrossRef]
- Pereira, S.; Ramos, A.M.; Rebelo, L.; Trigo, R.M.; Zêzere, J.L. Hydro-geomorphologic events in Portugal and its association with Circulation weather types. In Proceedings of the 19th EGU General Assembly (EGU2017), Vienna, Austria, 23–28 April 2017; Volume 19. [Google Scholar]
- Dee, D.P.; Uppala, S.M.; Simmons, A.J.; Berrisford, P.; Poli, P.; Kobayashi, S.; Andrae, U.; Balmaseda, M.A.; Balsamo, G.; Bauer, P.; et al. The ERA-Interim reanalysis: Configuration and performance of the data assimilation system. Q. J. R. Meteorol. Soc. 2011, 137, 553–597. [Google Scholar] [CrossRef]
- Belo-Pereira, M.; Dutra, E.; Viterbo, P. Evaluation of global precipitation data sets over the Iberian Peninsula. J. Geophys. Res. Atmos. 2011, 116, D20101. [Google Scholar] [CrossRef]
- Herrera, S.; Gutiérrez, J.M.; Ancell, R.; Pons, M.R.; Frías, M.D.; Fernández, J. Development and analysis of a 50-year high-resolution daily gridded precipitation dataset over Spain (Spain02). Int. J. Climatol. 2012, 32, 74–85. [Google Scholar] [CrossRef] [Green Version]
- Ramos, A.M.; Trigo, R.M.; Liberato, M.L.R. Ranking of multi-day extreme precipitation events over the Iberian Peninsula. Int. J. Climatol. 2017, 37, 607–620. [Google Scholar] [CrossRef]
- Ludwig, P.; Schaffernicht, E.J.; Shao, Y.; Pinto, J.G. Regional atmospheric circulation over Europe during the Last Glacial Maximum and its links to precipitation. J. Geophys. Res. Atmos. 2016, 121, 2130–2145. [Google Scholar] [CrossRef]
- Ramos, C.; Reis, E. As cheias no Sul de Portugal em diferentes tipos de bacias hidrográficas. Finisterra 2001, 36, 61–82. [Google Scholar] [CrossRef]
- Sobrinho, A. Os temporais de Fevereiro de 1979 no Ribatejo e Região de Lisboa. Finisterra Rev. Port. Geogr. 1980, 25, 85–93. [Google Scholar] [CrossRef]
- Ferreira, A.B.; Zêzere, J.L.; Rodrigues, M.L. The Calhandriz landslide (Metropolitan area of Lisbon). In Landslides; Chacón, J., Irigaray, C., Fernández, J., Eds.; Balkema: Rotterdam, The Netherlands, 1996; pp. 31–38. ISBN 90 5410832 0. [Google Scholar]
- Intituto Nacional de Estatística. XII Recenseamento Geral da População; Intituto Nacional de Estatística: Lisboa, Portugal, 1981. [Google Scholar]
- Trigo, R.M.; Pozo-Vázquez, D.; Osborn, T.J.; Castro-Díez, Y.; Gámiz-Fortis, S.; Esteban-Parra, M.J. North Atlantic oscillation influence on precipitation, river flow and water resources in the Iberian Peninsula. Int. J. Climatol. 2004, 24, 925–944. [Google Scholar] [CrossRef]
- Barrera, A.; Llasat, M.C.; Barriendos, M. Estimation of extreme flash flood evolution in Barcelona County from 1351 to 2005. Nat. Hazards Earth Syst. Sci. 2006, 6, 505–518. [Google Scholar] [CrossRef] [Green Version]
- Merino, A.; Fernández-Vaquero, M.; López, L.; Fernández-González, S.; Hermida, L.; Sánchez, J.L.; García-Ortega, E.; Gascón, E. Large-scale patterns of daily precipitation extremes on the Iberian Peninsula. Int. J. Climatol. 2016, 36, 3873–3891. [Google Scholar] [CrossRef]
- Trapero, L.; Bech, J.; Duffourg, F.; Esteban, P.; Lorente, J. Mesoscale numerical analysis of the historical November 1982 heavy precipitation event over Andorra (Eastern Pyrenees). Nat. Hazards Earth Syst. Sci. 2013, 13, 2969–2990. [Google Scholar] [CrossRef] [Green Version]
Figure 1.
Flood and landslide DISASTER cases from the 5–16 February 1979 event in Portugal (A) and in the Tagus basin (B).
Figure 1.
Flood and landslide DISASTER cases from the 5–16 February 1979 event in Portugal (A) and in the Tagus basin (B).

Figure 2.
Top 5 ranked DISASTER events according to the total number of affected people in the Douro (a) and Tagus (b) basins.
Figure 2.
Top 5 ranked DISASTER events according to the total number of affected people in the Douro (a) and Tagus (b) basins.

Figure 3.
Daily distribution of evacuated people, homeless people and DISASTER cases in the Douro (a) and Tagus basins (b) during the period 5–16 February 1979. For the sake of readability, please take into account the difference in magnitude of both y-y axis.
Figure 3.
Daily distribution of evacuated people, homeless people and DISASTER cases in the Douro (a) and Tagus basins (b) during the period 5–16 February 1979. For the sake of readability, please take into account the difference in magnitude of both y-y axis.

Figure 4.
Tagus River mean daily flow (black line) obtained for the hydrological year of 1978/79 computed using three locations: Tramagal (Abrantes), Almourol (V. N. da Barquinha) and Ómnias (Santarém). In addition, a zoom for February 1979 is also presented for each individual location.
Figure 4.
Tagus River mean daily flow (black line) obtained for the hydrological year of 1978/79 computed using three locations: Tramagal (Abrantes), Almourol (V. N. da Barquinha) and Ómnias (Santarém). In addition, a zoom for February 1979 is also presented for each individual location.

Figure 5.
Evacuated and displaced people during the 5–16 February 1979 event in the Tagus basin.

Figure 6.
Settlement and railroad damages caused by the floods of the 5–16 February 1979 event in the Tagus basin.
Figure 6.
Settlement and railroad damages caused by the floods of the 5–16 February 1979 event in the Tagus basin.

Figure 7.
(a) 1978/1979 climatological year precipitation accumulation over Portugal (brown line) plotted against the respective 10th, 50th, 90th, 95th and 99th percentile thresholds estimated from the 20CR whole series period (1851–2014); (b) estimated daily CWT classes (bottom coloured bars) observed for the hydrological year and the corresponding daily mean precipitation values (grey columns).

Figure 8.
Short winter (January–March) detailed depiction of the 5–16 February 1979 DISASTER event, presenting the estimated daily CWT classes (bottom coloured bars) obtained from the ERA-I datasets, and the corresponding daily mean precipitation values (grey columns) obtained from the IB02 dataset. Daily ARs presence is identified through the use of a green column over the precipitation day and days with DISASTER events are signalled with a black dot.

Figure 9.
(a) Precipitation standard deviation anomalies over the Iberian Peninsula (isolines) and accumulated precipitation (shaded) for the 2–16 February 1979 precipitation event (b); daily precipitation magnitude values (right axis) and percentage of basin catchment area of abnormal precipitation, above 2 std, (left axis), considering the domain over the Tagus basin region, for the 2–16 February 1979 precipitation period. Note: The Tagus basin is contoured with a red line.

Figure 10.
The mean sea level pressure (contour interval 8 hPa), specific humidity (shaded; g/kg) along with the vector wind (m/s) at 900 hPa for: (a) 06UTC on 9 February; (b) 18UTC on 9 February; (c) 12UTC on 10 February and (d) 18 UTC on 10 February.
Figure 10.
The mean sea level pressure (contour interval 8 hPa), specific humidity (shaded; g/kg) along with the vector wind (m/s) at 900 hPa for: (a) 06UTC on 9 February; (b) 18UTC on 9 February; (c) 12UTC on 10 February and (d) 18 UTC on 10 February.

Figure 11.
Divergence (contours; 10−5 s−1) at 06UTC on 9 February and 12UTC on 10 February for (a) and (b) the 900 hPa level, and (c,d) the 250 hPa level.
Figure 11.
Divergence (contours; 10−5 s−1) at 06UTC on 9 February and 12UTC on 10 February for (a) and (b) the 900 hPa level, and (c,d) the 250 hPa level.

Figure 12.
The geopotential height (contour interval 100 m) and air temperature (shaded; °C) at 500 hPa level for: (a) 06UTC on 9 February; (b) 18UTC on 9 February; (c) 12UTC on 10 February and (d) 18 UTC on 10 February.
Figure 12.
The geopotential height (contour interval 100 m) and air temperature (shaded; °C) at 500 hPa level for: (a) 06UTC on 9 February; (b) 18UTC on 9 February; (c) 12UTC on 10 February and (d) 18 UTC on 10 February.


Table 1.
Human consequences of the February 1979 event per affected hydrographic basin.
| River Basin | DISASTER Cases | DISASTER Cases (%) | Fatalities | Injuried | Evacuated People | Displaced People | Missing People | Total Affected People |
|---|---|---|---|---|---|---|---|---|
| Floods | ||||||||
| Douro | 23 | 34.3 | 0 | 0 | 26 | 3595 | 0 | 3621 |
| Águeda, Mondego and West basins | 6 | 9.0 | 0 | 0 | 17 | 100 | 0 | 117 |
| Tagus | 33 | 49.3 | 3 | 0 | 4201 | 10,500 | 1 | 14,705 |
| Total Floods | 62 | 92.5 | 3 | 0 | 4244 | 14,195 | 1 | 18,443 |
| Landslides | ||||||||
| Douro | 2 | 3.0 | 5 | 1 | 0 | 56 | 0 | 62 |
| Águeda, Mondego and West basins | 0 | 0 | 0 | 0 | 0 | 0 | 0 | 0 |
| Tagus | 3 | 4.5 | 0 | 2 | 0 | 71 | 0 | 73 |
| Total Landslides | 5 | 7.5 | 5 | 3 | 0 | 127 | 0 | 135 |
| Total | 67 | 100 | 8 | 3 | 4244 | 14,322 | 1 | 18,578 |
Table 2.
River flow and water level in Abrantes, V.N. da Barquinha and Santarém.
| Code (Figure 1) | Name | Altitude (m) | Data Series | Avg. Annual Max. Level (m) | Annual Max. Level (m) | Avg. Annual Max. Flow Rate (m3/s) | Max. Daily Flow Rate (m3/s) | Min. Flood Rate (m3/s) |
|---|---|---|---|---|---|---|---|---|
| A | Abrantes | 20 | 1973/74–2000/01 | 6.51 | 13.89 * | 2939.35 | 10,548.5 * | 1527.2 |
| B | V. N. da Barquinha | 19 | 1974/75–2000/01 | 6.60 | 13.45 * | 3396.92 | 13,102.6 * | 1804.6 |
| C | Santarém | 18 | 1972/73–2000/01 | 6.32 | 10.45 * | 3320.71 | 13,888.5 ** | 1774.2 |
* Recorded in 11/2/1979; ** Recorded in 12/2/1979.
Table 3.
Days above the minimum flood rate along the hydrological year of 1978/79.
| Code (Figure 1) | Name | Days with Floods (1978/79) | Total Number of Days |
|---|---|---|---|
| A | Abrantes | 26–28, 30–31 December; 2, 4, 19–20, 27–28 January; 2–18 February; 15 April | 29 |
| B | V. N. da Barquinha | 26–28, 30–31 December; 2, 4–5, 20, 23, 27–29 January; 2-20 February; 11, 14–14 April | 35 |
| C | Santarém | 26 December–9 January; 20 January–23 February; 26–27 March; 11–12, 14–17 April | 57 |
© 2018 by the authors. Licensee MDPI, Basel, Switzerland. This article is an open access article distributed under the terms and conditions of the Creative Commons Attribution (CC BY) license (http://creativecommons.org/licenses/by/4.0/).
Share and Cite
MDPI and ACS Style
Rebelo, L.; Ramos, A.M.; Pereira, S.; Trigo, R.M. Meteorological Driving Mechanisms and Human Impacts of the February 1979 Extreme Hydro-Geomorphological Event in Western Iberia. Water 2018, 10, 454. https://doi.org/10.3390/w10040454
AMA Style
Rebelo L, Ramos AM, Pereira S, Trigo RM. Meteorological Driving Mechanisms and Human Impacts of the February 1979 Extreme Hydro-Geomorphological Event in Western Iberia. Water. 2018; 10(4):454. https://doi.org/10.3390/w10040454
Chicago/Turabian StyleRebelo, Luís, Alexandre M. Ramos, Susana Pereira, and Ricardo M. Trigo. 2018. "Meteorological Driving Mechanisms and Human Impacts of the February 1979 Extreme Hydro-Geomorphological Event in Western Iberia" Water 10, no. 4: 454. https://doi.org/10.3390/w10040454
Note that from the first issue of 2016, this journal uses article numbers instead of page numbers. See further details here.