Experimental Studies on Surface Vortex Mitigation Using the Floating Anti-Vortex Device in Sump Pumps


Korea Institute of Civil Engineering and Building Technology, 283 Goyangdae-Ro, Ilsanseo-Gu, Goyang-Si 10223, Gyeonggi-Do, Korea
*
Author to whom correspondence should be addressed.
Water 2018, 10(4), 441; https://doi.org/10.3390/w10040441
Submission received: 5 March 2018
/
Revised: 30 March 2018
/
Accepted: 5 April 2018
/
Published: 8 April 2018
(This article belongs to the Section Hydraulics and Hydrodynamics)
Abstract
:The maintenance of the performance of sump pumps is important to mitigate flood damage in urban areas and lowlands. However, the air-entraining vortex in the sump leads to undesirable performance degradation. Thus, in this study, the newly designed floating anti-vortex device (F-AVD) was employed in the intake pipe to enhance the efficiency of water intake in the sump by decreasing the surface vortex. The performance of the F-AVD was evaluated from the model experiments, in which the sump model was designed to represent the pump station that operates in Korea. The flow in the sump was measured using the particle image velocimetry (PIV) technique, and the velocity and vorticity distributions were compared both with and without the adoption of the F-AVD. The experimental results indicated that the vortex structures behind the intake pipe were effectively mitigated by installing the F-AVD. The vorticity magnitude behind the intake pipe was reduced in range of 24.8–52.5% after the installation of the F-AVD. However, in the case of a flow rate increase, the efficiency of the F-AVD decreased because of the strong vortex. Thus, an additional anti-vortex device (AVD), which is attached to the backwall or the floor in the sump, is required to prevent the air entrainment in conditions with high flow rates.
1. Introduction
The pump station is an important facility to control floods in urban areas and lowlands during the flood season. The rainwater collected from urban areas flows into the pump station, and the intake pump in the sump then drains the water into the rivers. Thus, the enhancement of pump station performance is one of the major objectives to mitigate urban flood damages. In the sump, however, a free-surface vortex accompanying the air entrainment can cause a discharge capacity reduction and the failure of a pump [1,2]. For these reasons, countermeasures are necessary in order to secure the stable management of the pump station by minimizing the vortex in the sump.
The flow characteristics in the sump have been presented from experimental and numerical studies. The vortices in the sump are categorized by wall-attached vortices and free-surface vortices [3]. The wall-attached vortices are related to boundary roughness and the existence of vorticity at upstream locations [4]. In the case of the free-surface vortices, the depressed pressure—due to withdrawal water—leads to the occurrence of the surface vortices, and the swirl on the water surface develops into a full air core in the intake pipe [5]. Furthermore, it is possible for the air-entraining vortex to increase under conditions of a low submerged depth of the intake pipe and a high flow rate [6]. The complex flow patterns in the sump were investigated using the particle image velocimetry (PIV) technique [7,8]. From the numerical simulations, Guo et al. [9] reported the mechanisms of air entrainment using the helicity density in the sump pump.
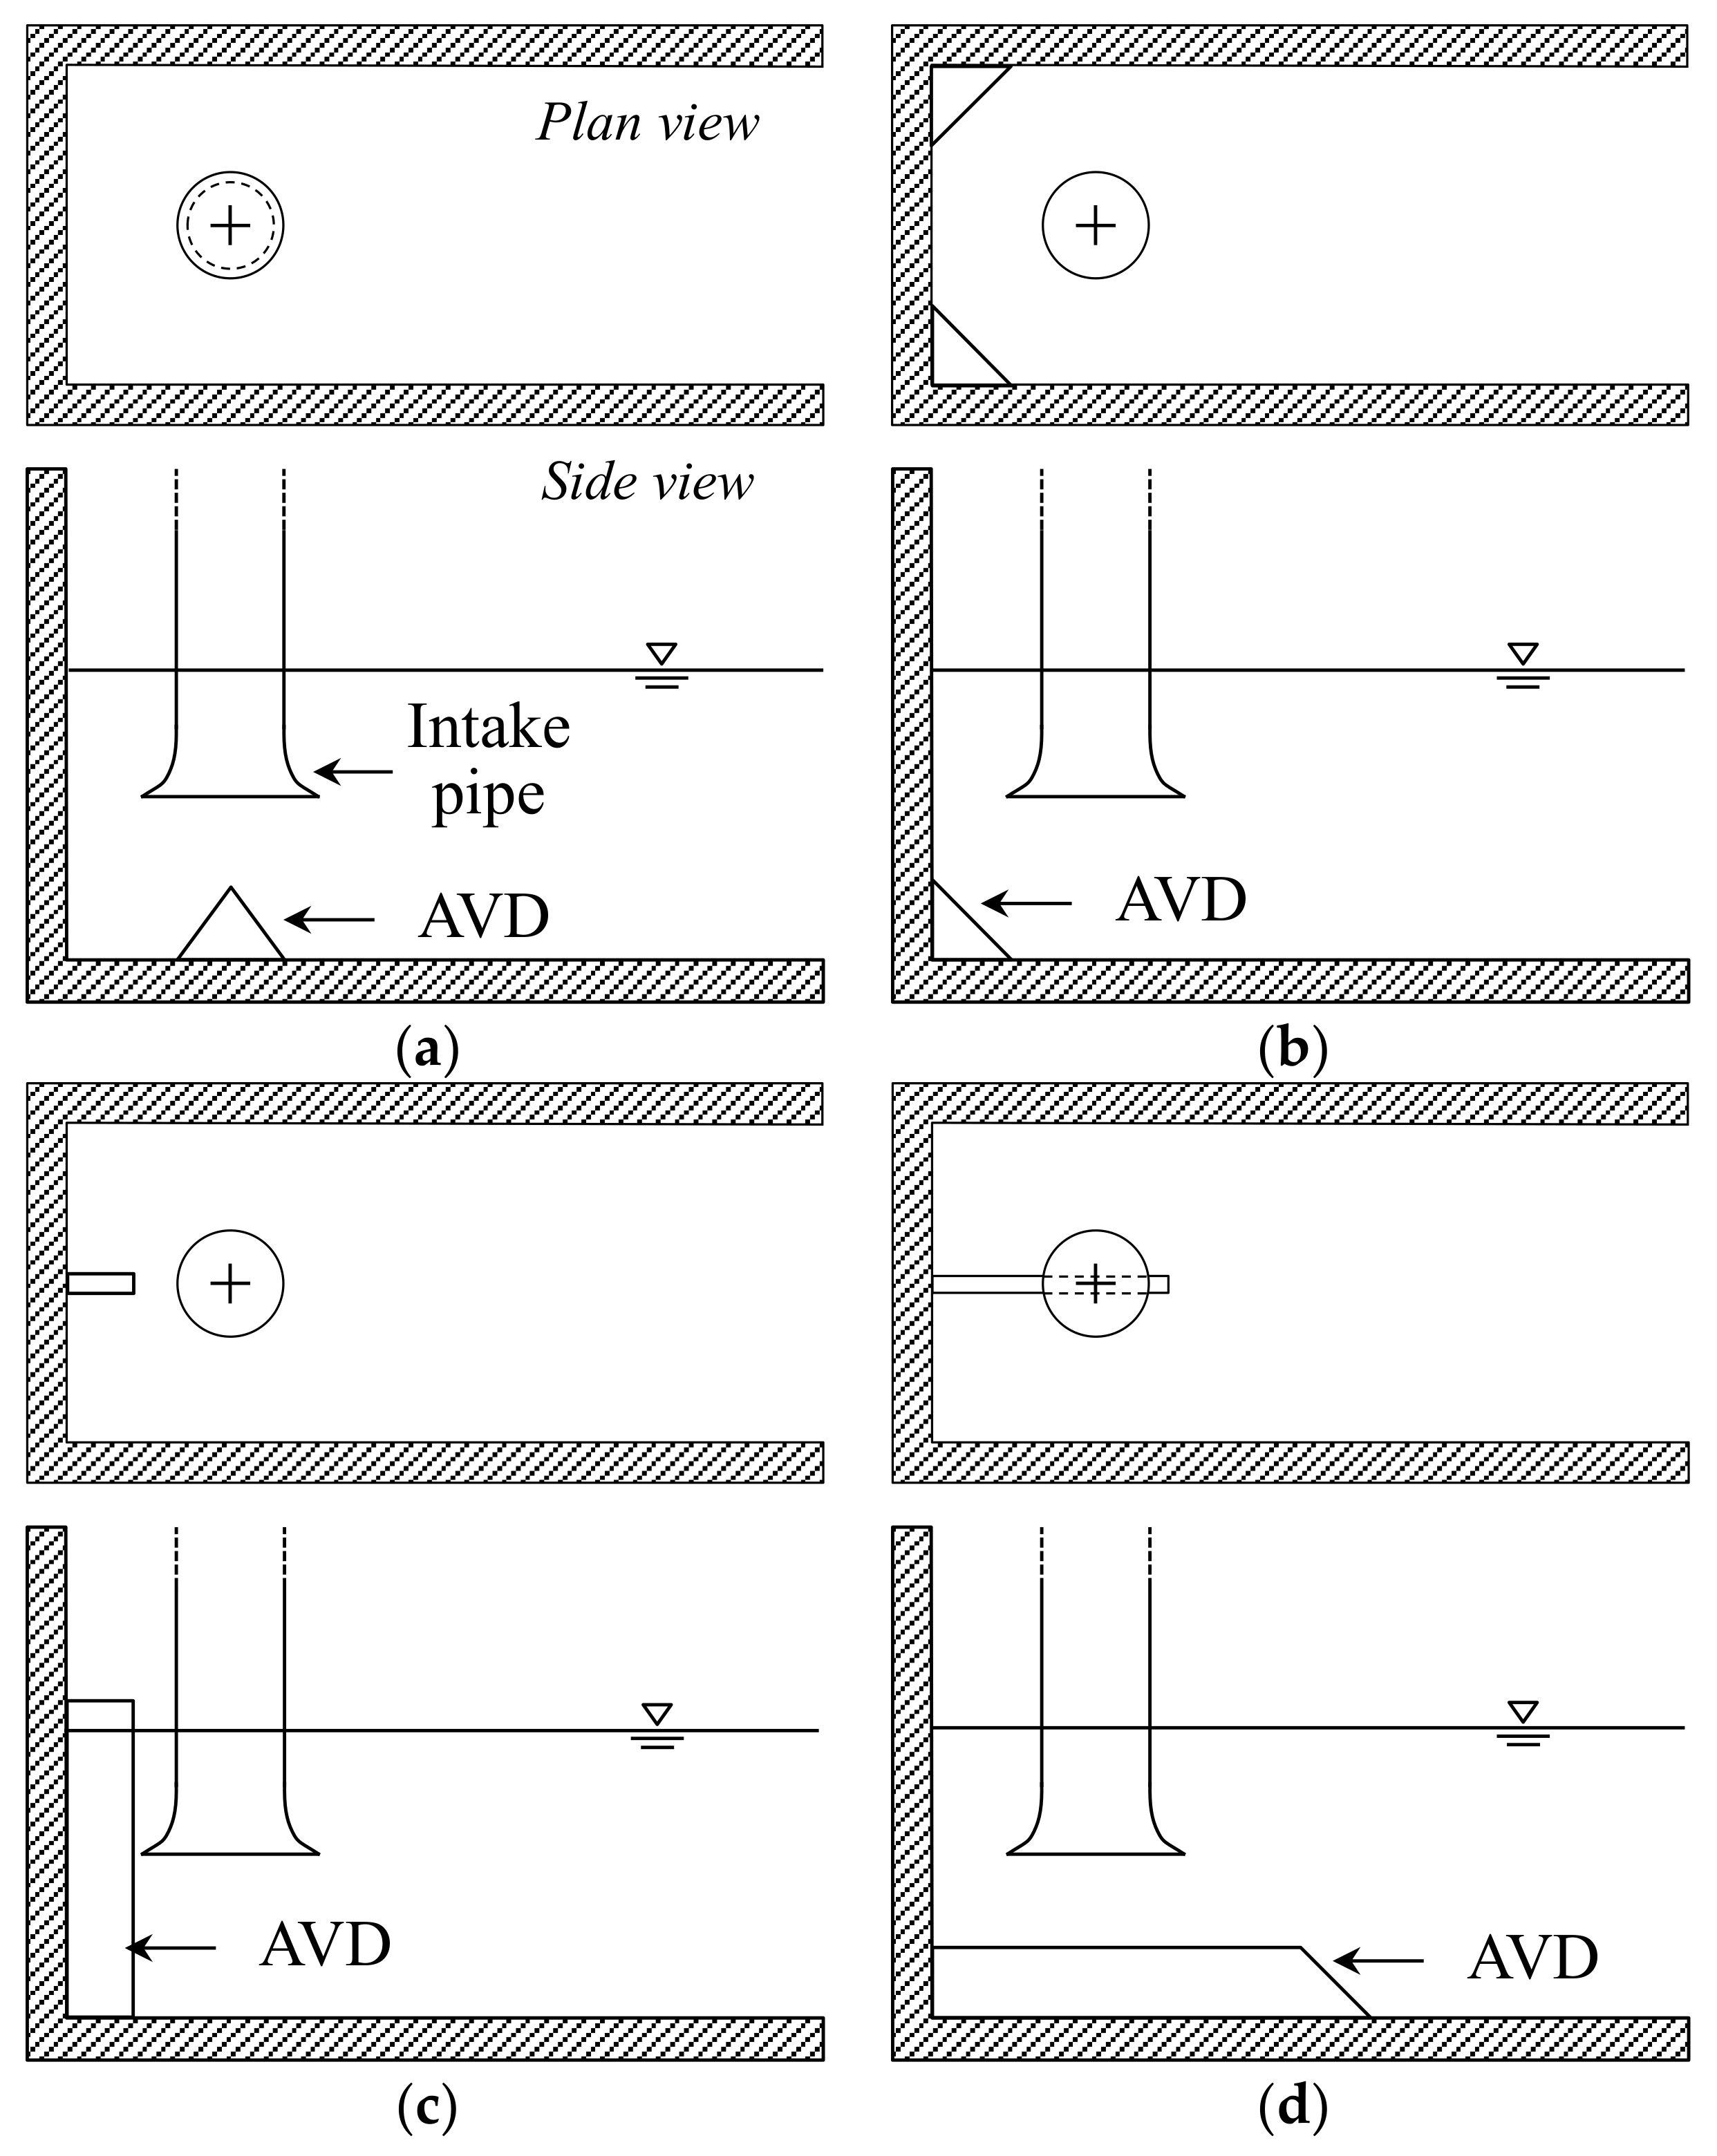
Several studies have been conducted in an attempt to reduce the undesirable performance decrease by adopting the anti-vortex device (AVD). The AVD has the role of preventing the sub-surface vortices through the mitigation of flow separation and turbulence [10]. The conventional designs of the AVD are described in Figure 1, and the AVD is attached to the floor or back wall of the sump. Recently, the performance of the AVD has been evaluated not only by experimental tests, but also by numerical simulations, according to the enhancement of computing performance. Kang et al. [11] presented experimental results, in which the cavitation in the intake pump was effectively reduced by adopting the floor splitter AVD, and recommended a trapezoidal section for the shape of the floor splitter plate. Norizan et al. [12] also reported simulation results to find an efficient design for the floor splitter plate. Kim et al. [13] tested the performance of the splitter-type and fillet-type AVDs from the numerical simulation results and suggested that the efficient height of the AVD is 20% of the intake pipe’s diameter. Although the AVD presented in Figure 1 is efficient in reducing the sub-surface vortices, these AVDs are not appropriate for reducing the free-surface vortex. Therefore, Claxton et al. [14] suggested modifications to the intake structure—such as vertical curtain walls and horizontal gratings. However, the structure design modifications that are required to apply the method in operating facilities involve a large cost. Thus, the new design of the AVD is necessary in order to mitigate the free-surface vortex.
In this study, the model experiments were conducted to investigate the performance of the newly designed AVD, which was developed to mitigate the surface vortex. The experiment channel was designed to reproduce the flow characteristics in the sump pump, in which air entrainment occurred by the surface vortex. The flow patterns in the sump were measured using the PIV technique in order to minimize the interferences by the measuring equipment. Using the experimental results, the flow patterns in the sump were compared to the results from the cases both with and without the AVD. Furthermore, the efficiency of the AVD was evaluated by the vorticity magnitude near the water surface.
2. Model Experiments on the Floating Anti-Vortex Device (F-AVD)
2.1. Experimental Set-Up
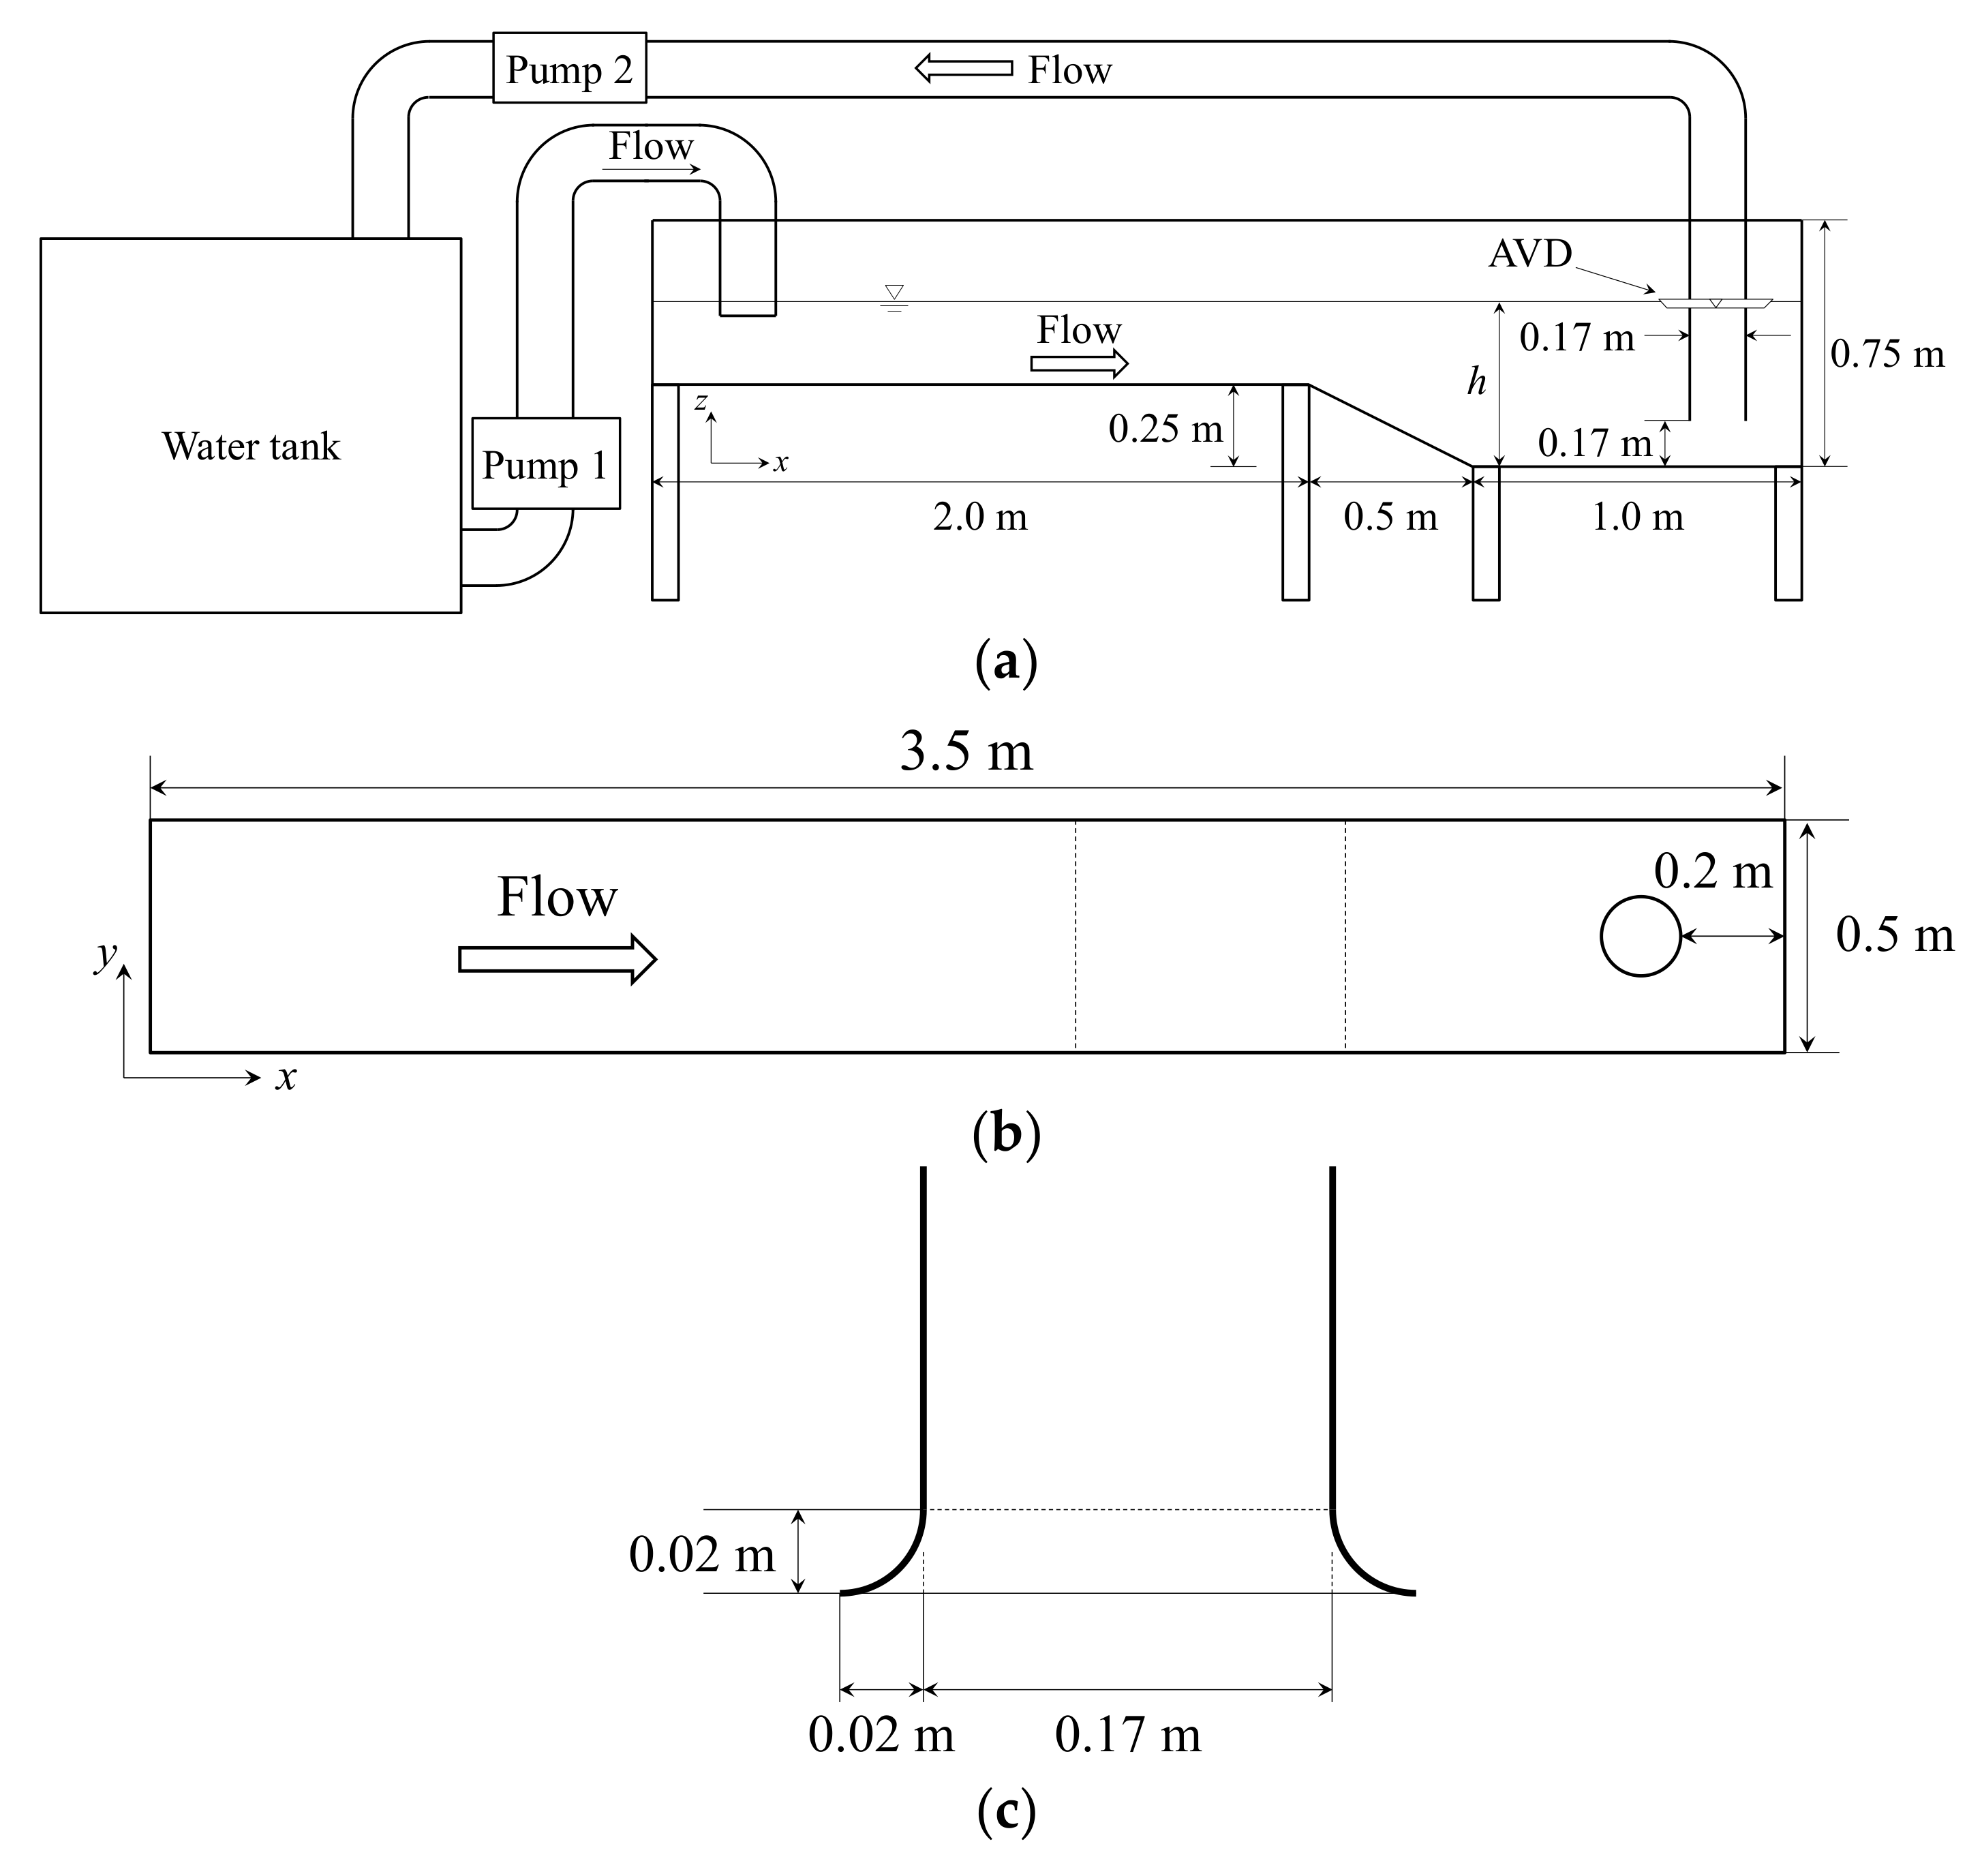
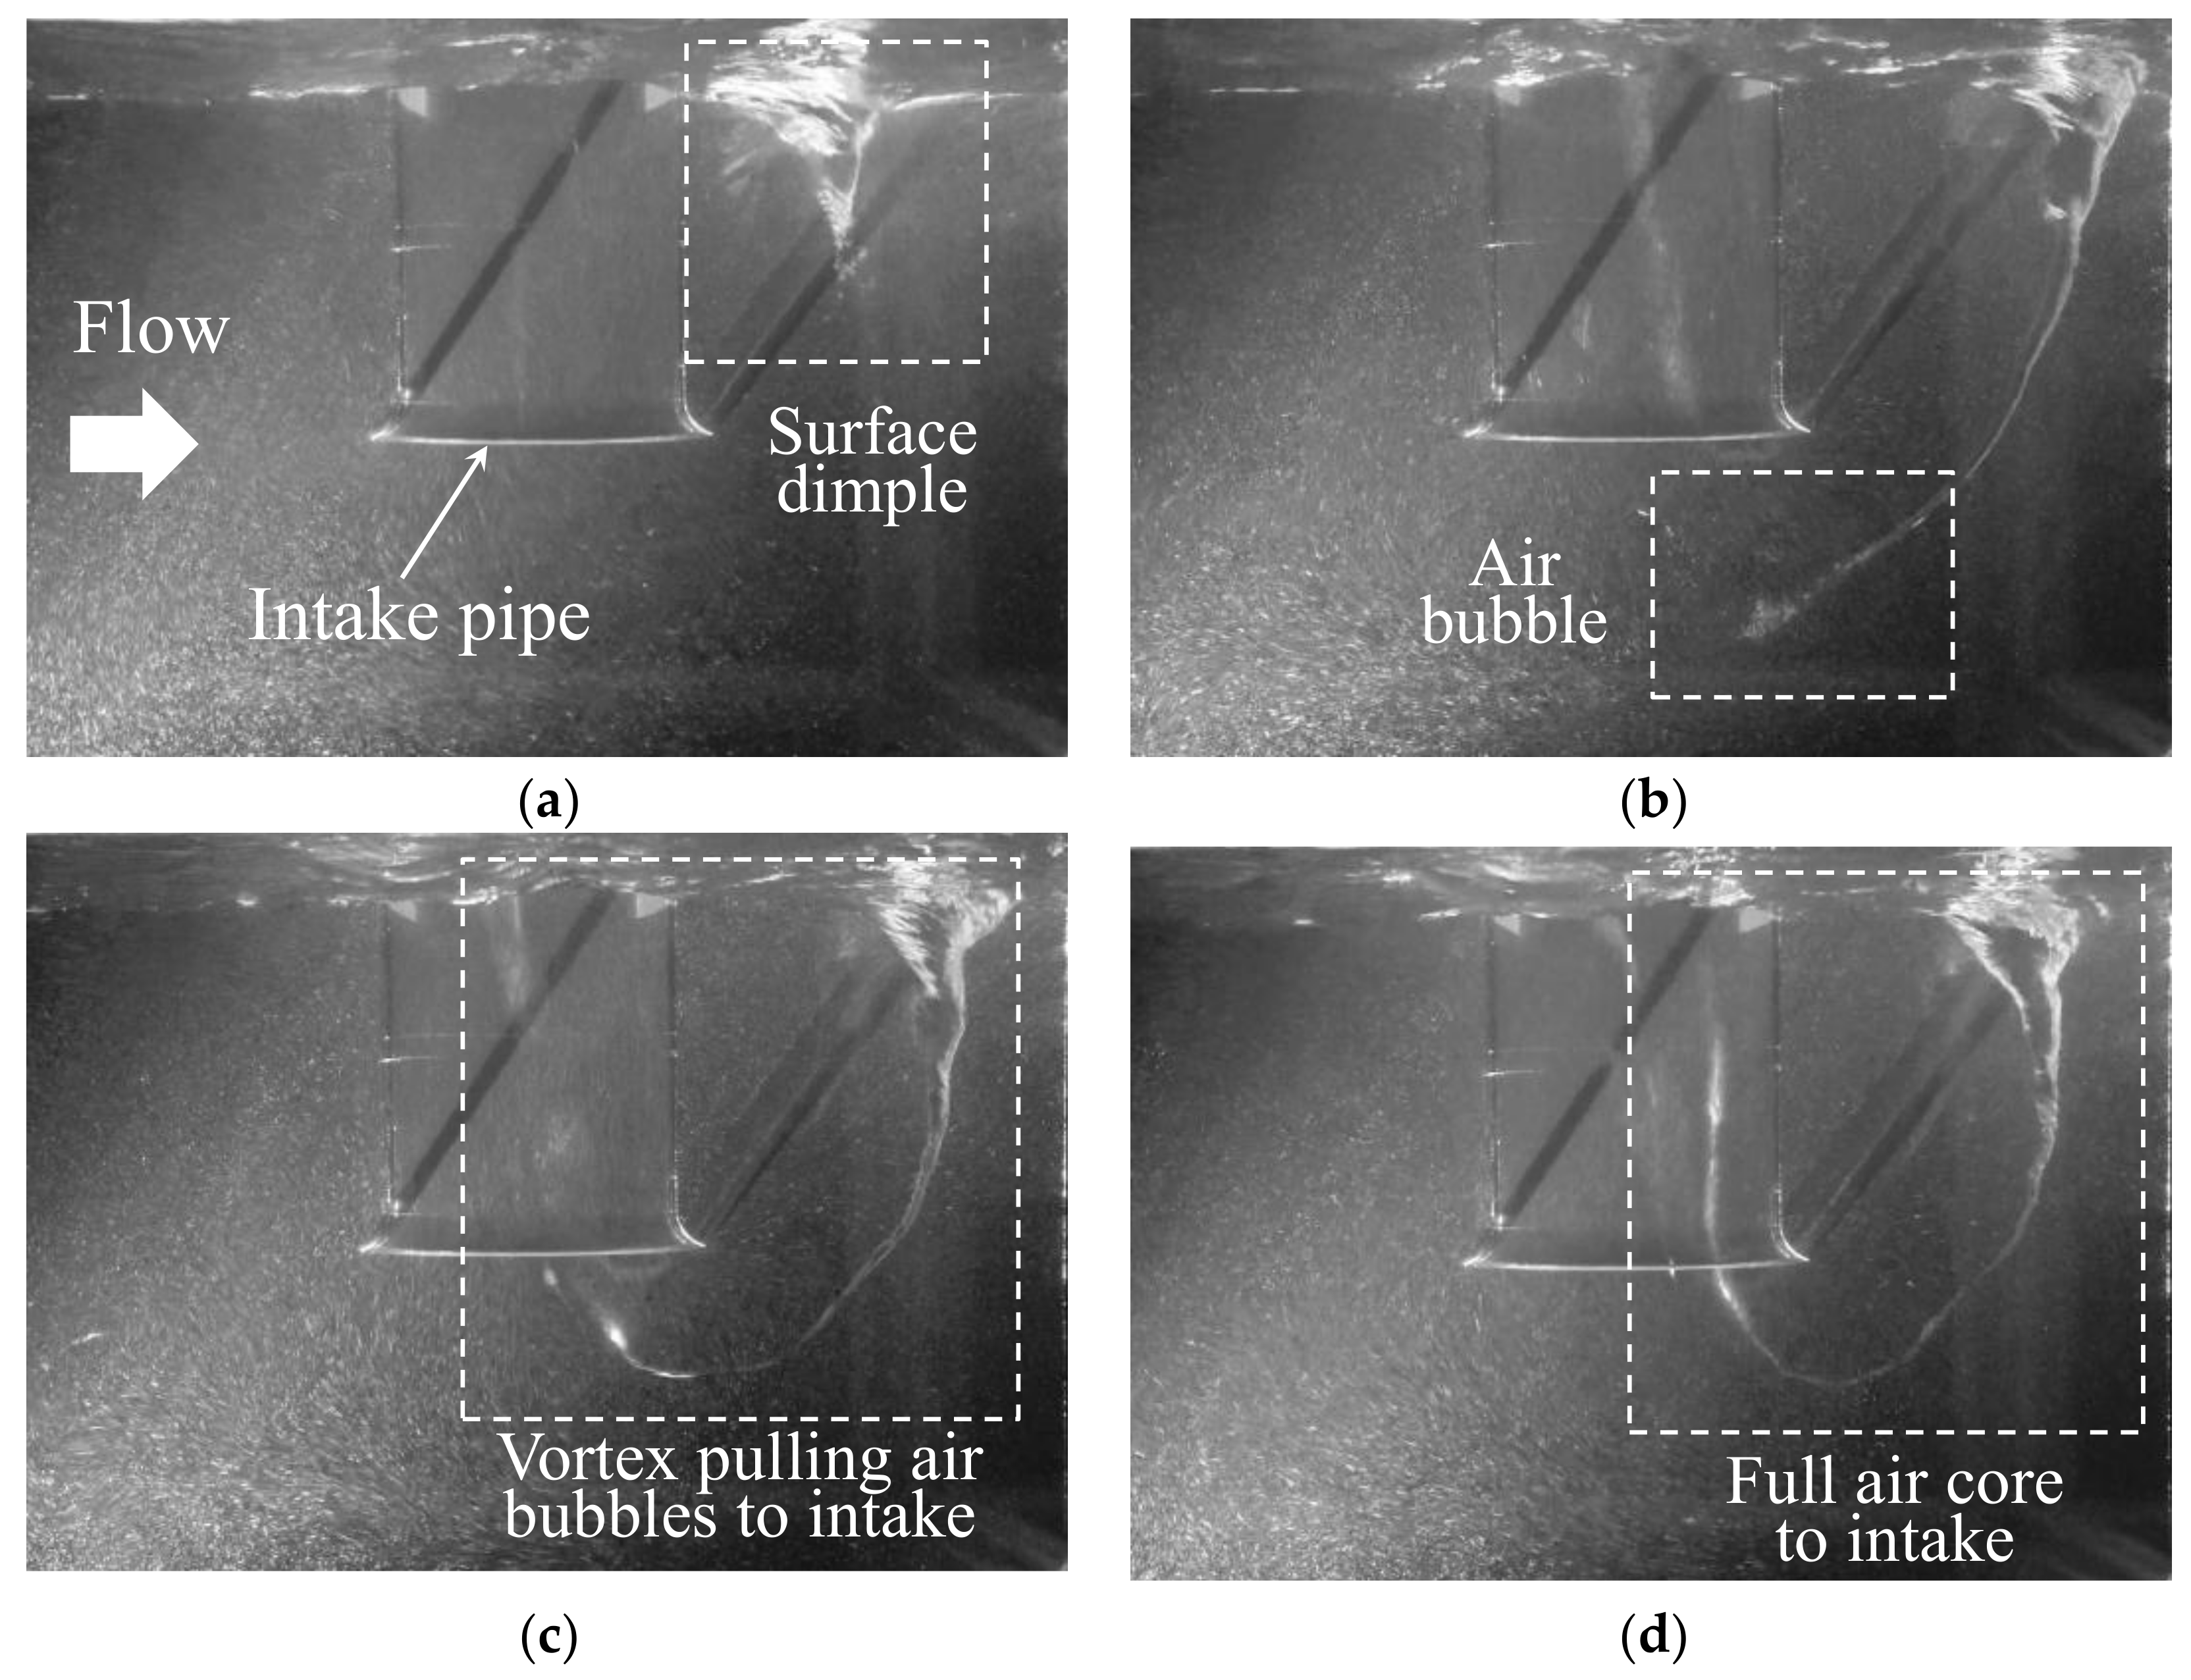
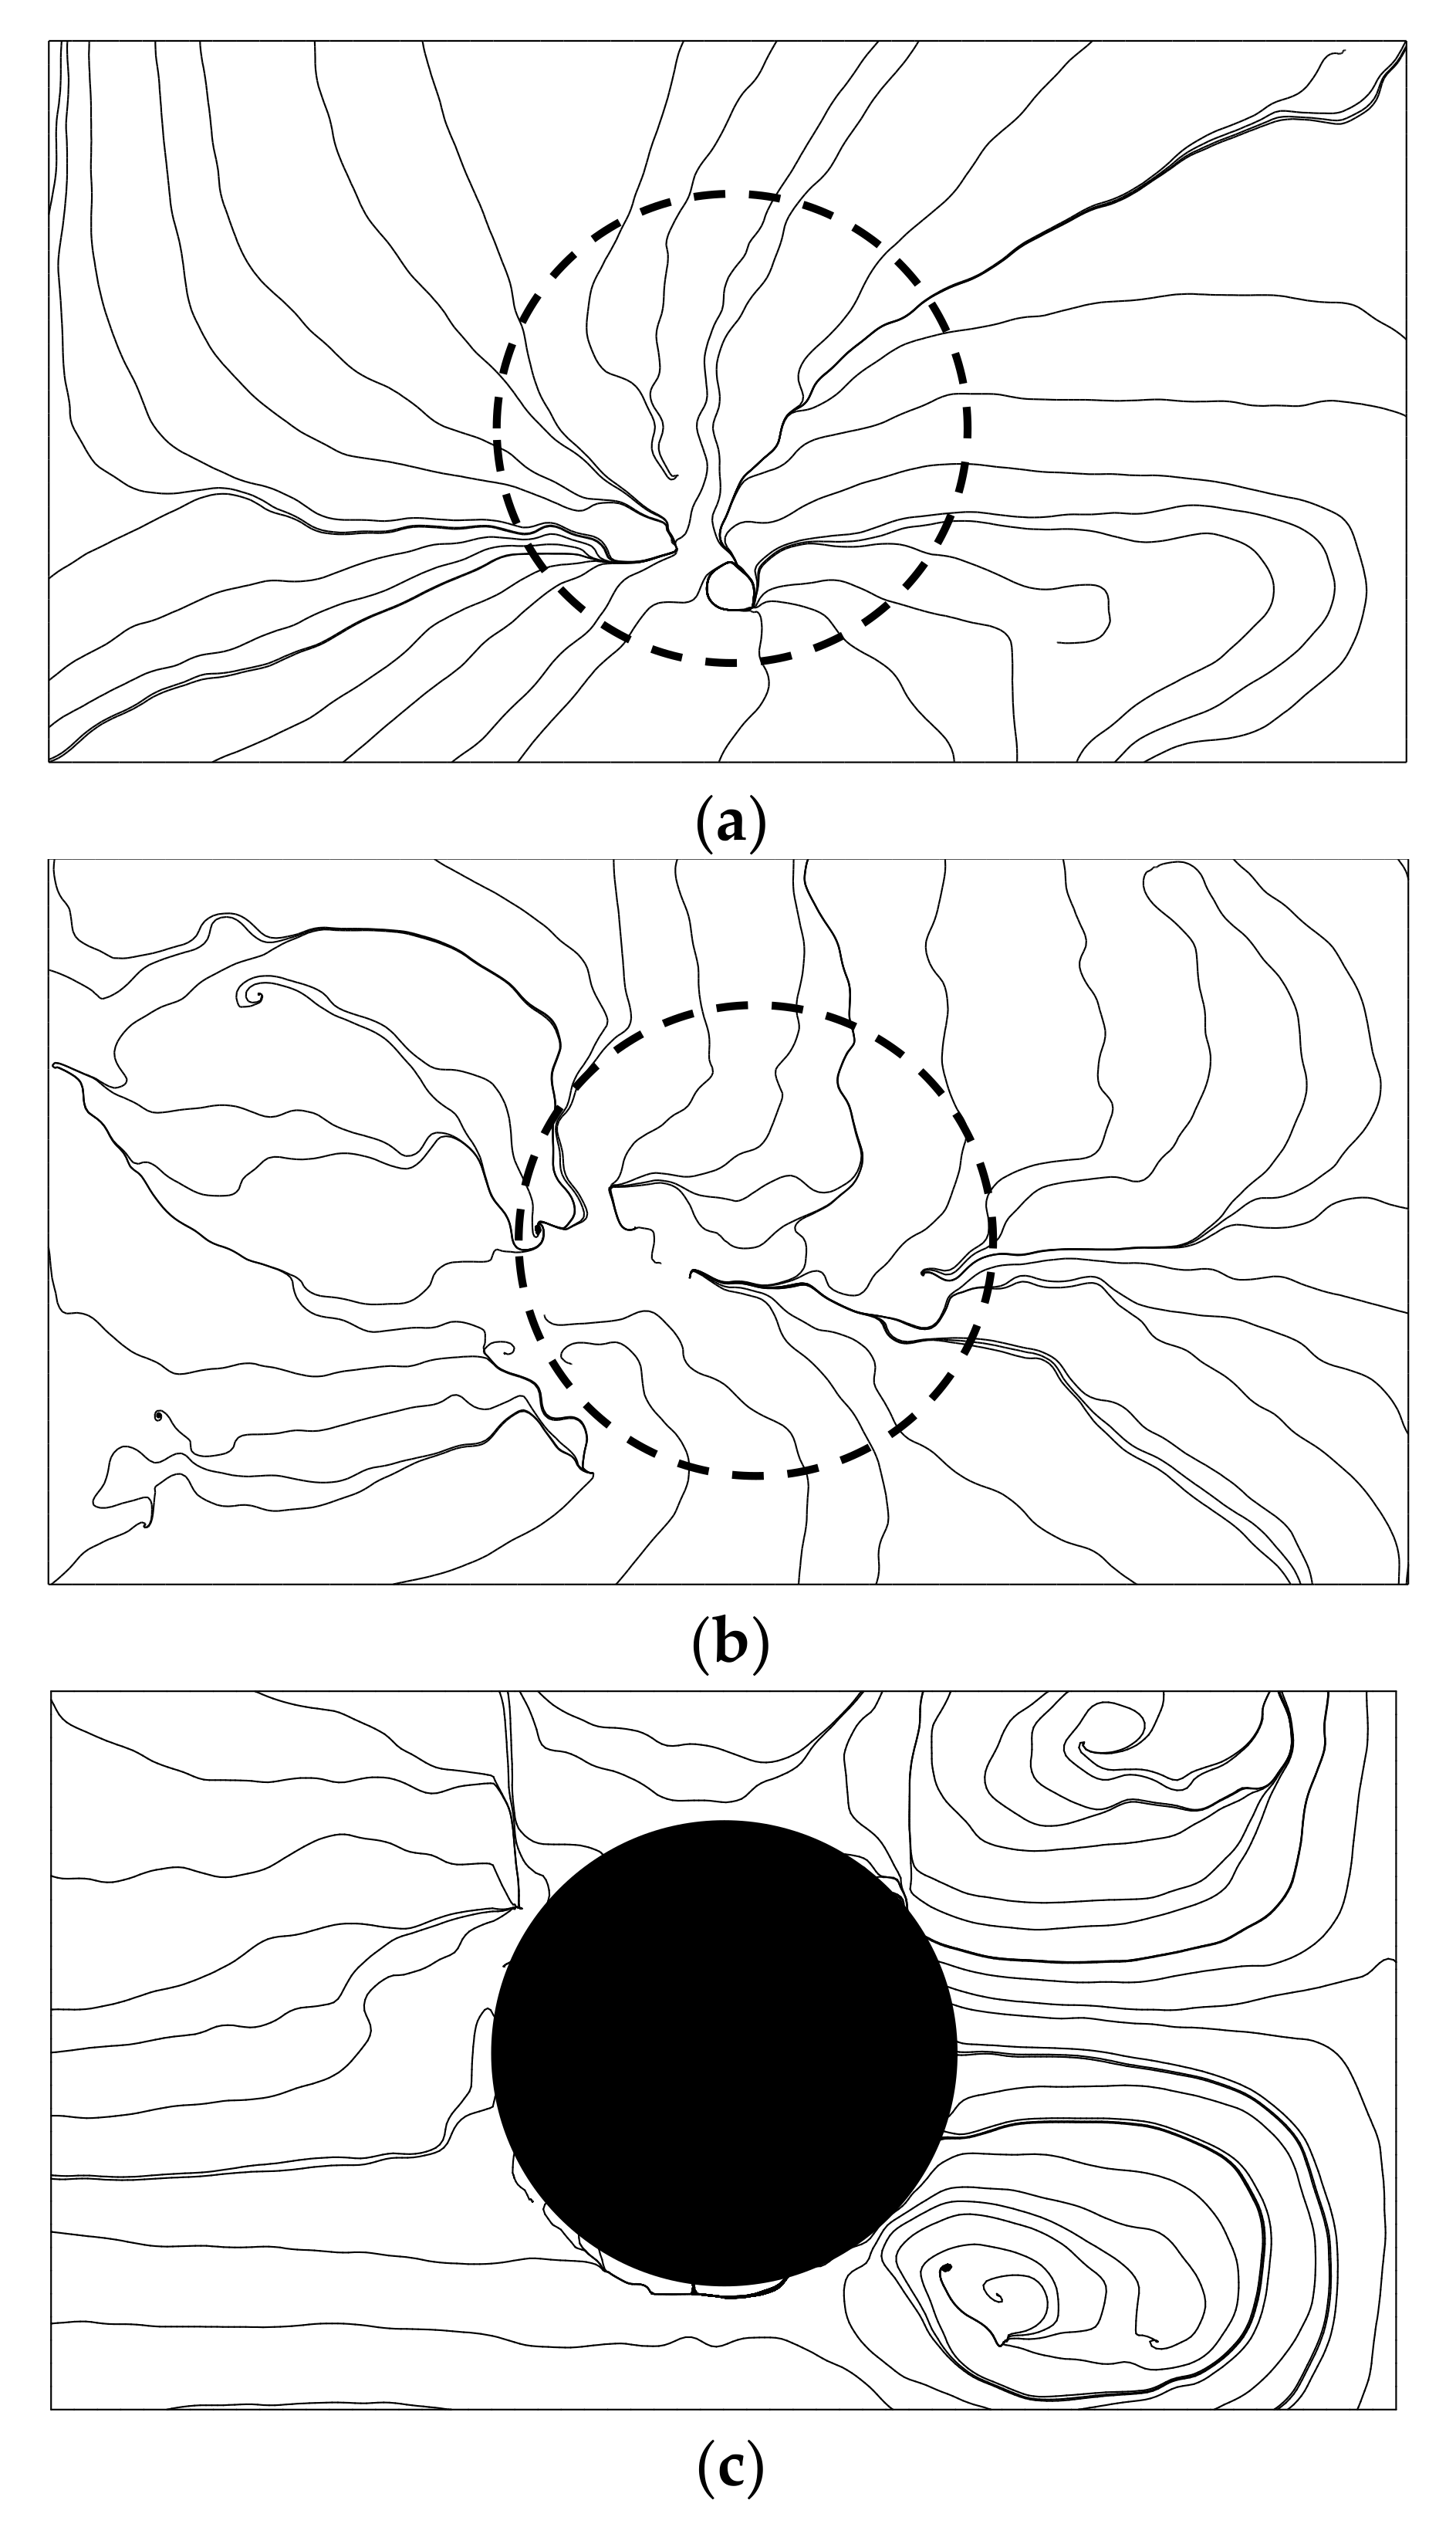
The model experiments were conducted to investigate the hydraulic properties in the pump station. For the water intake experiments, the laboratory facility was designed—as described in Figure 2—to reproduce the flow patterns in the pump sump. The design of the pump sump was determined by averaging the rainwater pumping stations that operate in Korea. The model scale was designed to be 1/10 of the real facility. The total length of the channel was 3.5 m, of which the 2.0 m approach channel and the 1.0 m length sump were connected with the 0.5 m length slope to mitigate the inflow velocity, and the width of channel was 0.5 m. The intake pipe, with a diameter of 0.17 m, was 0.2 m apart from the backwall and 0.17 m apart from the floor. The intake pipe had the bell mouth shape (as shown in Figure 2c). The water depth (h) in the sump was maintained constant during the experiment. Although the channel was built to minimize the vortices in the sump, the free-surface vortex could occur. Figure 3 indicates the development of air entrainment—which follows the free-surface vortex classifications following the study of Padmanabhan and Hecker [5]—by the surface vortex behind the pipe because of withdrawal water. As indicated in Figure 3, a surface dimple pulled air into the intake pipe, and the air core extended from the water surface to the inside of the intake pipe (Figure 3d). The air entrained into the intake pipe from the surface vortex and the air bubble damaged the components of the intake pump. Thus, the AVD should be installed to mitigate the vortex in the sump.
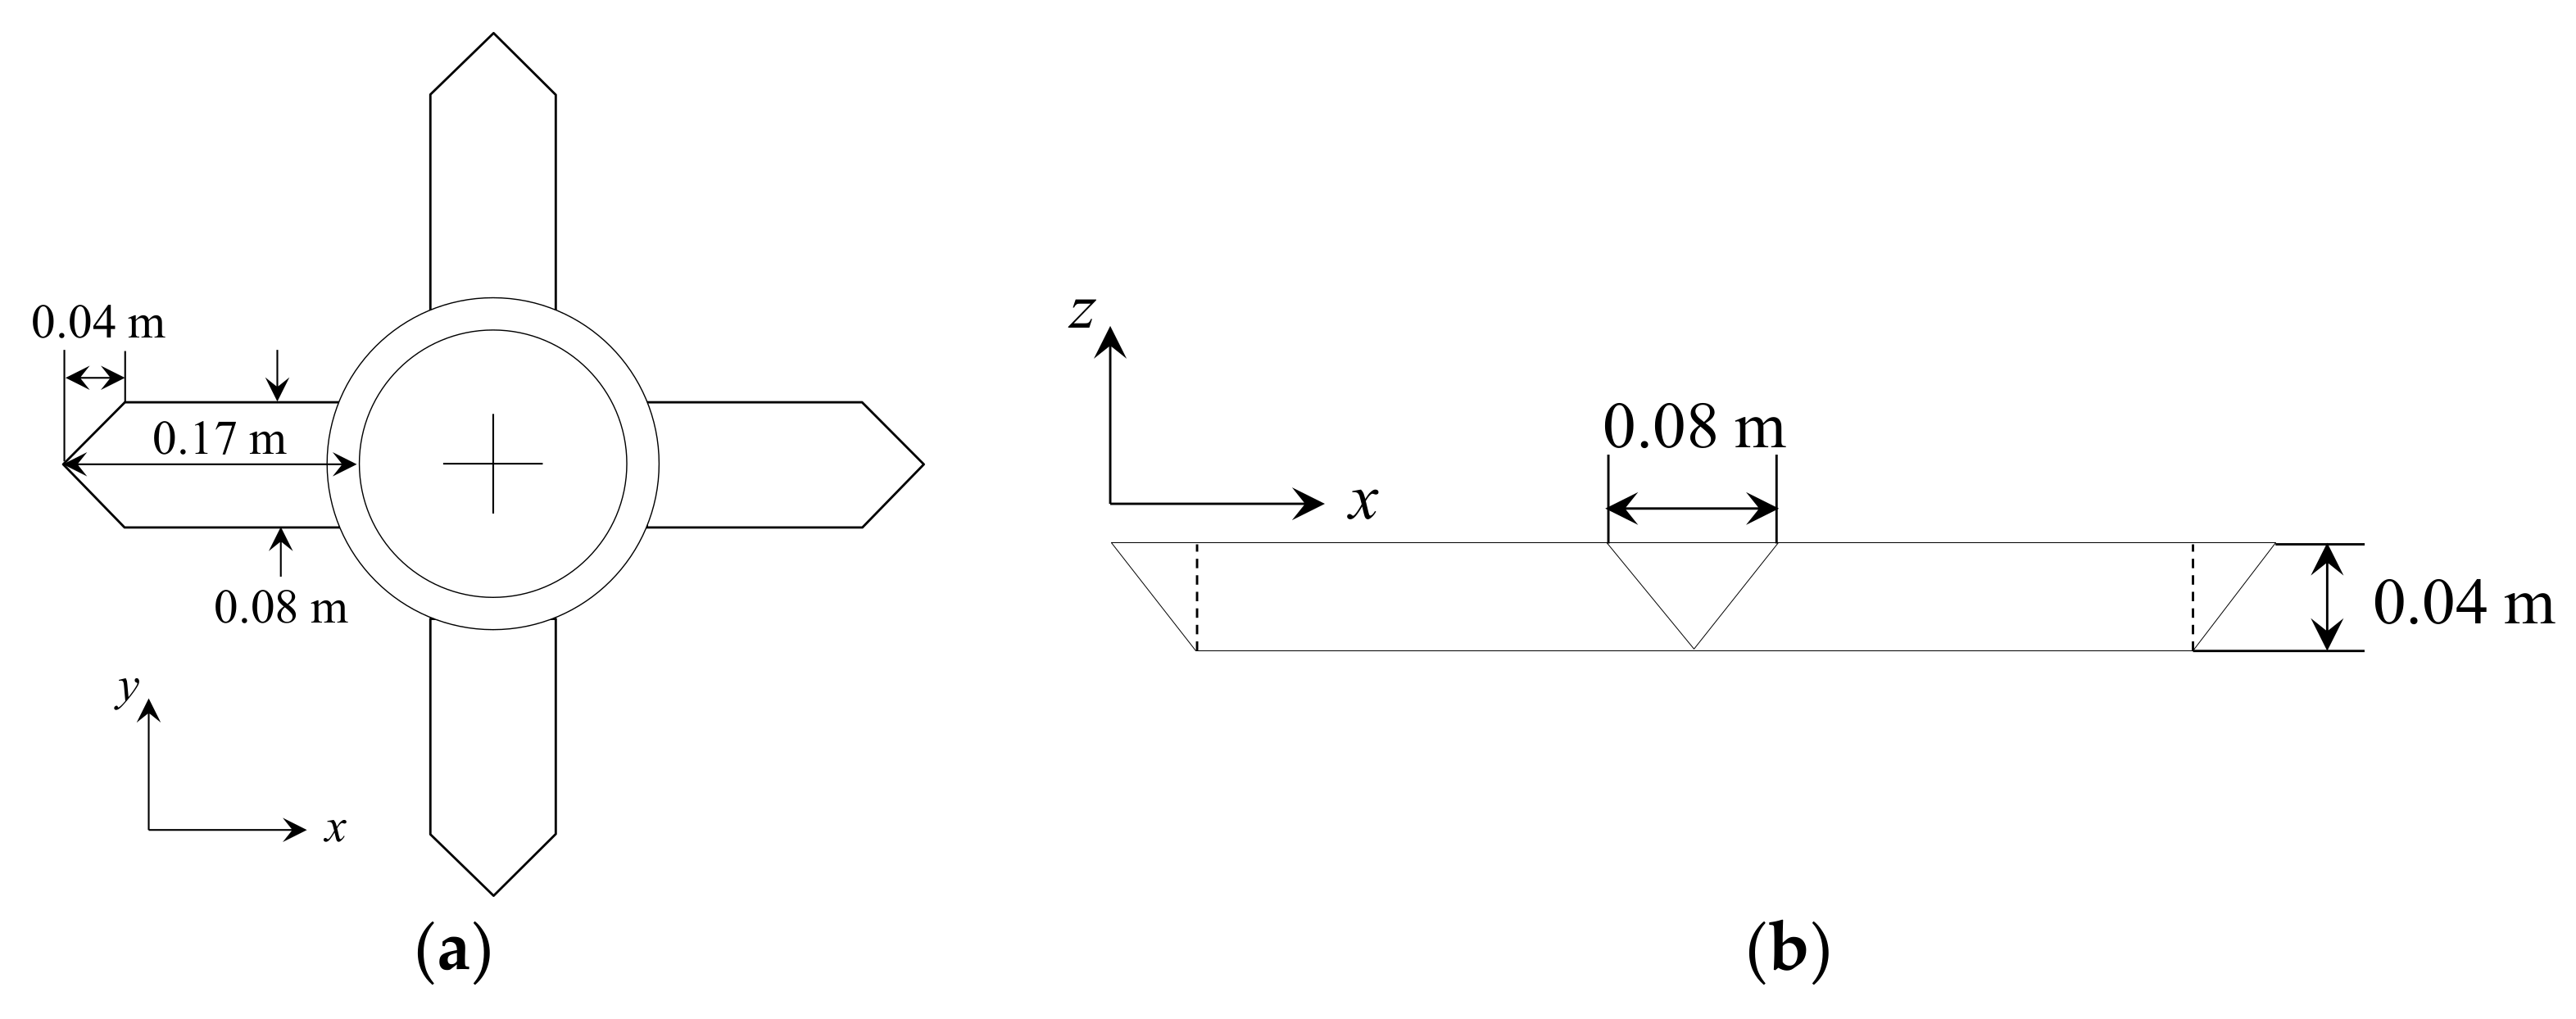
In this study, the floating AVD (F-AVD) was developed to mitigate the free-surface vortex. As indicated in Figure 1, the previously suggested AVDs were mainly installed on the bottom or side wall of the sump to decrease the submerged vortex and swirls. However, the previous models may worsen the flow characteristics in the sump by reducing the flow area in the sump (Kim et al. [13]). The F-AVD that is presented in this study aims to decrease the velocity near the water surface and prevent the creation of the surface vortex without changing the geometry of the sump. Thus, the F-AVD is designed to be placed on the water surface, regardless of the water level change, and to reserve a sufficient flow area in the sump. The F-AVD consisted of four legs and a floating body surrounding the intake pipe (as shown in Figure 4). The length of each leg was designed to be the same length as the intake pipe diameter, and the width of each leg was half of the diameter. In this study, the flow characteristics—with and without the adoption of the F-AVD—were compared to investigate the performance of the F-AVD. The performance of the F-AVD was evaluated from the measurements of the velocity and the vorticity behind the intake pipe, which are related to the air entrainment problems.
2.2. Flow Measurement
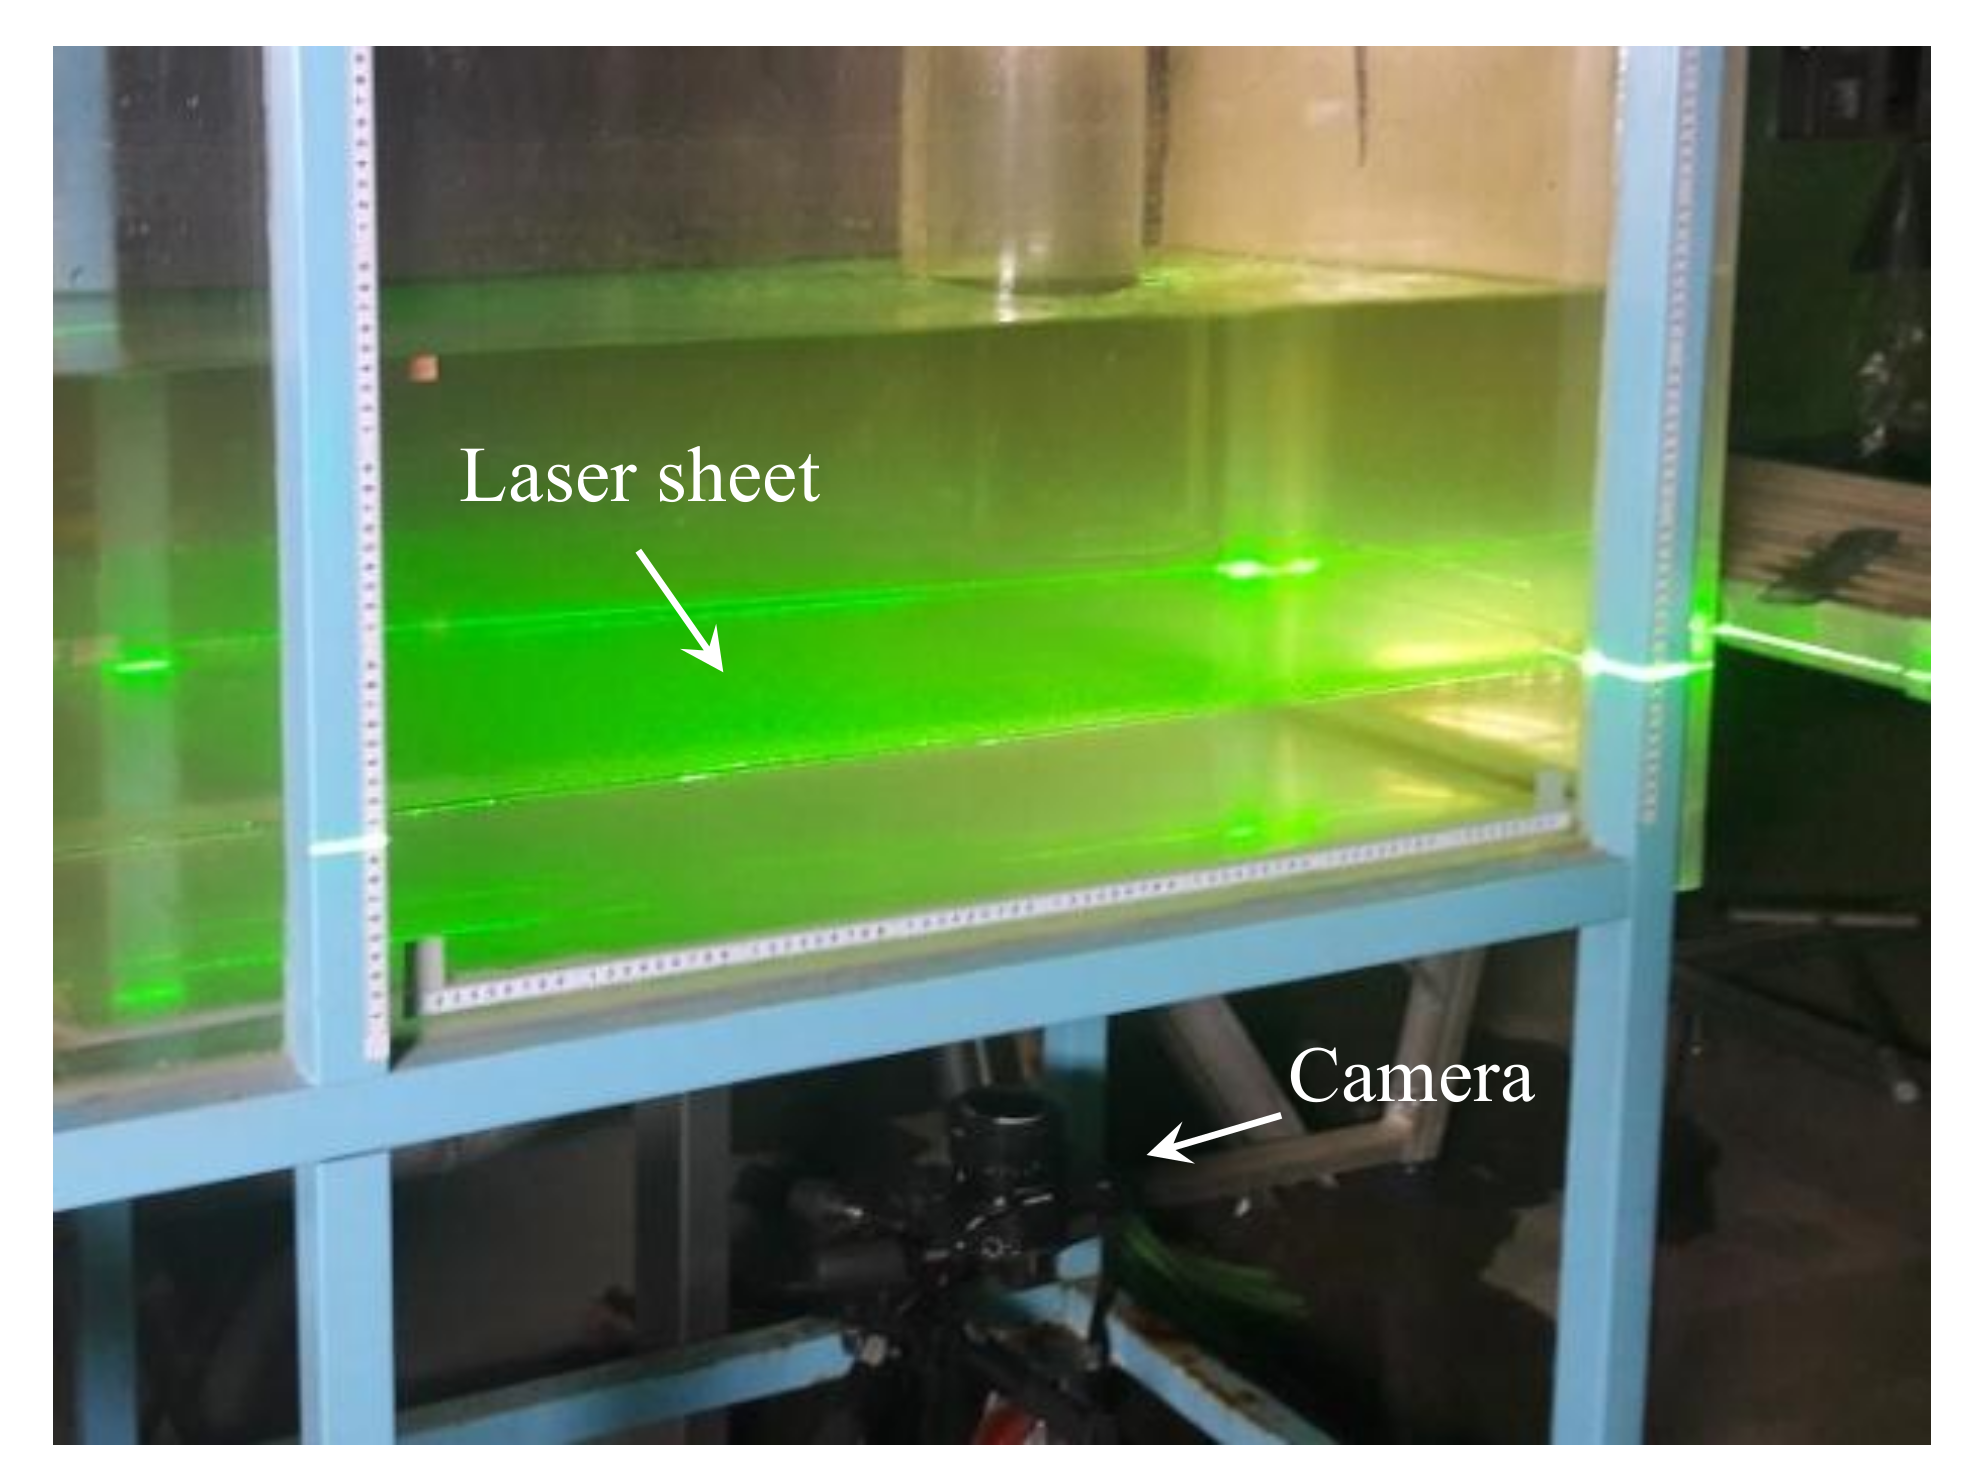
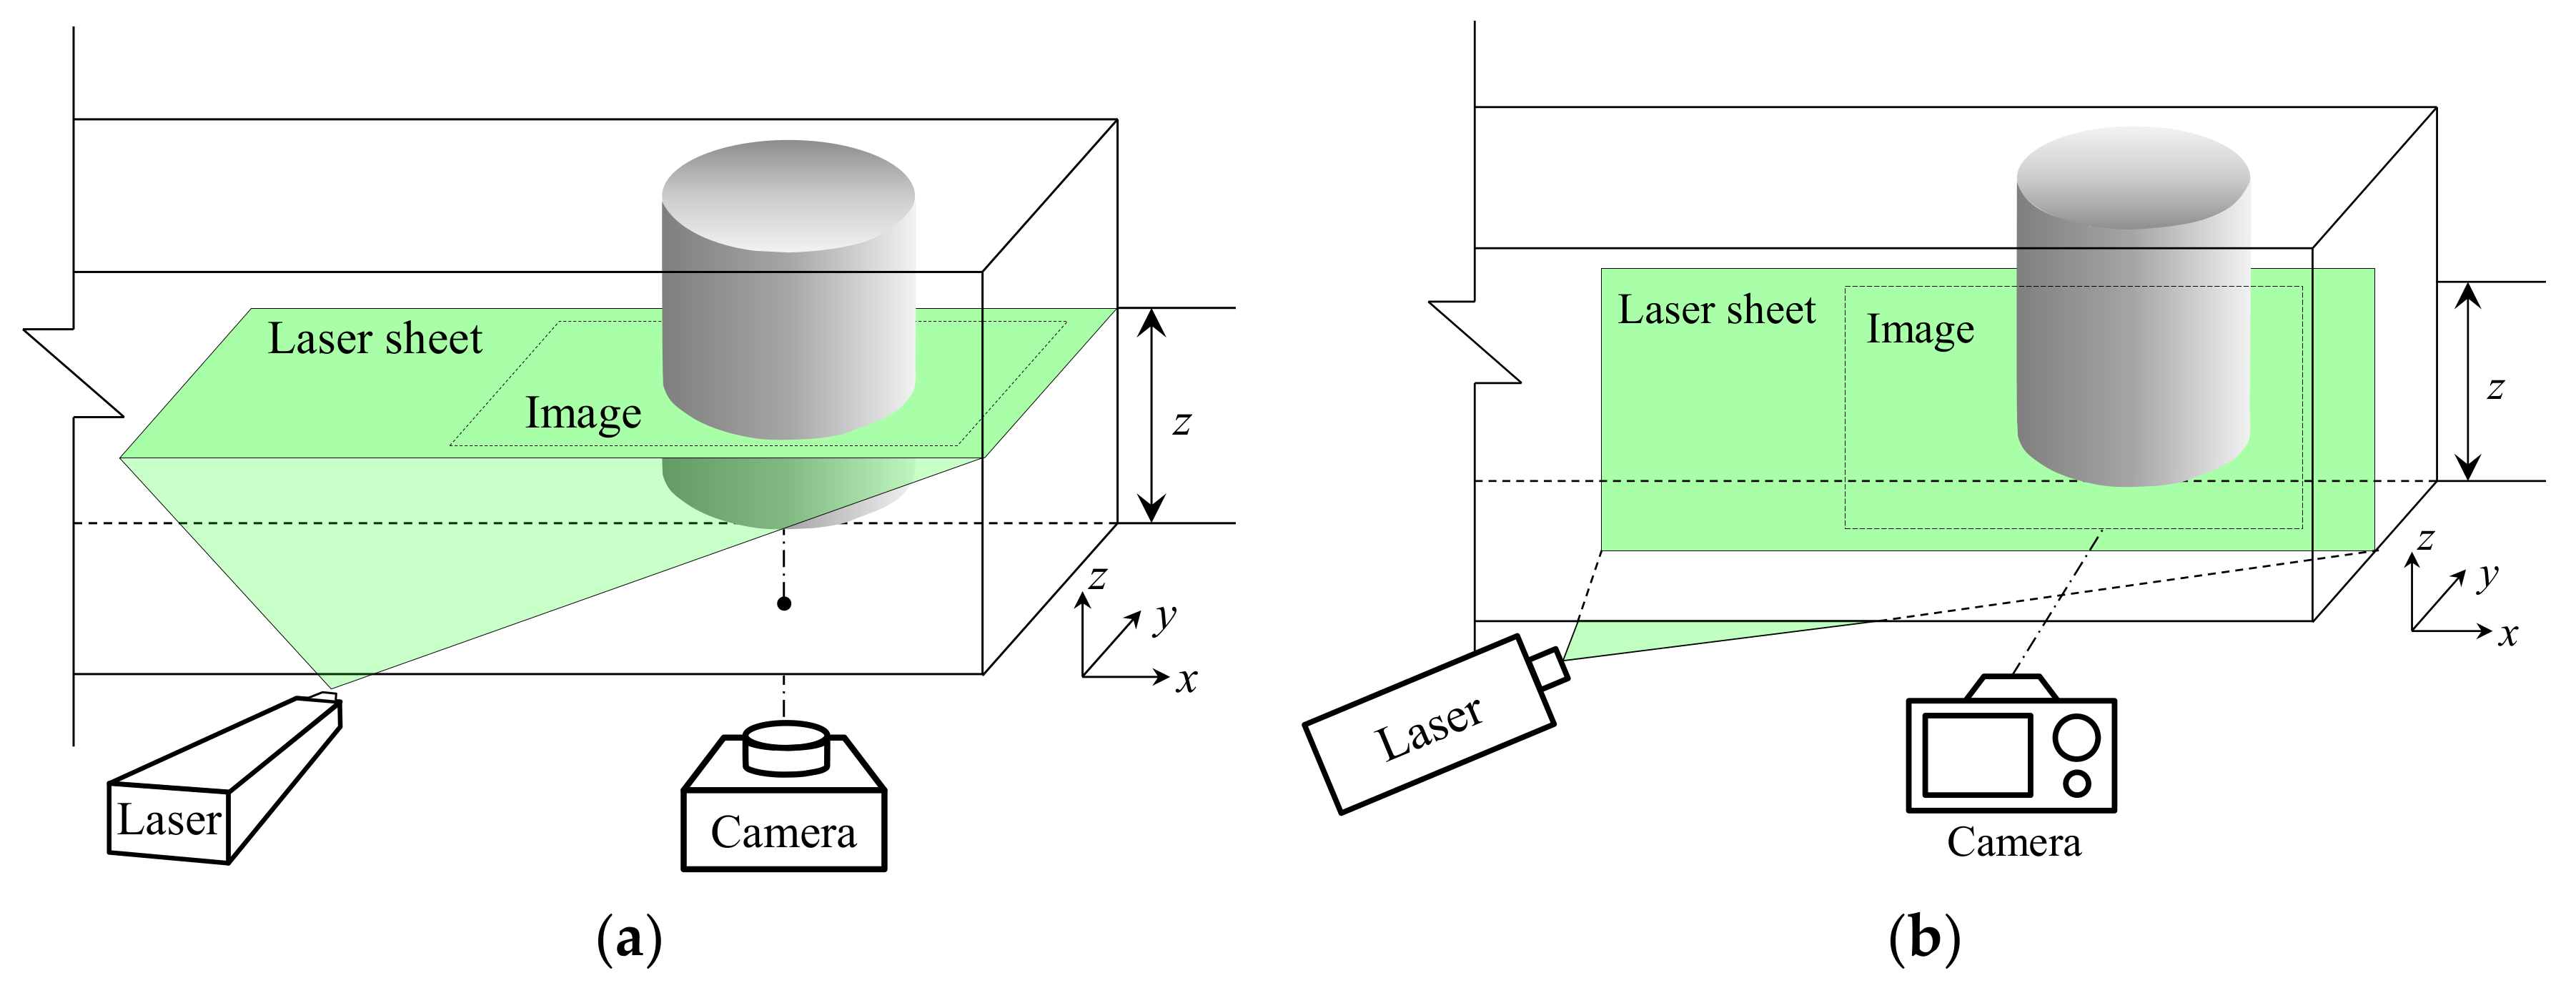
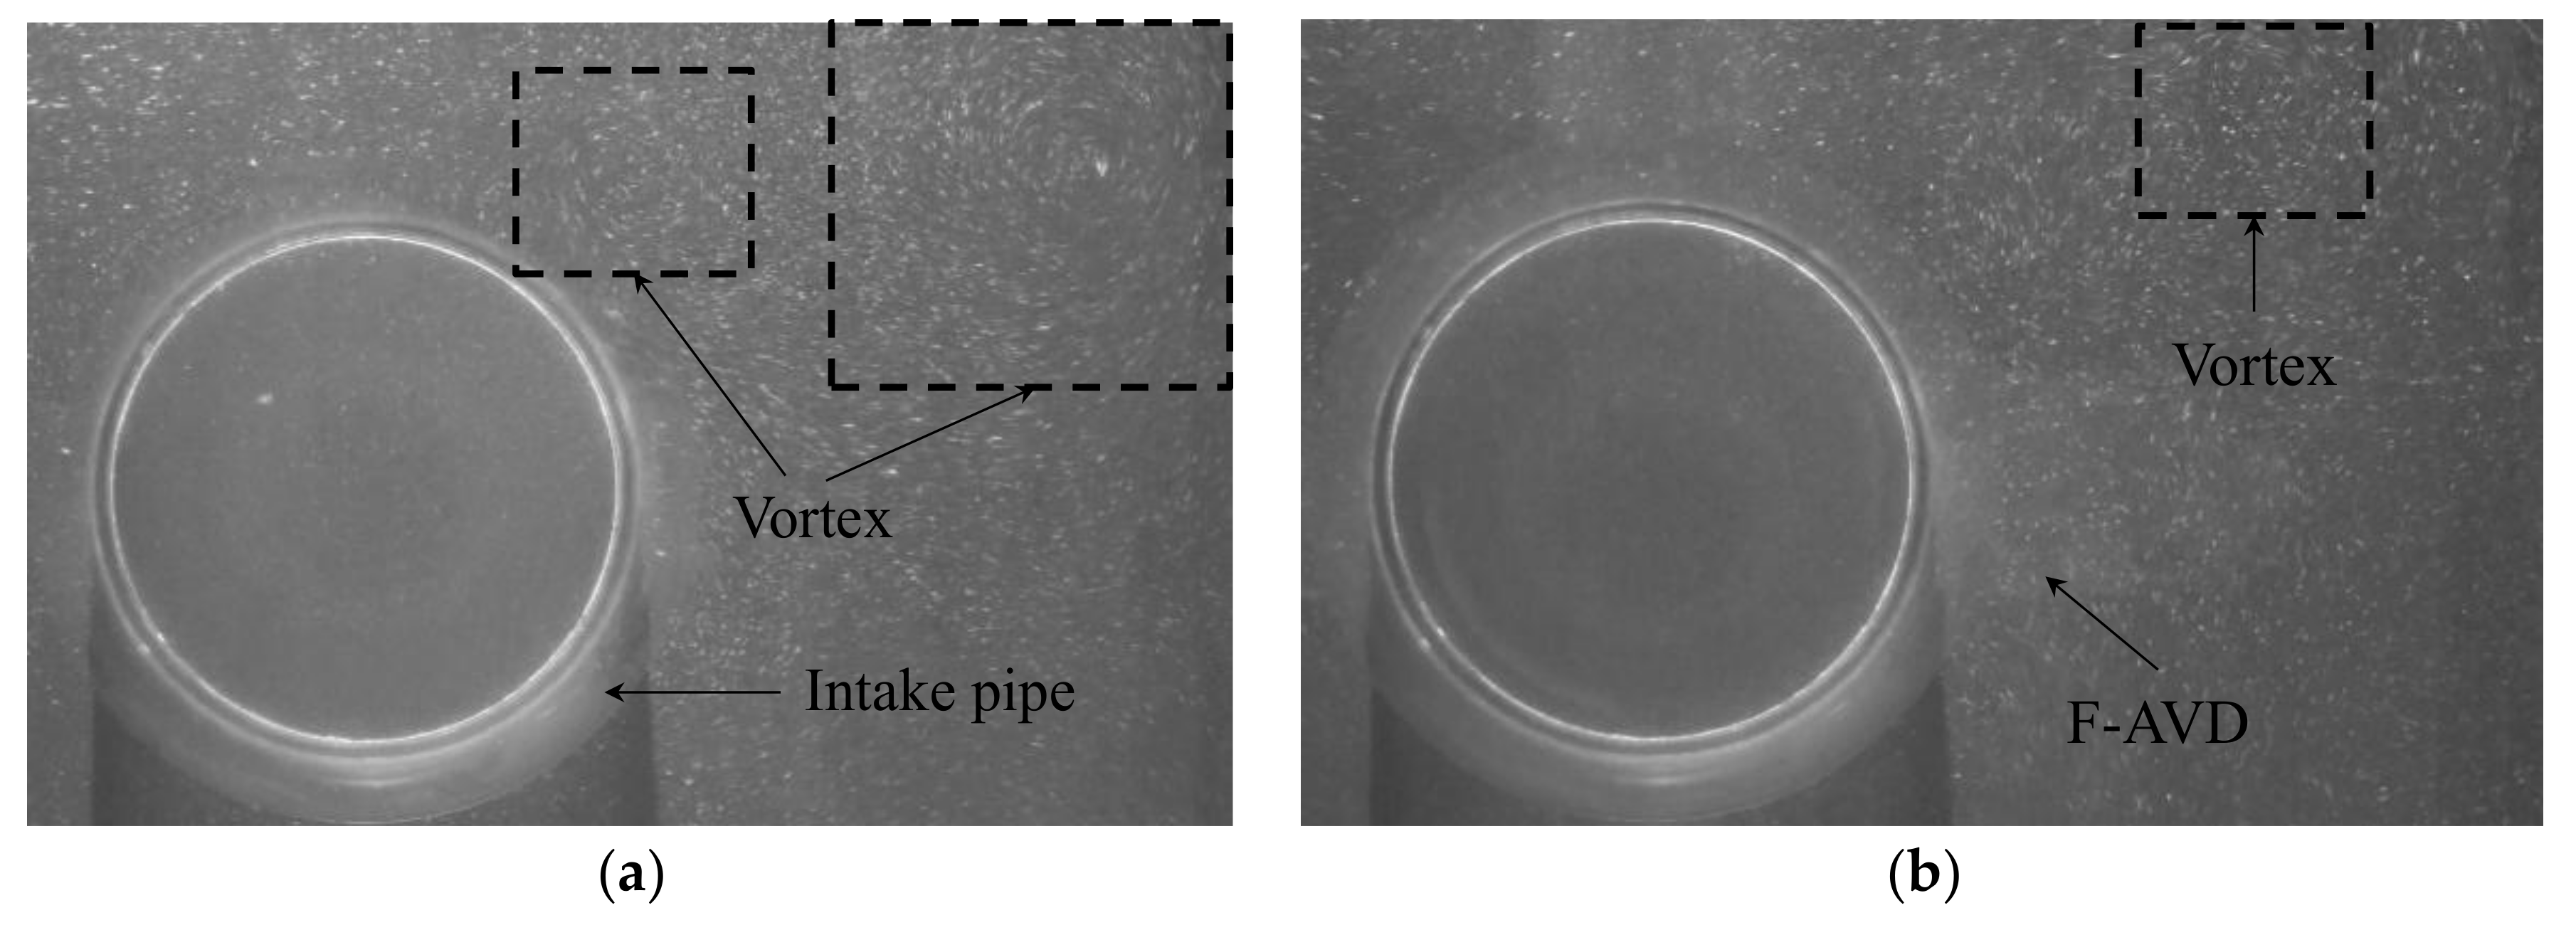
The flow in the sump was measured using a PIV system for minimizing disturbances caused by using an Acoustic Doppler Velocimetry (ADV). For the PIV system, the continuous laser—which generates a 532 nm green laser—was used to illuminate the particles in water, and the images were captured using a digital camera. The flow patterns were visualized by seeding with 40 μm silver-coated hollow glass spheres. Figure 5 presents the experimental set-up for the aforementioned PIV measurements, in which the laser sheet was formed under the intake pipe. The flow measurements were conducted on x–z and x–y planes for the investigation of the flow characteristics behind and under the pipe (as shown in Figure 6). The velocity fields on x–y plane were measured at z/h = 0.3, 0.7, and 0.9, and the flow on x–z plane was captured at the center of the sump (y/W = 0.5). Figure 7 presents instantaneous images of the flow that was visualized by the PIV system on x–y plane at z/h = 0.7. Large and small vortices at the rear of the intake pipe can be observed in the images. In Figure 7b, however, the vortex behind the pipe is not clearly observed because of the employment of the F-AVD. Table 1 indicates the experimental conditions, in which the flow rate (Q) was adjusted from 0.018 m3/s to 0.026 m3/s, and the magnitude of inflow velocity (U) at the approach channel was within the range of 0.40–0.60 m/s. The water depth (h) in the sump was set to 0.34 m, because the successful generation of the surface vortex in every flow condition was required in order to evaluate the performance of the F-AVD. The Froude number (Fr) in Table 1 was defined as , where ha, the water depth in the approach channel, was equal to 0.09 m. In these experimental conditions, the flow characteristics—with and without the adoption of the F-AVD—were compared for the mitigation of the vorticity in the sump.
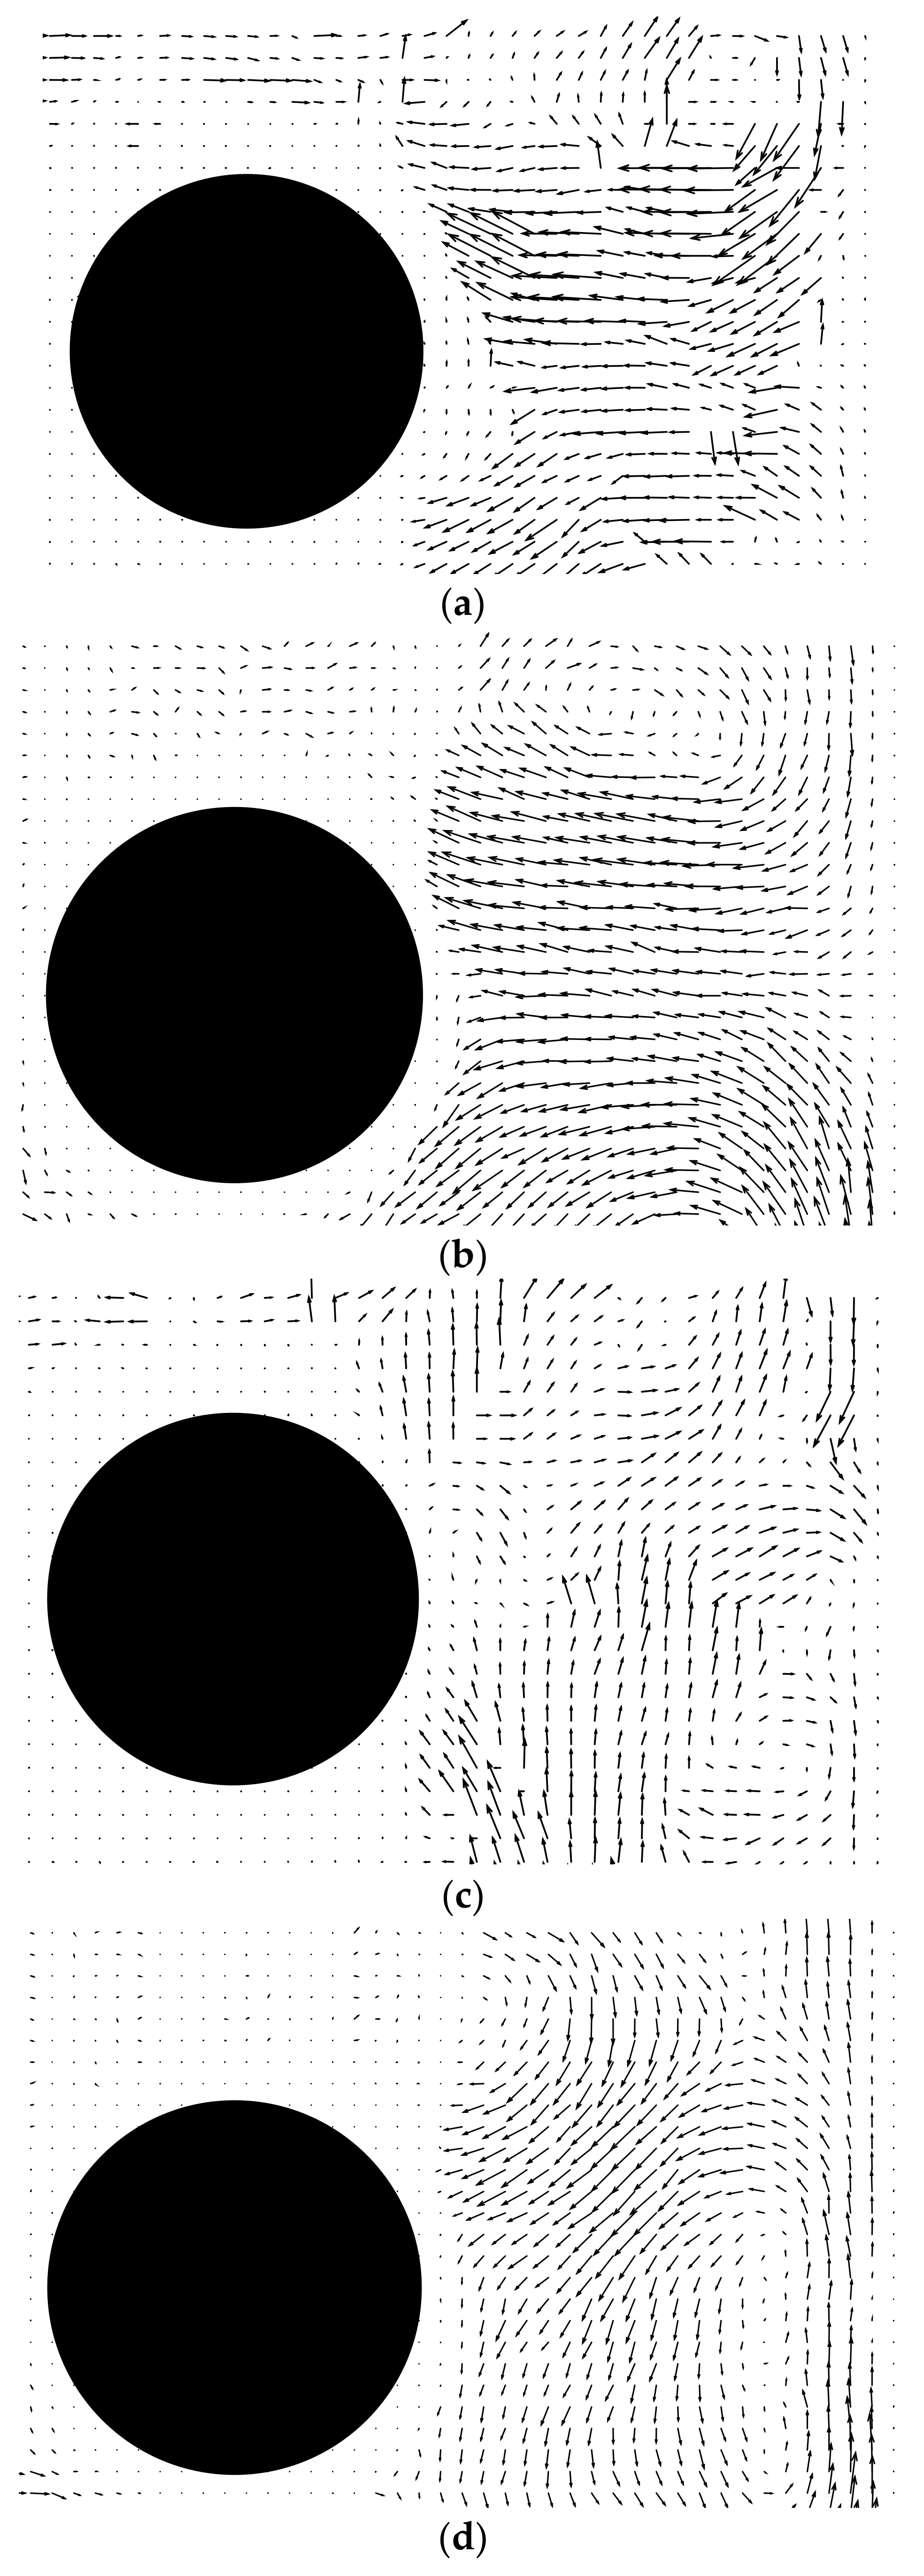
The velocity distributions were calculated using the particle images that are displayed in Figure 7. In this study, the OpenPIV, which is open-source software, was used for the calculation of the velocity distribution [15]. The OpenPIV software calculates the velocity field from the average displacement of the interrogation window between a pair of images. The displacement of the window is determined using the cross-correlation function [16]. Thus, the velocity field is calculated using Equation (1).
where is the velocity vector; is the displacement of the interrogation window in pixel; ∆t is a time step between a pair of images; α is the scale factor in m/pixel. Using the OpenPIV software, Figure 8 indicates the velocity distributions of the particle images that are displayed in Figure 7. The calculation results were adequately reproduced for the vortex around the intake pipe (as shown in Figure 7). The instantaneous vector fields, displayed in Figure 8a,c, are inappropriate for analyzing the flow characteristics because of the unstable flow patterns in the sump, which are caused by the wandering of vortices behind the intake pipe. Thus, in this study, the time-averaged velocity fields were used (as shown in Figure 8b,d), of which Figure 8b clearly indicates the clock-wise and counter clock-wise vortex structures in the rear of the intake pipe.
3. Results and Discussion
3.1. Velocity Distributions
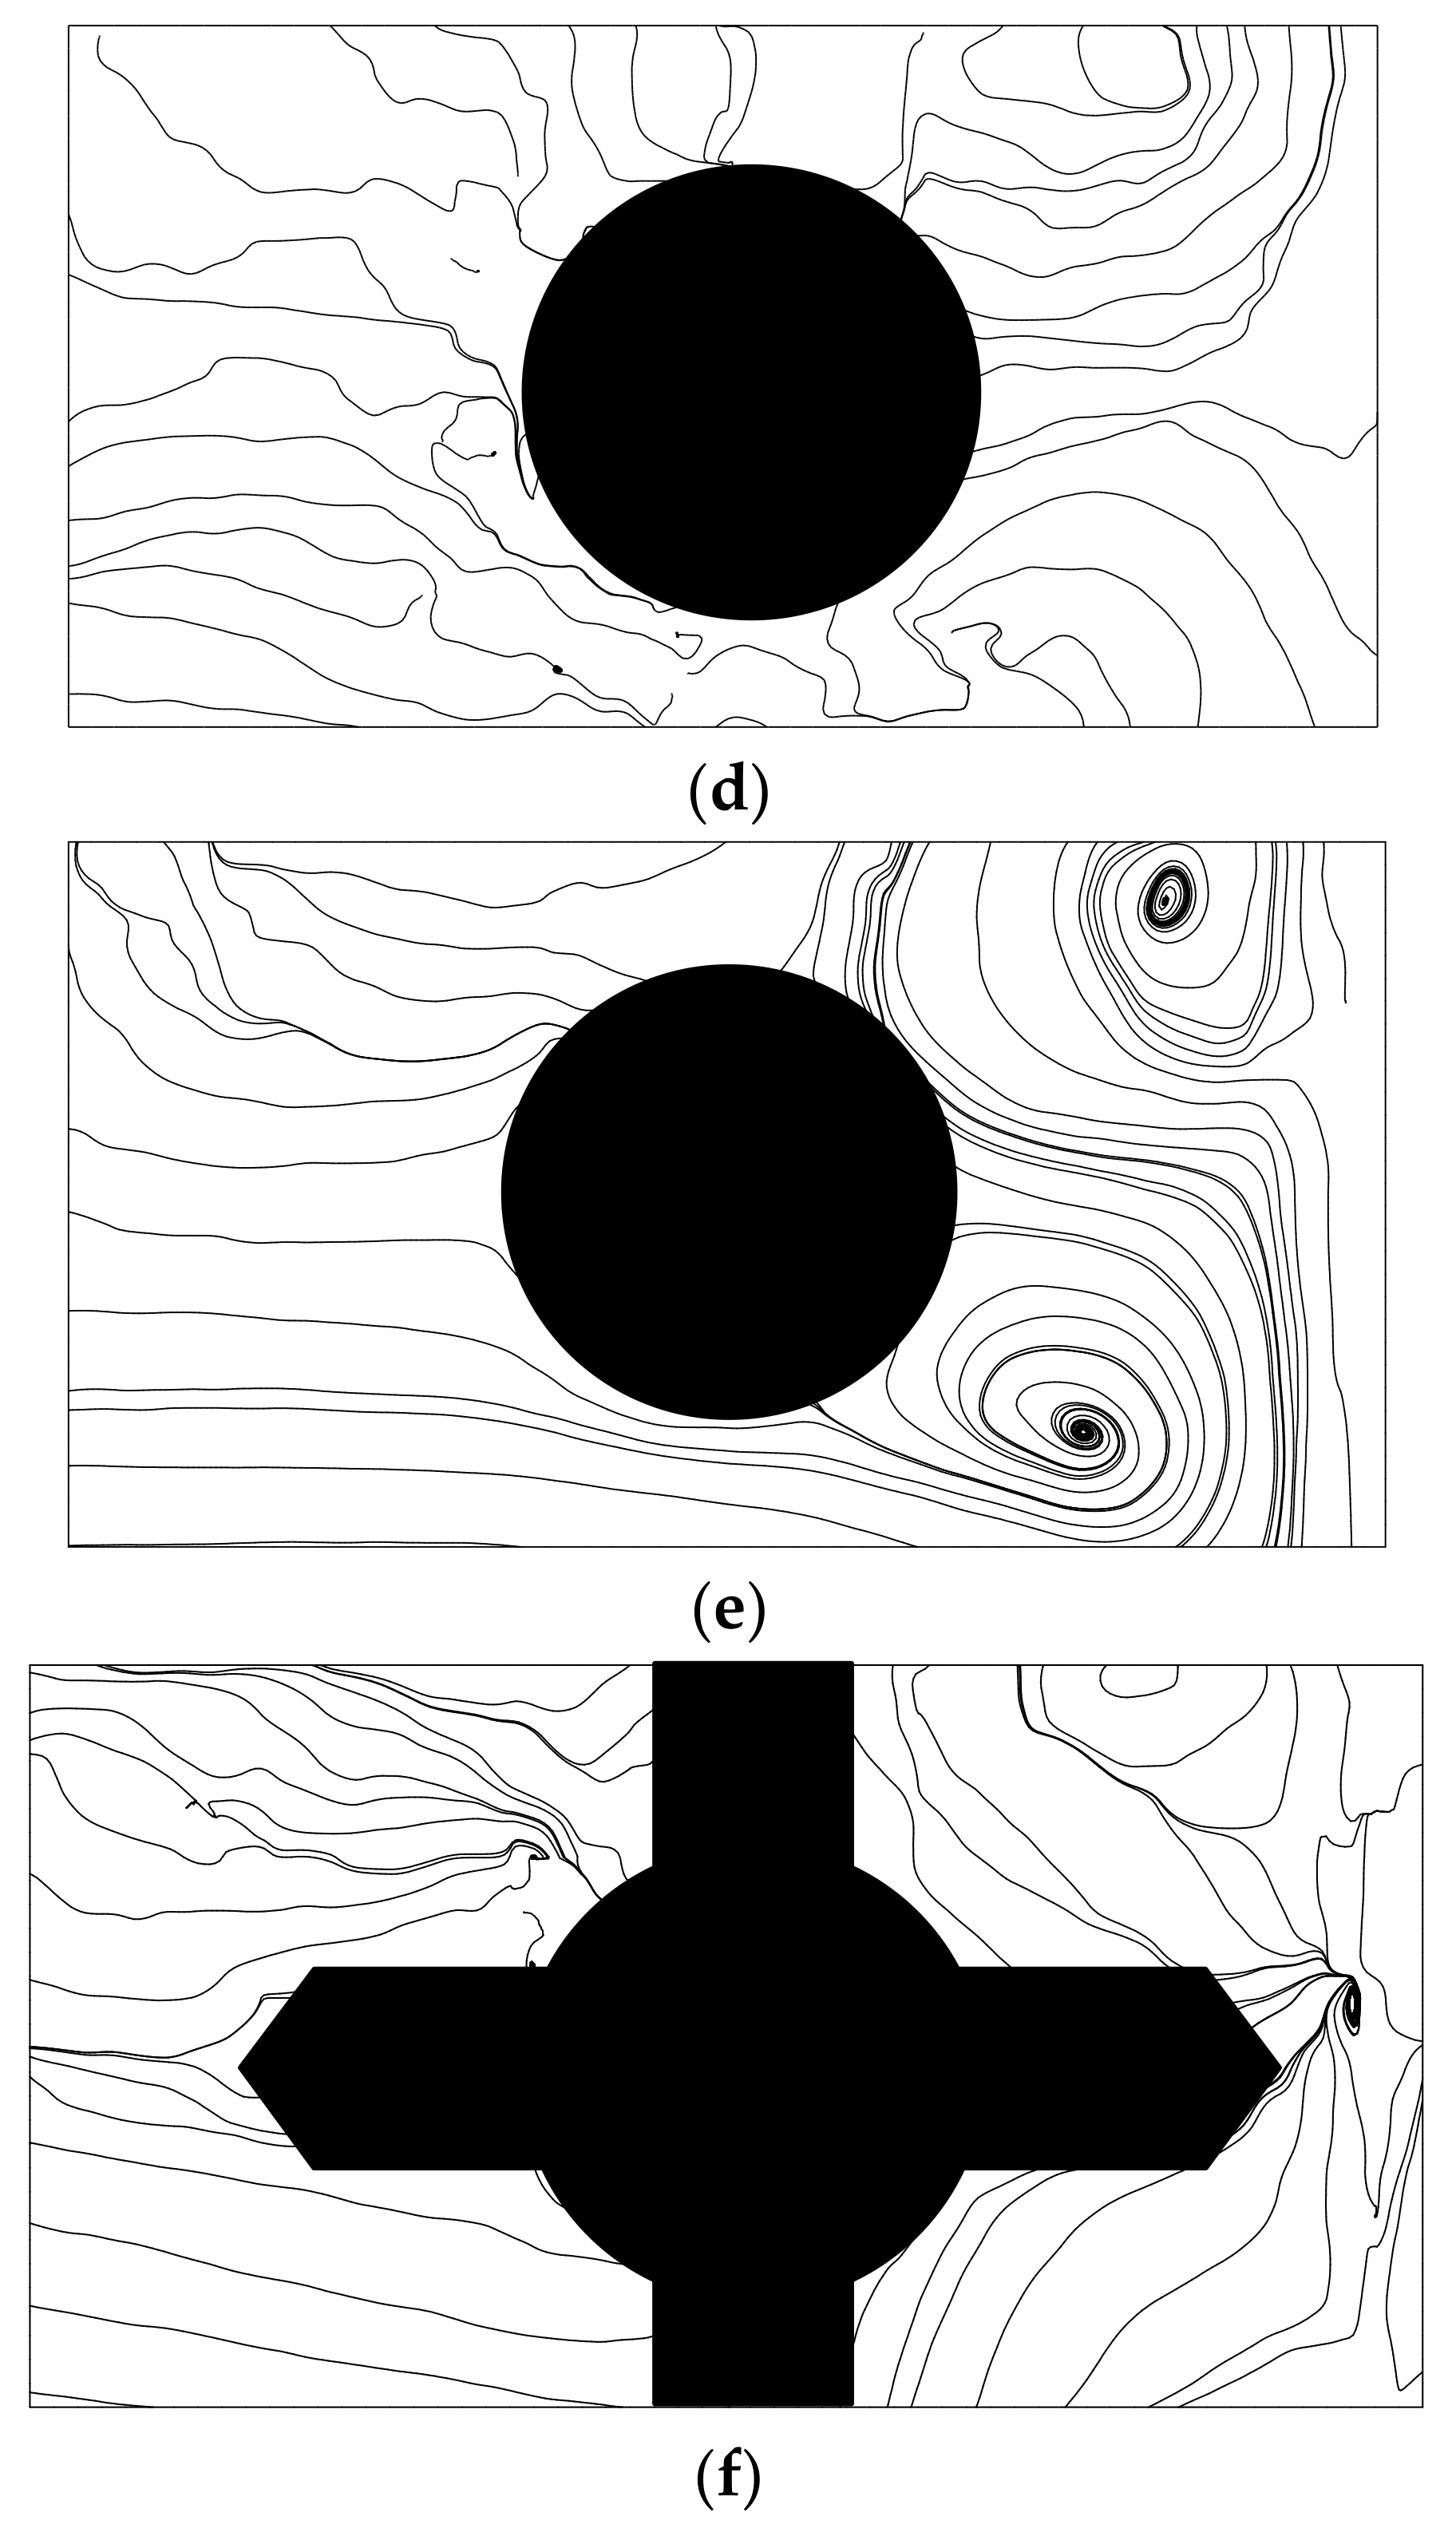
The flow patterns in the sump are compared in Figure 9, in which the streamlines were plotted on x–y plane. The streamlines at z/h = 0.3, which is under the intake pipe, show that the flow was heading towards the intake pipe. In Case Q3A0, the streamlines were mainly gathered in some area of the pipe, whereas in Case Q3A1, the flow was heading towards the centerline of the intake pipe. At z/h = 0.7, the flow was passing the intake pipe, thus the clock-wise and counter clock-wise vortex structures were formed behind the intake pipe in Case Q3A0. Although the flow was passing the intake pipe, the streamlines in Case Q3A1 show the weakened symmetric vortex structure, because the surface flow patterns were changed by the F-AVD. Near the water surface (z/h = 0.9), the streamlines definitely show different patterns due to the existence of the F-AVD. In Case Q3A0, the streamlines show the anti-symmetric vortex structure due to the creation and destruction of the surface vortex. Thus, the vortex core was wandering from the left bank to the right bank. In contrast, the vortex was not observed in the streamlines of Case Q3A1 because the legs of the F-AVD prevented the formation of swirls on the water surface. The flow patterns on x–z plane, which were measured at the center of the sump, are compared in Figure 10. In both cases, because of the pump suction, the downward flow was dominant at the front of the intake pipe and behind the intake pipe. In Case Q3A0, the flow patterns under the intake pipe show that the streamlines were gathered at a part of the intake pipe, and some streamlines came from the water surface. This lead to air entrainment. In Case Q3A1, the intake pipe uniformly withdrew water through the entire pipe.
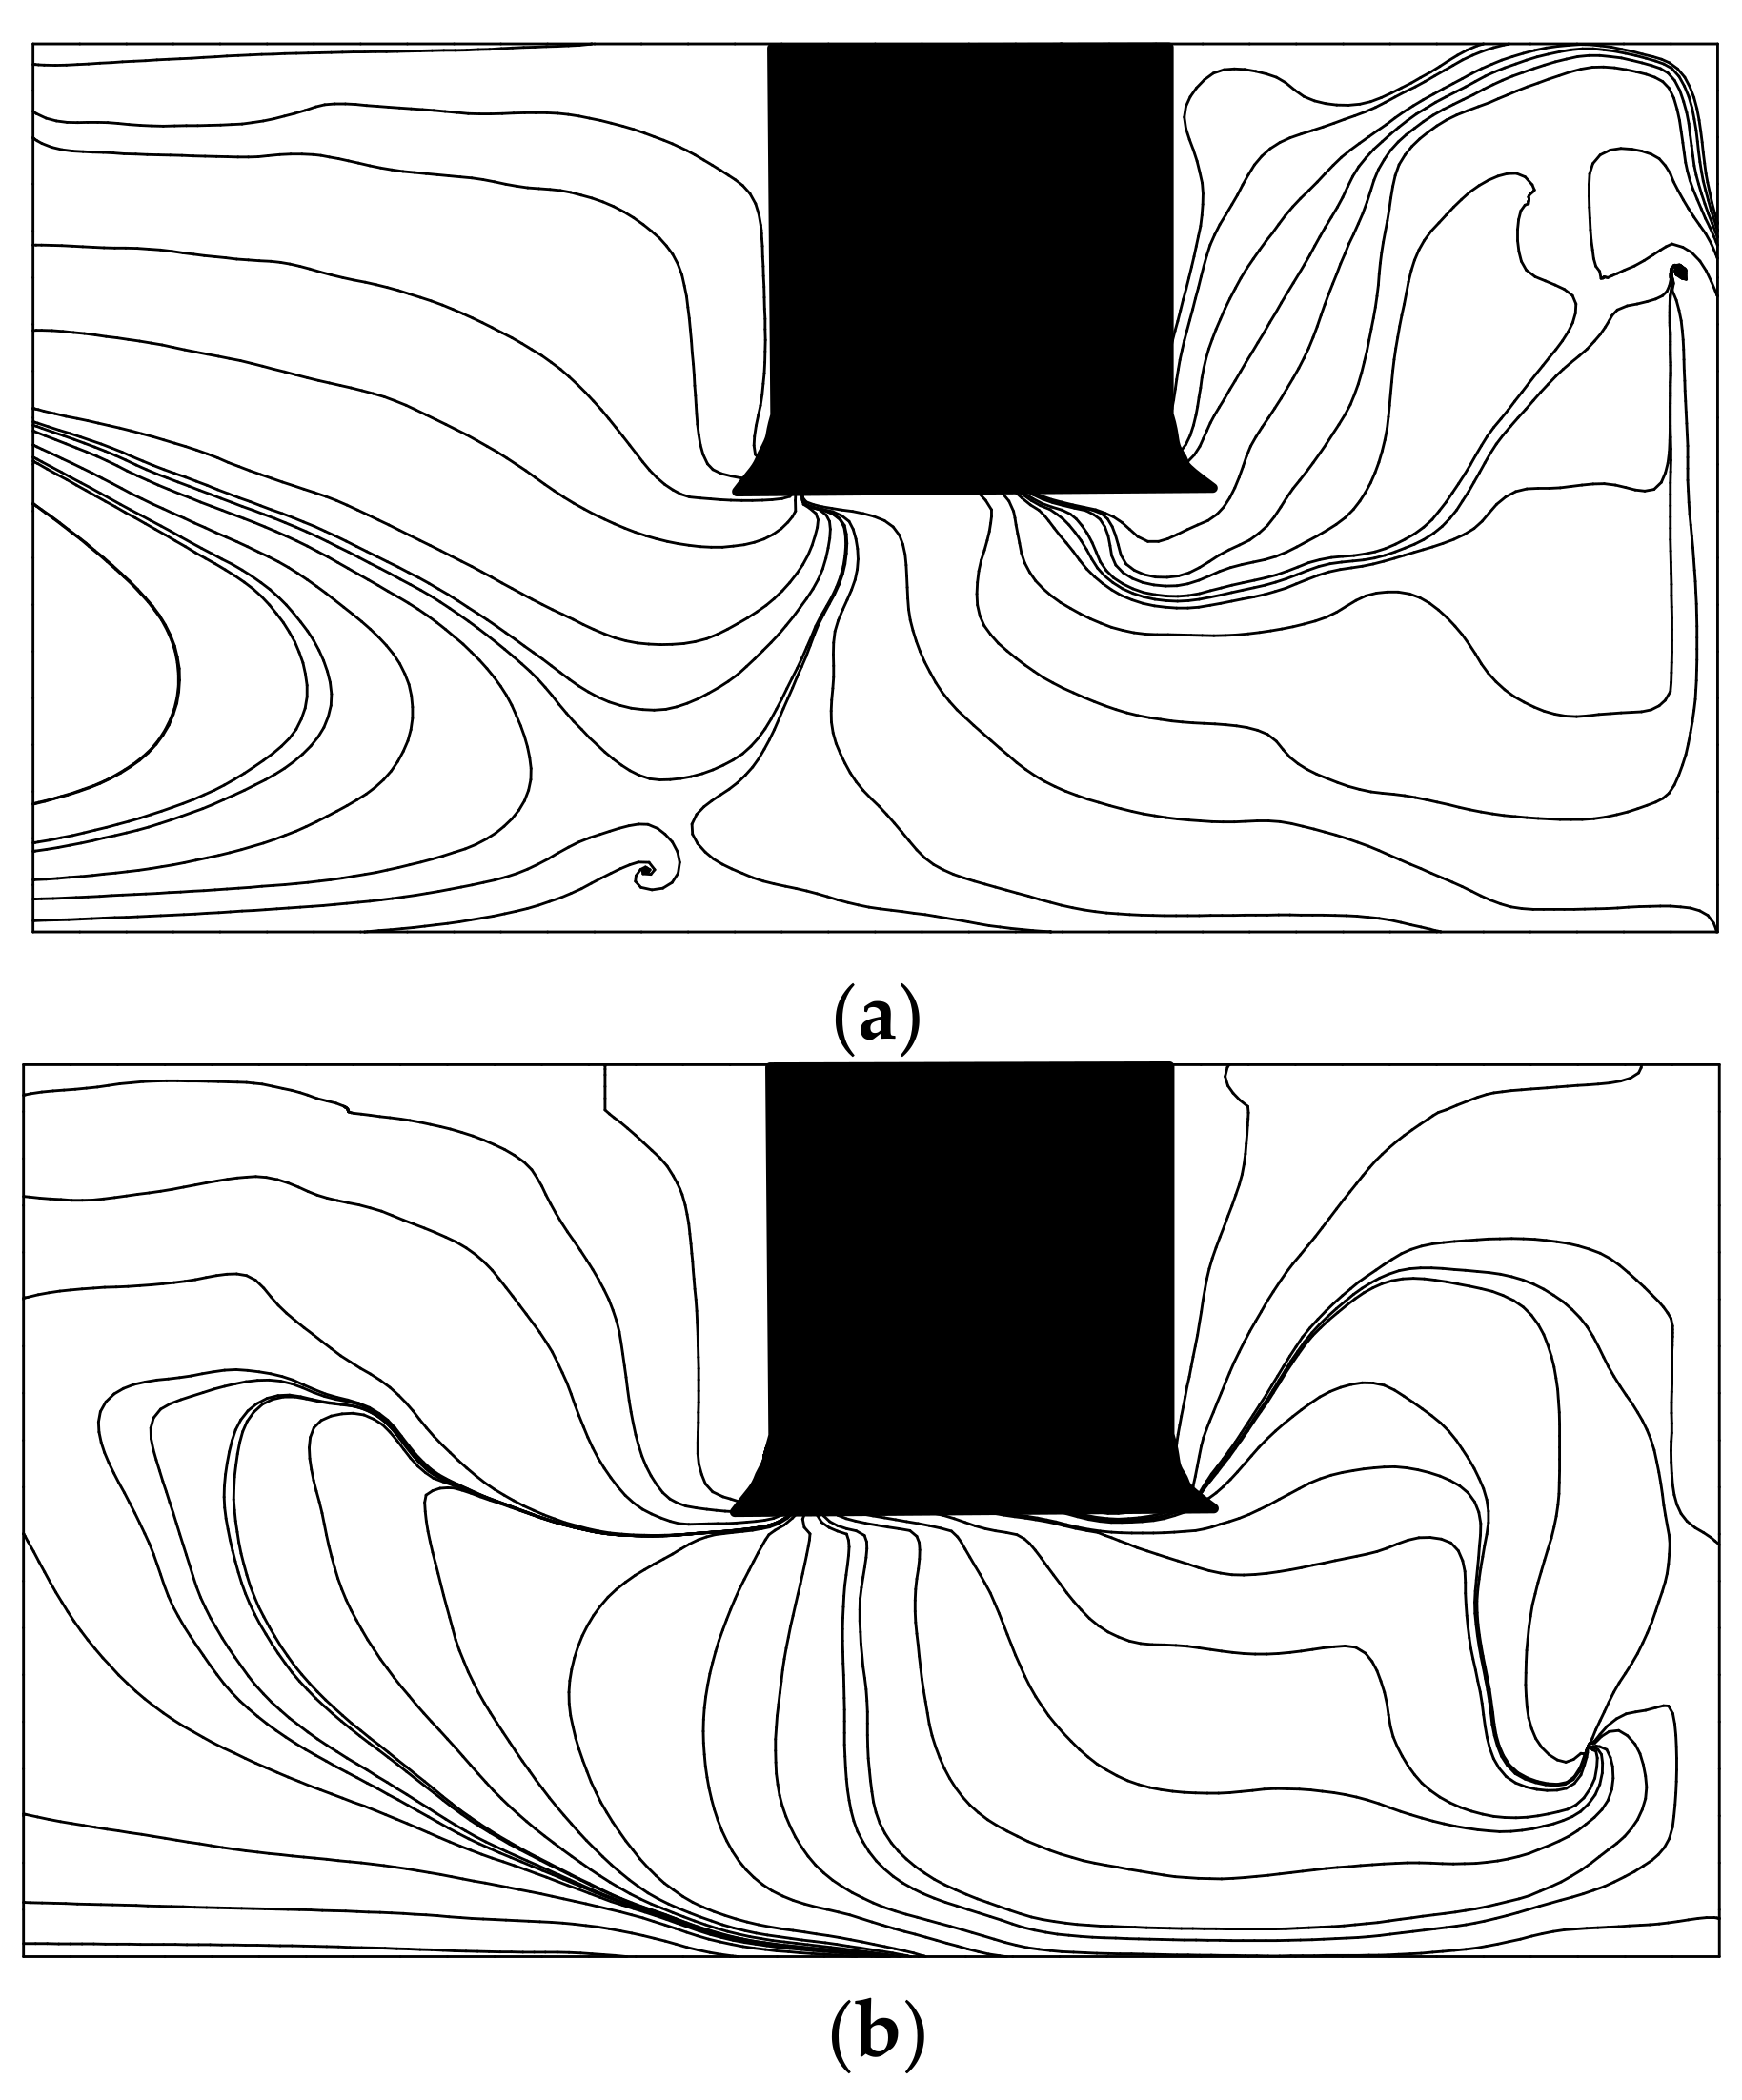
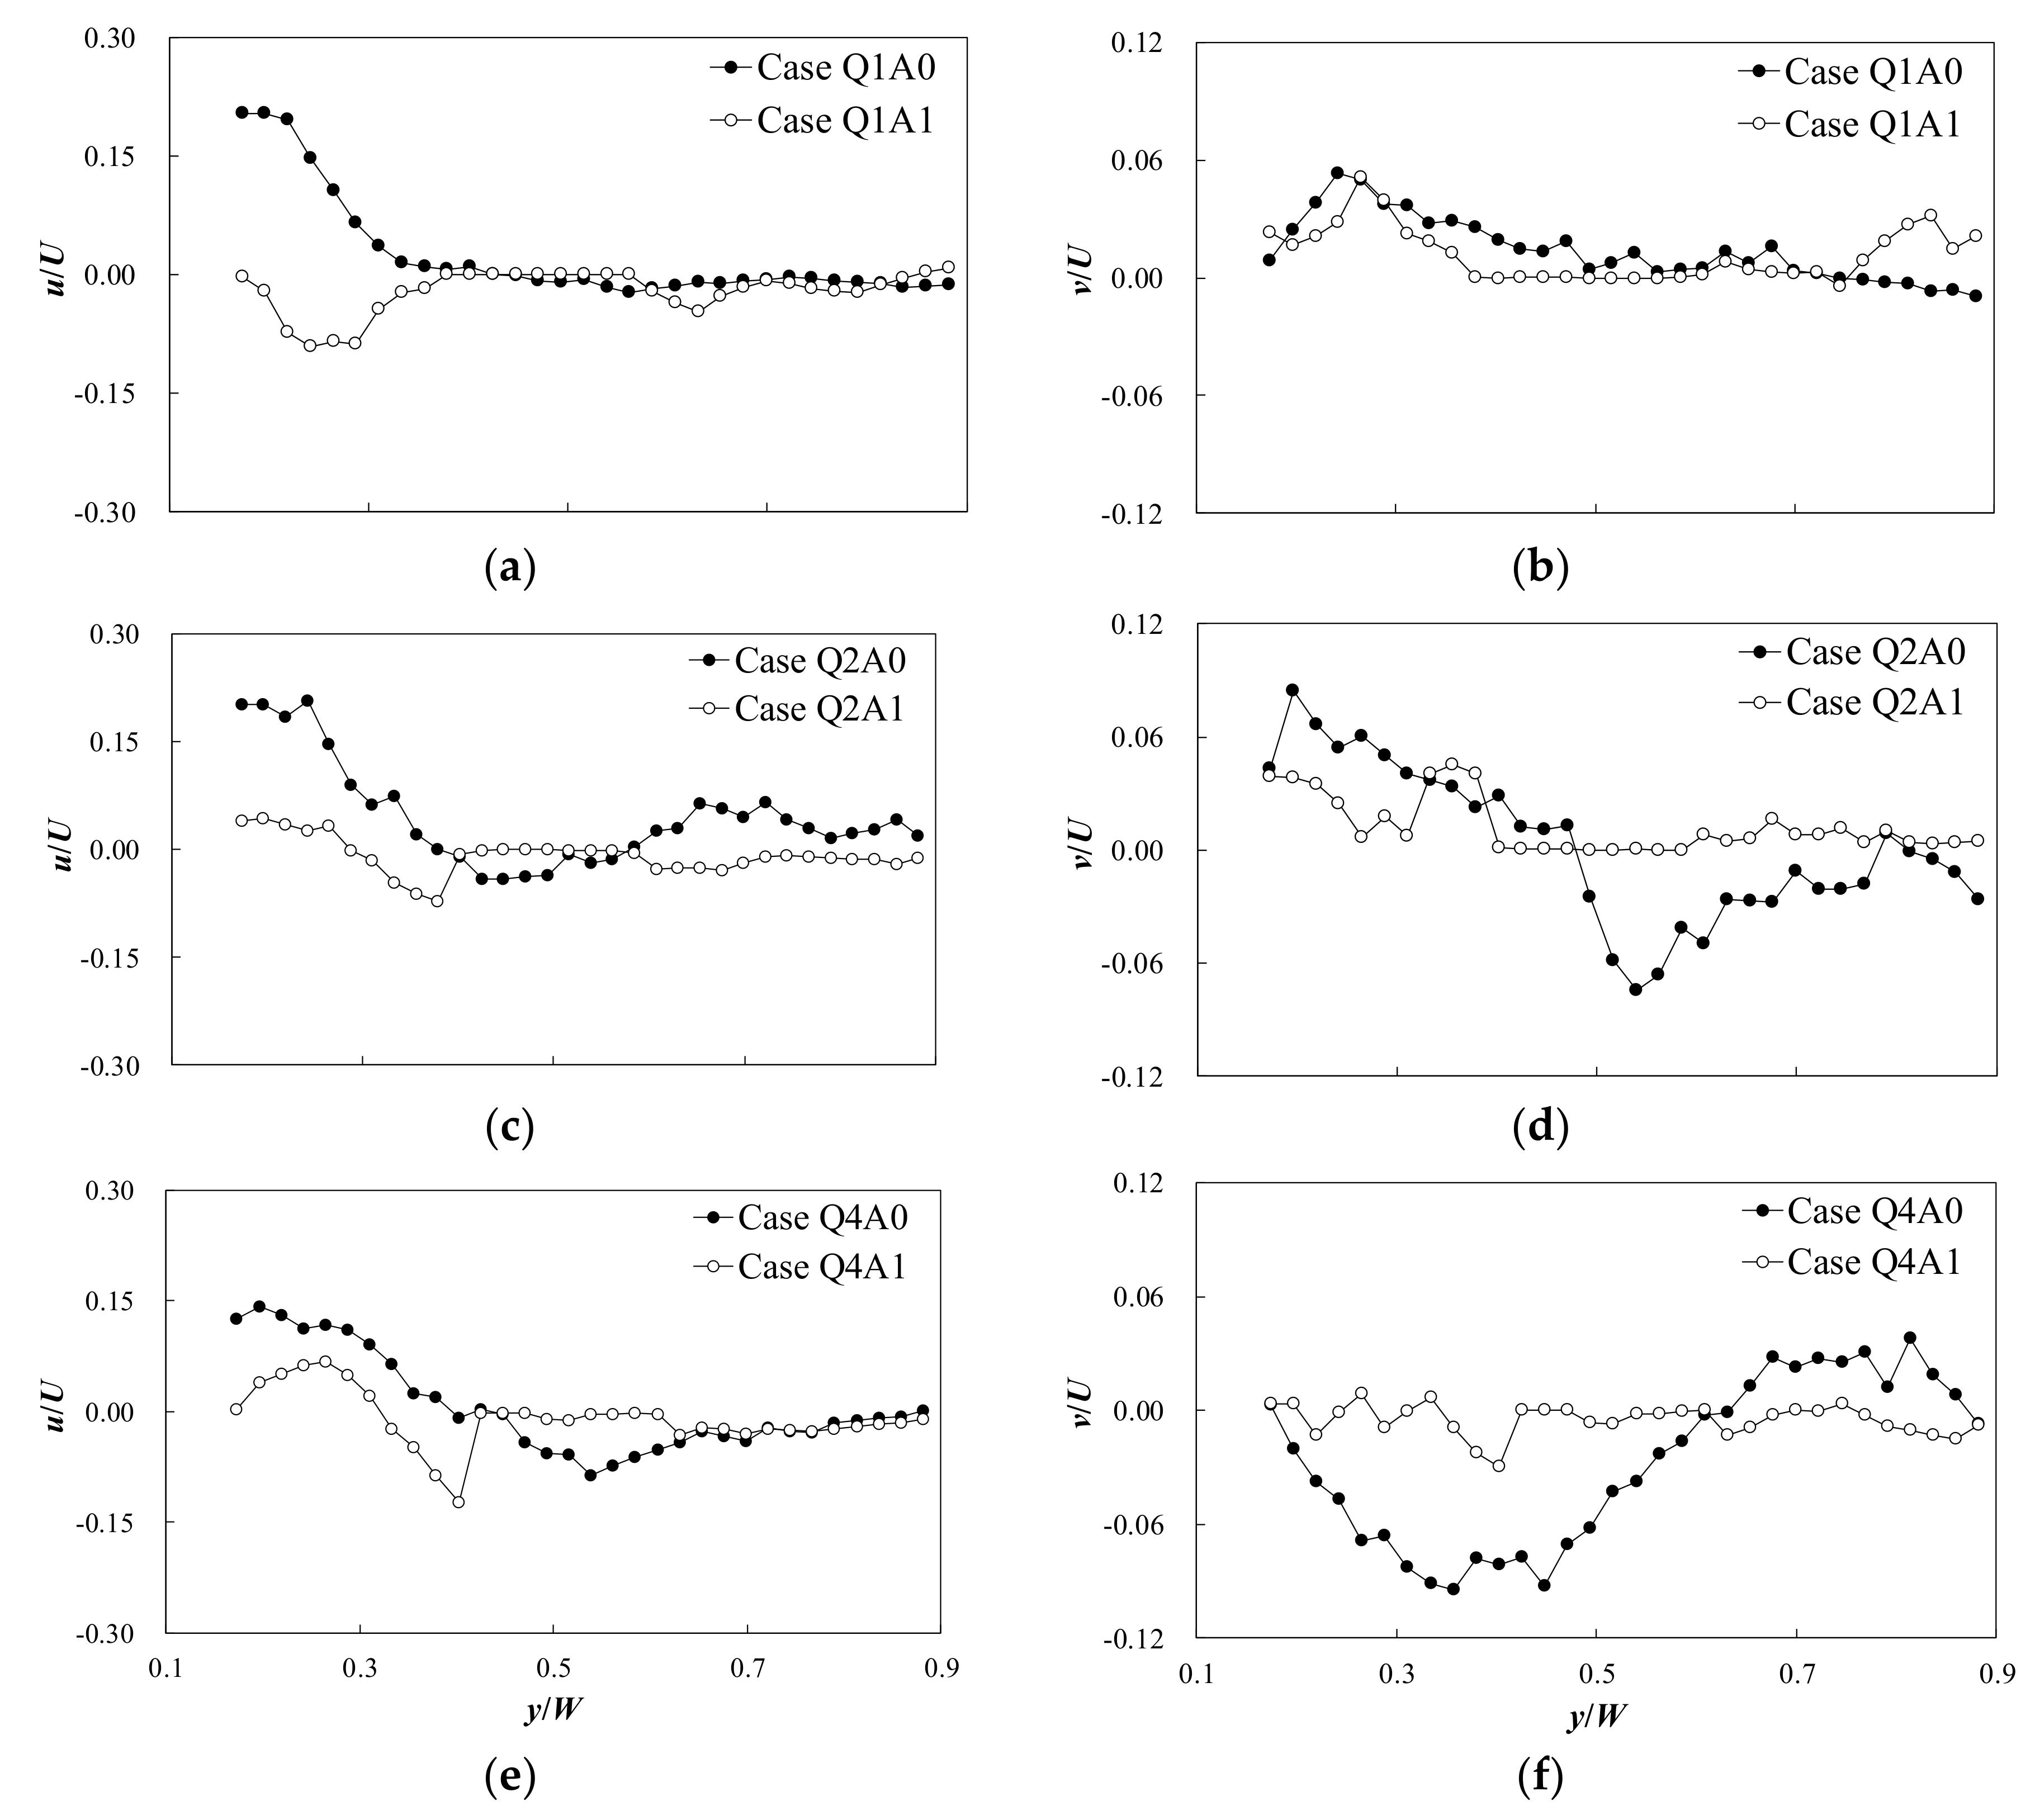
Figure 11 indicates the y-direction variations of the velocity components on x–y plane (u, v) behind the intake pipe at z/h = 0.9. Each of the velocity components were normalized by the inflow velocity magnitude (U). In case of the velocity distributions in the pump sump without the adoption of the F-AVD, the u and v velocities behind the intake pipe were affected by the vortex, which generally occurs around the circular pier. Thus, the u velocity indicated a reverse flow near the intake pipe, and the v velocity had a near symmetric distribution with respect to the intake pipe. The flow distributions with the F-AVD indicated that the velocity magnitude decreased when compared with the results without the F-AVD. Although some small vortices were observed between the legs of the F-AVD (Figure 9f), a pair of vortices disappeared from the entire section behind the pipe after installing the F-AVD. These results suggest that the vortex region behind the intake pipe was weakened by employing the F-AVD.
3.2. Vorticity Distributions
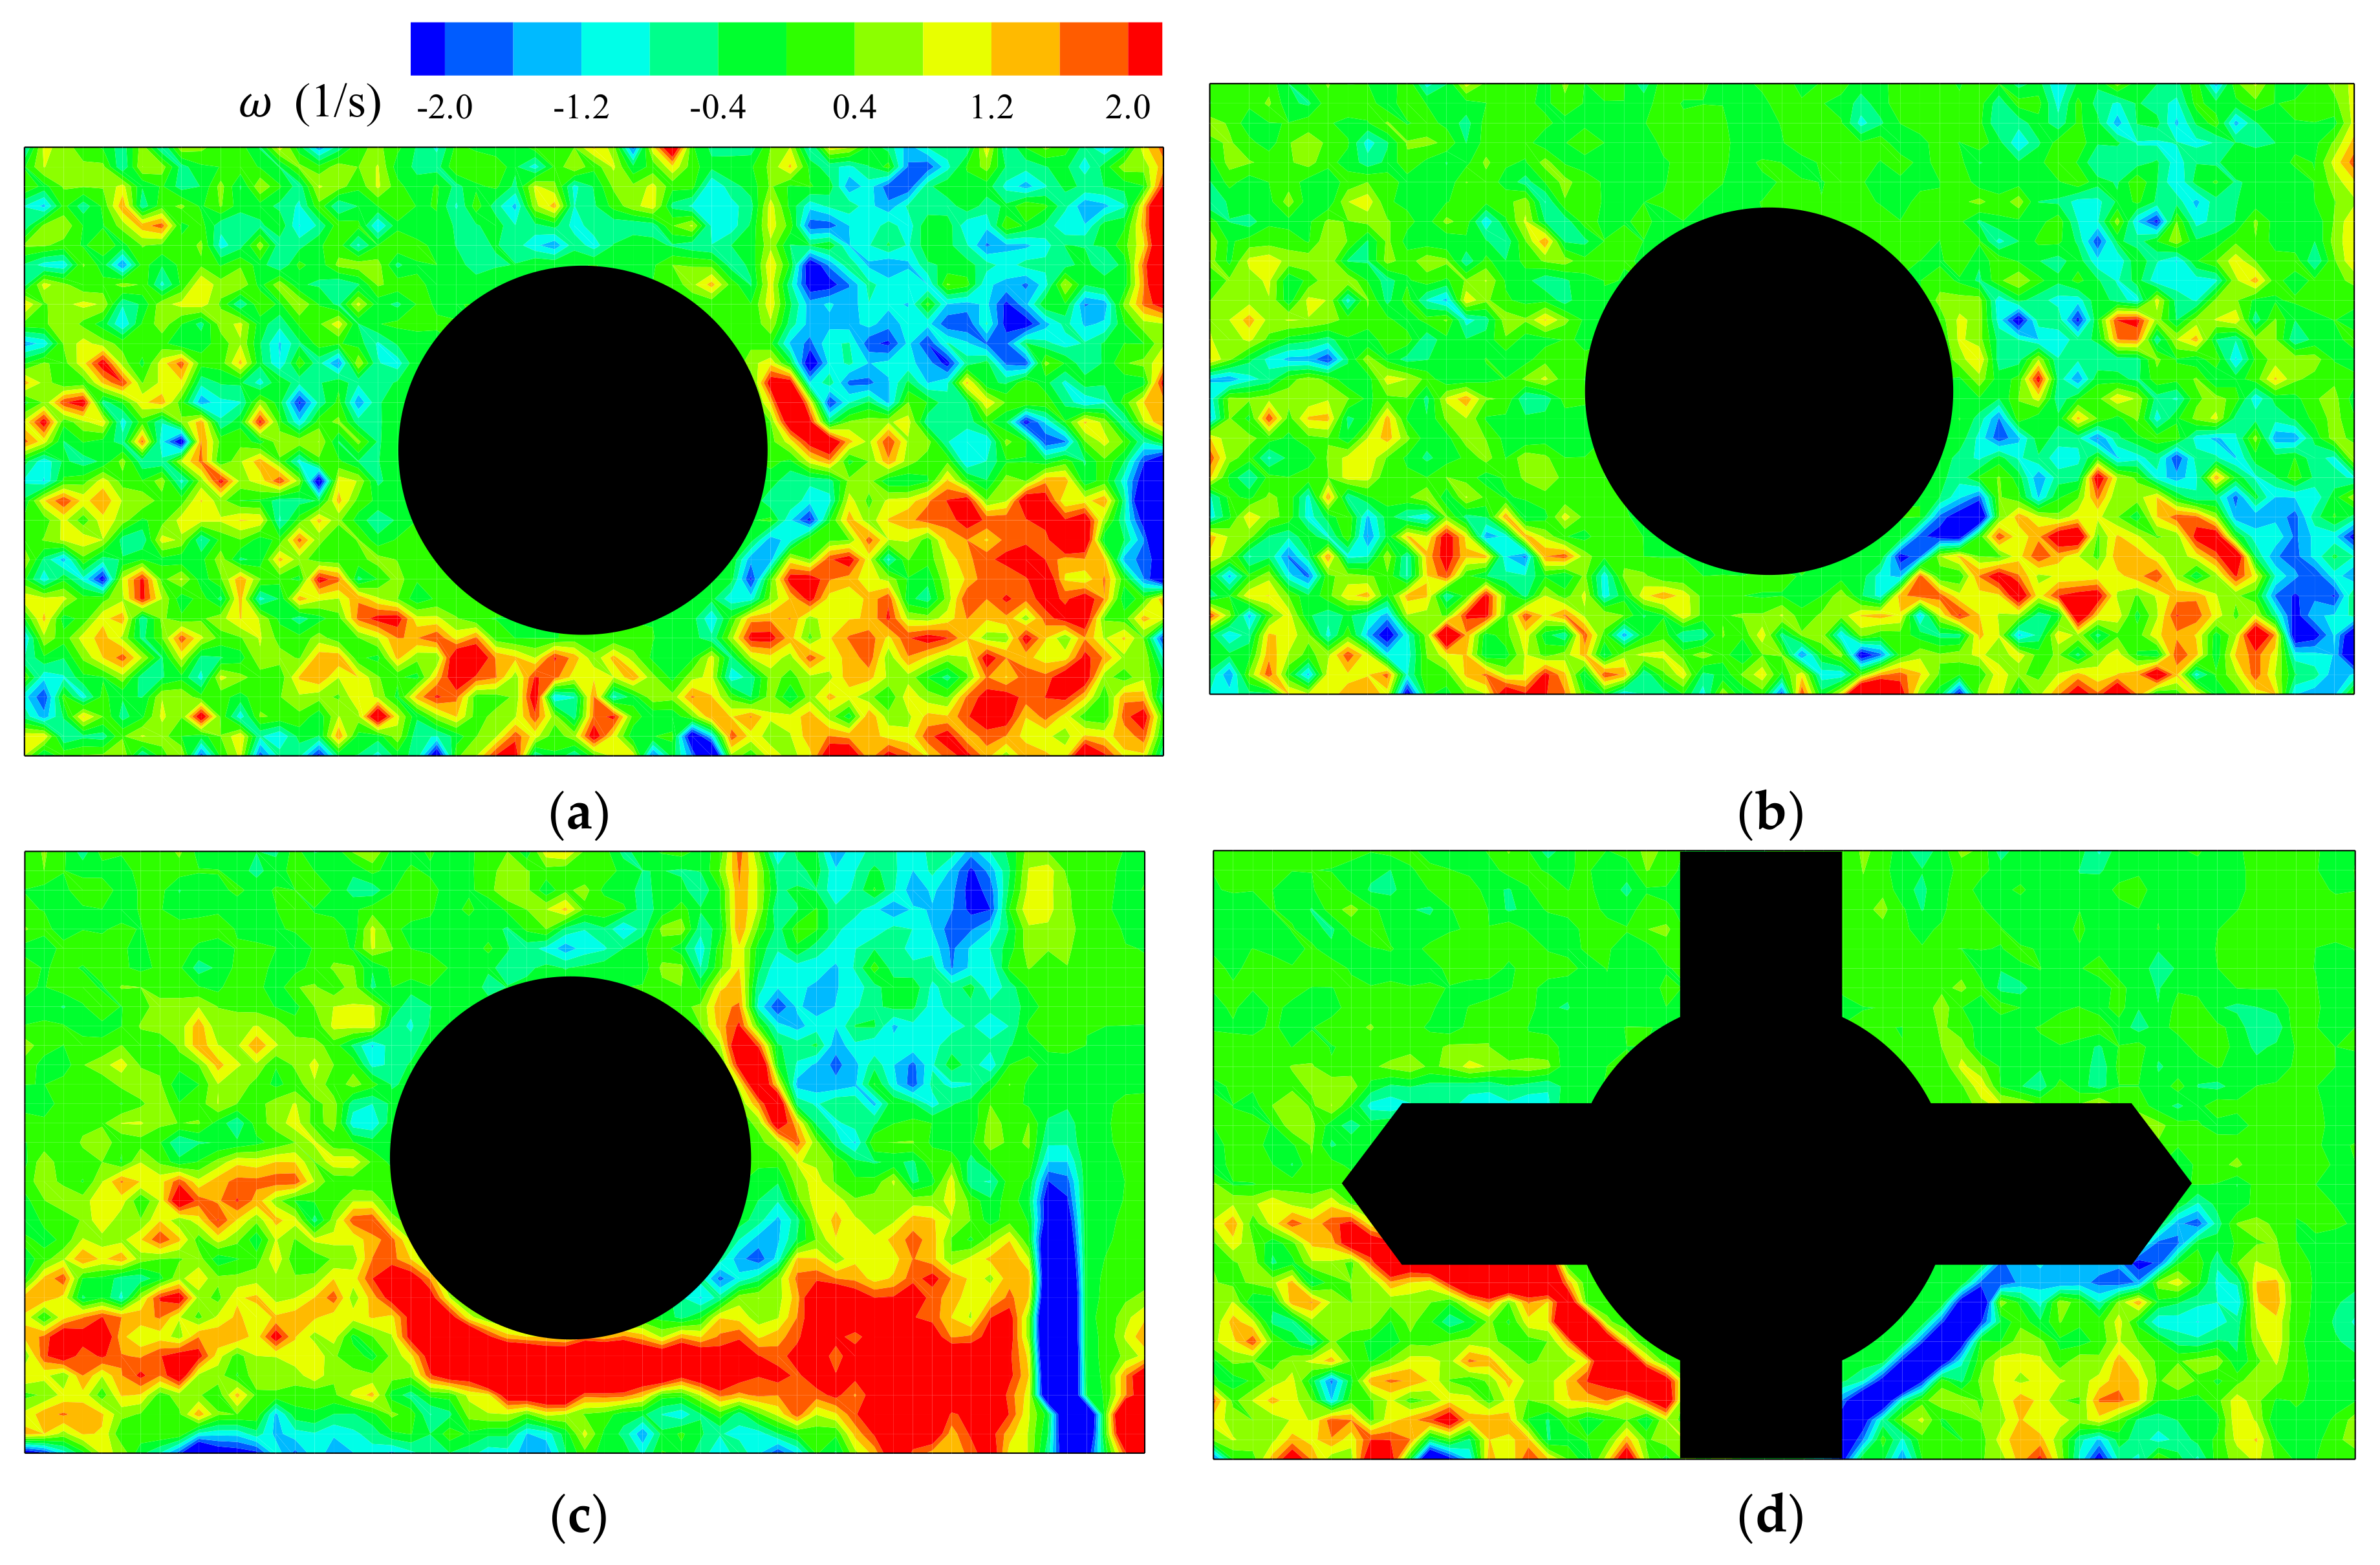
The complex flow patterns in the sump that were displayed in the previous chapter are related to the interaction between the pump suction and the vortex behind the circular pipe. Specifically, the vortex near the water surface was clearly observed in the case without the adoption of the F-AVD, and these flow structures may cause air entrainment to occur. Air entrainment is a complex phenomenon. The interaction of the air and water, and both the velocity and vorticity induced by the pump intake, affect the air entrainment mechanism [9]. Thus, in this section, the vorticity distributions on x–y plane were calculated, and the performance of the F-AVD was investigated with respect to the mitigation of the vorticity magnitude. Figure 12 presents the vorticity distributions, in which the z-direction vortex (ωz) was calculated using Equation (2).
Figure 12a,c indicate the vorticity magnitude without the F-AVD. As a result of the creation of a pair of vortices behind the intake pipe, the vorticity at z/h = 0.7 showed a negative value in the region of y/W > 0.5 and a positive value in the region of y/W < 0.5. Furthermore, the results indicate that the vorticity magnitude was further increased near the water surface (z/h = 0.9). On the other hand, in Case Q3A1, the vorticity magnitude decreased when compared with the vorticity magnitude in Case Q3A0. At z/h = 0.9, relatively small vortices were observed at the corner of the sump (as shown in Figure 9a) and thus the vorticity decreased to nearly zero at the rear of the intake pipe.
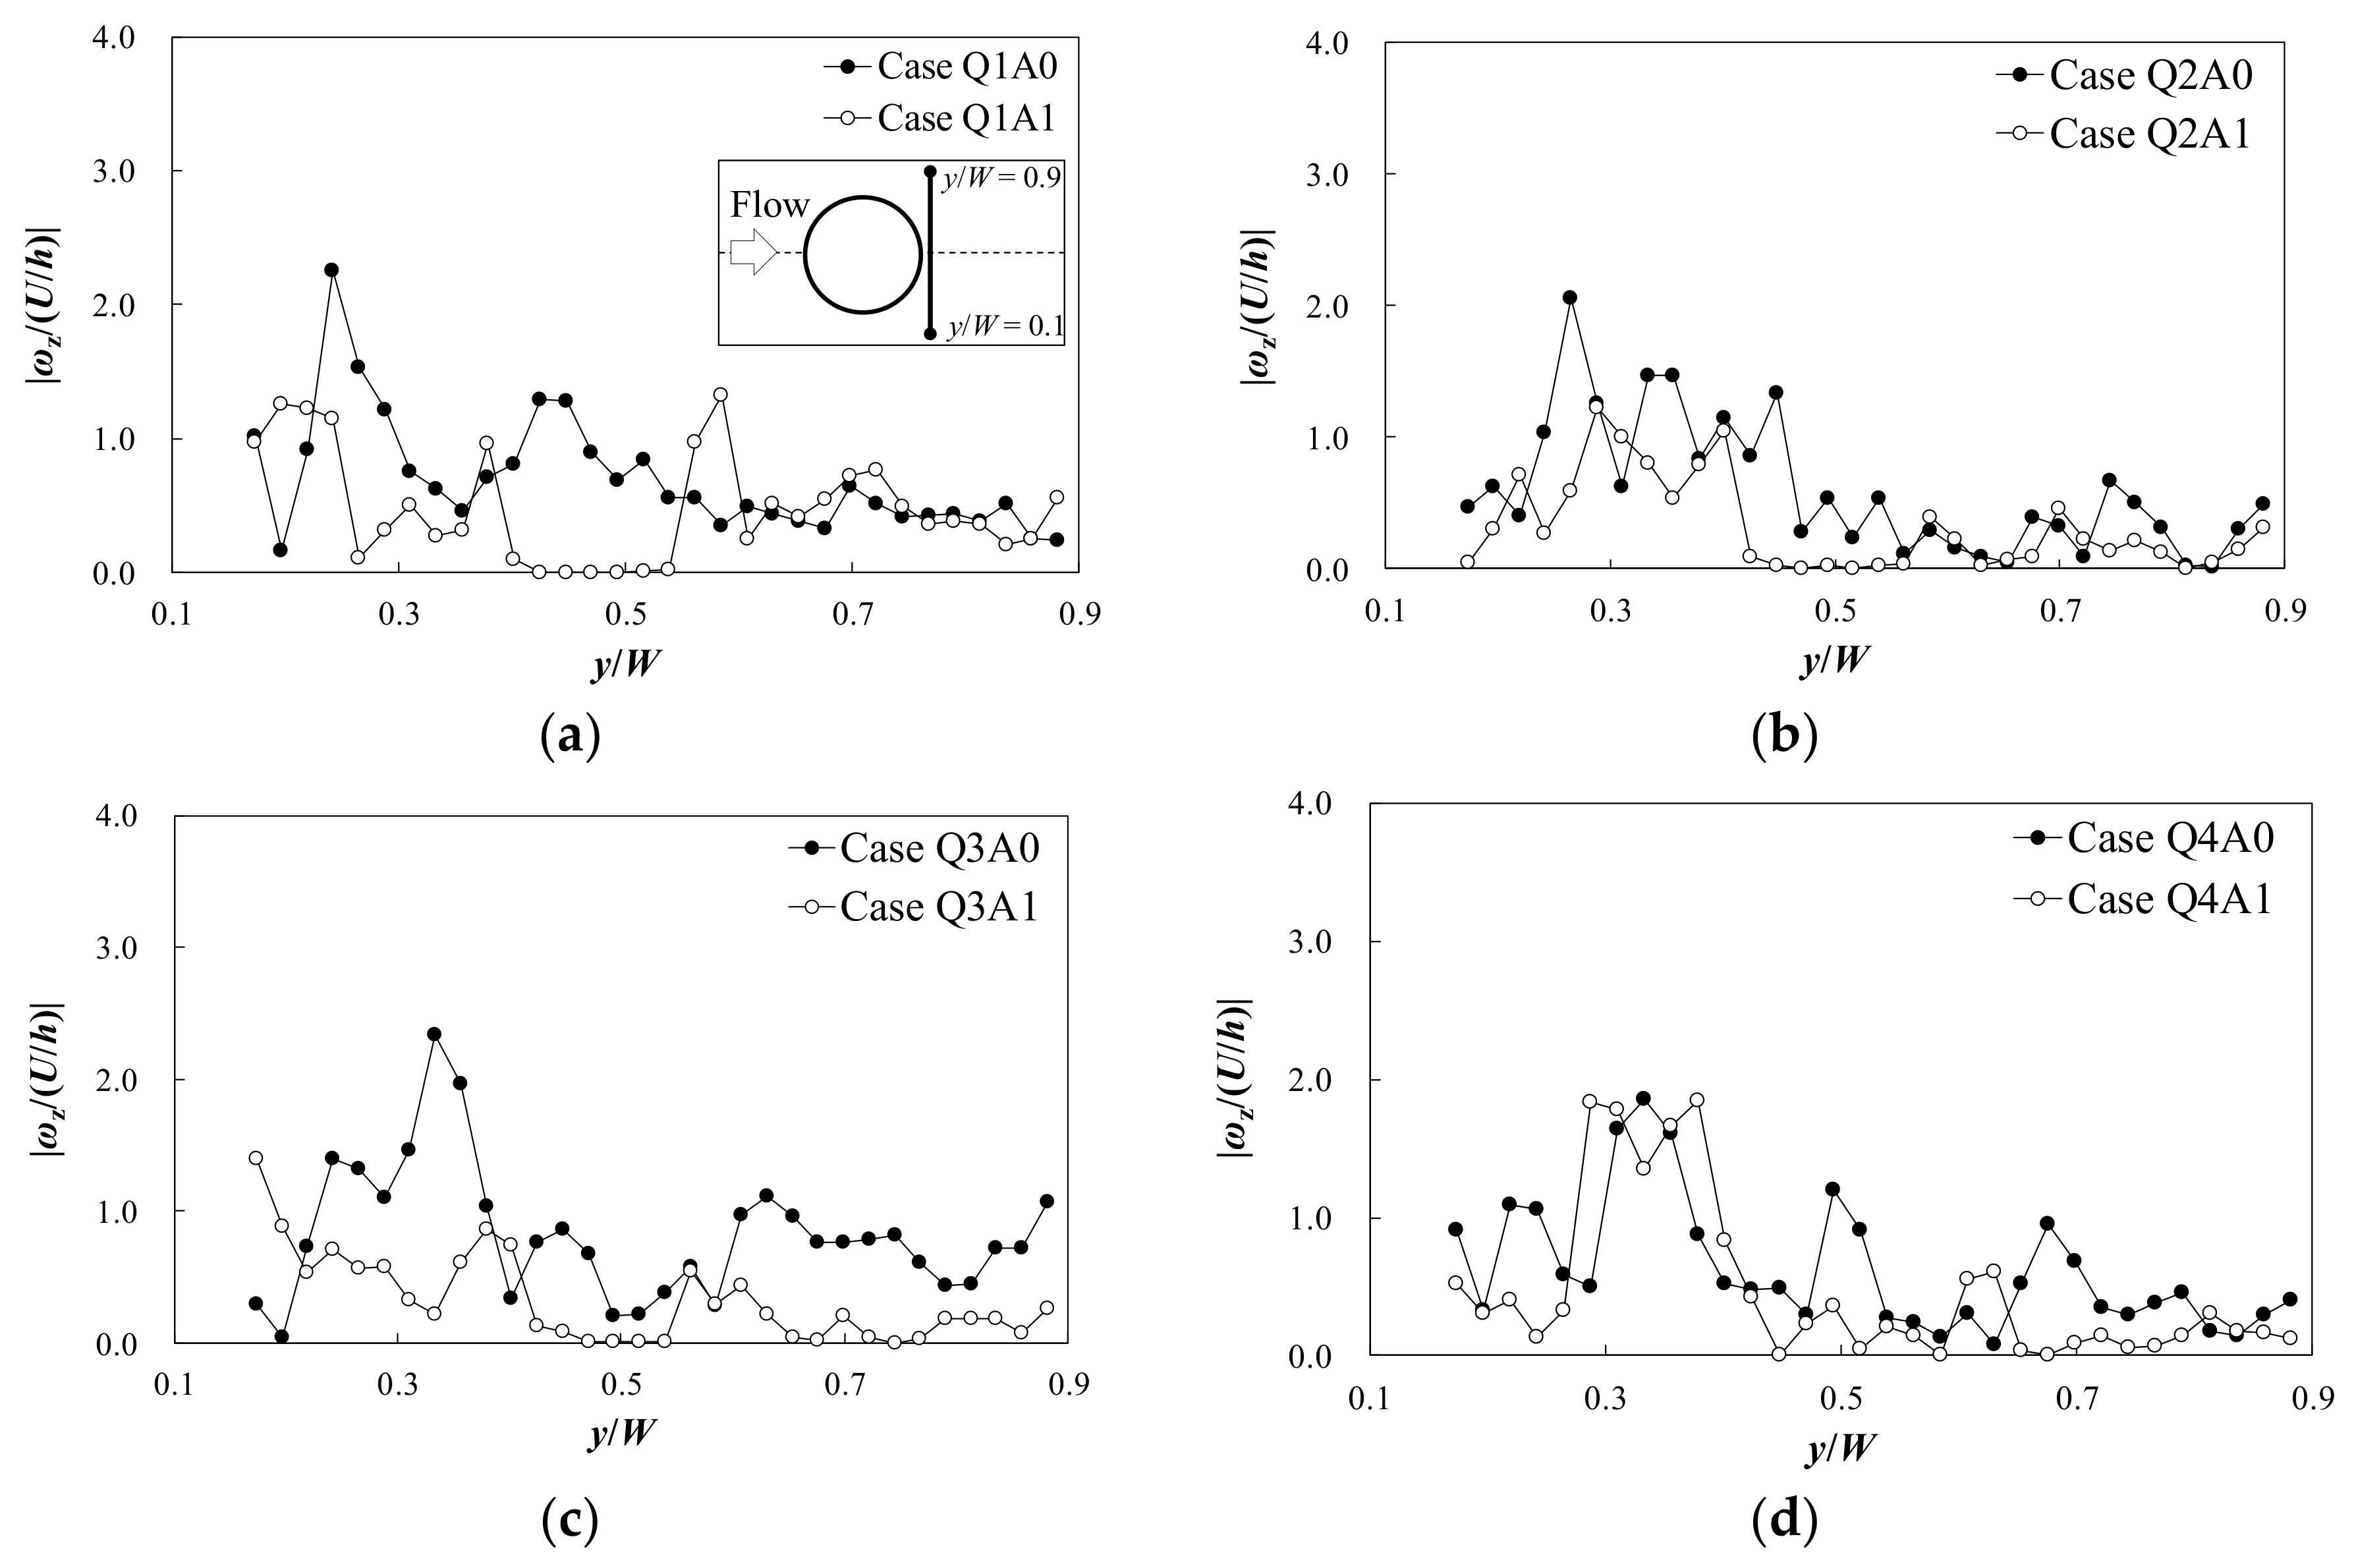
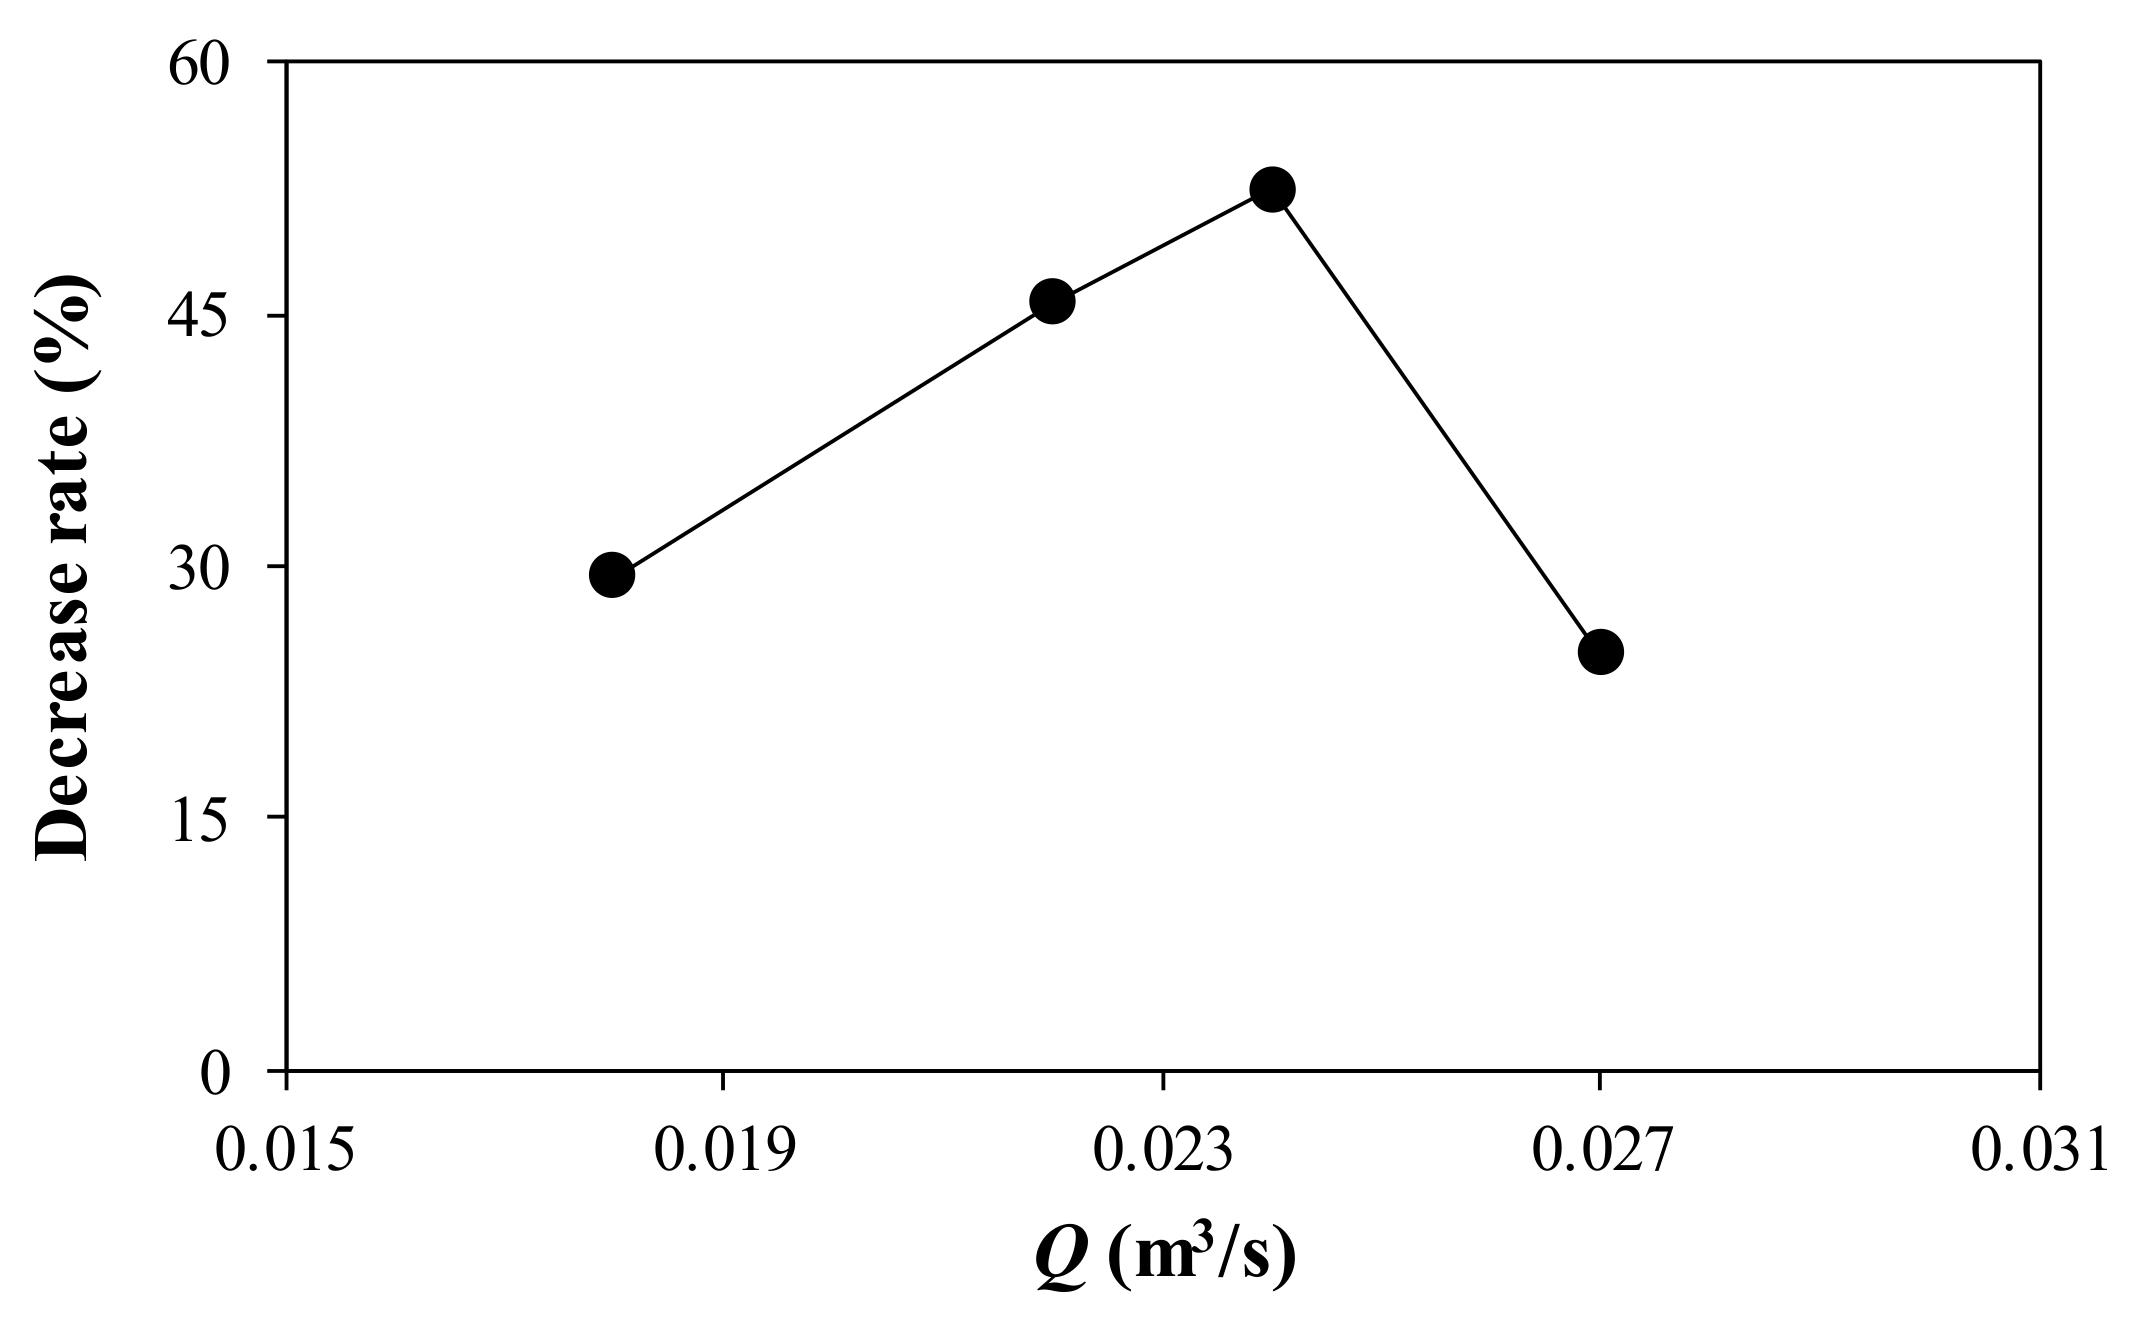
The y-direction variations of vorticity magnitude at the rear of the intake pipe are compared in Figure 13. In Figure 13, the vorticity magnitude that was obtained near the water surface (z/h = 0.9) was normalized using the inflow velocity and the water depth. The vorticity magnitude tended to decrease near the center of channel (y/W = 0.5) and began to increase around the intake pipe because of the creation of vortices (as shown in Figure 12). The comparison results indicate that the vorticity magnitude decreased when the F-AVD was employed in the intake pipe. However, in Case Q4A1, the vorticity magnitude was not effectively mitigated when compared to the results of Case Q4A0. Figure 14 displays the change of the decrease rate of the vorticity magnitude against the flow rate. By increasing the flow rate, the vorticity magnitude was more efficiently decreased, with the decrease rate changing from 29.5% under the condition of Q = 0.018 m3/s to 52.5% under the condition of Q = 0.018 m3/s. When the flow rate increased to 0.027 m3/s, however, the decrease rate of the vorticity magnitude decreased to 24.8%. These results imply that the efficiency of the F-AVD decreased with the increase of the inflow velocity, which lead to the fully turbulent flows. In the strong turbulent flows, the vortex structure occurred not only on the water surface, but also in the sump. Thus, in the high velocity, it was efficient to use fillet-type or splitter-type AVDs with the F-AVD for the mitigation of the vortex flow.
4. Concluding Remarks
In this research, the experimental study was conducted to investigate the performance of the F-AVD. The laboratory experiments were conducted in the 1/10 scaled pump sumps, which were designed according to pump sumps that were actually operating in Korea. In this channel, the F-AVD was installed in the intake pipe to mitigate the vortex region behind the intake pipe and prevent the air entrainment. The F-AVD consisted of four legs and a floating body. The length of each leg was designed to be the same as the diameter of intake pipe, and the width of each leg was half of the diameter. The F-AVD, which is placed on the water surface, was appropriate not only for enhancing the flow characteristics without changing the sump geometry, but also for maintaining the flow area in the sump.
The performance of the F-AVD was evaluated by the vorticity magnitude and the flow patterns behind and under the intake pipe. The experimental results indicated that a pair of vortices appeared behind the intake pipe without the F-AVD. Furthermore, the vorticity magnitude increased near the water surface, and the streamlines on x–z plane formed from the water surface to the intake mouth, which caused the air entrainment. By adopting the F-AVD, the eddies behind the circular pipe were mitigated near the water surface. The vorticity magnitude decreased from 24.8–52.5% behind the intake pipe and the velocity magnitude was also reduced when compared to the case without the installation of the F-AVD. Thus, the intake pipe efficiently withdrew the water without the air entrainment. However, in case of a flow rate increase, the efficiency of the F-AVD had decreased because of the strong vortex, which was induced by the horseshoe vortex behind the circular pipe in the sump. These results indicated that the additional AVD, such as the fillet-type or the splitter-type—which can reduce the vortex from the channel bottom and the back wall—is necessary in order to mitigate both the surface vortex and the vortex in the sump.
Acknowledgments
This study was supported by a grant (17AWMP-B066744-05) from the Water Management Research Project funded by Ministry of Land, Infrastructure, and Transport of Korean government. This research was supported by a grant (17CTAP-C095650-03) from Infrastructure and Transportation Technology Promotion Program funded by Ministry of Land, Infrastructure and Transport of Korean government.
Author Contributions
Inhwan Park, Hyung-Jun Kim, Hoje Seong, and Dong Sop Rhee designed the study concept and experiments; Inhwan Park and H. J. Seong performed the experiments; Inhwan Park, Hyung-Jun Kim, and Dong Sop Rhee analyzed the data; Inhwan Park, Hyung-Jun Kim, Hoje Seong, and Dong Sop Rhee wrote the paper.
Conflicts of Interest
The authors declare no conflicts of interest.
References
- Arboleda, G.; El-Fadel, M. Effects of approach flow conditions on pump sump design. J. Hydraul. Eng. 1996, 122, 489–494. [Google Scholar] [CrossRef]
- Keller, J.; Möller, G.; Boes, R.M. PIV measurements of air-core intake vortices. Flow Meas. Instrum. 2014, 40, 74–81. [Google Scholar] [CrossRef]
- Constantinescu, G.S.; Patel, V.C. Numerical model for simulation of pump-intake flow and vorticies. J. Hydraul. Eng. 1998, 124, 123–134. [Google Scholar] [CrossRef]
- De Siervi, F.; Viguier, H.C.; Greitzer, E.M.; Tan, C.S. Mechanism of inlet-vortex formation. J. Fluid Mech. 1982, 124, 173–207. [Google Scholar] [CrossRef]
- Padmanabhan, M.; Hecker, G.E. Scale effects in pump sump models. J. Hydraul. Eng. 1984, 110, 1540–1556. [Google Scholar] [CrossRef]
- Okamura, T.; Kamemoto, K.; Matsui, J. CFD prediction and model experiment on suction vortices in pump sump. In Proceedings of the 9th Asian International Conference on Fluid Mechinery, Jeju, Korea, 16–19 October 2007. [Google Scholar]
- Nagahara, T.; Sato, T.; Okamura, T. Measurement of the flow around the submerged vortex cavitation in a pump intake by means of PIV. In Proceedings of the 5th International Symposium on Cavitation, Osaka, Japan, 1–4 November 2003. [Google Scholar]
- Li, H.; Chen, H.; Ma, Z.; Yi, Z. Experimental and numerical investigation of free surface vortex. J. Hydrodyn. Ser. B 2008, 20, 485–491. [Google Scholar] [CrossRef]
- Guo, Z.W.; Chen, F.; Wu, P.F.; Qian, Z.D. Three-dimensional simulation of air entrainment in a sump pump. J. Hydraul. Eng. 2017, 143, 04017024. [Google Scholar] [CrossRef]
- Hydraulic Institute. American National Standard for Pump Intake Design; ANSI/HI 9.8-1998; Hydraulic Institute: Parsippany, NJ, USA, 1998. [Google Scholar]
- Kang, W.T.; Shin, B.R.; Doh, D.H. An effective shape of floor splitter flor reducing sub-surface vortices in pump sump. J. Mech. Sci. Tech. 2014, 28, 175–182. [Google Scholar] [CrossRef]
- Norizan, T.A.; Reda, E.; Harun, Z. Enhancement of vorticity reduction by floor splitter in pump sump to improve pump efficiency. Sustain. Energy Tech. Assess. 2017, 26, 28–36. [Google Scholar] [CrossRef]
- Kim, H.J.; Park, S.W.; Rhee, D.S. Effective height of a floor splitter anti-vortex device under varying flow conditions. Sustainability 2017, 9, 285. [Google Scholar] [CrossRef]
- Claxton, J.; Hecker, G.E.; Sdano, A.R. The new hydraulic institute pump intake design standard. In Proceedings of the 16th International Pump Users Symposium, College Station, TX, USA, 2–4 March 1999. [Google Scholar]
- Taylor, Z.J.; Gurka, R.; Kopp, G.A.; Liberzon, A. Long-Duration Time-Resolved PIV to Study Unsteady Aerodynamics. IEEE Trans. Instrum. Meas. 2010, 59, 3262–3269. [Google Scholar] [CrossRef]
- Prasad, A.K. Particle image velocimetry. Curr. Sci. 2000, 79, 51–60. [Google Scholar]
Figure 1.
Designs of the anti-vortex device (AVD) to reduce sub-surface vortices: (a) Floor cone; (b) corner fillet; (c) wall splitter plate; and (d) floor splitter plate.
Figure 1.
Designs of the anti-vortex device (AVD) to reduce sub-surface vortices: (a) Floor cone; (b) corner fillet; (c) wall splitter plate; and (d) floor splitter plate.

Figure 2.
Conceptual diagram of the laboratory channel: (a) side view; (b) plan view; and (c) shape of the bell mouth.
Figure 2.
Conceptual diagram of the laboratory channel: (a) side view; (b) plan view; and (c) shape of the bell mouth.

Figure 3.
Air entrainment by the surface vortex: (a) surface dimple; (b) vortex pulling; (c) vortex pulling air bubbles to the intake pipe; and (d) full air core to the intake pipe.
Figure 3.
Air entrainment by the surface vortex: (a) surface dimple; (b) vortex pulling; (c) vortex pulling air bubbles to the intake pipe; and (d) full air core to the intake pipe.

Figure 4.
Shape of the floating anti-vortex device (F-AVD): (a) plan view and (b) side view.

Figure 5.
Photos of the experimental set-up for particle image velocimetry (PIV) measurements.

Figure 6.
Descriptions of PIV measurements: (a) x–y plane measurements and (b) x–z plane measurements.
Figure 6.
Descriptions of PIV measurements: (a) x–y plane measurements and (b) x–z plane measurements.

Figure 7.
Instantaneous flow visualization at z/h = 0.7 (flow rate—Q = 0.022 m3/s): (a) without F-AVD and (b) with F-AVD.
Figure 7.
Instantaneous flow visualization at z/h = 0.7 (flow rate—Q = 0.022 m3/s): (a) without F-AVD and (b) with F-AVD.

Figure 8.
Calculation results of the velocity distributions at z/h = 0.7 (Q = 0.022 m3/s): (a) instantaneous velocity (without F-AVD); (b) time-averaged velocity (without F-AVD); (c) instantaneous velocity (with F-AVD); and (d) time-averaged velocity (with F-AVD).
Figure 8.
Calculation results of the velocity distributions at z/h = 0.7 (Q = 0.022 m3/s): (a) instantaneous velocity (without F-AVD); (b) time-averaged velocity (without F-AVD); (c) instantaneous velocity (with F-AVD); and (d) time-averaged velocity (with F-AVD).

Figure 9.
Streamlines by depth under the condition of Q = 0.024 m3/s: (a) Case Q3A0 (z/h = 0.3); (b) Case Q3A1 (z/h = 0.3); (c) Case Q3A0 (z/h = 0.7); (d) Case Q3A1 (z/h = 0.7); (e) Case Q3A0 (z/h = 0.9); and (f) Case Q3A1 (z/h = 0.9).
Figure 9.
Streamlines by depth under the condition of Q = 0.024 m3/s: (a) Case Q3A0 (z/h = 0.3); (b) Case Q3A1 (z/h = 0.3); (c) Case Q3A0 (z/h = 0.7); (d) Case Q3A1 (z/h = 0.7); (e) Case Q3A0 (z/h = 0.9); and (f) Case Q3A1 (z/h = 0.9).


Figure 10.
Streamlines on x–z plane under the condition of Q = 0.024 m3/s: (a) Case Q3A0 and (b) Case Q3A1.
Figure 10.
Streamlines on x–z plane under the condition of Q = 0.024 m3/s: (a) Case Q3A0 and (b) Case Q3A1.

Figure 11.
Velocity distributions behind the intake pipe at z/h = 0.9: (a) u-velocity (Q = 0.018 m3/s); (b) v-velocity (Q = 0.018 m3/s); (c) u-velocity (Q = 0.022 m3/s); (d) v-velocity (Q = 0.022 m3/s); (e) u-velocity (Q = 0.027 m3/s); and (f) v-velocity (Q = 0.027 m3/s).
Figure 11.
Velocity distributions behind the intake pipe at z/h = 0.9: (a) u-velocity (Q = 0.018 m3/s); (b) v-velocity (Q = 0.018 m3/s); (c) u-velocity (Q = 0.022 m3/s); (d) v-velocity (Q = 0.022 m3/s); (e) u-velocity (Q = 0.027 m3/s); and (f) v-velocity (Q = 0.027 m3/s).

Figure 12.
Vorticity distribution comparisons of the cases with and without the F-AVD: (a) Case Q3A0 (z/h = 0.7); (b) Case Q3A1 (z/h = 0.7); (c) Case Q3A0 (z/h = 0.9); and (d) Case Q3A1 (z/h = 0.9).
Figure 12.
Vorticity distribution comparisons of the cases with and without the F-AVD: (a) Case Q3A0 (z/h = 0.7); (b) Case Q3A1 (z/h = 0.7); (c) Case Q3A0 (z/h = 0.9); and (d) Case Q3A1 (z/h = 0.9).

Figure 13.
Comparisons of the vorticity distributions at z/h = 0.9: (a) Q = 0.018 m3/s; (b) Q = 0.022 m3/s; (c) Q = 0.024 m3/s; and (d) Q = 0.027 m3/s.
Figure 13.
Comparisons of the vorticity distributions at z/h = 0.9: (a) Q = 0.018 m3/s; (b) Q = 0.022 m3/s; (c) Q = 0.024 m3/s; and (d) Q = 0.027 m3/s.

Figure 14.
Mitigation of the surface vortex using the F-AVD.


Table 1.
Summary of experimental conditions. F-AVD—floating anti-vortex device; Q—flow rate; U—magnitude of inflow velocity; Fr—Froude number; h—water depth; ha—water depth in the approach channel.
Table 1.
Summary of experimental conditions. F-AVD—floating anti-vortex device; Q—flow rate; U—magnitude of inflow velocity; Fr—Froude number; h—water depth; ha—water depth in the approach channel.
| Case | F-AVD | Q (m3/s) | U (m/s) | Fr | h (m) | ha (m) |
|---|---|---|---|---|---|---|
| Q1A0 | w/o F-AVD | 0.018 | 0.40 | 0.43 | 0.34 | 0.09 |
| Q1A1 | w/F-AVD | |||||
| Q2A0 | w/o F-AVD | 0.022 | 0.49 | 0.52 | ||
| Q2A1 | w/F-AVD | |||||
| Q3A0 | w/o F-AVD | 0.024 | 0.53 | 0.57 | ||
| Q3A1 | w/F-AVD | |||||
| Q4A0 | w/o F-AVD | 0.026 | 0.60 | 0.64 | ||
| Q4A1 | w/F-AVD |
© 2018 by the authors. Licensee MDPI, Basel, Switzerland. This article is an open access article distributed under the terms and conditions of the Creative Commons Attribution (CC BY) license (http://creativecommons.org/licenses/by/4.0/).
Share and Cite
MDPI and ACS Style
Park, I.; Kim, H.-J.; Seong, H.; Rhee, D.S. Experimental Studies on Surface Vortex Mitigation Using the Floating Anti-Vortex Device in Sump Pumps. Water 2018, 10, 441. https://doi.org/10.3390/w10040441
AMA Style
Park I, Kim H-J, Seong H, Rhee DS. Experimental Studies on Surface Vortex Mitigation Using the Floating Anti-Vortex Device in Sump Pumps. Water. 2018; 10(4):441. https://doi.org/10.3390/w10040441
Chicago/Turabian StylePark, Inhwan, Hyung-Jun Kim, Hoje Seong, and Dong Sop Rhee. 2018. "Experimental Studies on Surface Vortex Mitigation Using the Floating Anti-Vortex Device in Sump Pumps" Water 10, no. 4: 441. https://doi.org/10.3390/w10040441
Note that from the first issue of 2016, this journal uses article numbers instead of page numbers. See further details here.