Geometrical Characterization of Sediment Deposits at the Confluence of Mountain Streams


Department of Civil Engineering and Architecture, University of Catania, Via Santa Sofia 64, 95125 Catania, Italy
*
Author to whom correspondence should be addressed.
Water 2018, 10(4), 401; https://doi.org/10.3390/w10040401
Submission received: 20 February 2018
/
Revised: 21 March 2018
/
Accepted: 26 March 2018
/
Published: 29 March 2018
(This article belongs to the Special Issue Erosion and Torrent Control)
Abstract
:Debris flow injections from tributaries into a main mountain stream generate deposits of sediments which, in turn, result in obstruction and eventual damming of the river section. This contribution presents the results of a series of flume experiments on the dynamics of these deposits, with reference to three different types of blockage: no blockage, partial blockage, and full blockage. Results show that the shape of the deposit is mainly controlled by the ratio between the debris flow discharge and the main river discharge. The experimental dataset is used to develop a deposit resilience stability index based on the shape of the deposit contour retrieved from photos taken from above. The proposed index is based on the invariant elliptic Fourier coefficients and the dimensionless transverse obstruction parameter. The elliptic Fourier coefficients give information on the symmetry of the deposit contour. High symmetry indicates more stable and resilient deposits. The proposed index is calibrated on the basis of the flume experiments and tested with field data. The results are quite promising and suggest that the index can be appropriate for a fast hazard assessment of multiple debris flow deposits at a regional scale.
1. Introduction
A typical effect of extreme rainfall events is the formation of multiple debris flow deposits along the main reach of the mountain stream [1,2,3], with a consequent increase in the hydraulic susceptibility of the surrounding areas [4,5]. The water impoundment that can form behind a debris flow deposit is a potential hazard for people and property. In other words, debris flow deposits can act as a dam whose failure may give rise to destructive flooding events. Prevention of these hazards requires a rapid assessment of the debris flow deposit stability and if possible, its resilience. The prediction of river damming by sediment deposits is still an open issue, due to the high number of variables involved which characterize both hillslope and river dynamics.
Various indexes have been proposed for the assessment debris dam formation, which rely on morphometric or physically-based approaches. The former, being determined from observations on specific field sites, are strongly dependent on the local environmental settings (i.e., channel width and slope) [6]. Physically-based approaches instead rely on small-scale flume experiments and provide information on the key mechanisms and variables involved in debris flow deposition [7,8]. Physically-based indexes usually present two weak points: (1) they are based on quantities that vary significantly during a given event (e.g., the main stream water discharge and the debris flow discharge) which can be known only in the presence of ad hoc field monitoring; and (2) threshold values discriminating the different stability classes are representative of the specific geographical area for which the indexes have been developed. On the other hand, considering the fact that debris flow deposits can form during a rainfall event in many different locations along the river network, a speedy tool for fast and effective assessment of stability of debris dam, to be applied over large areas for emergency response or for forecasting of hazard scenarios [9], would be particularly useful. Several documented cases of formed multiple debris flow deposits have been reported [10,11].
The aim of the present research is to propose a deposit resilience stability index to forecast hazard scenarios at regional scale by using aerial photos. Considering that the deposit shape is the final result of the interplay between the physical forces that drive debris flow dynamics and deposition, we based this index on the shape characteristics of the debris deposits. In particular, elliptical Fourier descriptor analysis has been applied to study the morphometry of the deposit contours. The standardizing procedure of the elliptical Fourier coefficients [12] is adopted in order to have a scale-invariant index applicable to both large and small mountain basins. The index has been calibrated on the basis of data provided by a systematic series of flume tests. Characteristic patterns are investigated in terms of the geometrical to distinguish the different types of blockage (i.e., no blockage, partial blockage, full blockage). Its performance is then evaluated by using field data of debris flow deposits formed after extreme rainfall events in the Sichuan province, China [10]. The shapes of these debris deposits have been determined from the analysis of aerial photos with sufficient resolution. The proposed deposit resilience index appears to robustly characterize the resilience of the observed debris deposits. It is important to observe that the proposed index is based only on the analysis of aerial photos. This overcame the difficulties related to the application of other morphometric indexes based on in situ survey of data (e.g., deposit width, length, height, and volume), especially when multiple debris flows are likely to occur in adjacent areas.
The paper is organized as follows. Section 2 introduces all material and methods adopted for the definition, calibration, and validation of the proposed index. In particular, we present the background on the shape analysis method useful for the definition of the index formulation, the experimental apparatus and procedure adopted for the calibration of the index, and finally the field data used for the validation. In Section 3 the experimental campaign with respect to the debris flow propagation at the channel confluence and the control parameters are described. The experimental evidences in terms of the deposits are shown in Section 4. The applications of the proposed stability index are provided in Section 5. A discussion on the proposed index formulation is presented in Section 6, while conclusions are given in Section 7.
2. Material and Methods
2.1. Background on the Shape Analysis Method
Fourier analysis can be easily used to quantitatively describe the geometric shape of a closed contour. In the past, this technique has been extensively applied in the biological and botanical fields [13]. The most common method is based on elliptic Fourier descriptors [12]. The object shape is first transformed through a chain code [14], which describes the contour as a sequence of x and y coordinates of points that are ordered clockwise starting from an arbitrary point. The obtained different chain-coded points are then interpolated linearly. The elliptic Fourier expansions of the coordinates of the contour are:
where k is the number of considered harmonics, j is the order of a given harmonic, and L is the outline perimeter. The Fourier coefficients , , , and of the j-th harmonic j are calculated as follows [12]:
where and are the modulus of the projection onto the x-axis and the y-axis of the segment between points i and i + 1 of the outline, while is the modulus of the segment between points i and i + 1 of the outline, computed along the curvilinear coordinate s. The terms and are constants and read:
The above defined Fourier coefficients can be divided in two groups which describe the symmetrical ( and ) and the asymmetrical ( and ) features of the investigated geometry as considered with respect to the principal axis ().
We refer the interested reader to [12] for a more detailed description of the methodology. Here we recall that the amplitude of the j-th harmonic is calculated as:
Because the coefficients of the elliptic Fourier descriptors are not invariant with respect to size, rotation, shift, and starting point of the chain code of a contour, they cannot be used for an object comparison of the shape of different objects [15]. In order to overcome this limitation, the Fourier coefficients are suitably modified as suggested by Kuhl and Giardina [12]. The standardized coefficients of the n-th harmonic , , , and are computed as:
where:
The standardizing procedure is based on the length and the direction of the major axis ellipse of the first harmonic. The standardization by using ensures the size invariance, whereas is needed to guarantee rotation invariance. Finally, is the phase shift of the radius vector of the first harmonic ellipse at the initial point of the close contour.
2.2. Experimental Apparatus and Procedure
The experimental apparatus consists of a lateral debris flow channel (with length 3 m, width 0.30 m and depth 0.30 m) connected downstream with a main channel (length 12 m, width 0.5 m, and depth 0.70 m) by means of a joint system allowing for different configurations of the lateral channel slope and the confluence angle (see Figure 1).
At the beginning of each experiment, the bed of the tributary channel is filled with a sediment layer of thickness 9 cm, made of gravel with diameter in the range 2–5 mm. A constant water discharge is imposed along the main channel, while the sediment layer along the tributary channel is saturated by applying a water discharge of 0.8 L/s. The debris flow is then generated at the upstream portion of the tributary channel by releasing a triggering water discharge equal to 3.8 L/s. Mature debris flow with the grains dispersed throughout the entire flow depth is reproduced [16]. This debris flow propagates downstream along the tributary and debouches in the main channel, finally depositing downstream of the confluence. The water flowing along the main channel progressively shapes the material deposited by the debris flow and the experiment is interrupted when the geometry of the deposit does not change anymore.
The dynamics of the debris flow generated in the tributary channel is monitored by two acoustic-level sensors (Pepperl & Fuchs model UC500, error smaller than 0.001 m) and by means of video records performed with two Sony cameras (frame per second, fps 100). The morphology of the sediment deposit is surveyed at the end of the experiment with a sampling interval of 2 cm along four sections located at an average longitudinal distance of 10 cm from each other.
2.3. Field Data
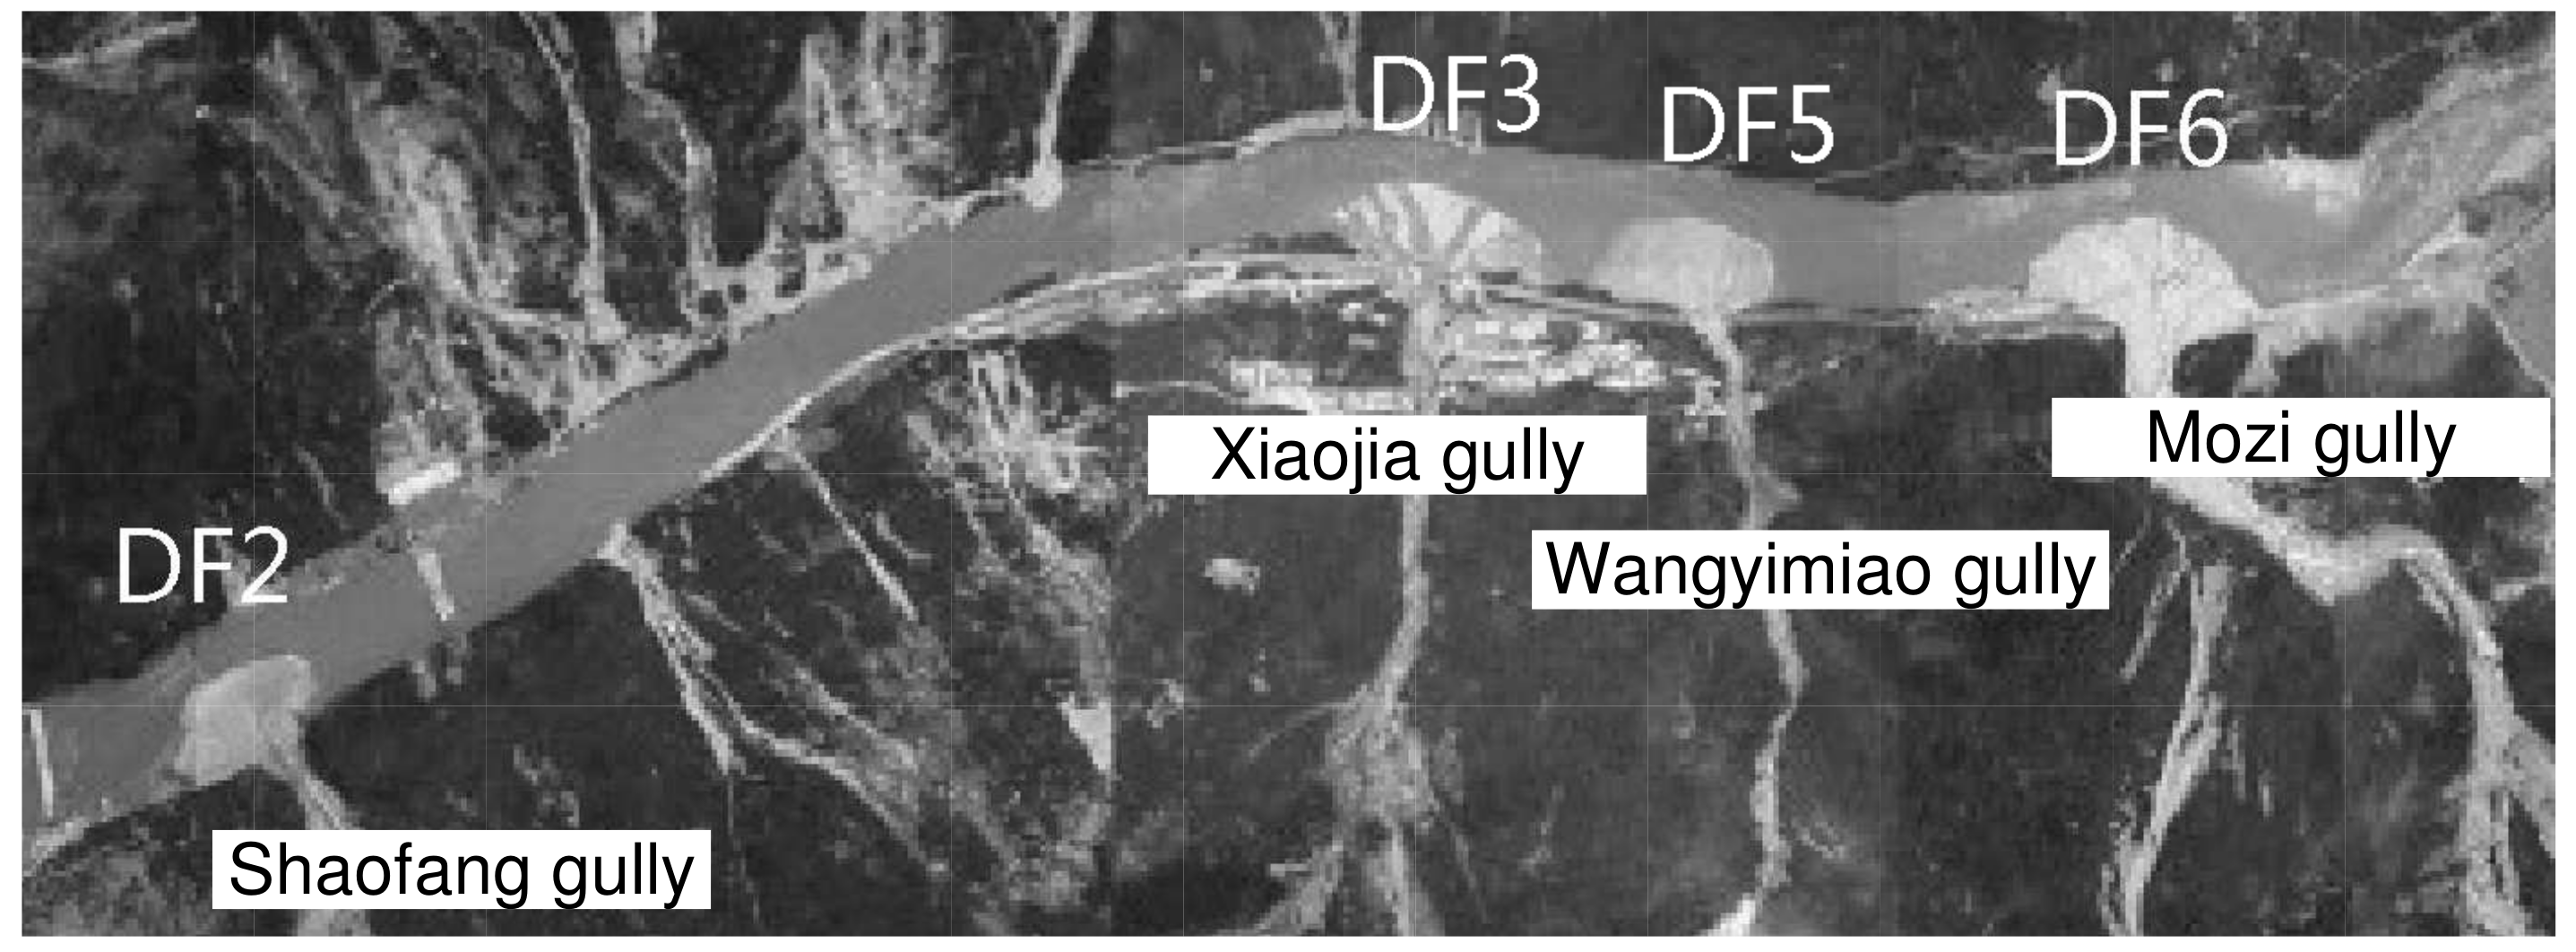
The field data used later in Section 5 for testing the proposed index are taken from the work of Tang et al. [10]. They are related to the field debris flows triggered by the 14 August 2010 rainfall that hit the Sichuan province (China), causing a series of debris dams along the Minjiang river [10]. Data concerning the deposit shapes are obtained from an aerial photo acquired on 15 August 2010 (Figure 9c of Tang et al. [10]), which has been here re-elaborated and presented in Figure 2. The four debris deposits along the Minjiang river were generated by the injection of the debris flows respectively coming from four lateral tributaries: the Shaofang gully (DF2), the Xiaojia gully (DF3), the Wangyimiao gully (DF5), and the Mozi gully (DF6). Table 1 reports the field data on the obstruction configuration where the nomenclature follows that adopted in Tang et al. [10].
3. Experiments
A set of 10 experiments has been performed in order to analyze the geometry of the sediment deposits formed in the main channel. The experiments differ in terms of the debris flow discharge delivered by the debris flow channel, of the confluence angle , and of the ratio between the dynamics force acting at the confluence, measured by the ratio of debris flow discharge and water discharge . The debris flow discharge is essentially controlled by the tributary slope [17] and the triggering water discharge, . Specifically, two slope configurations are investigated ( and ); the resulting debris flows were characterized by average debris flow depths of 0.04 m and 0.06 m, average propagation velocity of 0.6 m/s and 0.5 m/s, and average discharge of of 7 L/s and 9 L/s, respectively. The flow depth initially measured along the main channel is about 8 mm for all the water discharge configurations investigated. These data are determined by the analysis on the image acquired on the lateral side of the tributary channel where the debris flow is formed. Table 2 reports the relevant geometrical and hydraulic parameters, i.e., the main channel water discharge , the confluence angle , and the debris flow discharge along the tributary.
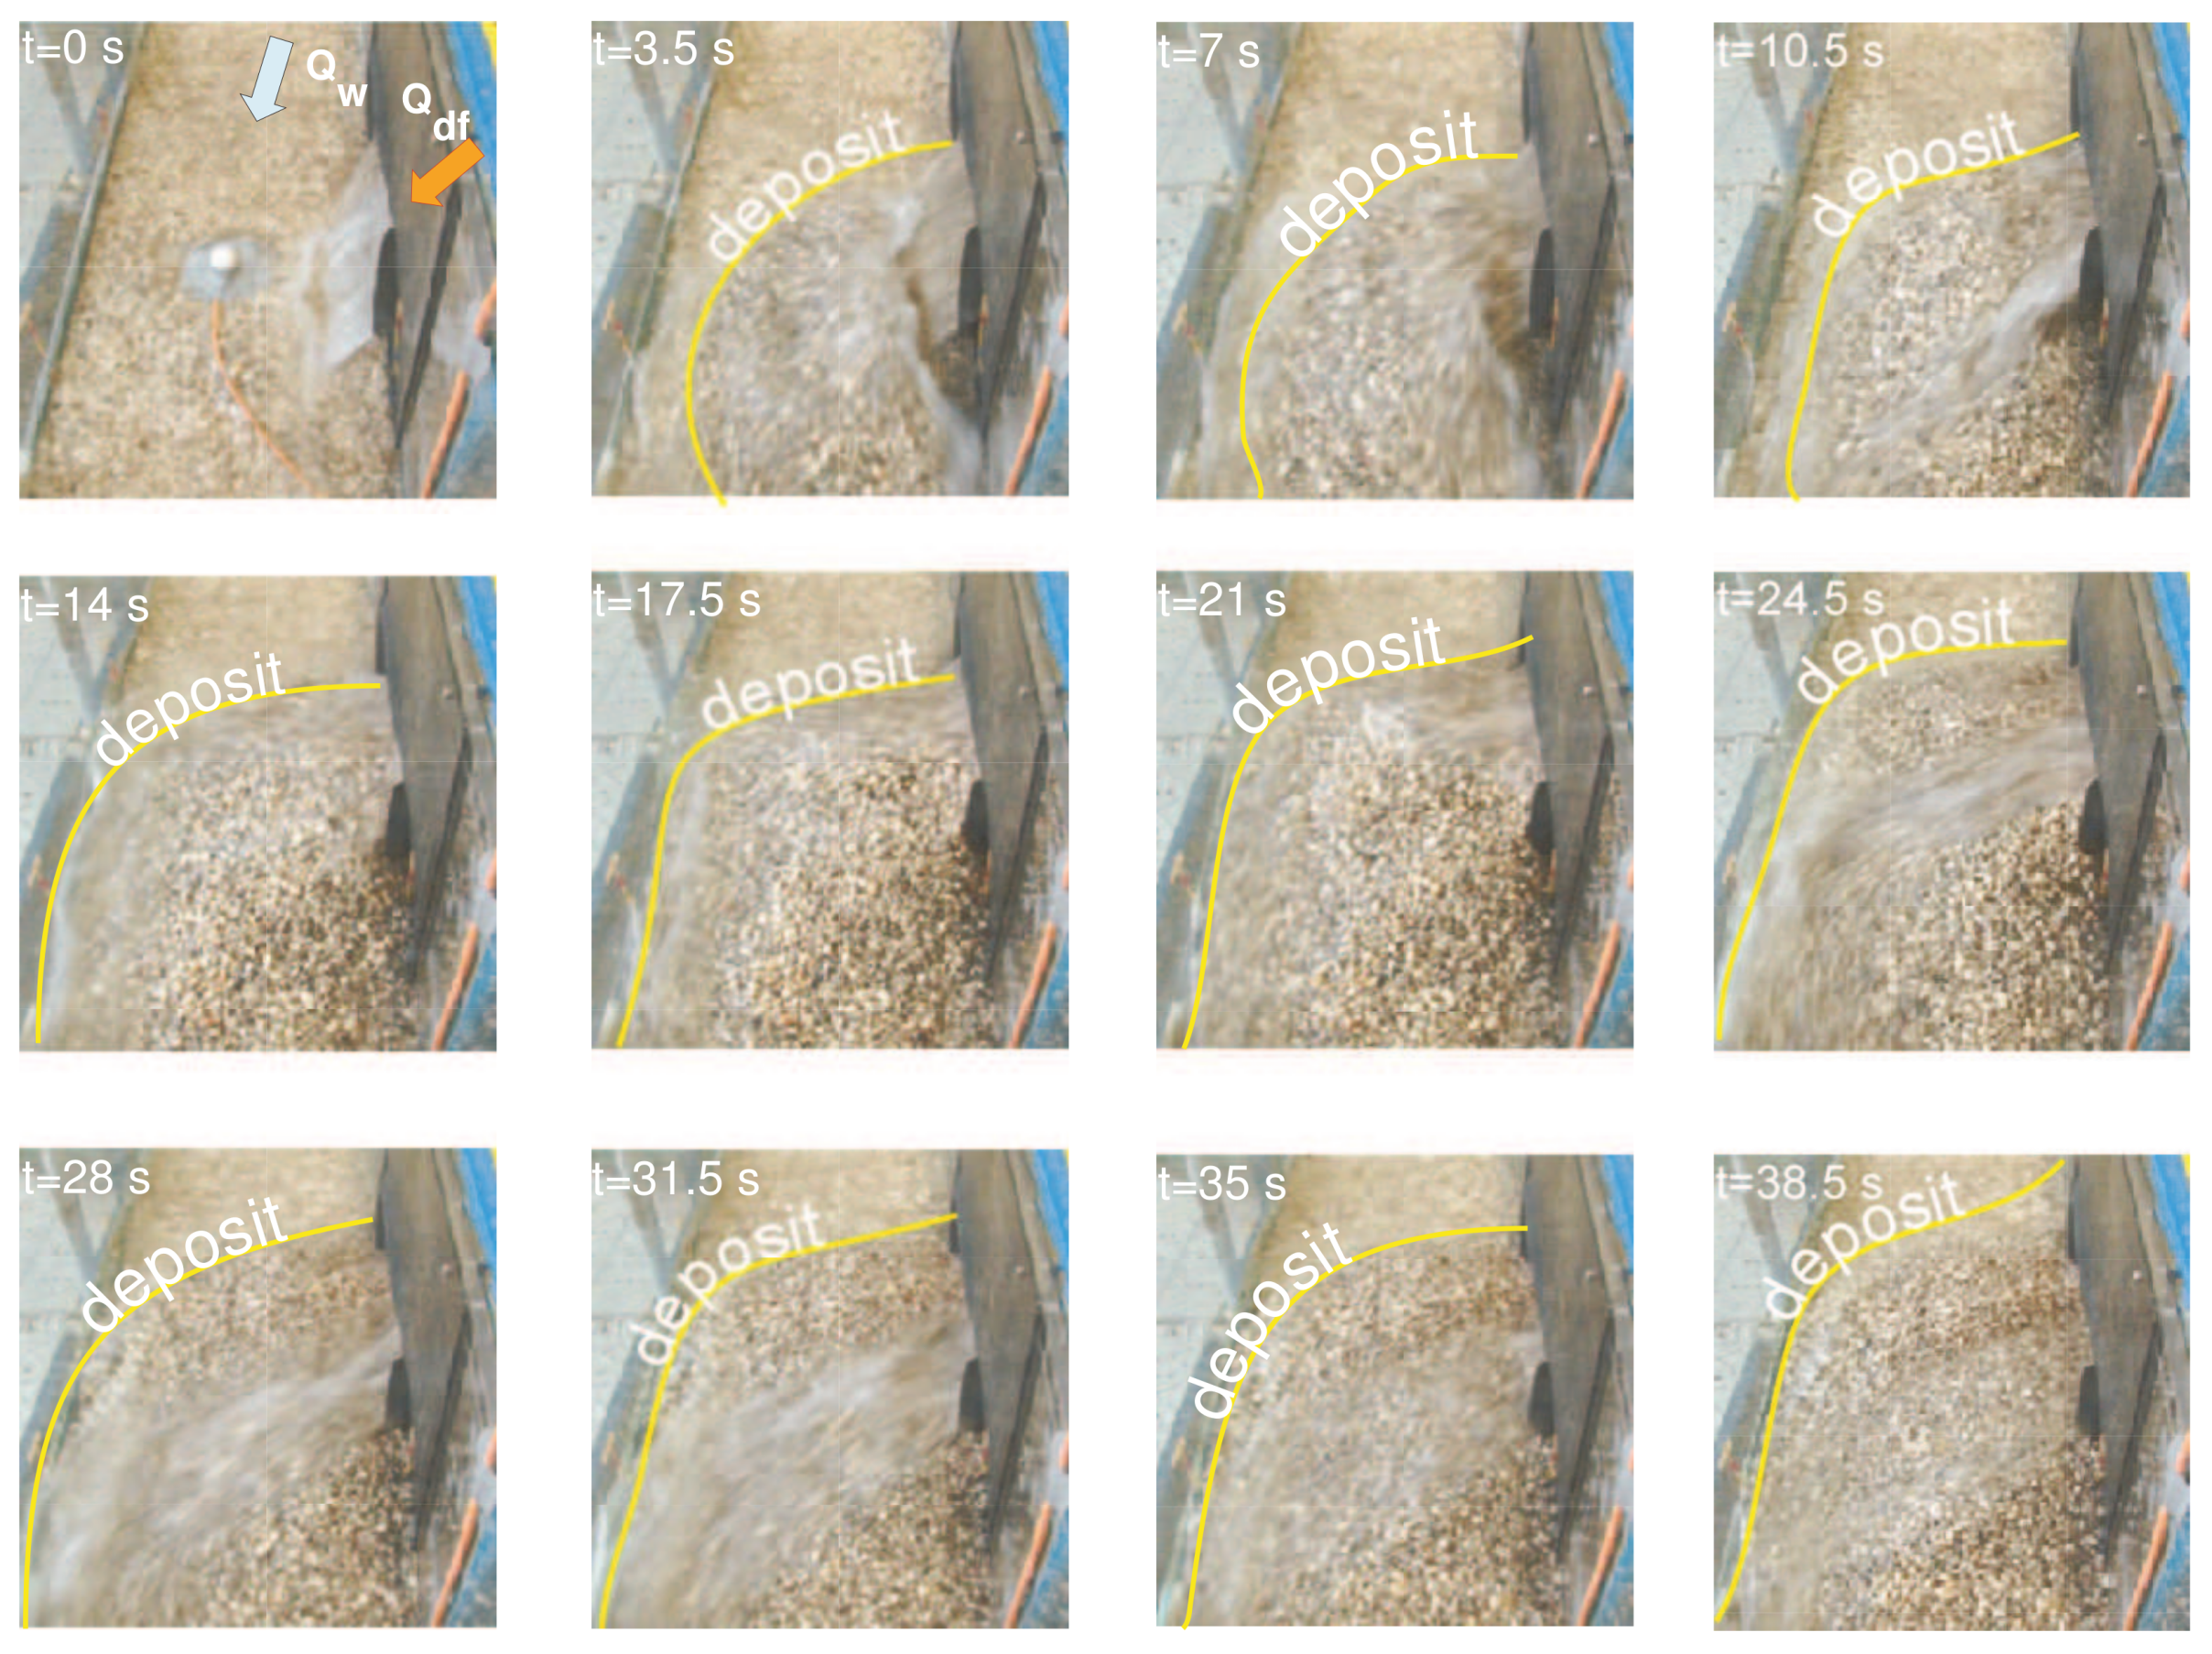
Figure 3 shows the typical temporal evolution of the deposit formation observed during a run. At the beginning (t = 0 s) the water flow saturation coming from the tributary channel clearly appears. When the debris flow is generated, the tributary channel starts to debouch into the main channel (t = 3.5 s), and the sediment deposit increases progressively in size until about t = 24.5 s. During this phase, the deposit shape is the result of the interplay of the dynamic actions exercised at the confluence by the debris flow discharge and the main channel water flow , depending on the confluence angle. Later on, the deposit is reworked by the water flow in the main channel and, finally, a stable configuration is reached.
Referring to the action of the main channel water flow, different morphological conditions can be attained. Firstly, the sediment delivered by the stony debris flow can be washed out completely and the main channel returns to its initial condition (no blockage). Secondly, the deposit is partially eroded until a stable configuration is reached (partial blockage). Thirdly an impoundment lake forms upstream of the sediment deposited by the debris flow (full blockage).
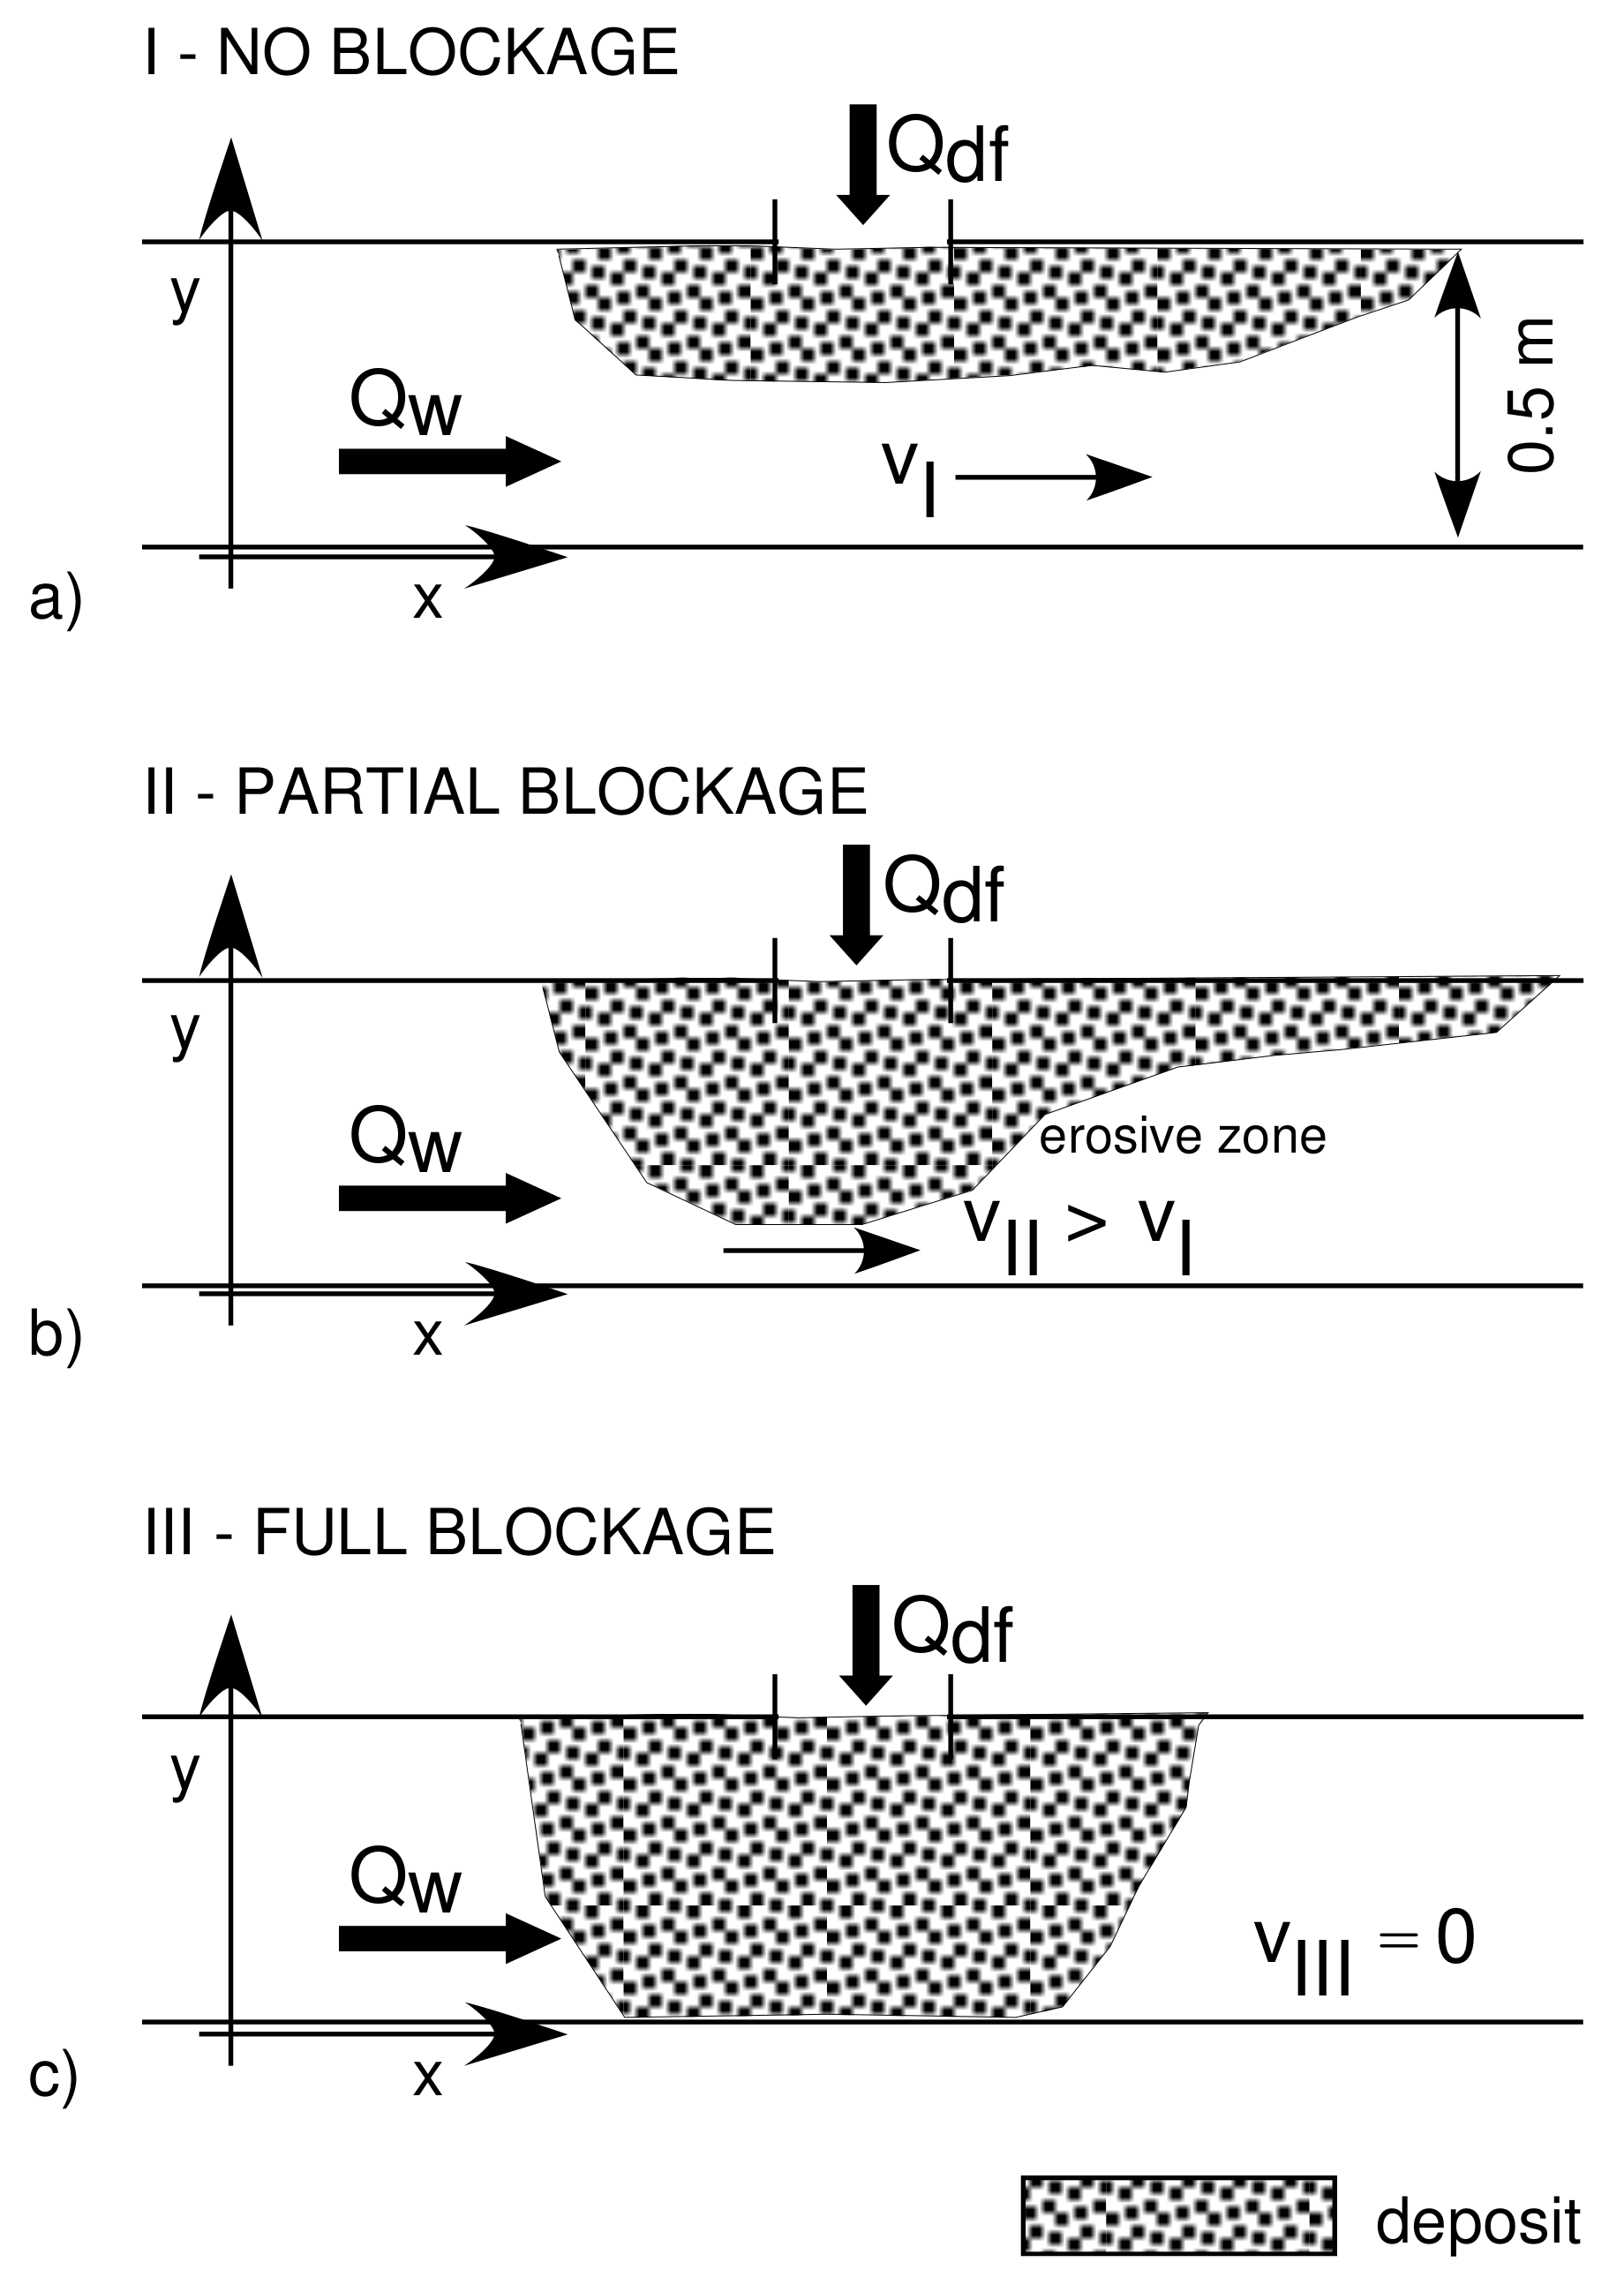
Figure 4 reports the sketches of the three different deposit configurations observed in the tests. In particular, no blockage is assumed to occur when the deposit has a maximum width less than of the main channel width (Figure 4a); partial blockage is assumed when the deposit has a width of between and of the main channel width (Figure 4b); full blockage occurs when the deposit occupies the entire main channel section (Figure 4c). In the case of no blockage, the water discharge flows in the main channel section with a velocity that is slightly greater than the velocity in the absence of sediment deposit, while the velocity increases significantly in the case of partial blockage , especially in correspondence of the maximum obstructed section. There the reduction of the hydraulic section is responsible for the increase of the water flow velocity and, consequently, for the formation of an erosive zone located immediately downstream of the deposit, which assumes an elongated shape along the downstream direction. In case of full blockage condition, a lake instead forms upstream of the deposit. Therefore no flow ( = 0) is observed downstream of the deposit section.
4. Experimental Results
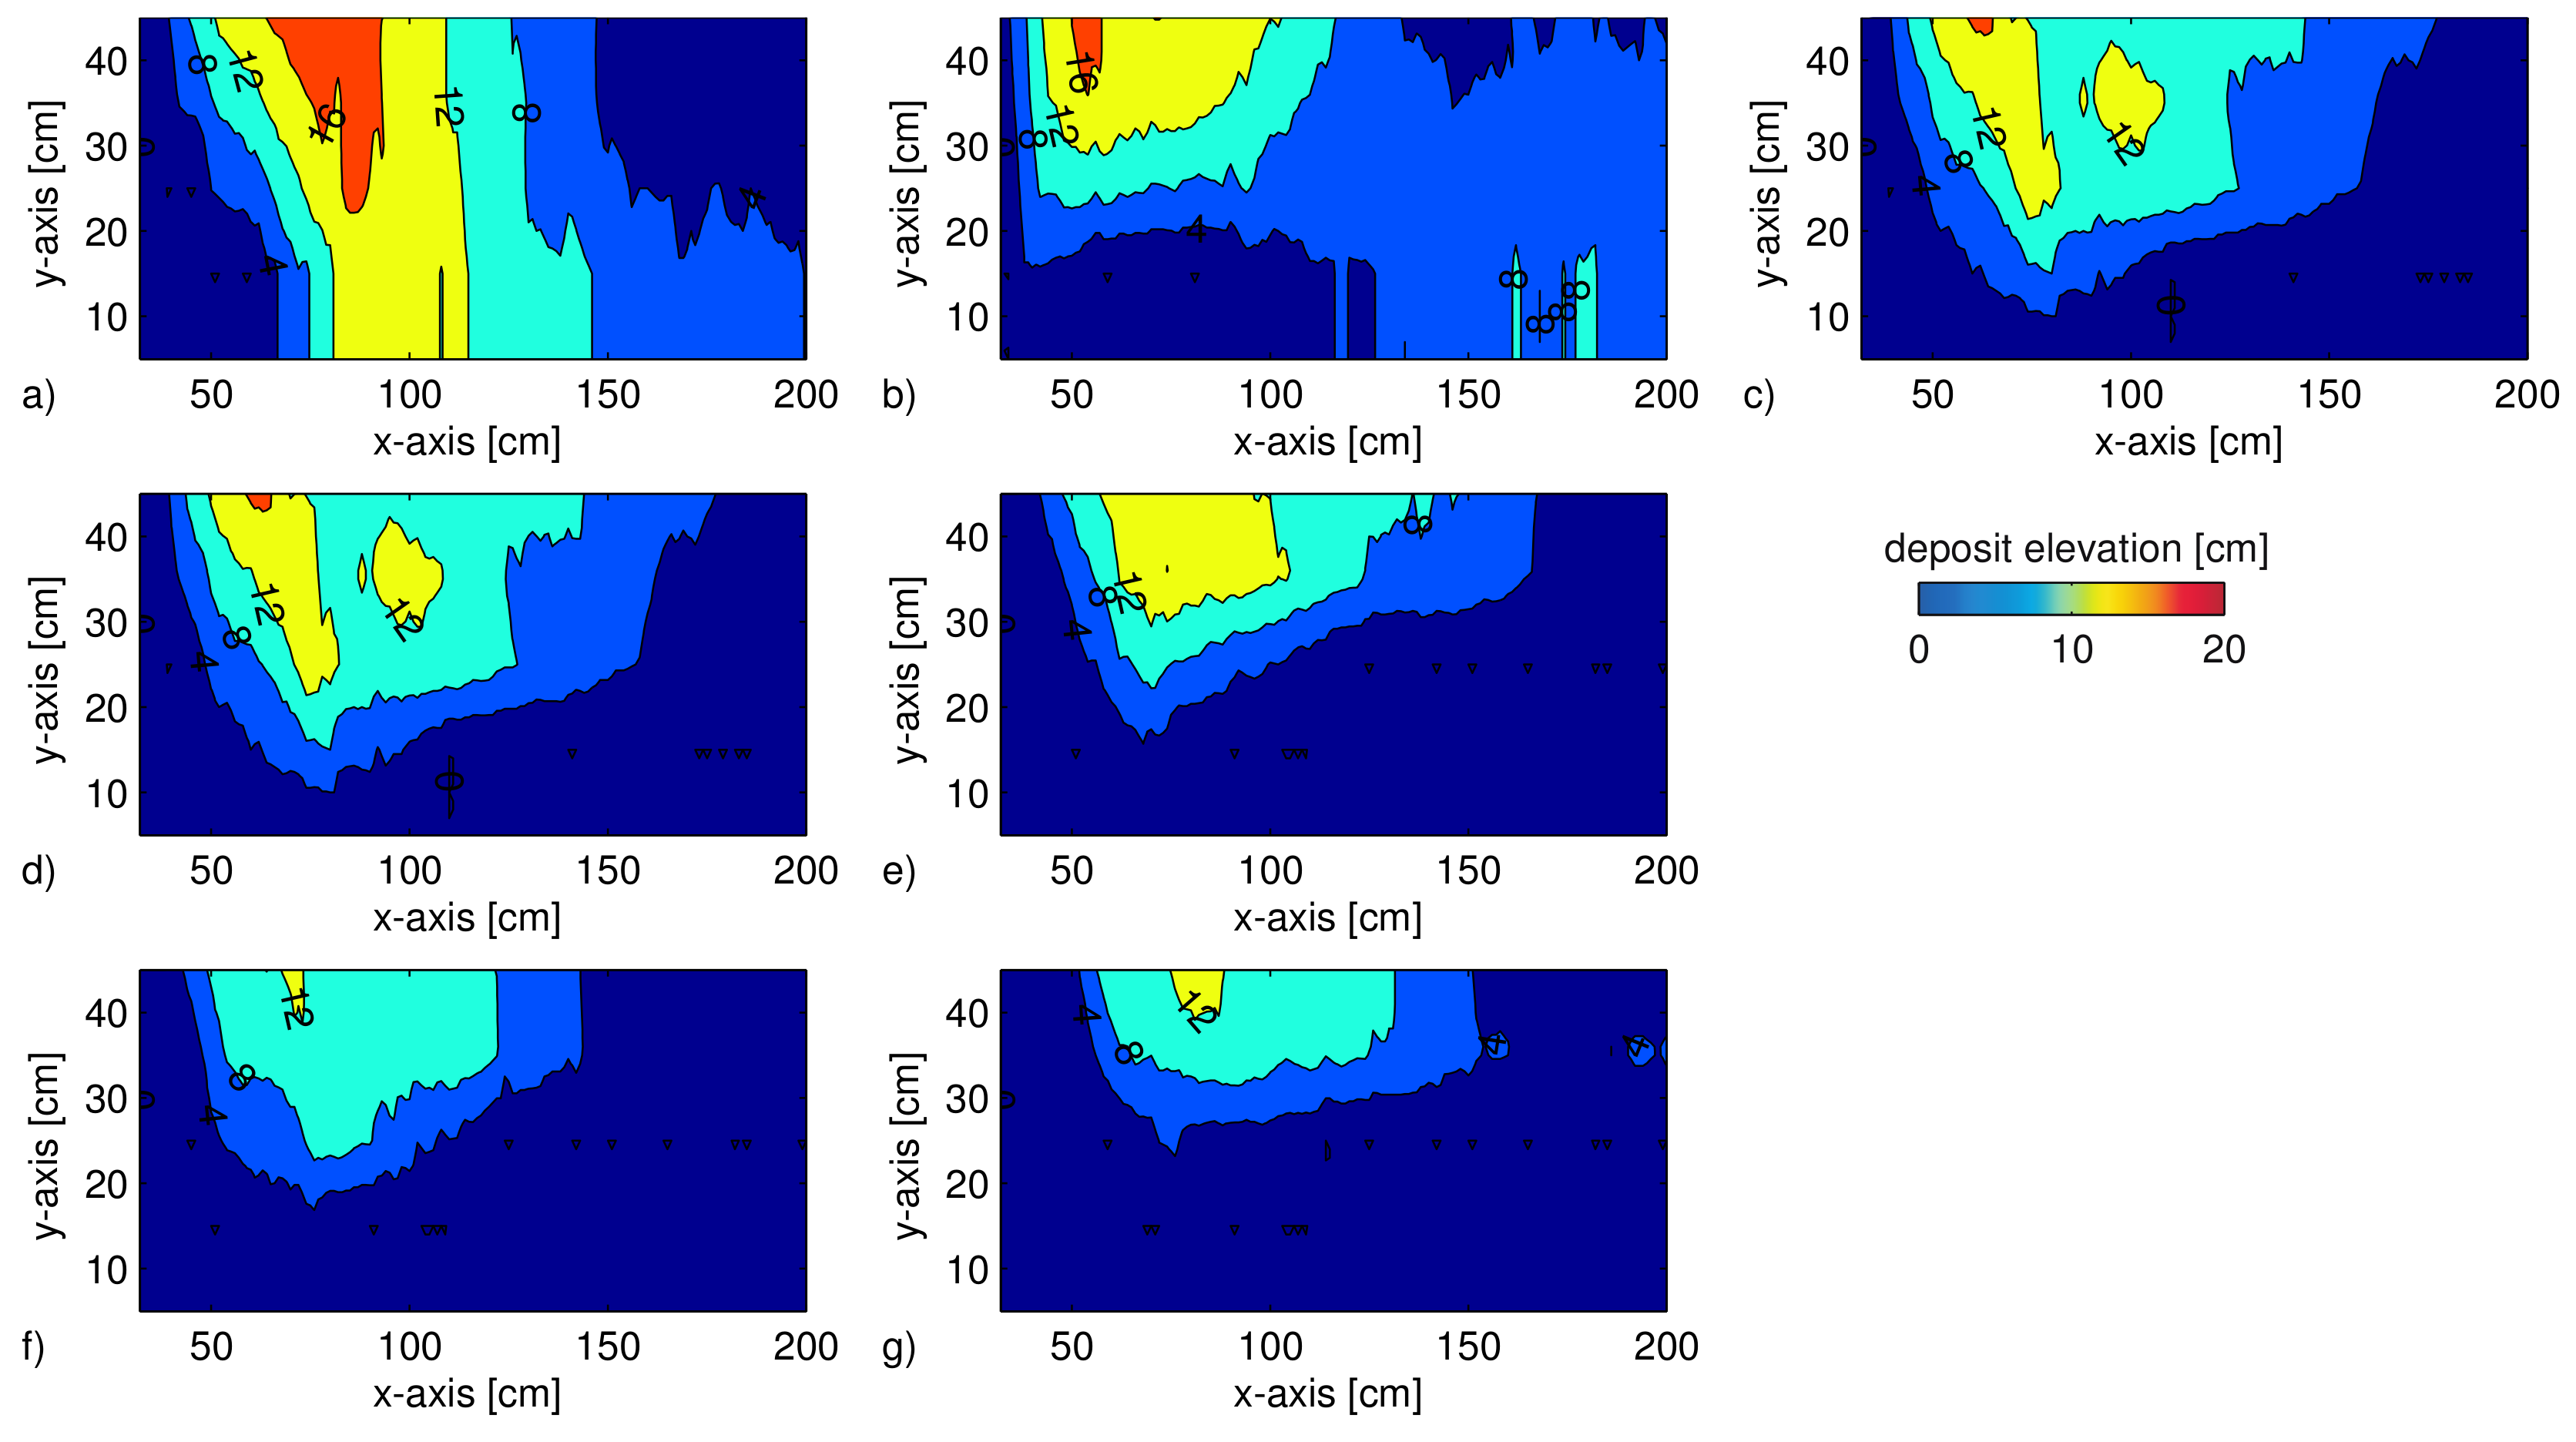
The analysis of the deposit geometry and of the degree of obstruction experienced by the main channel is based on the analysis of the planar displacement of the sediment along the main channel. The deposit configurations acquired at the end of experiments shown in Figure 5 give an overview of the influence exerted on the deposit shape by varying the water discharge, the angle of confluence, and the debris flow discharge.
Figure 5a–c shows the top view of deposits surveyed at the end of experiments carried out with a debris flow discharge of 9 L/s, a confluence angle of , and different water discharges in the main channel, yielding decreasing values of the ratio .
For 4.5 (test 8, Figure 5a) the main channel resulted totally obstructed and an impoundment formed upstream of the debris flow dam. A semi-blockage of the main channel section is observed for 3.0 (test 11, Figure 5b), owing to the partial erosion of the dam deposit near the main channel bank opposite the confluence. Finally, for 2.0 (test 1, Figure 5c) no dam forms. Figure 5d,e shows the top view of the deposits formed for given values of the debris flow discharge (7 L/s) and the water discharge along the main channel (4.5 L/s), but different confluence angles. The confluence angle turns out to influence the spatial distribution of the sediment deposit. In particular, for a perpendicular debris flow injection (, test 6, Figure 5d) the deposit tends to distribute almost symmetrically upstream and downstream of the confluence, distributing more easily the sediment across the main channel section and, hence, causing a greater obstruction. Decreasing the confluence angle (, test 3, Figure 5e) implies that the sediment deposit tends to elongate in the downstream direction, favoring the washout of the sediment and resulting in a lower degree of obstruction of the main channel.
In general, the confluence angle is responsible for a different planar displacement of the deposit along the main channel. An increase in terms of the debris flow discharge results in a major obstruction of the transverse section of the hydraulic channel, while the shape characteristics remain almost equal. Therefore, it is the ratio that mainly controls the degree of obstruction of the main channel.
Table 3 presents the results in terms of the main channel constriction due to the sediment deposit in dimensionless form and then it reports the blockage condition based on the previous classification and the maximum deposit depth.
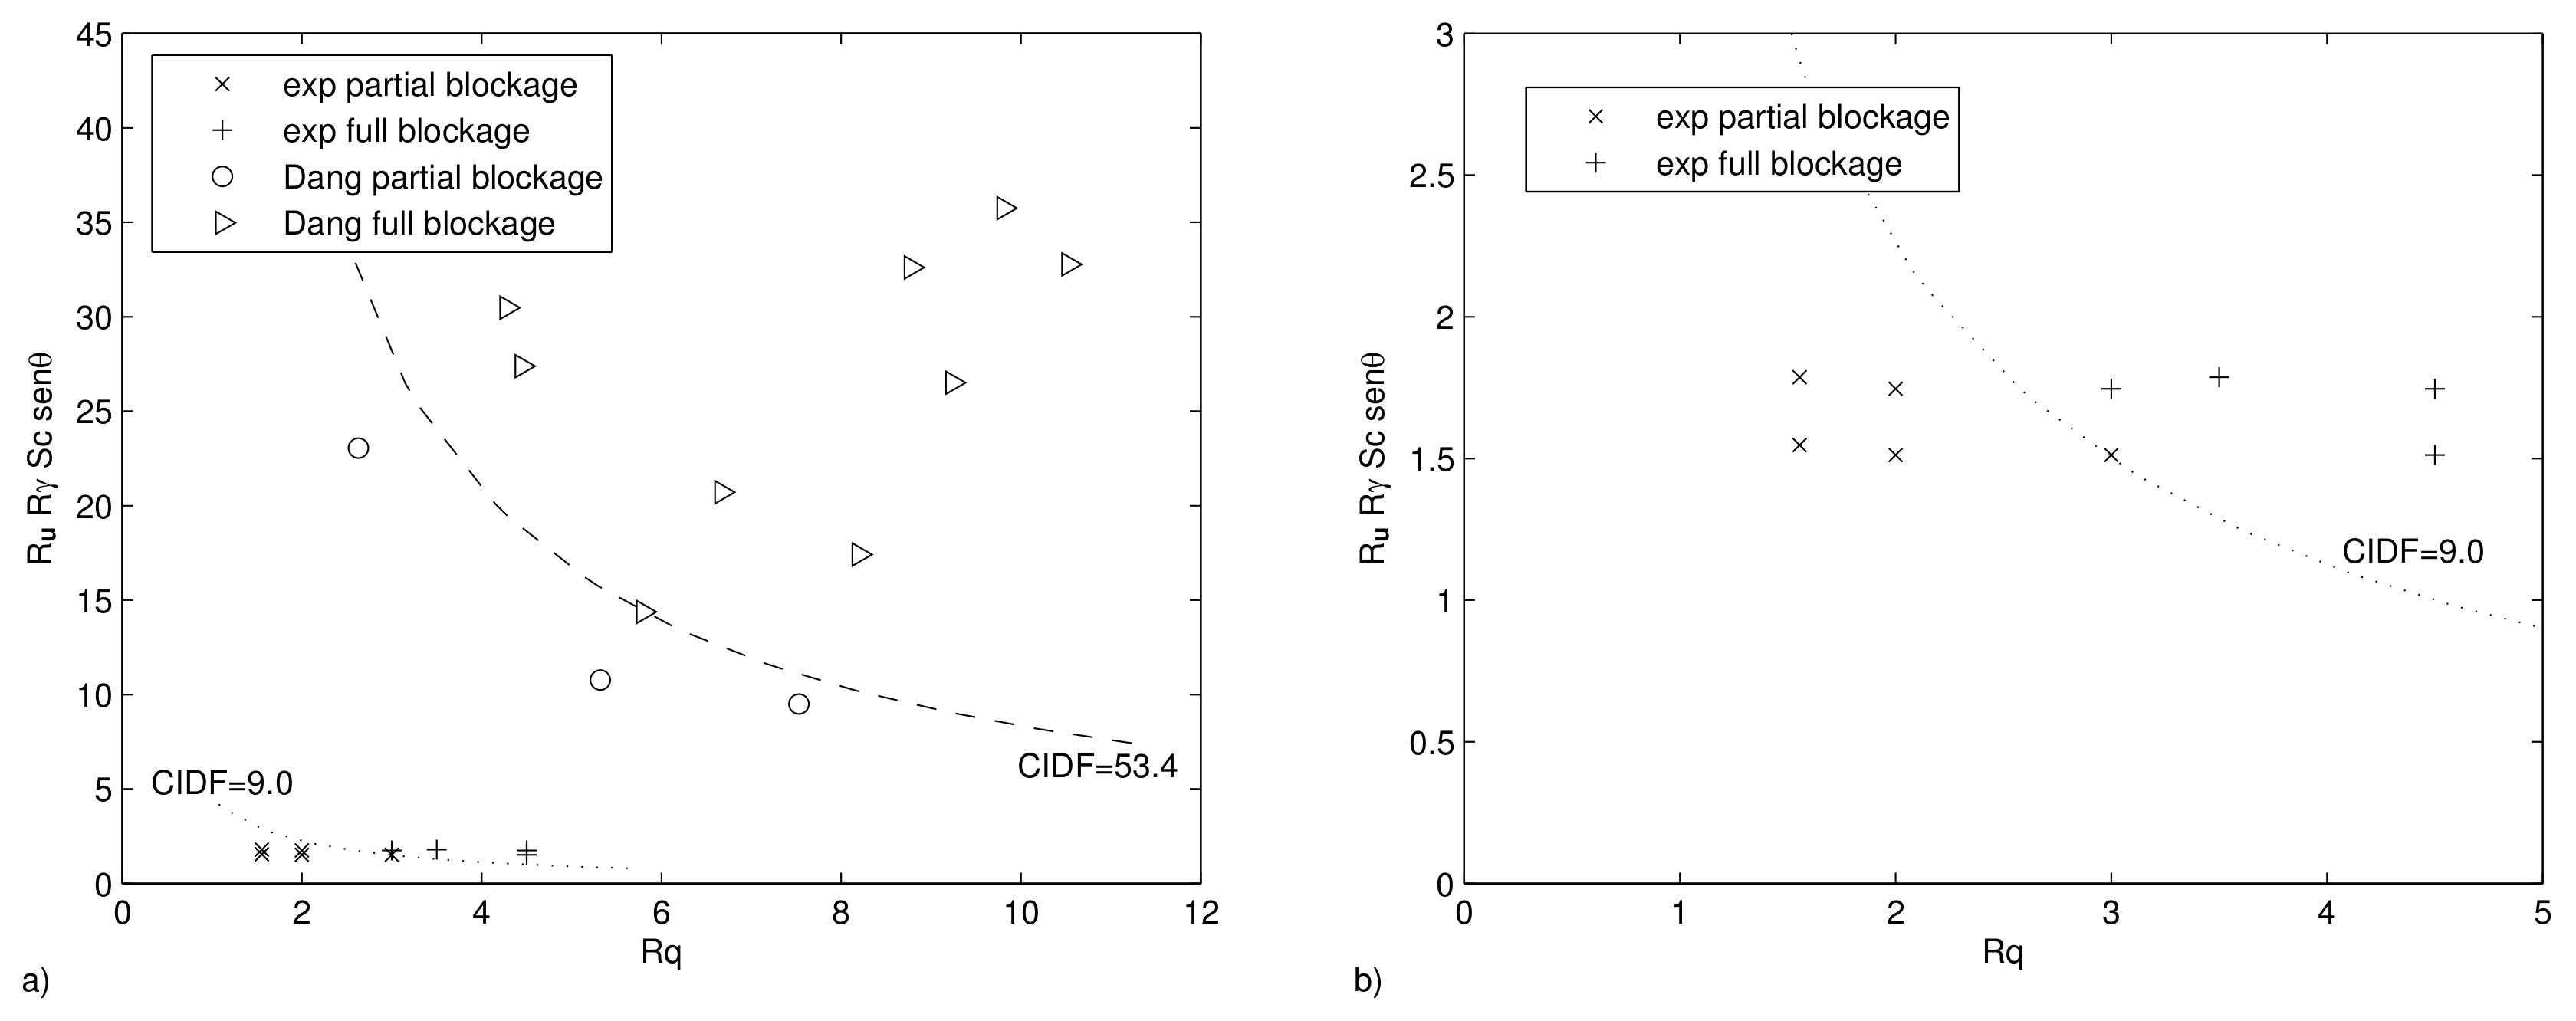
According to Dang et al. [8] the parameters which influence the degree of channel obstruction are the ratio of debris flow discharge to river discharge (discharge ratio ); the ratio between debris flow velocity and river flow velocity (velocity ratio ); the bulk density ratio between tributary flow and river flow (); the sorting coefficient () of the debris sediment; and the confluence angle . These parameters are combined by Dang et al. [8] in the overall index:
In the experiments carried out by Dang et al. [8], focusing on muddy debris flows, a partial blockage of the main river section occurred for , with the water flowing at one side of the main channel section. For a partial blockage of the main river still occurred, but with the flow over-passing the deposited sediments. Finally, a complete blockage of the river section was observed for . Figure 6a shows the index evaluated for both the experimental data here presented and the experimental data of Dang et al. [8]. The threshold values of the index indicated in Figure 6a with dashed lines are the limiting conditions for partial river obstruction individuated respectively for the experimental campaign by Dang et al. [8] involving fine material deposits () and for the presented experimental campaign involving gravel deposits (). Although the index derives from physically-based considerations, it does not show a limiting threshold range with general validity. It varies depending on the material adopted in the experiments (i.e., fine sand or gravel) and therefore it needs to be calibrated before application. Indeed, the threshold for partial blocking is here opportunely calibrated for the experimental campaign involving gravel deposits. Results are shown in detail in Figure 6b.
5. The Proposed Index: Application
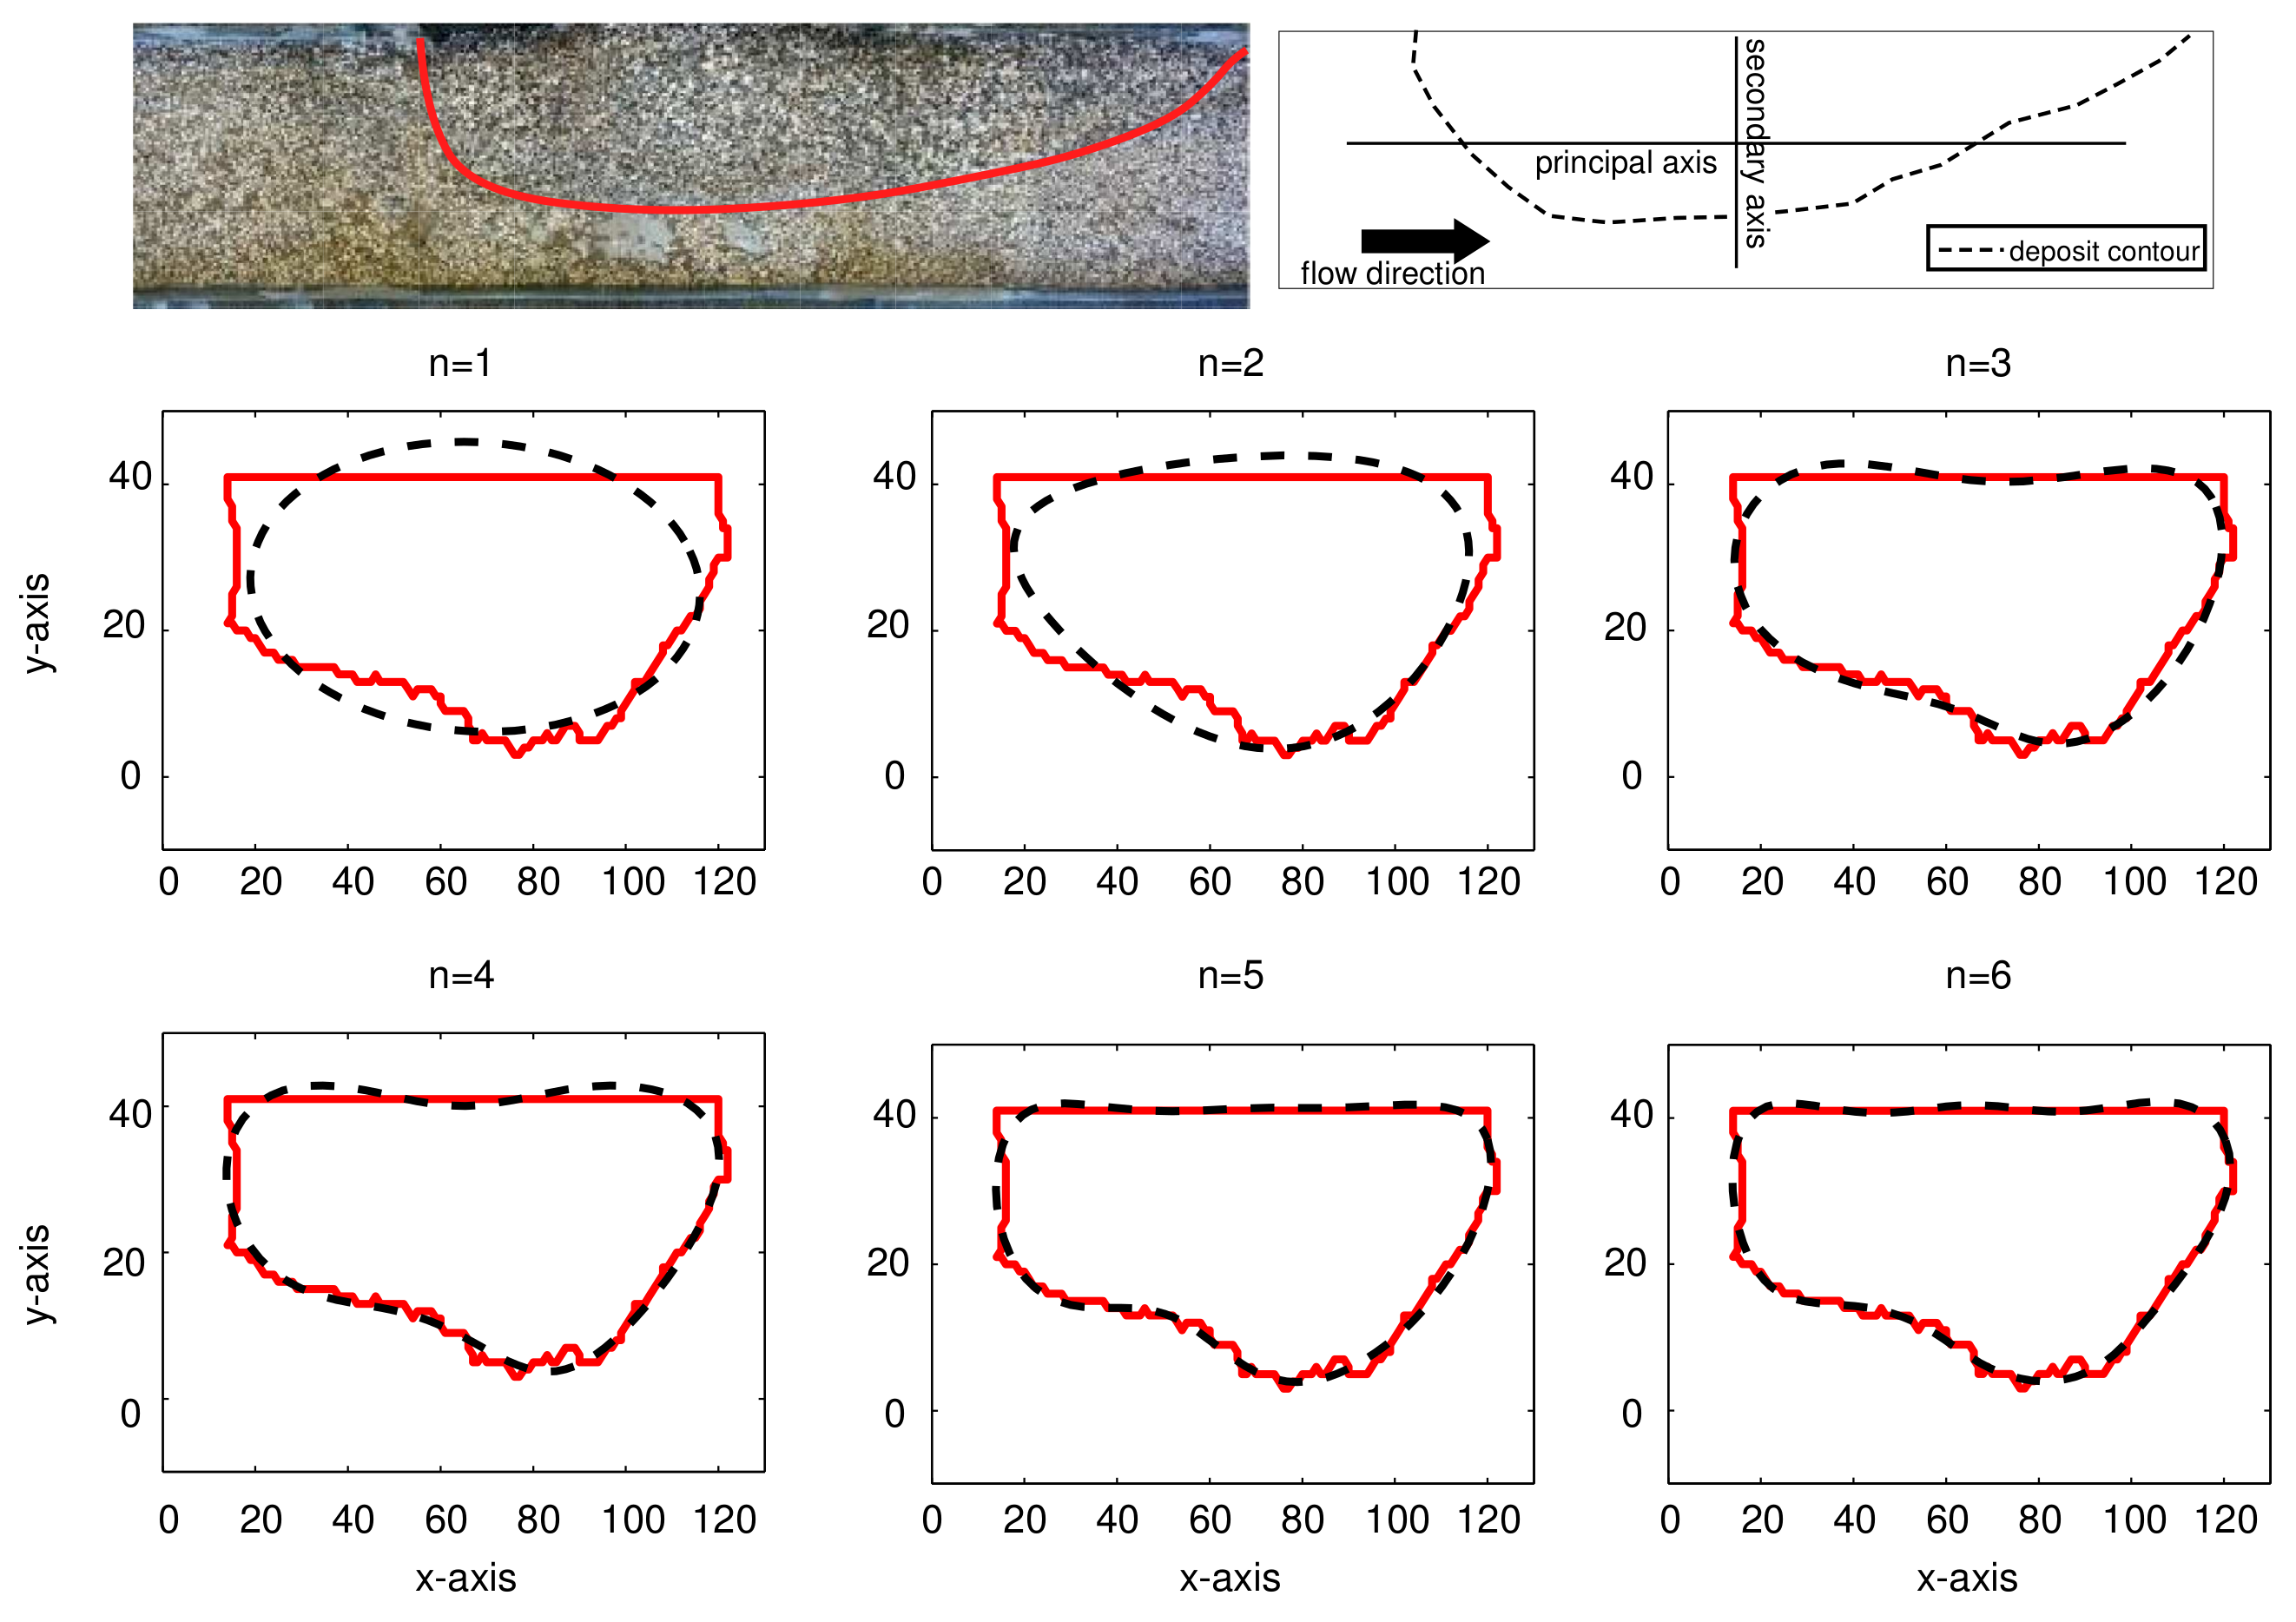
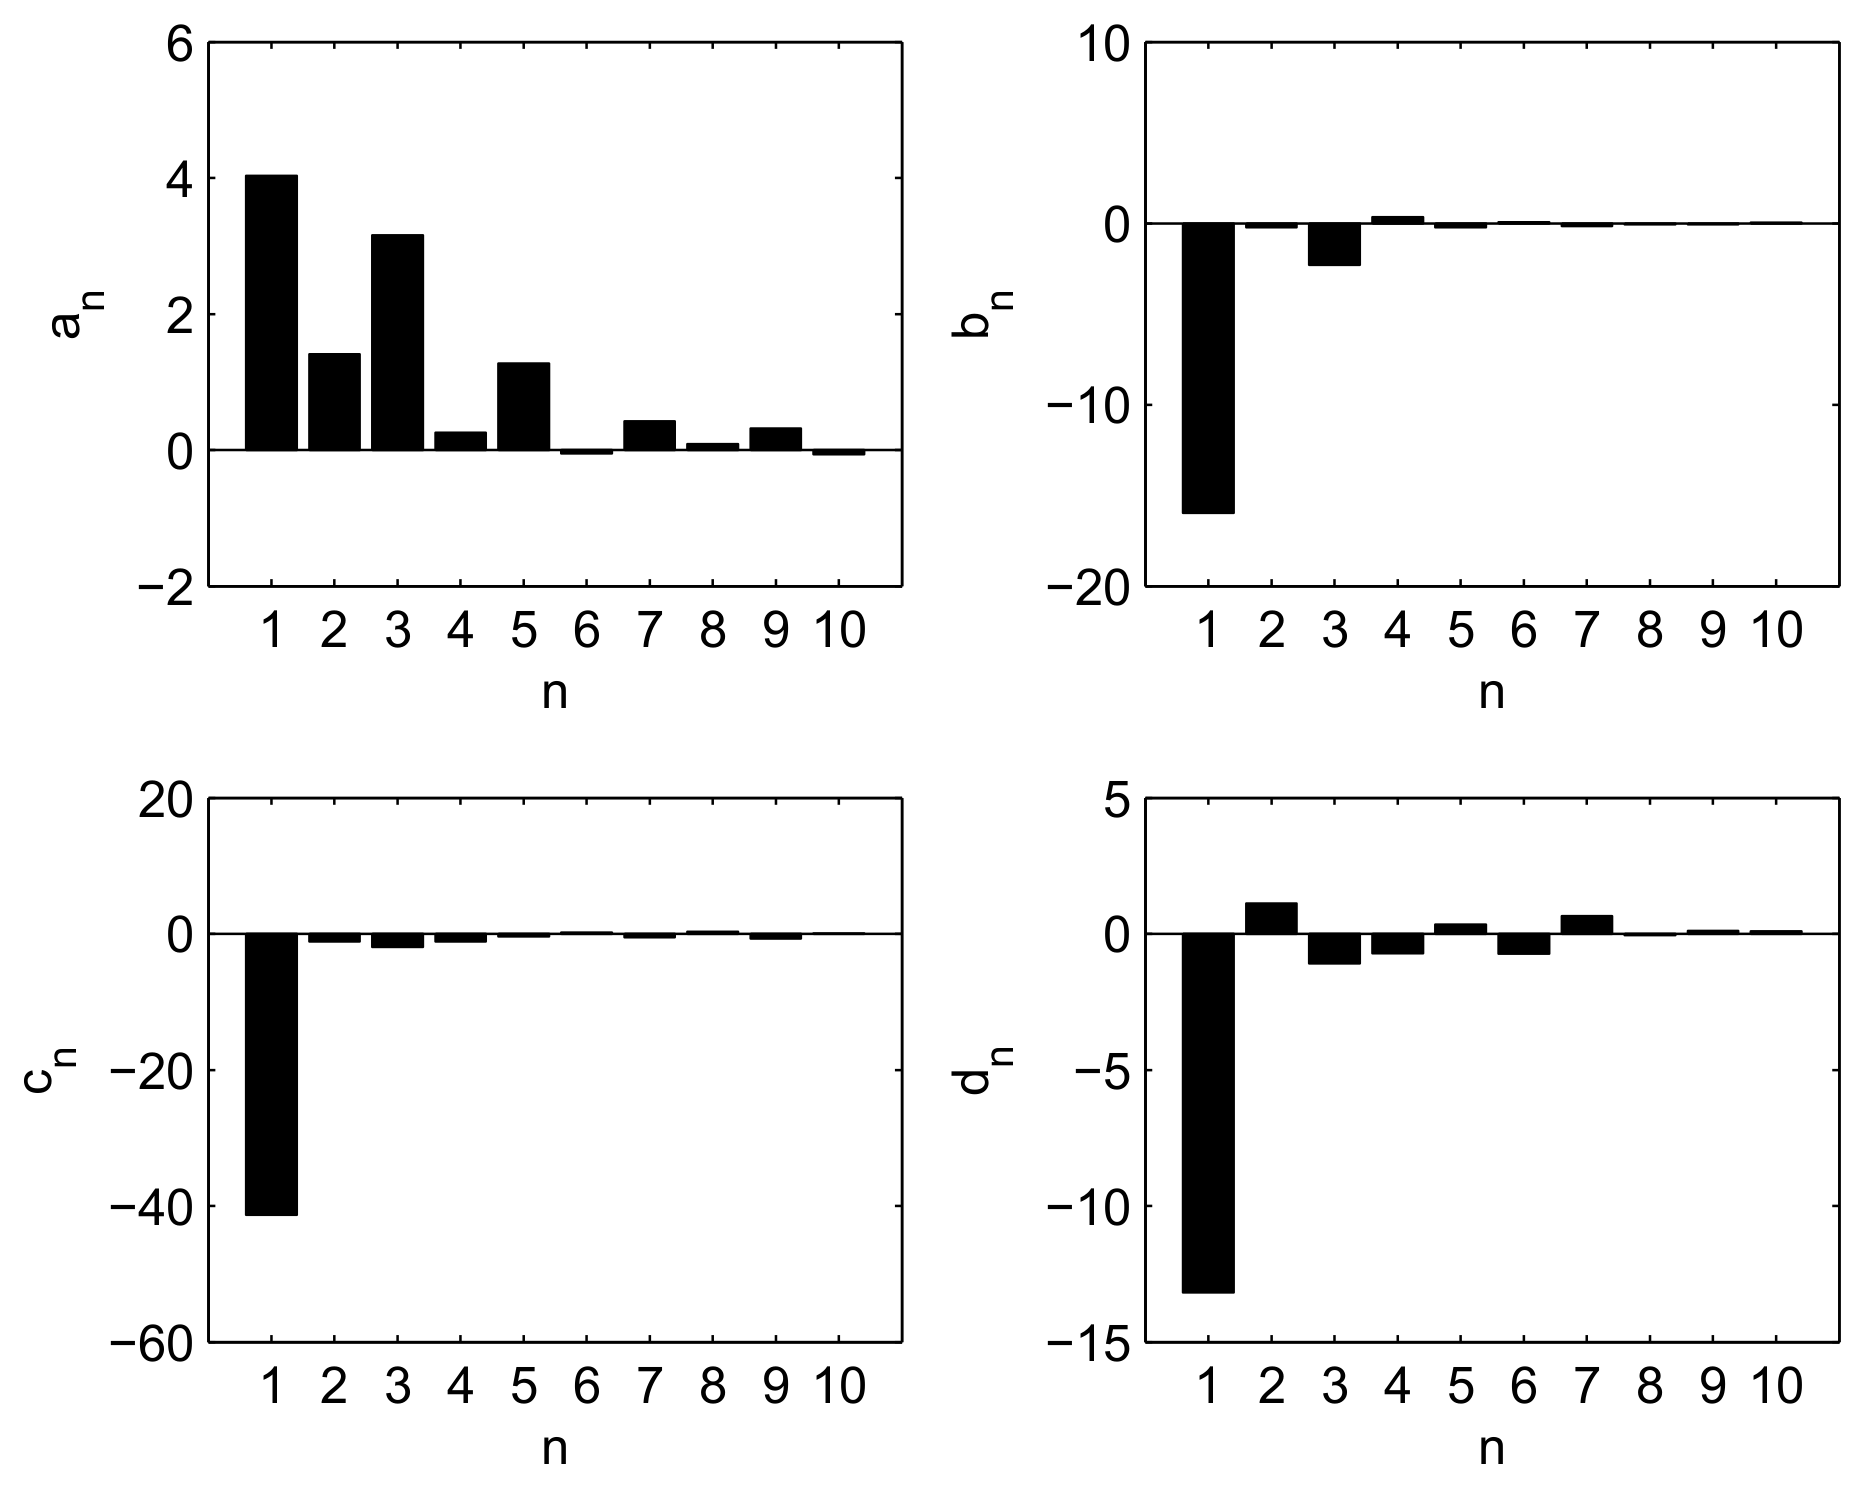
The shape analysis described in Section 2 is here applied to characterize the shape of each deposit observed in the experiments carried out. The top view of the close contour of the deposit characterized by elevation higher than 5.5 cm (i.e., emerged with respect to the water level of the main channel flow) is considered. The shapes of the contours are satisfactorily described by using three elliptic Fourier harmonics (Figure 7). Successive harmonics describe progressively finer details of the contour, adding no further information about the degree of blockage of the main channel. Figure 8 shows an histogram plot of the elliptic Fourier coefficients, which confirm that the first three harmonics well capture the main features of the deposit shape.
In order to compare objectively different shapes, these coefficients have been standardized according to the procedure suggested by Kuhl and Giardina [12] based on the ellipse of the first harmonic. These normalized coefficients provide information about the symmetrical and asymmetrical properties of the considered contour with respect to the main ellipse axes (Figure 7). We propose using the normalized Fourier coefficients to derive an index that measures the resilience of the debris flow deposit to the erosive action of the main channel flow. This index is defined as:
with the degree of obstruction , the maximum extension of the deposit along the direction perpendicular to the main river flow, and B the width of the main channel. Figure 9 shows the deposit resilience index as a function of obstruction ratio for the experimental data and for the field data described in Section 2.2. The plot shows that the different types of blockage are well described by the proposed index (dashed lines in Figure 9) that captures the main morphometric features of the deposits. Note that for similar values of the degree of obstruction (), the resilience of the deposit to erosion by the main channel flow assessed simply using the shape of the deposit yields similar values to the resilience index for both laboratory and field data. In the case that all required input data are available, this index can then be used in conjunction with the index to evaluate the stability of a given debris flow deposit or, in absence of the hydraulic data, to quickly estimate the possible resilience of the deposit to water erosion.
6. Discussion
The experimental tests presented in the previous section give useful information for the identification of the deposit shape patterns in the presence of different type of blockages (see Section 3 and Section 4). Three different type of blockage conditions have been investigated: no blockage, partial blockage, and full blockage (see Figure 4). Since the shape is the result of the interplay between the physical forces that drive debris flow dynamics and deposition phenomena, different deposit contour shapes are identified from the analysis of the experimental results (see Figure 5). Analyzing the case of full blockage, which represents the higher stable condition and the more resilient configuration, we observe that the deposit shape is characterized by high symmetry both along the principal axis and the secondary axis of the contour (for axes definitions see Figure 7). Sediments of the deposit are equally distributed along the transverse hydraulic section (symmetry along the principal axis) and are distributed equally upstream and downstream of the confluence section (symmetry along the secondary axis). The no-blockage configuration exhibits opposite features in terms of stability and resilience of the deposit. In such a case, the water discharge flowing along the main channel is able to erode the deposit, modeling it until the deposit shape appears similar to a strip of sediments elongated downstream. The contour shape of the no-blockage configuration is thus characterized by a high symmetry along the principal axis. The two longitudinal components describing the deposit shape are parallel to each other, while the downstream elongation caused by the erosive action of the water discharge is responsible for an absence of symmetry in the secondary axis. The partial blockage condition is an intermediate condition between the previous ones, usually characterized by different degree of symmetry in relation to the higher or lower degrees of stability and resilience. The partial blockage deposit contour shows a shape similar to a right-angled triangle, where the right-angled side represents the upstream zone of the deposit and the hypotenuse the downstream one. The size of the hypotenuse depends on the evolution of the erosion process acting in the downstream zone of the deposit (see Figure 4).
The partial blockage configuration is the most important in terms of hazard assessments. While the conditions of full blockage and no blockage are easy to identify, the classification of the hazard level of the different partial blockage configurations observed in the field is still an open issue. Considering the mechanics leading to deposit formation and the consequent deposit shape, we present a rigorous method based on the shape analysis principles for classifying the hazard of the debris flow deposits.
Specifically, the sediment deposit resilience index proposed here is based on the normalized elliptic Fourier function coefficients and on the degree of obstruction .
The elliptic Fourier function coefficients are descriptors of the shape characteristic symmetry along the principal and secondary axes (see Section 2.1). Here such coefficients are normalized in order to provide an index that does not need a calibration on the specific site, as was the case of the index (see Section 4). According to the proposed index , the stability and the resilience of the debris flow deposits are classified evaluating the symmetry of the deposit contour shape gathered from aerial photos. A more symmetric shape of the contour indicates a more stable and resilient deposit. Due to the fact that we are analyzing just the contour shape with no reference to the hydraulic section, by applying a normalization of this shape, an additional parameter for taking into account the invasion of the sediments at the hydraulic section of the river is needed. Otherwise, conditions of no blockage and full blockage could be easily erroneously classified as belonging to the same hazard class due to the strong symmetry observed in both cases along the principal axis of the deposit contour. The obstruction ratio is therefore considered in the definition of the sediment deposit resilience index . The obstruction ratio is a measure of the invasion and constriction of the hydraulic section caused by the debris flow injection, which certainly are processes that play an important role in terms of stability [7,18,19,20]. The obstruction rate parameter, , describes the symmetry of the deposit along the principal axis in relation to the river section width. The linear trend of the graph presented in Figure 9 shows the importance of this parameter in the deposit stability classification. Thresholds that identify a stable and resilient condition for the partial blockage configuration are: (1) for the upper limit, similar values of and respectively equal to 1 and 1.1; and (2) for the lower limit, significantly different values of and respectively equal to 0.65 and 0.80. The latter observation indicates that the analysis on the symmetry along the secondary axis plays an important role in the definition of all obstruction configurations which are characterized by strong erosion processes and which are relevant for the classification of the deposit resilience.
7. Conclusions
The top view contour of the debris deposits in a river channel provides information on the degree of main river obstruction and on the resilience of the deposit to erosion by the main channel flow. The resilience index (Equation (12)), based on the shape analysis of these contours, seems to provide robust estimates of the resilience of sediment deposits to erosion by the water flow. The index is computed through the elliptic Fourier coefficients, suitably normalized to ensure the invariance in dimension and position. More symmetrical shapes indicate more stable deposits. Moreover, the transverse dimension of the deposit, scaled by the channel width, determines the degree of channel obstruction.
The proposed resilience index, assessed on the basis of small scale flume experiments and tested for field data, allows for individuation of the limiting conditions and the deposit resilience status (low/high) as well as the blockage class (no blockage, partial blockage, full blockage). In particular, the index appears to appropriately describe the state of sediment deposits observed at the field scale, occurring under environmental conditions (i.e., channel slope, channel width, sediment size) very different from those considered in the flume tests. The index has also the advantage of being easily derived simply from aerial images. Although the performance and the robustness of the proposed index appear very promising, further validation is surely needed. The analysis of additional data, also in relation to the dynamic evolution of the deposit during a single event or a cluster of events (accounted for through the index by Stancanelli et al. [17]) and its extension to cases of multiple debris flow deposits interacting with each other are two examples of issues that deserve to be investigated.
Acknowledgments
This work has been partly funded by the EU funded project HYDRALAB PLUS (proposal number 64110) and by the INTERREG Italia-Malta project NEWS (C1-3.2-60).
Author Contributions
L.M.S. conceived and designed the experiments; L.M.S. performed the experiments; L.M.S. analyzed the data; L.M.S. and R.E.M. wrote the paper.
Conflicts of Interest
The authors declare no conflict of interest. The founding sponsors had no role in the design of the study; in the collection, analyses, or interpretation of data; in the writing of the manuscript, and in the decision to publish the results.
References
- Chen, H.X.; Zhang, L.M.; Gao, L.; Yuan, Q.; Lu, T.; Xiang, B.; Zhuang, W.L. Simulation of interactions among multiple debris flows. Landslides 2017, 14, 595–615. [Google Scholar] [CrossRef]
- Liu, J.; You, Y.; Chen, X.; Chen, X. Mitigation planning based on the prediction of river blocking by a typical large-scale debris flow in the Wenchuan earthquake area. Landslides 2016, 13, 1231–1242. [Google Scholar] [CrossRef]
- Stancanelli, L.M.; Foti, E. A comparative assessment of two different debris flow propagation approaches a blind simulations on a real debris flow event. Nat. Hazards Earth Syst. Sci. 2015, 15, 735–746. [Google Scholar] [CrossRef]
- Stancanelli, L.M.; Peres, D.J.; Cancelliere, A.; Foti, E. A combined triggering-propagation modeling approach for the assessment of rainfall induced debris flow susceptibility. J. Hydrol. 2017, 550, 130–143. [Google Scholar] [CrossRef]
- Stancanelli, L.M.; Musumeci, R.E.; Cavallaro, L.; Foti, E. A small scale Pressure Retarded Osmosis power plant: dynamics of the brackish effluent discharge along the coast. Ocean Eng. 2017, 130, 417–428. [Google Scholar] [CrossRef]
- Ermini, L.; Casagli, N. Prediction of the behaviour of landslide dams using a geomorphological dimensionless index. Earth Surf. Process. Landf. 2003, 28, 31–47. [Google Scholar] [CrossRef]
- Dal Sasso, S.; Sole, A.; Pascale, S.; Sdao, F.; Bateman Pinzón, A.; Medina, V. Assessment methodology for the prediction of landslide dam hazard. Nat. Hazards Earth Syst. Sci. 2014, 14, 557–567. [Google Scholar] [CrossRef] [Green Version]
- Dang, C.; Cui, P.; Cheng, Z.L. The formation and failure of debris flow-dams, background, key factors and model tests: case studies from China. Environ. Geol. 2009, 57, 1901–1910. [Google Scholar] [CrossRef]
- Stefanelli, C.T.; Segoni, S.; Casagli, N.; Catani, F. Geomorphic indexing of landslide dams evolution. Eng. Geol. 2016, 208, 1–10. [Google Scholar] [CrossRef]
- Tang, C.; Zhu, J.; Ding, J.; Cui, X.F.; Chen, L.; Zhang, J.S. Catastrophic debris flows triggered by a 14 August 2010 rainfall at the epicenter of the Wenchuan earthquake. Landslides 2011, 8, 485–497. [Google Scholar] [CrossRef]
- Stancanelli, L.M.; Lanzoni, S.; Foti, E. Mutual interference of two debris flow deposits delivered in a downstream river reach. J. Mt. Sci. 2014, 11, 1385–1395. [Google Scholar] [CrossRef]
- Kuhl, F.P.; Giardina, C.R. Elliptic Fourier features of a closed contour. Comput. Graph. Image Process. 1982, 18, 236–258. [Google Scholar] [CrossRef]
- Haruta, O. Elliptic Fourier analysis of crown shapes in Quercus petraea trees. Ann. For. Res. 2011, 54, 3. [Google Scholar]
- Freeman, H. Computer processing of line-drawing images. ACM Comput. Surv. (CSUR) 1974, 6, 57–97. [Google Scholar] [CrossRef]
- Iwata, H.; Niikura, S.; Matsuura, S.; Takano, Y.; Ukai, Y. Evaluation of variation of root shape of Japanese radish (Raphanus sativus L.) based on image analysis using elliptic Fourier descriptors. Euphytica 1998, 102, 143–149. [Google Scholar] [CrossRef]
- Lanzoni, S.; Gregoretti, C.; Stancanelli, L.M. Coarse-grained debris flow dynamics on erodible beds. J. Geophys. Res. Earth Surf. 2017, 122, 592–614. [Google Scholar] [CrossRef]
- Stancanelli, L.; Lanzoni, S.; Foti, E. Propagation and deposition of stony debris flows at channel confluences. Water Resour. Res. 2015, 51, 5100–5116. [Google Scholar] [CrossRef]
- Swanson, F.; Graham, R.; Grant, G. Some effects of slope movements on river channels. In Proceedings of the International Symposium on Erosion, Debris Flow and Disaster Prevention, Tsukuba, Japan, 3–5 September 1985; pp. 273–278. [Google Scholar]
- Ermini, L.; Casagli, N.; Farina, P. Landslide dams: analysis of case histories and new perspectives from the application of remote sensing monitoring techniques to hazard and risk assessment. Ital. J. Eng. Geol. Environ. Spec. 2006, 1, 45–52. [Google Scholar]
- Gregoretti, C.; Maltauro, A.; Lanzoni, S. Laboratory Experiments on the Failure of Coarse Homogeneous Sediment Natural Dams on a Sloping Bed. J. Hydraul. Eng. 2010, 136, 868–879. [Google Scholar] [CrossRef]
Figure 1.
Experimental apparatus and locations of the various measuring devices adopted: (a) Plan view of the main channel and of the tributary channel; (b) Lateral view of the tributary channel and of its confluence with the main channel.
Figure 1.
Experimental apparatus and locations of the various measuring devices adopted: (a) Plan view of the main channel and of the tributary channel; (b) Lateral view of the tributary channel and of its confluence with the main channel.

Figure 2.
Aerial photo acquired on 15 August 2010 representing a series of debris flow deposits along the Minjiang, which were generated by the 14 August 2010 rainfall that hit the Sichuan province (China). Such a figure is a re-elaboration of Figure 9c presented in Tang et al. [10].
Figure 2.
Aerial photo acquired on 15 August 2010 representing a series of debris flow deposits along the Minjiang, which were generated by the 14 August 2010 rainfall that hit the Sichuan province (China). Such a figure is a re-elaboration of Figure 9c presented in Tang et al. [10].

Figure 3.
Temporal sequence of a debris flow injection from the tributary channel to the main channel. The contour of the deposited sediment is indicated with a yellow line.
Figure 3.
Temporal sequence of a debris flow injection from the tributary channel to the main channel. The contour of the deposited sediment is indicated with a yellow line.

Figure 4.
Sketches of the different blockage conditions observed during the flume experiments in relation to different values of the ratio of the debris flow volumetric discharge to the water discharge flowing in the main channel: (a) no blockage; (b) partial blockage; (c) full blockage.
Figure 4.
Sketches of the different blockage conditions observed during the flume experiments in relation to different values of the ratio of the debris flow volumetric discharge to the water discharge flowing in the main channel: (a) no blockage; (b) partial blockage; (c) full blockage.

Figure 5.
Debris deposit morphology acquired at the end of a given experiment. (a–c) Experiments carried out with the same confluence angle (90) and debris flow discharge (9 L/s), changing the water discharge. (a) 2.0 L/s, (b) 3 L/s, (c) 4.5 L/s. (d,e) Experiments with the same water discharge (4.5 L/s) and debris flow discharge (9 L/s), changing the confluence angle. (d) 90, (e) 60. (f,g) Experiments with the same water discharge (4.5 L/s) and debris flow discharge (7 L/s), changing the confluence angle. (f) 90, (g) 60.

Figure 6.
Blockage analysis of a main channel due to one lateral debris flow injection based on the debris flow and water discharges according to the approach of Dang et al. [8]: (a) data from Dang et al. [8] and from the experimental campaign; (b) focus on the experimental data. The dashed lines are the threshold values of the index indicating the partial blockage conditions respectively individuated for the two experimental datasets.

Figure 7.
Application of the elliptic Fourier function for the description of the two-dimensional (2D) deposit-closed contour, by considering a progressively increasing number of harmonics (n = 1–6). Data refers to test no. 10. The continuous red line is the 2D contour of the deposit corresponding to an elevation of 5.5 cm with respect to the channel bed. The dashed line represents the closed curve obtained by considering the first-n elliptic Fourier harmonic. The elliptic principal and secondary axes are indicated in the sketch.

Figure 8.
Elliptic Fourier function coefficients describing the deposit contour observed in experiment no. 3.
Figure 8.
Elliptic Fourier function coefficients describing the deposit contour observed in experiment no. 3.

Figure 9.
The sediment deposit resilience index is plotted versus the obstruction ratio for the experimental data and for the field data referring to the debris flows deposits DF2, DF3, DF5, and DF6 observed from the aerial photos of the Minjiang river after the debris flows triggered by the 14 August 2010 rainfall (Tang et al. [10]).


Table 1.
Summary of the obstruction configuration field data determined from the areal photo reported in Tang et al. [10], depicting a series of debris dams along the Minjiang river in the Sichuan Province (China) caused by the intense alluvial event of 14 August 2010. Nomenclature follows the scientific literature [10]. The obstruction ratio is defined as the ratio between the maximum extension of the deposit along a direction orthogonal to the main river flow and the main river width.
Table 2.
Summary of the relevant parameters characterizing the present flume tests. The various quantities are defined as follows: , water discharge along the main channel; , confluence angle between the tributary and the main channel; , debris flow discharge delivered in the main channel by the tributary channel.
| Main Channel | Tributary Channel | ||
|---|---|---|---|
| 1 | 90 | 9 | |
| 2 | 60 | 9 | |
| 3 | 60 | 7 | |
| 5 | 85 | 9 | |
| 6 | 90 | 7 | |
| 7 | 90 | 7 | |
| 8 | 90 | 9 | |
| 9 | 60 | 9 | |
| 10 | 60 | 9 | |
| 11 | 90 | 9 | |
Table 3.
Summary of the channel obstruction configurations and the maximum deposit depth observed in the present flume tests. The varying quantities related to the obstruction are defined as follows. : obstruction ratio of the maximum extension of the deposit along a direction orthogonal to the main river flow and to the main river width.
| Type of Blockage | Deposit Depth (cm) | ||
|---|---|---|---|
| 1 | |||
| 2 | |||
| 3 | |||
| 5 | |||
| 6 | |||
| 7 | |||
| 8 | |||
| 9 | |||
| 10 | |||
| 11 |
© 2018 by the authors. Licensee MDPI, Basel, Switzerland. This article is an open access article distributed under the terms and conditions of the Creative Commons Attribution (CC BY) license (http://creativecommons.org/licenses/by/4.0/).
Share and Cite
MDPI and ACS Style
Stancanelli, L.M.; Musumeci, R.E. Geometrical Characterization of Sediment Deposits at the Confluence of Mountain Streams. Water 2018, 10, 401. https://doi.org/10.3390/w10040401
AMA Style
Stancanelli LM, Musumeci RE. Geometrical Characterization of Sediment Deposits at the Confluence of Mountain Streams. Water. 2018; 10(4):401. https://doi.org/10.3390/w10040401
Chicago/Turabian StyleStancanelli, Laura Maria, and Rosaria Ester Musumeci. 2018. "Geometrical Characterization of Sediment Deposits at the Confluence of Mountain Streams" Water 10, no. 4: 401. https://doi.org/10.3390/w10040401
Note that from the first issue of 2016, this journal uses article numbers instead of page numbers. See further details here.