Transformation between Phreatic Water and Soil Water during Freeze–Thaw Periods
by
 ,
,
Junfeng Chen
1,* ,
,
Xuguang Gao
1,
Xiuqing Zheng
1,*,
Chunyan Miao
1,2,
Ping Liu
1,
Qi Du
3 and
Yongxin Xu
1,4 1
College of Water Resources and Engineering, Taiyuan University of Technology, Taiyuan 030024, China
2
First Hydrogeology and Engineering Geology Team of Shanxi Province, Taiyuan 030024, China
3
Taigu Water Balance Experimental Field, Bureau of Hydrology and Water Resources Survey of Shanxi Province, Taigu 030800, China
4
Department of Earth Sciences, University of the Western Cape, Private Bag X17, Bellville, Cape Town 7535, South Africa
*
Authors to whom correspondence should be addressed.
Water 2018, 10(4), 376; https://doi.org/10.3390/w10040376
Submission received: 10 February 2018
/
Revised: 21 March 2018
/
Accepted: 21 March 2018
/
Published: 24 March 2018
Abstract
:During freeze–thaw periods, the exchange between shallow groundwater and soil water is unusually strong and bidirectional, which causes soil salinization and affects the accuracy of water resources assessment. The objectives of this study were to explore the laws of transformation between phreatic water and soil water through nine different groundwater table depths (GTDs) and three kinds of lithologies during three successive freeze–thaw periods using field lysimeters. The results showed that phreatic evaporation increased with smaller average soil particle sizes. The differences between phreatic evaporation and recharge to groundwater (DPR) and GTDs were well fitted by the semi-logarithmic model, and the regression coefficients A and B of the model were well fitted by the linear relationship with the average soil particle size. With the increase of soil particle size, the change of DPR decreased with the change rate of soil particle size. The extent of transformation between phreatic water and soil water decreased with the increase of soil particle size. During the whole freeze–thaw period, the negative value of DPR increased with an decrease in GTD. The groundwater depths of zero DPR (D-zero) of sandy loam, fine sand and sandy soil during the freeze–thaw periods were 2.79 m, 2.21 m and 2.12 m, respectively. This research is significant for the prevention of soil salinization disasters and the accurate assessment of water resources.
1. Introduction
China is the third largest location of frozen soil in the world with a distribution area of permafrost and seasonal frozen soil that account for 22.3% and 53.5% of the total national land area, respectively, and the freeze–thaw periods of the inland basin in north-west China account for nearly half a year. During freeze–thaw periods, the exchange between shallow groundwater and soil water is unusually strong and bidirectional, which is actually the soil moisture’s upward migration from shallow groundwater caused by soil freezing, and is also known as phreatic evaporation to the unsaturated zone during freezing periods; and the downward infiltration recharge of thawed soil water from the frozen layer to groundwater is also known as the recharge of thawed water during thawing periods. That is, soil water downward recharge to groundwater and phreatic evaporation appear alternately. The strong exchange between shallow groundwater and soil water is one of the main causes of soil salinization [1,2,3], and also affects the accuracy of water resources assessment [4]. Therefore, it is important to study the transformation between phreatic water and soil water during freeze–thaw periods for the protection of water resources in shallow groundwater, the prevention of soil salinization disasters, and the accurate assessment of water resources.
For many years, investigators have conducted a great deal of research on the mechanisms and laws of phreatic evaporation in non-freezing periods using aspects of the calculation method [5,6,7,8], model [9,10,11,12], and influencing factors [13,14,15,16,17,18]. The research methods have mainly been through field observations [19,20] theoretical analysis [21,22] and numerical simulation [23,24]. Due to the complexity of the soil water movement process, the theoretical analyses have been mostly conducted for stable evaporation conditions. In addition, the research on groundwater recharge has made new progress [25,26,27,28,29].
Due to the limitation of field experiments, most research into soil water has been conducted in the laboratory [30,31,32,33], and little attention has been paid to the effect of groundwater levels on soil water movement. Li et al. [32] studied the daily evaporation characteristics of deeply buried phreatic water in an extremely arid region and the results showed that phreatic evaporation was affected by soil temperature; however, the effect of lithology on phreatic water evaporation was not analyzed. Li et al. [33] analyzed high-TDS (total dissolved solids) phreatic water evaporation laws in arid areas without considering the effect of soil freezing and thawing. Some scholars have also studied the dynamics and patterns of soil evaporation from the perspective of coupled heat and the water migration of unsaturated freezing and thawing soils [34,35,36]. Wang et al. [37] studied the effects of freezing and thawing on water flow and solute transport in field soils. At present, significant progress has been made in research on the mechanisms and laws of phreatic evaporation and groundwater recharge during the non-freezing period, and in research on water, heat and solute migration in freeze–thaw soil.
During the seasonal freeze–thaw period, the migration of soil water in unsaturated zones is controlled by many conditions, including soil texture, soil water content and covering [38,39,40,41]. Sun et al. [42] described the entire process and the factors affecting the relationships of soil water movement in seasonal frozen unsaturated zones by analyzing the interrelationship between freeze–thaw action and the three characteristics of groundwater level without considering the transformation between the phreatic water and soil water.
Generally, the factors that influence groundwater recharge to soil water are surface soil evaporation, plant transpiration, and meteorological factors in a non-freezing period. During freezing periods, the soil freezing and temperature gradients can result in phreatic evaporation and a higher soil water content zone [43]. Miao et al. [43] investigated the relationship between phreatic evaporation and groundwater table depth (GTD) during a freeze–thaw period using field-measured data. However, the inadequate understanding of the exchange between shallow groundwater and soil water during freeze–thaw periods prompted this study.
The objectives of this study were to: (1) analyze the phreatic evaporation and recharge to groundwater with sandy loam, fine sand and sandy soil under different GTDs during three successive freeze–thaw periods; (2) establish the relationship between the DPR (abbreviation of “the difference between phreatic evaporation and recharge to groundwater”) and GTDs during the freeze–thaw period and determine the D-zero of different lithologies; (3) analyze the relationship between the regression coefficients of the DPR equation and the average soil particle size; and (4) reveal the influence of lithology on the extent of transformation between phreatic water and soil water.
2. Test Conditions and Methods
The experiments were conducted at the Taigu Water Balance Experimental Field, which is 60 km away from the south of Taiyuan, Shanxi Province, China. It is located in the east of the Jinzhong basin at approximately 37°26′ N, 112°30′ E at an altitude of 777 m. The area is characterized by a continental semi–arid climate with GTD of 25.0 m. The climate is characterized by heavy wind and little rain in spring, heavily concentrated rainfall in summer, continuous rain in autumn, and cold with a little snow in winter. The annual average temperature is 9.9 °C. Average annual precipitation is 415 mm, which mainly occurs from June to September, and the annual water surface evaporation potential is 1642 mm. The average relative humidity has been 74% and the average wind speed 0.9 m·s−1 for many years. The annual average frost-free period is about 200 days, and the maximum observed soil frost depth was 92 cm in 1960.
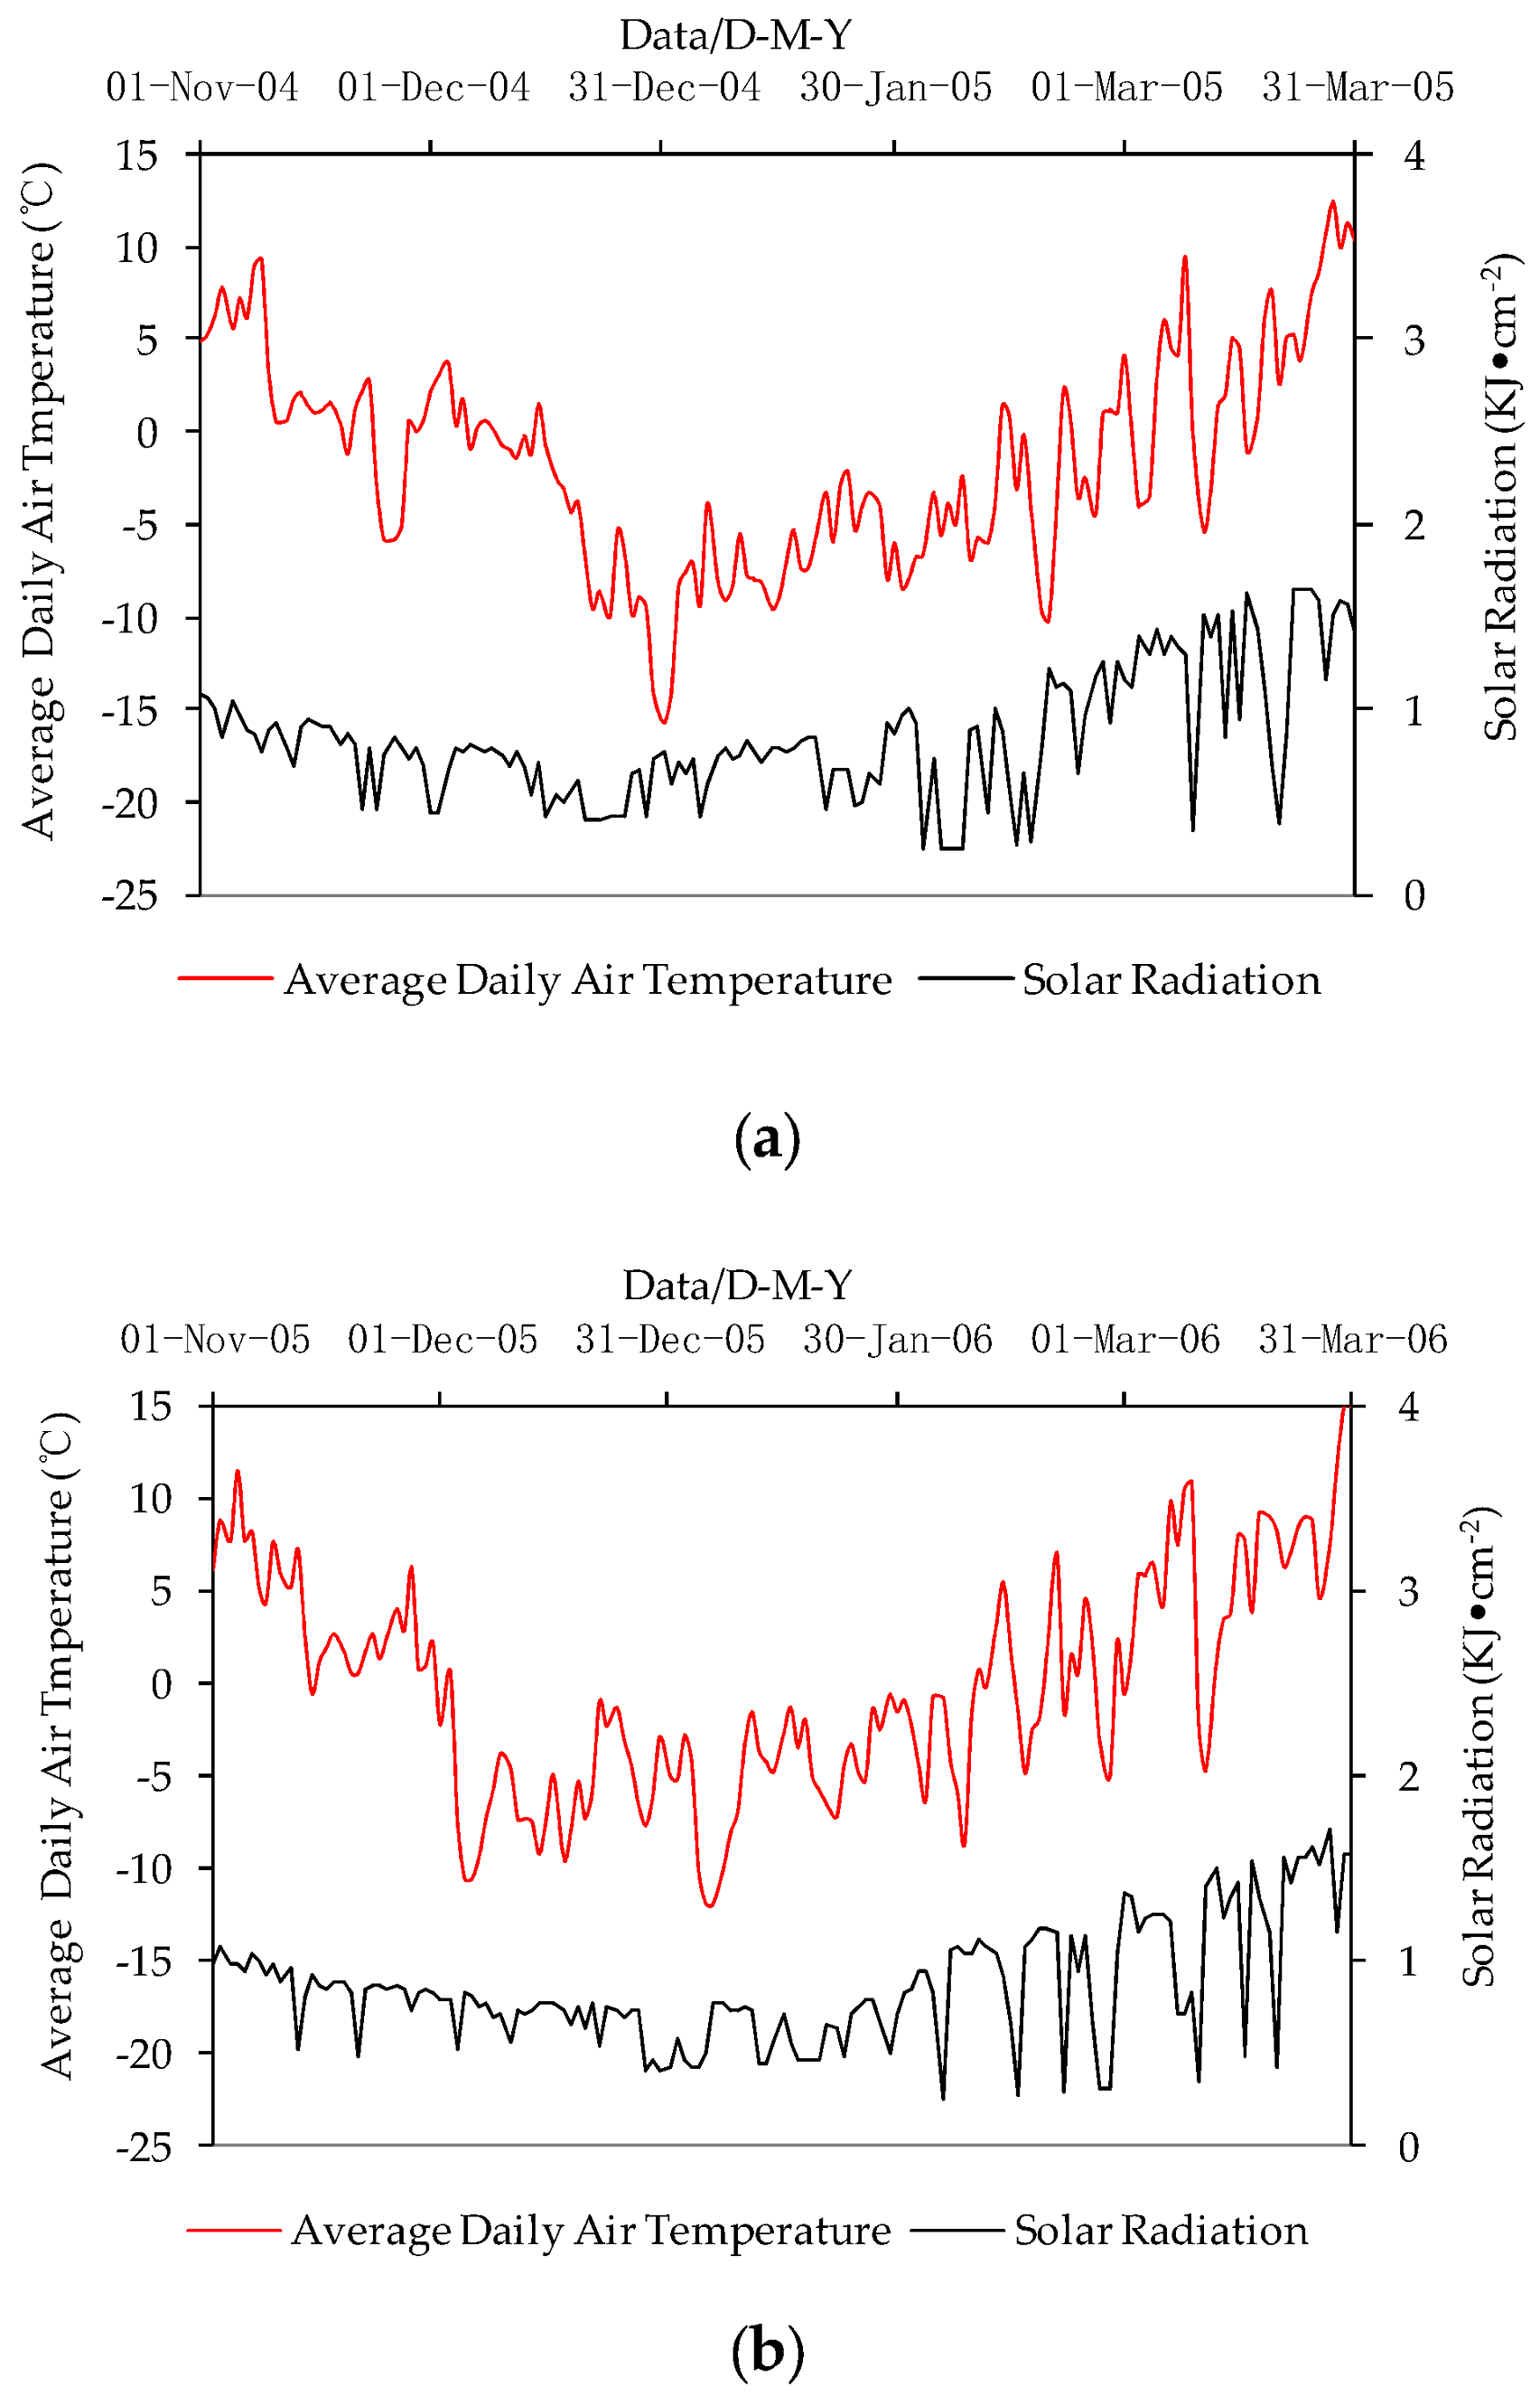
During the three successive freeze–thaw periods (from November 2004 to March 2005, November 2005 to March 2006, November 2006 to March 2007), January was the coldest month, with an average daily mean air temperature of −6.8 °C, −5.9 °C and −5.1 °C daily, respectively. From November in 2004 to March in 2005, the total solar radiation was 127.2 kJ·cm−2, the lowest observed total solar radiation was 18.93 kJ·cm−2 in December, and the minimum air temperature was −15.7 °C on 31 December 2004. From November 2005 to March 2006, the total solar radiation was 129.1 kJ·cm−2, and the lowest observed total solar radiation was 19.01 kJ·cm−2 in December where the minimum air temperature was −12.0 °C on 6 January 2006. From November 2006 to March 2007, the total solar radiation was 106.2 kJ·cm−2, and the lowest observed total solar radiation was 17.59 kJ·cm−2 in December where the minimum air temperature was −8.2 °C on 7 January 2007. The variation of solar radiation and the average daily temperature during the test periods are shown in Figure 1.
There was very little precipitation during the freeze–thaw periods, and precipitation mainly occurred before the freezing period. The amount of precipitation during freeze–thaw periods is shown in Table 1.
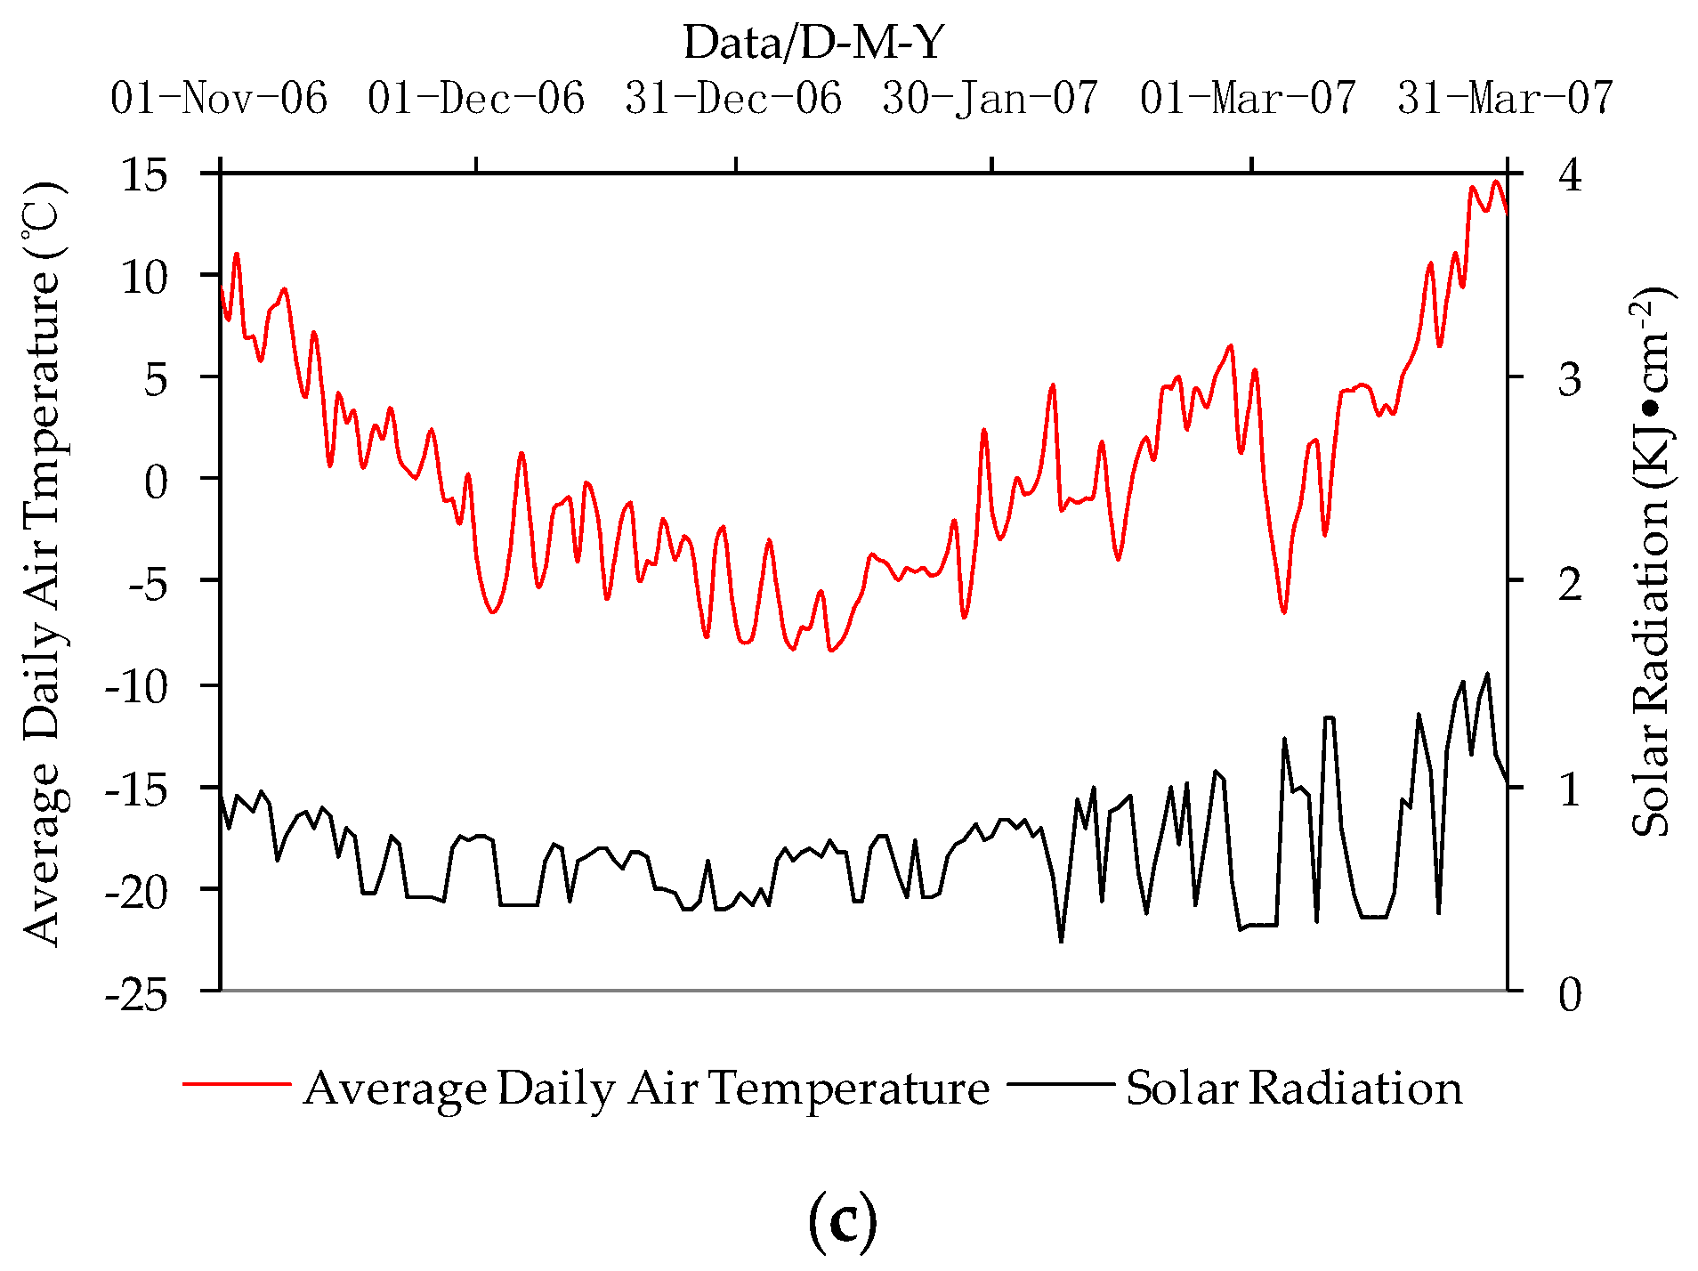
The test equipment used consisted of lysimeters (Figure 2), and there were 24 lysimeters with a circle cross–section of 0.5 m2 and an installed interval of 0.5 m. The surface soil of the lysimeters was exposed to atmospheric conditions during the experiment. The phreatic evaporation and infiltration recharge of thawed soil water was monitored by lysimeters every day through a Mariotte bottle in an underground room, and the GTDs were controlled by the Mariotte bottle.
A frozen soil depth-measuring instrument model LM61-DT-1was used to monitor the depth of soil freezing, and it consisted of an outer tube with an inner diameter of 30 mm and an outer diameter of 40 mm. When the surface temperature dropped to 0 °C or below, the freezing depth was observed at 8:00 a.m. per day until the next year the soil was completely thawing.
The lithology of the unsaturated zone in lysimeters was sandy loam (nine lysimeters with the same texture for nine different GTDs, that is 0.5 m, 1.0 m, 1.5 m, 2.0 m, 2.5 m, 3.0 m, 3.5 m, 4.0 m and 5.0 m, respectively), fine sand (eight lysimeters with the same texture for eight different GTDs, that is 0.5 m, 1.0 m, 1.5 m, 2.0 m, 3.0 m, 3.5 m, 4.0 m and 5.0 m, respectively) and sandy soil (seven lysimeters with the same texture for seven different GTDs, that is 0.5 m, 1.0 m, 1.5 m, 2.0 m, 2.5 m, 3.0 m and 3.5 m, respectively), which are homogeneous and representative soils of the Jinzhong basin and the Taiyuan basin in China, respectively. The sandy loam had a specific yield of 0.08 m3·m−3 and prosity of 0.53 m3·m−3. The fine sand had a specific yield of 0.12 m3·m−3 and prosity of 0.45 m3·m−3. The sandy soil had a specific yield of 0.14 m3·m−3 and porosity of 0.40 m3·m−3. The average particle size of the sandy loam, fine sand and sandy soil was 0.13 mm, 0.20 mm and 0.25 mm, respectively. The physical characteristics of the soils are shown in Table 2.
Based on field experiments, the relationship between DPR and GTDs, and the relationship between the regression coefficients of the DPR equation and the average soil particle size, were analyzed by the method of regression analysis.
3. Results and Discussion
3.1. The Soil Freezing and Thawing Process at the Experimental Station
The soil freezing and thawing process at the experimental station was divided into three main stages according to the characteristics of soil freezing and thawing [44,45,46]: the unstable freezing stage, the stable freezing stage, and the thawing stage as shown in Table 3.
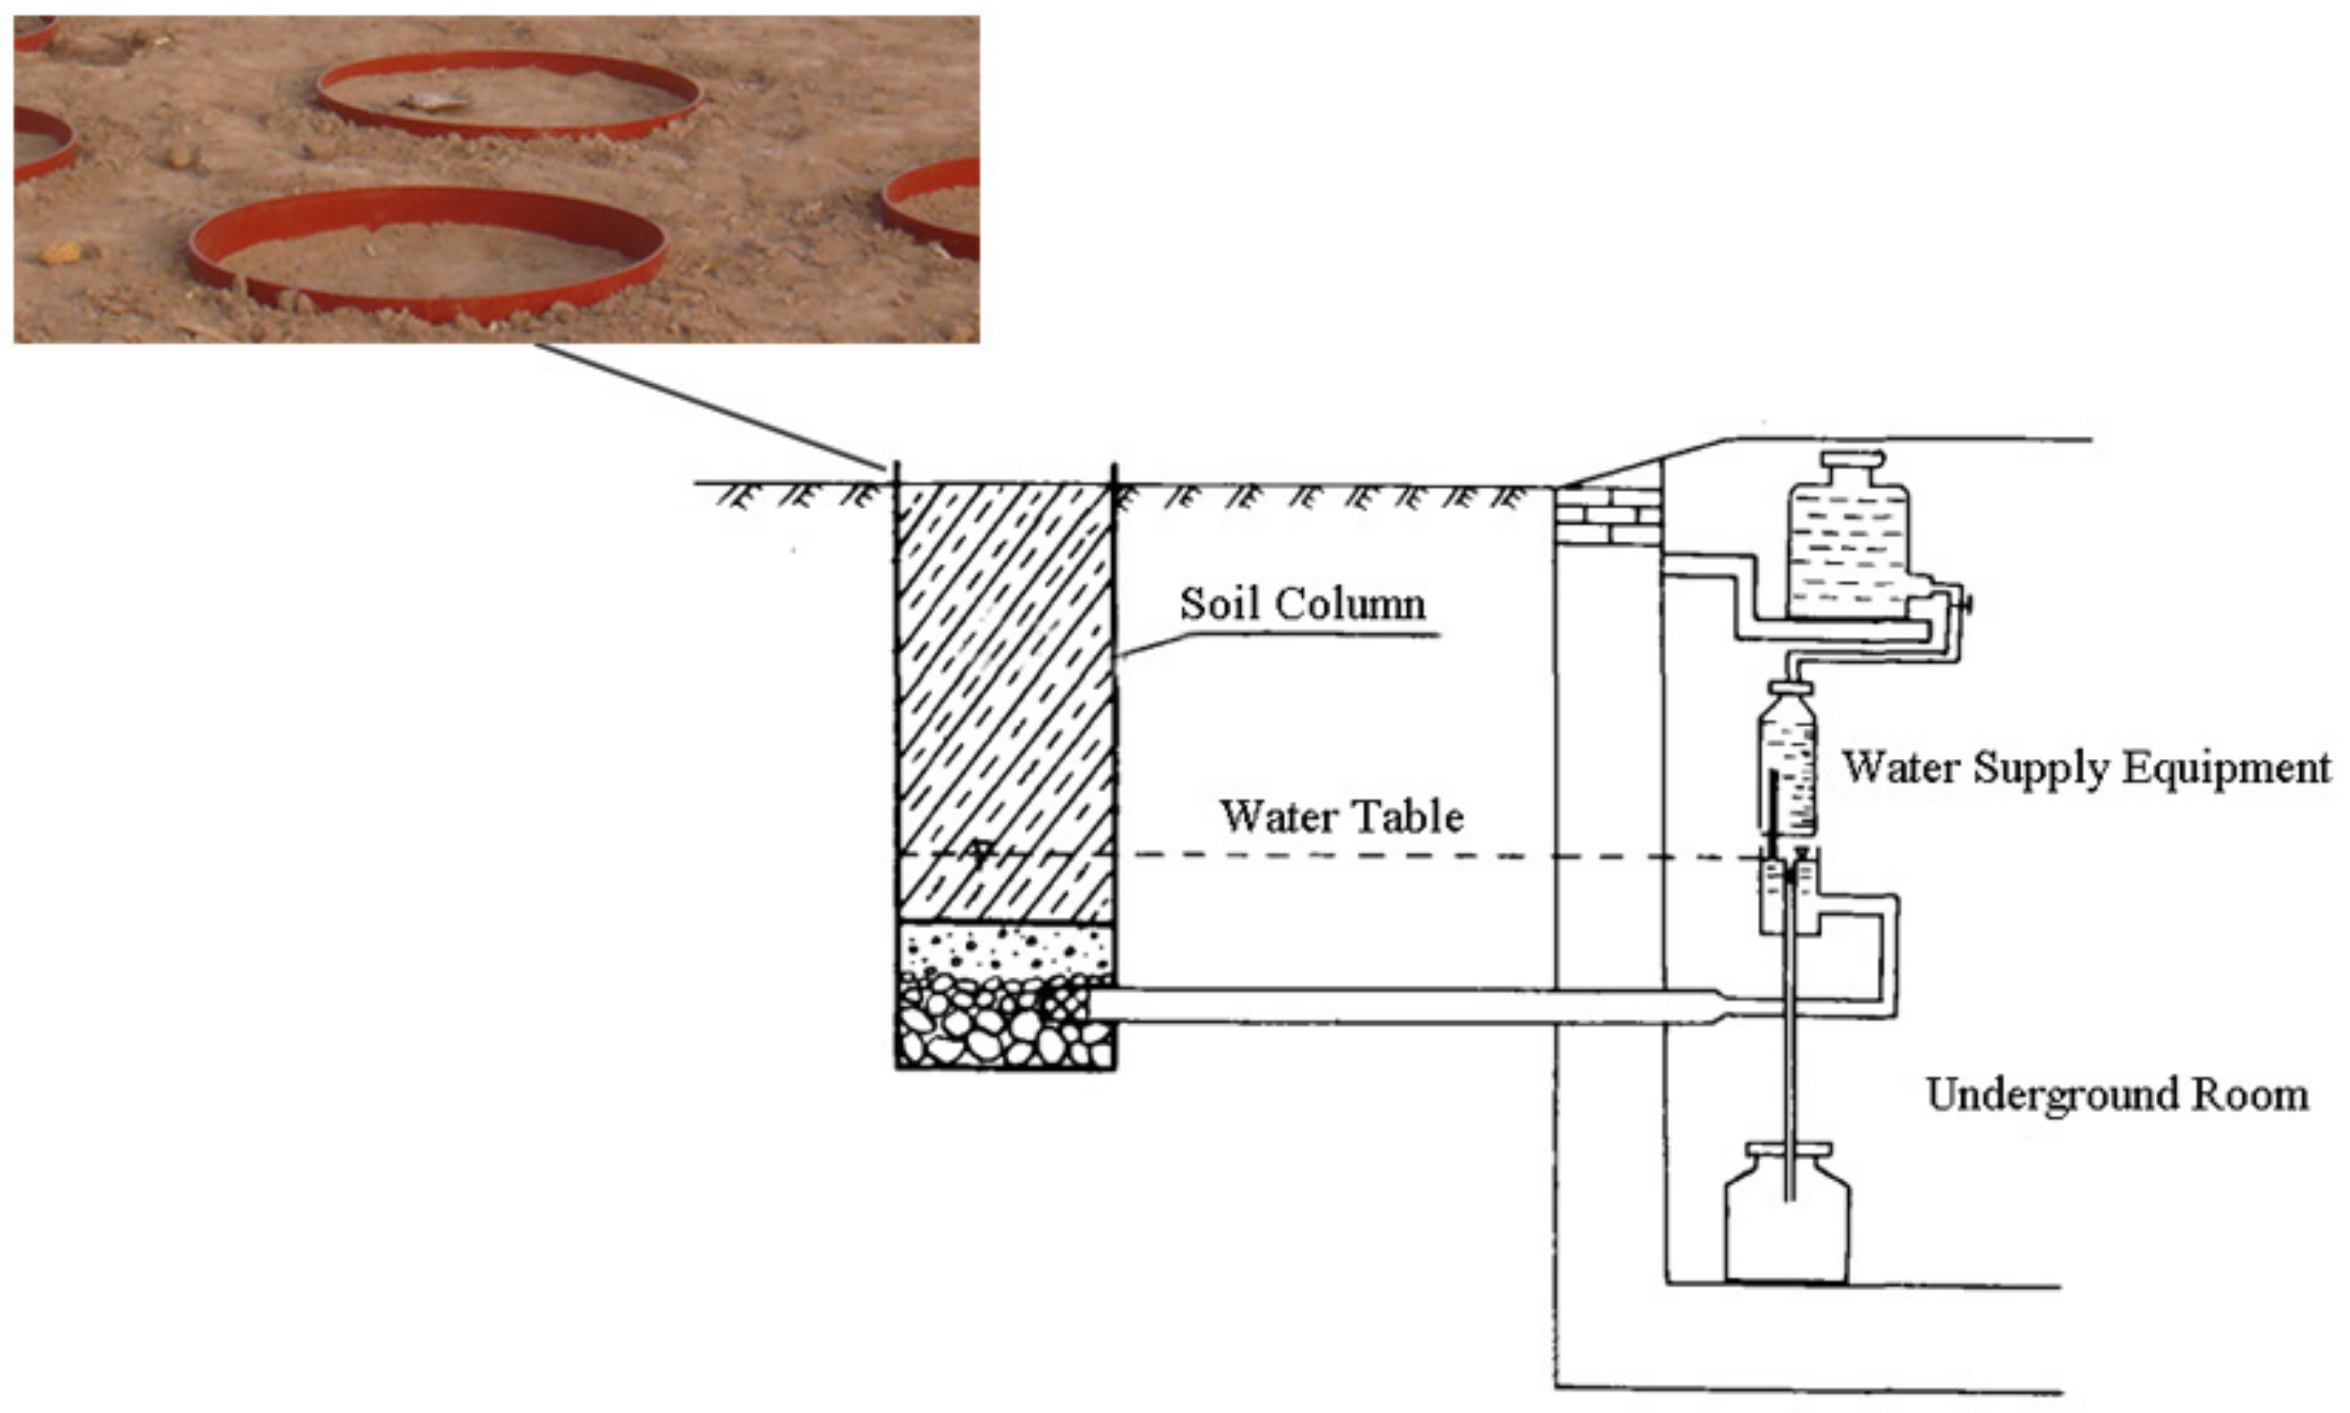
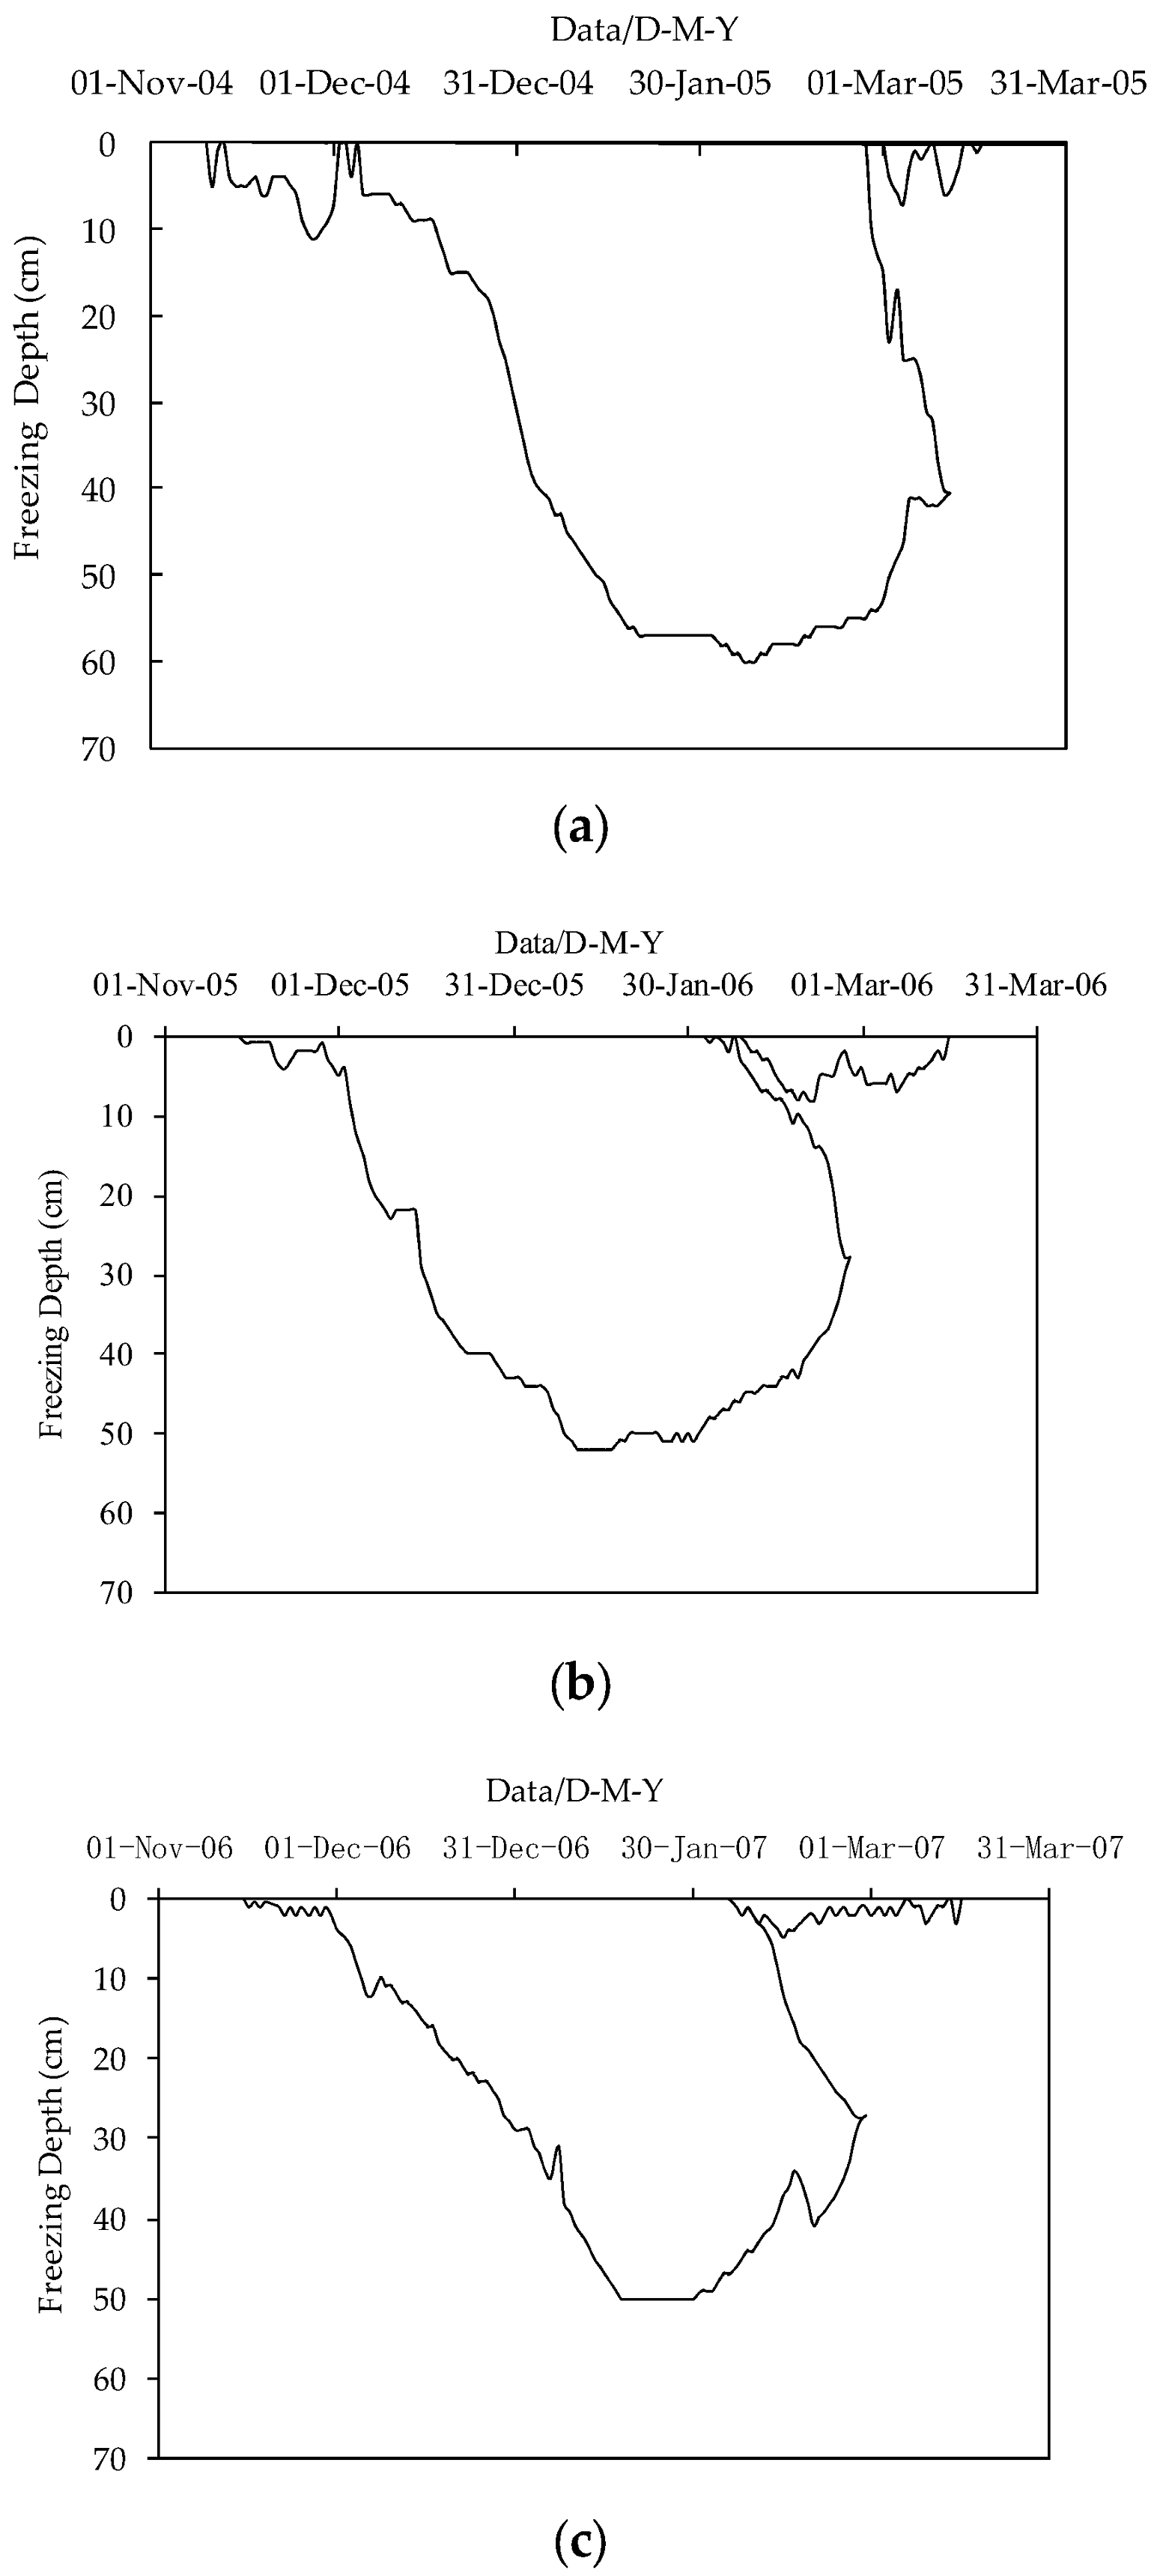
The soil freezing and thawing process at the experimental station is shown in Figure 3. The temperature and solar radiation decreased gradually after November, and the surface soils began to freeze in November. The surface soil experienced several diurnal cycles (thawing during the day and freezing at night) during the unstable freezing stage. With the decline of air temperature and the accumulation of negative surface temperatures, the soil entered the stable freezing stage in December, during which the frozen layer gradually developed downward. The maximum freezing rate was up to 3.0 cm per day, and the frozen layer during the three freeze–thaw periods reached a maximum of 60 cm, 52 cm and 50 cm, respectively. During the thawing stage, as the air temperature rose, the frozen soil water began to thaw downward from the surface and upward from the maximum frozen front (referred to as bidirectional thawing), and the surface soil experienced several freeze–thaw cycles again.
3.2. Phreatic Evaporation
Phreatic evaporation is caused by the migration of soil water during freeze–thaw periods [43]. The driving force that makes groundwater migrate into the unsaturated zone is the soil–water potential gradient [47,48]. Moreover, surface soil evaporation and the freezing of soil profile moisture can also force the soil moisture’s constant upward migration from shallow groundwater. Therefore, phreatic evaporation is actually the upward migration of phreatic water to the unsaturated zone during freeze–thaw periods. The total phreatic evaporation was affected by the lithology and GTD [43]. The phreatic evaporation per month of different lithlogies with different GTDs during the test periods is listed in Table 4, Table 5 and Table 6.
These tables indicate that phreatic evaporation increased with smaller average soil particle sizes. The frozen layer developed downward rapidly from early December to late January (rapid freezing stage), and the phreatic evaporation caused by the rapid freezing of soil profile moisture was relatively large, which was obviously affected by soil freezing when the GTD was 0.5 m. The phreatic evaporation was mainly focused in December, and not in the coldest January as the zone between the groundwater table and the soil surface was almost frozen in January when the GTD was 0.5 m. The concrete frozen layer had a small amount of liquid water [49], which was blocked by ice with very low permeability [50,51], so much less water could be transported directly from the groundwater to the soil surface. Therefore, the phreatic evaporation was relatively small regardless of lithology in January. The rapid downward development of the freezing front had a great effect on phreatic evaporation when the GTD was 1.0 m, and phreatic evaporation was mainly focused in January. The phreatic evaporation of the fine sand and sandy soil was larger than that of the sandy loam due to the larger pore diameter. As the distance between the soil freezing front and the GTD increased, the water potential gradient in the soil was less, so smaller amounts of groundwater recharged the soil water. Thus, the phreatic evaporation decreased.
During the soil-thawing period, some thawed soil water from the frozen layer was lost to evaporation [52], and other thawed soil water recharged the shallow groundwater [53]. If the GTD was smaller, the shallow groundwater was largely lost to evaporation. With increasing GTD, the phreatic evaporation capacity weakened. When the GTD was greater than 1.0 m, the phreatic evaporation of different lithologies was less than 1.5 mm in March due to drought and little rain in March in northern China where the surface soil evaporation is strong. Thus, the differences of phreatic evaporation with sandy loam, fine sand and sandy soil were small when the GTD was 0.5 m during a freeze–thaw period. When the GTD was greater than 1.0 m, the phreatic evaporation reduced sharply due to the weakening influence of surface soil evaporation.
3.3. Transformation of Soil Water to Groundwater
During the freeze–thaw period, the recharge of the shallow groundwater comes from the limited infiltration of precipitation and percolation of thawed soil water from the freezing layer, which was mainly influenced by lithology and GTD. The greater the GTD, the longer the downward path and the time of rainfall infiltration during the unfreezing period, and the soil profile moisture was less affected by surface soil freezing and thawing. The recharge to groundwater from the thawed soil water was greater and was mainly focused in February and March when the GTD was less than 2.0 m, as shown in Table 7, Table 8 and Table 9.
In the rapid freezing stage, soil water gathered into the freezing front, which was influenced by the soil water gradient owing to the freezing of the frozen layer and contributed to the decrease in the recharge to phreatic water. In the thawing stage, the thawed soil water of the frozen layer recharges phreatic water continuously. The shallower the GTD, the more the thawed soil water of the frozen layer recharged. The recharge to phreatic water had increased but was smaller in February. In March, the frozen layer thawed thoroughly with a significant increment of recharge.
With the increase of GTD, the downward recharging path of soil water movement to the groundwater was increased, and the recharge of thawed soil water from the freezing layer reduced gradually with a significant lag [43]. When the GTD was greater than 3.0 m, the recharge to shallow groundwater was mainly focused in December, January and February, which derived from atmospheric precipitation infiltration before the freezing period.
3.4. The Difference between Phreatic Evaporation and Recharge to Groundwater
The extent of transformation between the phreatic water and soil water can be symbolized by the difference between phreatic evaporation and recharge to groundwater (DPR) during the freeze-thaw period, which is the difference between the upward migration of phreatic water to the unsaturated zone and the recharge of infiltration to phreatic water, as shown by the following equation:
where Qd is the DPR; Qre is the recharge of infiltration to phreatic water; and Qpe is the upward migration of phreatic water to the unsaturated zone (that is phreatic evaporation).
Qd = Qre − Qpe
During the unfreezing period, when GTD is shallow, the DPR is negative regardless of the impact of other factors. The phreatic evaporation decreased relatively and the recharge increased gradually with an increase of GTD, which results in a positive DPR.
During the freeze–thaw period, the dynamic change of groundwater was determined by the bidirectional exchange between the soil water and groundwater. When the downward percolation of soil water was less than the upward migration of the groundwater, the DPR was negative and indicated that the groundwater was in a negative balance. That is, the groundwater recharged the soil water. In contrast, the recharge of groundwater was greater than the consumption of groundwater. That is, the soil water recharged the groundwater. The analysis results of DPR with three kinds of soil textures are listed in Table 10, Table 11 and Table 12.
As shown in the tables, the values of DPR were from negative to positive with the increase of GTD. During the freezing period, the DPR was negative when GTD with sandy loam less than 2.5 m, and fine sand and sandy soil less than 2.0 m, which is the transformation of phreatic water to soil water. During the thawing period, the DPR was negative when the GTD was less than 0.5 m regardless of soil texture.
When the GTD was 1.0 m, the recharge of phreatic water from the thawing soil water was more than the consumption during the thawing period, which is the transformation of soil water to phreatic water, as the largest amount of phreatic evaporation occurred during the freezing period (November, December, and January) and the unsaturated zone accommodated more water that recharged to groundwater in the thawing period.
During the whole freeze–thaw period, the negative value of DPR increased with a decrease in GTD, and the movement of soil water was displayed as an evaporative pattern, which indicated that there was a severe consumption of phreatic water in the groundwater-soil system and an invalid consumption of the groundwater resource. Meanwhile, this may cause soil salinization and other ecological problems.
The DPR was positive when the GTD was greater than 3.0 m, and it was positively correlated with the GTD obviously for a continuous downward recharge of soil profile moisture to phreatic water with greater GTD. Furthermore, the soil profile had some regulating effects on the water, and the movement of soil water was displayed as an infiltrative pattern as the phreatic evaporation was influenced relatively little by freezing and capillary action during the freeze–thaw period.
According to the correlation analysis on the average DPR and GTDs during the three freeze–thaw periods from 2004 to 2007, the relationship between the DPR and GTDs is well fitted by the following semi-logarithmic model:
Qd = A × lnG + B
In Equation (2), Qd is the DPR during the freeze–thaw period (millimeters); G is the GTDs (meters; 0.5 m ≤ G ≤ 5.0 m); and A and B (millimeters) are regression coefficients.
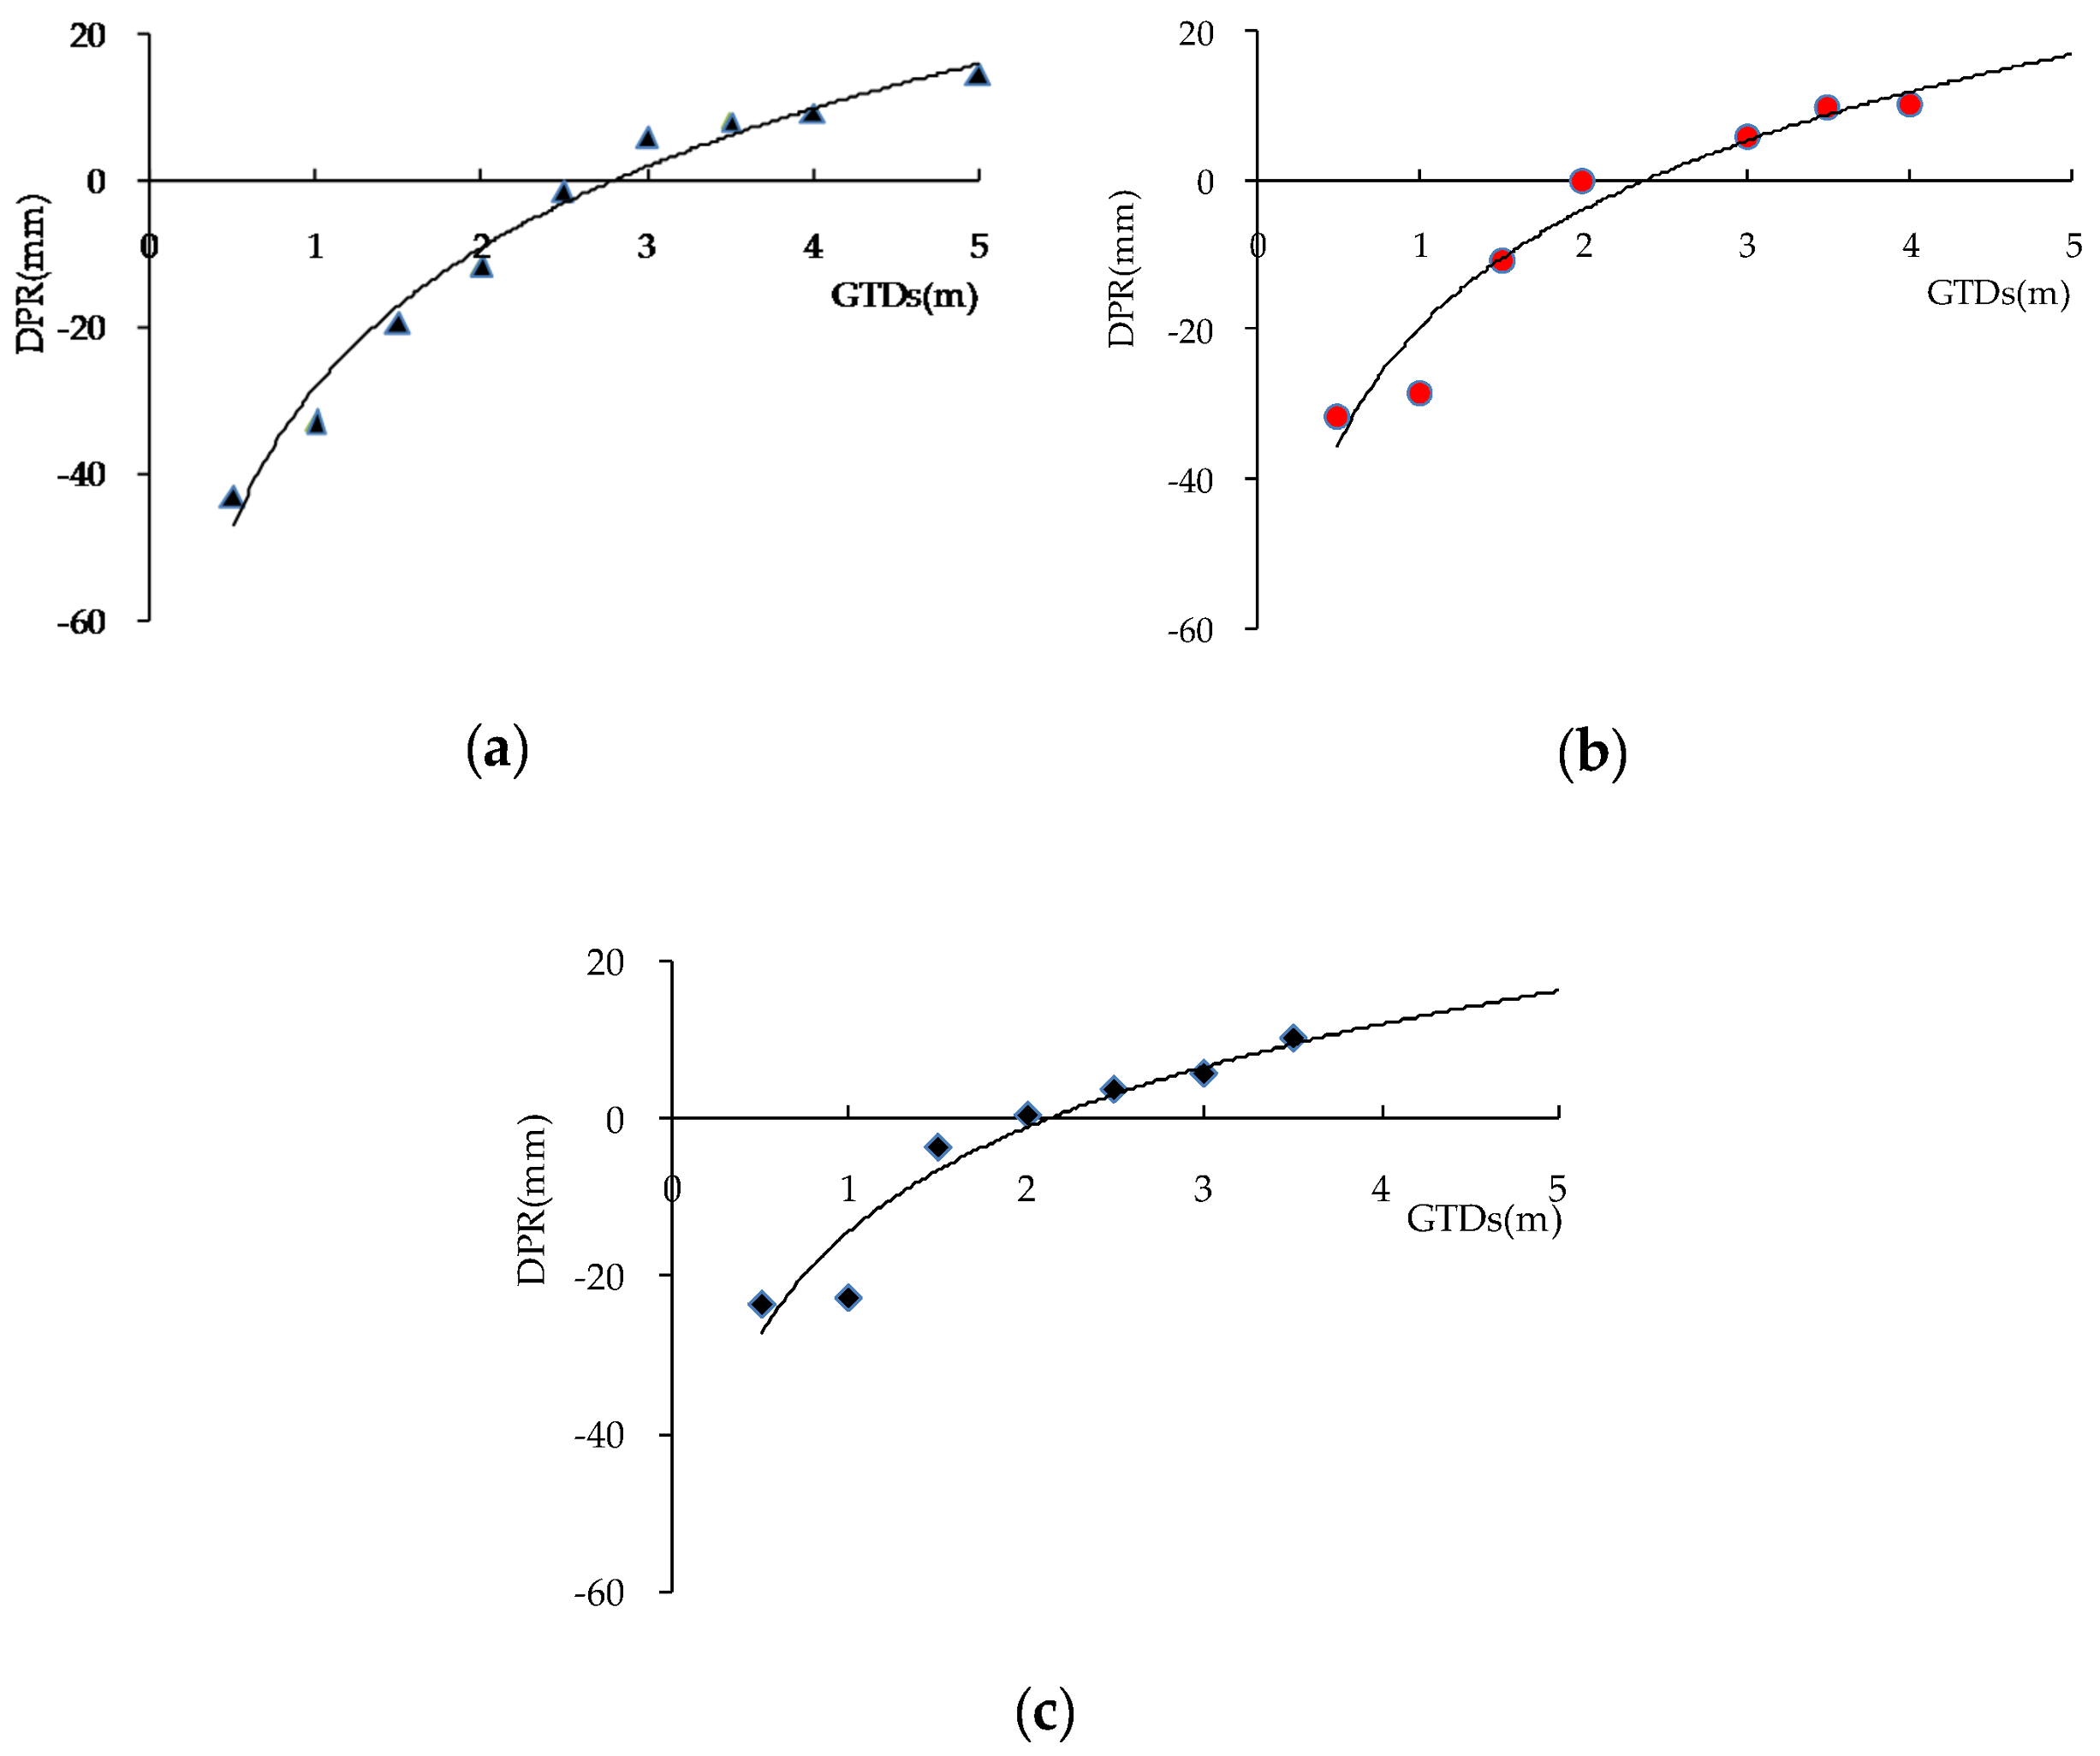
The fitting curves between the DPR and GTDs with sandy loam, fine sand and sandy soil during the freeze–thaw period are shown in Figure 4. The regression analysis results of different lithologies are listed in Table 12. With the mentioned model transformed into a linear model Y = aX + b, the significance level α = 5% yields F0.05(p, n − p − 1) = F0.05(1,7) = 5.59 for sandy loam, F0.05(1,6) = 5.99 for fine sand, and F0.05(1,5) = 6.61 for sandy soil. Table 13 shows the regression coefficient and significance test of the regression equation. All the regression results were significant with F > F0.05(p, n − p − 1), which indicates that the regression equation was strongly significant, and the relationship between the DPR and GTDs can be expressed by the mentioned regression model.
During freeze–thaw periods, the DPR was zero when the GTD was equal to a certain value and the certain GTD was named the groundwater depth of zero DPR (D-zero). However, D-zero is different from the limit depth of phreatic evaporation, and there was still phreatic evaporation in D-zero only when recharge to phreatic water was equal to the phreatic evaporation in a specified period.
The purpose of research on the transformation between phreatic water and soil water was to identify the D-zero during freeze-thaw periods. When the GTD was less than D-zero, the DPR was negative and it was characterized by the transformation of groundwater to soil water, which might be against the protection of phreatic water during freeze–thaw periods. When the GTD was greater than D-zero, the DPR was positive and it was characterized by the transformation of soil water to groundwater, which could contribute to the infiltration recharge to phreatic water. Therefore, the rational determination of D-zero was significant for the scientific evaluation of the underground water resource, the protection of the shallow ground water resource, and the prevention of the invalid phreatic evaporation during the freeze–thaw period.
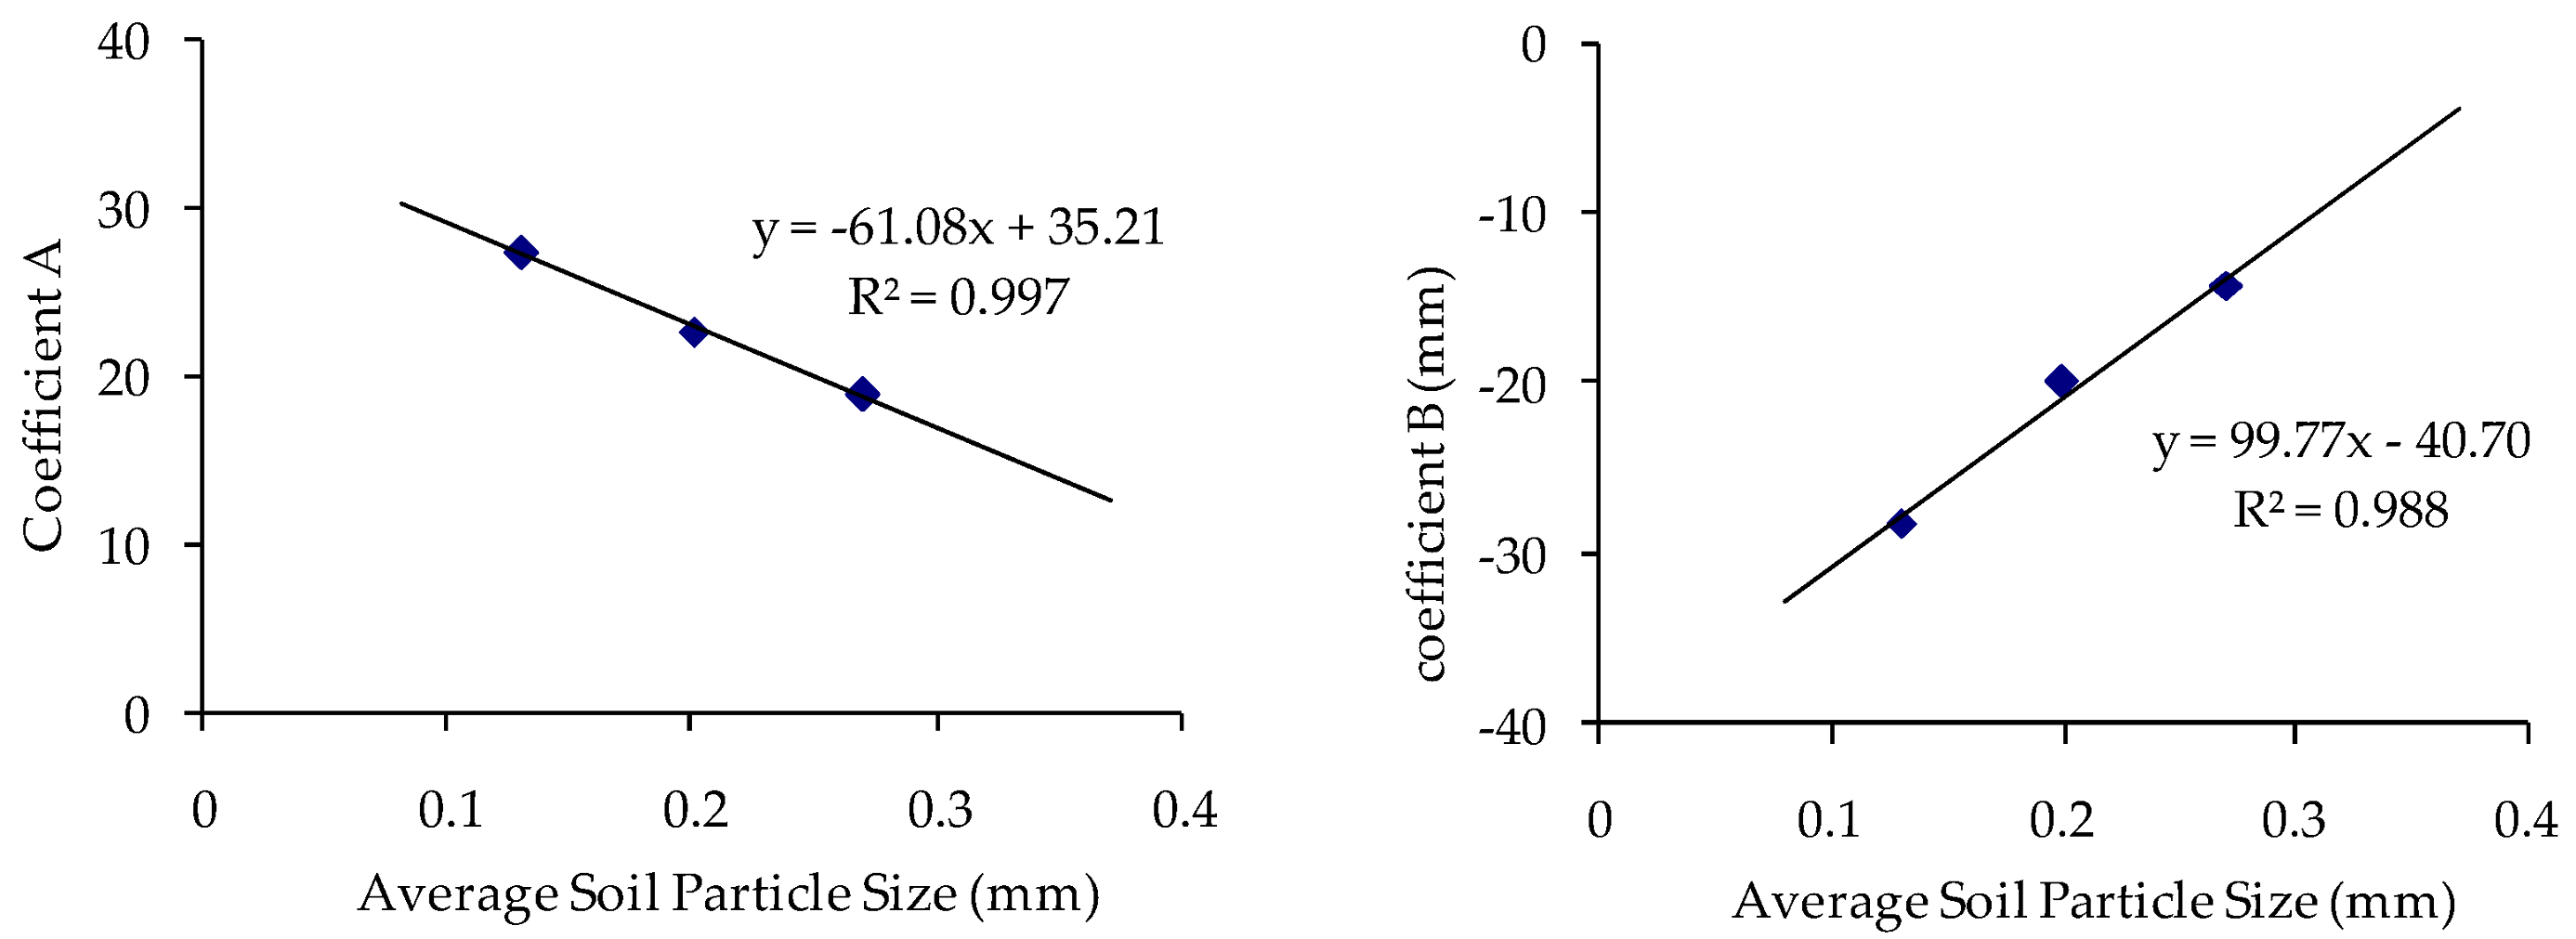
According to the regression Equation (2), the calculated D-zero of sandy loam, fine sand, and sandy soil during the freeze–thaw period was 2.79 m, 2.21 m, and 2.12 m, respectively. As is shown in Table 12, the regressive coefficient A decreased with the increase of soil particle size and it also indicated that, with the increase of soil particle size, the change of DPR decreased with the change rate of soil particle size. The absolute value of B decreased with the increase of soil particle size, and reflected the extent of transformation between the phreatic water and soil water that decreased with the increase of soil particle size. The above analysis shows that the regression coefficients A and B had a close relationship with the soil profile particle size. As shown in Figure 5, both A and B are well fitted by the linear relationship with the average soil particle size.
A = −61.08 × P + 35.21; B = 99.77 × P − 40.70
In Equation (3), P is the average soil particle size (millimeters).
If the average soil particle size of one soil texture is known, the coefficients A and B can be determined according to Equation (3), and then the DPR can be calculated in the shallow groundwater areas during the freeze–thaw period according to Equation (2).
4. Conclusions
The transformation between phreatic water and soil water was affected by the lithology, GTD, and the effect of soil freezing and thawing during freeze–thaw periods. The phreatic evaporation increased with the smaller average soil particle sizes.
From early December to late January, the frozen layer developed downward rapidly, and the phreatic evaporation caused by the rapid freezing of soil profile moisture was relatively large, which was obviously affected by soil freezing when the GTD was 0.5 m.
The phreatic evaporation was mainly focused in December, and not in the coldest January, and was relatively small regardless of lithology in January as less water could be transported directly from the groundwater to the soil surface when the GTD was 0.5 m.
When the GTD was 1.0 m, the phreatic evaporation of the fine sand and sandy soil was larger than that of the sandy loam due to the larger pore diameter. With increasing GTD, the phreatic evaporation capacity weakened. When the GTD was greater than 1.0 m, the phreatic evaporation of the different lithology was less than 1.5 mm in March.
With a greater GTD, the recharge of thawed soil water from the freezing layer reduced gradually with a significant lag. When the GTD was greater than 3.0 m, the recharge to shallow groundwater was mainly focused in December, January and February, and was derived from atmospheric precipitation infiltration before the freezing period. When the GTD was less than 2.0 m, the recharge to groundwater from the thawed soil water was greater and mainly focused in February and March.
During the whole freeze–thaw period, the values of DPR were from positive to negative and the negative value of DPR increased with a decrease in GTD. The relationship between the DPR and GTDs was well fitted by the semi-logarithmic model and the regression coefficients A and B of the model were well fitted by the linear relationship with the average soil particle size. The regressive coefficient A decreased with the increase of soil particle size, and the change of DPR decreased with the change rate of soil particle size. The absolute value of B decreased with the increase of soil particle size, and reflected the extent of transformation between the phreatic water and soil water that decreased with the increase of soil particle size. The D-zero of sandy loam, fine sand, and sandy soil during the freeze–thaw period was 2.79 m, 2.21 m, and 2.12 m, respectively.
Acknowledgments
This research was supported by the National Natural Youth Science Foundation of China (Grant No. 41502243), the National Natural Science Foundation of China (Grant No. 41572239), and the Natural Science Youth Foundation of Shanxi Province, China (Grant No. 2015021169). The authors thank Professor Ming Sun, Xiaojun Yang from the Taigu Water Balance Experimental Station for their assistance with the field work.
Author Contributions
Xiuqing Zheng and Junfeng Chen conceived of and designed the field experiments. Chunyan Miao, Ping Liu and Qi Du performed the field experiments. Junfeng Chen, Chunyan Miao and Xuguang Gao analyzed the data and wrote the paper. Yongxin Xu corrected grammatical errors and put forward some suggestions for improvement.
Conflicts of Interest
The authors declare no conflict of interest.
References
- Brunner, P.; Li, H.T.; Kinzelbach, W.; Li, W.P.; Dong, X.G. Extracting phreatic evaporation from remotely sensed maps of evapotranspiration. Water Resour. Res. 2008, 44, 381–392. [Google Scholar] [CrossRef]
- Northey, J.E.; Christen, E.W.; Ayars, J.E.; Jankowski, J. Occurrence and measurement of salinity stratification in shallow groundwater in the Murrumbidgee Irrigation Area, south-eastern Australia. Agric. Water Manag. 2006, 81, 23–40. [Google Scholar] [CrossRef]
- Ibrahimi, M.K.; Miyazaki, T.; Nishimura, T.; Imoto, H. Contribution of shallow groundwater rapid fluctuation to soil salinization under arid and semiarid climate. Arab. J. Geosci. 2014, 7, 3901–3911. [Google Scholar] [CrossRef]
- Ren, J.G.; Wu, Q.Q.; Zheng, X.L.; Xu, M. The Studies of Regional Water Circulation Patterns in the Yerqiang River Basin. J. Ocean Uiv. China 2006, 5, 357–362. [Google Scholar] [CrossRef]
- Hu, S.J.; Kang, S.Z.; Song, Y.D.; Ceng, X.B. Calculating phreatic water evaporation from bare soil for the Tarim River basin, Xinjiang. In Proceedings of the International Conference on Water-Saving Agriculture and Sustainable Use of Water and Land Resources, Yangling, China, 26–29 October 2003. [Google Scholar]
- Loheide, S.P.; Butler, J.J.; Gorelick, S.M. Estimation of groundwater consumption by phreatophytes using diurnal water table fluctuations: A saturated-unsaturated flow assessment. Water Resour. Res. 2005, 41, 372–380. [Google Scholar] [CrossRef]
- Sanderson, J.S.; Cooper, D.J. Ground water discharge by evapotranspiration in wetlands of an arid intermountain basin. J. Hydrol. 2008, 351, 344–359. [Google Scholar] [CrossRef]
- Lhomme, J.P.; Guilioni, L. On the link between potential evaporation and regional evaporation from a CBL perspective. Theor. Appl. Climatol. 2010, 101, 143–147. [Google Scholar] [CrossRef]
- Hu, S.; Tian, C.; Song, Y.; Chen, X.; Li, Y. Models for calculating phreatic water evaporation on bare and tamarix-vegetated lands. Chin. Sci. Bull. 2006, 51, 43–50. [Google Scholar] [CrossRef]
- Lam, A.; Karssenberg, D.; van den Hurk, B.J.J.M.; Bierkens, M.F.P. Spatial and temporal connections in groundwater contribution to evaporation. Hydrol. Earth Syst. Sci. 2011, 15, 2621–2630. [Google Scholar] [CrossRef] [Green Version]
- Su, L.; Wang, J.; Qin, X.; Wang, Q. Approximate solution of a one-dimensional soil water infiltration equation based on the Brooks-Corey model. Geoderma 2017, 297, 28–37. [Google Scholar] [CrossRef]
- Gomez, M.L.; Aranibar, J.N.; Wuilloud, R. Hydrogeology and hidrogeochemical modeling in phreatic aquifer of NE Mendoza Argentina. J. Iber. Geol. 2014, 40, 521–538. [Google Scholar] [CrossRef]
- Shang, M.T.; Liu, P.G.; Lei, C.; Liu, M.C.; Wu, L. Effect of climate change on the trends of evaporation of phreatic water from bare soil in Huaibei Plain, China. J. Groundwater Sci. Eng. 2017, 5, 213–221. [Google Scholar]
- Zhang, Y.K.; Schilling, K.E. Effects of land cover on water table, soil moisture, evapotranspiration, and groundwater recharge: A field observation and analysis. J. Hydrol. 2006, 319, 328–338. [Google Scholar] [CrossRef]
- Costelloe, J.F.; Irvine, E.C.; Western, A.W.; Tyler, M. Identifying fluvial recharge and artesian upwards leakage contributions to arid zone shallow, unconfined groundwater. Chem. Geol. 2012, 326, 189–200. [Google Scholar] [CrossRef]
- El Fergougui, M.M.; Boutoutaou, D.; Meza, N. Study of evaporation of the water table in arid lands: Case of Ouargla (Algeria). Hydrol. Sci. J. 2017, 62, 1067–1077. [Google Scholar]
- Li, H.S.; Wu, F.S.; Zhan, H.T. The Effect of Precipitation Pulses on Evaporation of Deeply Buried Phreatic Water in Extra-Arid Areas. Vadose Zone. J. 2016, 15. [Google Scholar] [CrossRef]
- Tan, H.; Liu, Z.; Rao, W. Stable isotopes of soil water: Implications for soil water and shallow groundwater recharge in hill and gully regions of the Loess Plateau, China. Agric. Ecosyst. Environ. 2017, 243, 1–9. [Google Scholar] [CrossRef]
- Costelloe, J.F.; Matic, V.; Western, A.W. Determining vertical leakage from the Great Artesian Basin, Australia, through up-scaling field estimates of phreatic evapotranspiration. J. Hydrol. 2015, 529, 1079–1094. [Google Scholar] [CrossRef]
- Costelloe, J.F.; Irvine, E.C.; Western, A.W. Uncertainties around modelling of steady-state phreatic evaporation with field soil profiles of δ18O and chloride. J. Hydrol. 2014, 511, 229–241. [Google Scholar] [CrossRef]
- Hu, S.J.; Lei, J.Q.; Xu, X.W. Theoretical analysis of the limiting rate of phreatic evaporation for Aeolian sandy soil in Taklimakan Desert. Chin. Sci. Bull. 2008, 53, 119–124. [Google Scholar] [CrossRef]
- Hu, S.J.; Zhao, R.F.; Tian, C.Y. Empirical models of calculating phreatic evaporation from bare soil in Tarim river basin, Xinjiang. Environ. Earth. Sci. 2009, 59, 663–668. [Google Scholar] [CrossRef]
- Dam, J.C.V.; Feddes, R.A. Numerical simulation of infiltration, evaporation and shallow groundwater levels with the Richards equation. J. Hydrol. 2000, 233, 72–85. [Google Scholar]
- Chen, X.; Ling, M.H.; Zhou, Q. Numerical modeling the role of rubber dams on groundwater recharge and phreatic evaporation loss in riparian zones. Environ. Earth. Sci. 2012, 65, 345–352. [Google Scholar] [CrossRef]
- Chen, Z.; Nie, Z.; Zhang, G.; Wan, L.; Shen, J. Environmental isotopic study on the recharge and residence time of groundwater in the Heihe River Basin, Northwestern China. Hydrogeol. J. 2016, 14, 1635–1651. [Google Scholar] [CrossRef]
- Ping, W.; Yu, J.; Zhang, Y.; Liu, C. Groundwater recharge and hydrogeochemical evolution in the Ejina Basin, Northwest China. J. Hydrol. 2013, 476, 72–86. [Google Scholar]
- Gates, J.B.; Edmunds, W.M.; Ma, J.; Scanlon, B.R. Estimating groundwater recharge in a cold desert environment in northern China using chloride. Hydrogeol. J. 2008, 16, 893–910. [Google Scholar] [CrossRef]
- Romano, E.; Giudici, M. Experimental and Modeling Study of the Soil-Atmosphere Interaction and Unsaturated Water Flow to Estimate the Recharge of a Phreatic Aquifer. J. Hydrol. Eng. 2007, 12, 573–584. [Google Scholar] [CrossRef]
- Ma, J.; Ding, Z.; Edmunds, W.M.; Gates, J.B.; Huang, T. Limits to recharge of groundwater from Tibetan plateau to the Gobi desert, implications for water management in the mountain front. J. Hydrol. 2008, 364, 128–141. [Google Scholar] [CrossRef]
- Aksenov, V.I.; Bubnov, N.G.; Klinova, G.I.; Iospa, A.V.; Gevorkyan, S.G. Water phase transformations in frozen soil under the effect of cryopegs. Water Resour. 2011, 38, 934–943. [Google Scholar] [CrossRef]
- Li, H.S.; Wang, W.F. Determination and analysis of phreatic water evaporation in extra-arid dune region. Acta Ecol. Sin. 2014, 34, 116–122. [Google Scholar] [CrossRef]
- Li, H.S.; Wang, W.; Liu, B. The daily evaporation characteristics of deeply buried phreatic water in an extremelyarid region. J. Hydrol. 2014, 514, 172–179. [Google Scholar] [CrossRef]
- Li, X.W.; Zhou, J.L.; Jin, M.G.; Liu, Y.F.; Li, Q. Experiments on Evaporation of High-TDS Phreatic Water in an Arid Area. Adv. Mater. Res. 2012, 446–449, 2815–2823. [Google Scholar]
- Li, R.; Shi, H.; Flerchinger, G.N. Modeling the effect of antecedent soil water storage on water and heat status in seasonally freezing and thawing agricultural soils. Geoderma 2013, 206, 70–74. [Google Scholar] [CrossRef]
- Wang, W.; Li, Y.; Yang, F.; Hou, L.; Zhao, G.; Li, J. Experimental and numerical study of coupled flow and heat transport. Proc. Inst. Civ. Eng. Water Manag. Impact Factor 2015, 164, 533–547. [Google Scholar] [CrossRef]
- Bittelli, M.; Ventura, F.; Campbell, G.S.; Campbell, G.S.; Snyder, R.L.; Gallegati, F.; Pisa, P.R. Coupling of heat, water vapor, and liquid water fluxes to compute evaporation in bare soils. J. Hydrol. 2008, 362, 191–205. [Google Scholar] [CrossRef]
- Wang, K.; Wu, M.S.; Zhang, R.D. Water and solute fluxes in soils undergoing freezing and thawing. Soil Sci. 2016, 181, 193–201. [Google Scholar] [CrossRef]
- Min, L.; Shen, Y.; Pei, H.; Jing, B. Characterizing deep vadose zone water movement and solute transport under typical irrigated cropland in the north China plain. Hydrol. Process. 2017, 31, 31. [Google Scholar] [CrossRef]
- Chen, H.; Hu, K.; Nie, Y.; Wang, K. Analysis of soil water movement inside a footslope and a depression in a karst catchment, southwest China. Sci. Rep. 2017, 7. [Google Scholar] [CrossRef] [PubMed]
- Liu, W.; Wang, S.; Luo, W.; Dai, W.; Bai, E. Characteristics of soil water movement in a grass slope in a karst peak-luster region, China. Hydrol. Process. 2017, 31, 1331–1348. [Google Scholar] [CrossRef]
- Watanabe, K.; Kito, T.; Dun, S.; Wu, J.Q.; Greer, R.C.; Flury, M. Water infiltration into a frozen soil with simultaneous melting of the frozen layer. Vadose Zone. J. 2013, 12, 1048–1060. [Google Scholar] [CrossRef]
- Sun, S.M.; Dai, C.L.; Liao, H.C. A Conceptual Model of Soil Moisture Movement in Seasonal Frozen Unsaturated Zone. Appl. Mech. Mater. 2011, 90–93, 2612–2618. [Google Scholar] [CrossRef]
- Miao, C.Y.; Chen, J.F.; Zheng, X.Q.; Zhang, Y.B.; Xu, Y.X.; Du, Q. Soil Water and Phreatic Evaporation in Shallow Groundwater during a Freeze–Thaw Period. Water 2017, 9, 396. [Google Scholar] [CrossRef]
- Chen, J.F.; Zheng, X.Q.; Zang, H.F.; Liu, P.; Sun, M. Numerical Simulation of Moisture and Heat Coupled Migration in Seasonal Freeze-thaw Soil Media. J. Pure Appl. Microbiol. 2013, 7, 151–158. [Google Scholar]
- Zheng, X.Q.; Chen, J.F.; Xing, S.Y. Soil infiltration capacity and infiltration parameters of freezing and thawing soil under different surface coverages. Trans. Chin. Soc. Agric. Eng. 2009, 25, 23–28. [Google Scholar]
- Zheng, X.Q.; Flerchinger, G.N. Infiltration into freezing and thawing soils under different field management. J. Irrig. Drain. Eng. 2001, 127, 176–182. [Google Scholar]
- Li, R.; Shi, H.; Flerchinger, G.N.; Akae, T.; Wang, C. Simulation of freezing and thawing soils in Inner Mongolia Hetao Irrigation District, China. Geoderma 2012, 173, 28–33. [Google Scholar] [CrossRef]
- Zhao, Y.; Si, B.; He, H.; Xu, J.; Peth, S.; Horn, R. Modeling of coupled water and heat transfer in freezing and thawing soils, Inner Mongolia. Water 2016, 8, 424. [Google Scholar] [CrossRef]
- Cheng, Q.; Sun, Y.; Qin, Y.; Xue, X.; Cai, X.; Sheng, W.; Zhao, Y. In situ measuring soil ice content with a combined use of dielectric tube sensor and neutron moisture meter in a common access tube. Agric. For. Meteorol. 2013, 171, 249–255. [Google Scholar] [CrossRef]
- Seyfried, M.S.; Murdock, M.D. Use of air permeability to estimate infiltrability of frozen soil. J. Hydrol. 1997, 202, 95–107. [Google Scholar] [CrossRef]
- Hansson, K.; Šimůnek, J.; Mizoguchi, M.; Lundin, L.C.; van Genuchten, M.T. Water flow and heat transportin frozen soil: Numerical solution and freeze-thaw applications. Vadose Zone J. 2004, 3, 693–704. [Google Scholar]
- Wu, M.; Huang, J.; Wu, J.; Tan, X.; Jansson, P.E. Experimental study on evaporation from seasonally frozen soils under various water, solute and groundwater conditions in Inner Mongolia, China. J. Hydrol. 2016, 535, 46–53. [Google Scholar] [CrossRef]
- Walvoord, M.A.; Striegl, R.G. Increased groundwater to stream discharge from permafrost thawing in the Yukon River basin: Potential impacts on lateral export of carbon and nitrogen. Geophys. Res. Lett. 2007, 34, L12402. [Google Scholar] [CrossRef]
Figure 1.
Average daily air temperature and solar radiation during the three successive freeze–thaw periods (a) from November 2004 to March 2005; (b) from November 2005 to March 2006; and (c) from November 2006 to March 2007.
Figure 1.
Average daily air temperature and solar radiation during the three successive freeze–thaw periods (a) from November 2004 to March 2005; (b) from November 2005 to March 2006; and (c) from November 2006 to March 2007.


Figure 2.
Schematic diagram of a field lysimeter.

Figure 3.
The soil freezing and thawing process at the experimental station during the three successive freeze–thaw periods (a) from 2004 to 2005; (b) from 2005 to 2006; and (c) from 2006 to 2007.
Figure 3.
The soil freezing and thawing process at the experimental station during the three successive freeze–thaw periods (a) from 2004 to 2005; (b) from 2005 to 2006; and (c) from 2006 to 2007.

Figure 4.
Fitting curves between the difference between phreatic evaporation and recharge to groundwater (DPR) and GTDs during freeze–thaw periods (a) sandy loam; (b) fine sand; and (c) sandy soil.
Figure 4.
Fitting curves between the difference between phreatic evaporation and recharge to groundwater (DPR) and GTDs during freeze–thaw periods (a) sandy loam; (b) fine sand; and (c) sandy soil.

Figure 5.
Relationship between the regression coefficient and the average soil particle size.


Table 1.
Precipitation during freeze–thaw periods.
| Freeze–Thaw Period | Year | Precipitation (mm) | |||||||
|---|---|---|---|---|---|---|---|---|---|
| From 2004 to 2005 (2004–2005) | 2004 | 23 November | 24 November | 1 December | 2 December | 21 December | 22 December | ||
| 4.4 | 2.8 | 0.5 | 1.4 | 2 | 2.5 | ||||
| 2005 | 1 January | 25 January | 5 February | 6 February | 7 February | 14 February | 15 February | 17 February | |
| 0.1 | 0.7 | 0.3 | 0.4 | 0.3 | 0.5 | 2.4 | 1.5 | ||
| From 2005 to 2006 (2005–2006) | 2005 | 31 December | |||||||
| 0.3 | |||||||||
| 2006 | 4 January | 19 January | 20 January | 5 February | 27 February | 28 February | |||
| 0.5 | 1.4 | 0.6 | 0.3 | 5.6 | 0.4 | ||||
| From 2006 to 2007 (2006–2007) | 2006 | 23 November | 24 November | 25 November | 27 November | 8 December | 29 December | 30 December | |
| 4.5 | 4.4 | 3.1 | 0.6 | 0.2 | 0.4 | 0.7 | |||
| 2007 | 7 February | 28 February | 4 March | 15 March | |||||
| 6.8 | 0.5 | 3.6 | 0.3 | ||||||
Table 2.
Properties of the soils in the lysimeters.
| Lithology | Mass Percentage of Different Soil Particle Diameter (%) | Average Particle Size (mm) | Maximum Capillary Height (cm) | Porosity (m3·m−3) | Specific Yield (m3·m−3) | Bulk Density (×103 kg·m−3) | ||||
|---|---|---|---|---|---|---|---|---|---|---|
| 0.5–2 mm | 0.25–0.5 mm | 0.1–0.25 mm | 0.05–0.1 mm | <0.05 mm | ||||||
| Sandy Loam | 1.3 | 19.7 | 36.1 | 24.4 | 18.5 | 0.13 | 185 | 0.53 | 0.08 | 1.53 |
| Fine Sand | 1.6 | 22.4 | 45.7 | 24.5 | 5.8 | 0.20 | 77 | 0.45 | 0.12 | 1.61 |
| Sandy Soil | 8.1 | 26.9 | 50.1 | 9.6 | 5.3 | 0.27 | 52 | 0.40 | 0.14 | 1.62 |
Table 3.
Division of soil freezing and thawing stage.
| Soil Freezing and Thawing Stage | From 2004 to 2005 (2004–2005) | From 2005 to 2006 (2005–2006) | From 2006 to 2007 (2006–2007) |
| Unstable Freezing Stage | From 11 November to 24 December 2004 | From 14 November to 2 December 2005 | From 15 November to 4 December 2006 |
| Stable Freezing Stage | From 25 December 2004 to 12 February 2005 | From 3 December 2005 to 1 February 2006 | From 5 December 2006 to 5 February 2007 |
| Thawing Stage | From 13 February to 19 March 2005 | From 2 February to 16 March 2006 | From 6 February to 15 March 2007 |
| Maximum Depth and Time of the Frozen Soil | 60 cm, 6 February 2005 | 52 cm, 17 January 2006 | 50 cm, 18 January 2007 |
Table 4.
Phreatic evaporation of sandy loam during freeze–thaw periods. Unit: Millimeters.
| Freeze–Thaw Period | Data | Groundwater Table Depth (GTD) | ||||||||
|---|---|---|---|---|---|---|---|---|---|---|
| 0.5 m | 1.0 m | 1.5 m | 2.0 m | 2.5 m | 3.0 m | 3.5 m | 4.0 m | 5.0 m | ||
| 2004–2005 | November 2004 | 11.99 | 6.64 | 5.16 | 2.61 | 3.28 | 0.24 | |||
| December 2004 | 27.15 | 17.26 | 8 | 4 | 0.26 | 0.01 | ||||
| January 2005 | 0.39 | 28.5 | 18.67 | 6.52 | 0.44 | 0.13 | ||||
| February 2005 | 0.29 | 6.57 | 5.22 | 8.53 | 0.56 | 2.21 | ||||
| March 2005 | 21.34 | 0.27 | 0.02 | 1.71 | 0.48 | 1.23 | ||||
| Total | 61.16 | 59.24 | 37.07 | 23.37 | 5.02 | 3.82 | ||||
| 2005–2006 | November 2005 | 15.39 | 4.99 | 5.78 | 1.31 | 0.32 | 0.06 | 0.18 | ||
| December 2005 | 17.16 | 24.58 | 10.29 | 5.14 | 0.74 | 0.29 | 0.71 | |||
| January 2006 | 1.89 | 16.15 | 17.76 | 5.62 | 1.64 | 0.18 | 1.09 | |||
| February 2006 | 10.13 | 3.93 | 1.76 | 2.11 | 0.79 | 1.69 | 0.88 | |||
| March 2006 | 8.93 | 1.47 | 0.49 | 0.38 | 0.52 | 1.21 | 0.61 | |||
| Total | 53.5 | 51.12 | 36.08 | 14.56 | 4.01 | 3.43 | 3.47 | |||
| 2006–2007 | November 2006 | 7.77 | 5.35 | 4.74 | 1.25 | 0.61 | 0.26 | 0.12 | 0.06 | 0.06 |
| December 2006 | 21.58 | 22.56 | 10.66 | 4.56 | 1.21 | 0.77 | 0.55 | 0.13 | 0.1 | |
| January 2007 | 2.77 | 9.67 | 17.66 | 5.43 | 1.88 | 1.39 | 1.23 | 0.59 | 0.25 | |
| February 2007 | 12.51 | 3.52 | 1.79 | 1.45 | 0.88 | 0.77 | 0.92 | 0.57 | 0.34 | |
| March 2007 | 5.86 | 0.2 | 0.06 | 1.07 | 0.51 | 0.69 | 0.42 | 0.2 | 0.14 | |
| Total | 50.49 | 41.3 | 34.91 | 13.76 | 5.09 | 3.88 | 3.24 | 1.55 | 0.89 | |
Table 5.
Phreatic evaporation of fine sand during freeze–thaw periods. Unit: Millimeters.
| Freeze–Thaw Period | Data | GTD | |||||||
|---|---|---|---|---|---|---|---|---|---|
| 0.5 m | 1.0 m | 1.5 m | 2.0 m | 3.0 m | 3.5 m | 4.0 m | 5.0 m | ||
| 2004–2005 | November 2004 | 6.95 | 3.39 | 2.62 | 0.39 | 0.01 | |||
| December 2004 | 21.43 | 21.7 | 3.21 | 0.5 | 0.14 | ||||
| January 2005 | 0.12 | 32.75 | 6.79 | 1.44 | 0.57 | ||||
| February 2005 | 0.34 | 1.19 | 3.8 | 0.78 | 0.43 | ||||
| March 2005 | 26.17 | 4.91 | 0.1 | 0.6 | 0.71 | ||||
| Total | 55.01 | 63.94 | 16.52 | 3.71 | 1.86 | ||||
| 2005–2006 | November 2005 | 11.15 | 1.94 | 2.17 | 0.2 | 0 | 0.01 | ||
| December 2005 | 13.25 | 41.92 | 5.07 | 0.49 | 0.17 | 0.48 | |||
| January 2006 | 1.21 | 17.12 | 4.12 | 1.17 | 0.3 | 0.1 | |||
| February 2006 | 5.53 | 3.51 | 1.61 | 0.42 | 1.52 | 0.52 | |||
| March 2006 | 16.34 | 0.35 | 0.76 | 0.12 | 0.23 | 0.13 | |||
| Total | 47.48 | 64.84 | 13.73 | 2.4 | 2.22 | 1.24 | |||
| 2006–2007 | November 2006 | 6.32 | 6.2 | 2.16 | 0.58 | 0.21 | 0.15 | 0.06 | 0.05 |
| December 2006 | 14.39 | 30.1 | 5.3 | 1.44 | 0.57 | 0.36 | 0.15 | 0.13 | |
| January 2007 | 0.78 | 8.16 | 6.69 | 0.85 | 0.85 | 0.45 | 0.26 | 0.23 | |
| February 2007 | 13.04 | 2.88 | 0.06 | 0.29 | 0.22 | 0.15 | 0.11 | 0.12 | |
| March 2007 | 6.89 | 1.51 | 0.04 | 0.12 | 0.21 | 0.12 | 0.06 | 0.05 | |
| Total | 41.42 | 48.85 | 14.25 | 3.28 | 2.06 | 1.23 | 0.64 | 0.58 | |
Table 6.
Phreatic evaporation of sandy soil during freeze–thaw periods. Unit: Millimeters.
| Freeze–Thaw Period | Data | GTD | ||||||
|---|---|---|---|---|---|---|---|---|
| 0.5 m | 1.0 m | 1.5 m | 2.0 m | 2.5 m | 3.0 m | 3.5 m | ||
| 2004–2005 | November 2004 | 8.67 | 3.67 | 0.34 | 0.54 | 0.01 | 0.01 | |
| December 2004 | 13.25 | 13.68 | 0.36 | 0.01 | 0.01 | 0.02 | ||
| January 2005 | 0.23 | 30.86 | 2.19 | 0.43 | 0.44 | 0.34 | ||
| February 2005 | 0.61 | 1.86 | 1.53 | 0.56 | 0.56 | 0.16 | ||
| March 2005 | 22.44 | 0.03 | 1.34 | 0.48 | 0.48 | 0.09 | ||
| Total | 45.2 | 50.1 | 5.76 | 2.02 | 1.5 | 0.62 | ||
| 2005–2006 | November 2005 | 4.5 | 1.27 | 0.73 | 0.09 | 0.04 | 0 | 0 |
| December 2005 | 8.91 | 24.82 | 1.35 | 0.22 | 0.2 | 0.07 | 0.14 | |
| January 2006 | 1.72 | 20.05 | 2.6 | 1.19 | 0.44 | 0.31 | 0.19 | |
| February 2006 | 12.47 | 1.83 | 0.69 | 0.63 | 0.4 | 0.19 | 0.22 | |
| March 2006 | 16.14 | 0.82 | 0.04 | 0.04 | 0.13 | 0.11 | 0.1 | |
| Total | 43.74 | 48.79 | 5.41 | 2.17 | 1.21 | 0.68 | 0.65 | |
| 2006–2007 | November 2006 | 4.02 | 9.31 | 0.56 | 0.55 | 0.25 | 0.03 | 0.02 |
| December 2006 | 8.8 | 19.09 | 1.72 | 0.57 | 0.12 | 0.17 | 0.15 | |
| January 2007 | 0.78 | 6.58 | 1.63 | 0.57 | 0.41 | 0.23 | 0.21 | |
| February 2007 | 14.74 | 1.61 | 1.66 | 0.39 | 0.36 | 0.11 | 0.12 | |
| March 2007 | 7.9 | 0.28 | 0.1 | 0.19 | 0.12 | 0.09 | 0.04 | |
| Total | 36.24 | 36.87 | 5.67 | 2.27 | 1.26 | 0.63 | 0.54 | |
Table 7.
Recharge to phreatic water with sandy loam during freeze–thaw periods. Unit: Millimeters.
| Freeze–Thaw Period | Data | GTD | ||||||||
|---|---|---|---|---|---|---|---|---|---|---|
| 0.5 m | 1.0 m | 1.5 m | 2.0 m | 2.5 m | 3.0 m | 3.5 m | 4.0 m | 5.0 m | ||
| 2004–2005 | November 2004 | 2.63 | 0.5 | 0.02 | 0.13 | 0.27 | 0.38 | |||
| December 2004 | 2.48 | 0 | 0 | 1.04 | 0.69 | 5.12 | ||||
| January 2005 | 0.46 | 0.04 | 0 | 0.53 | 0.78 | 2.87 | ||||
| February 2005 | 0.52 | 0.92 | 0 | 0.58 | 0.69 | 0.78 | ||||
| March 2005 | 9.73 | 19.27 | 15.1 | 5.34 | 0.53 | 1.12 | ||||
| Total | 15.82 | 20.73 | 15.12 | 7.62 | 2.96 | 10.27 | ||||
| 2005–2006 | November 2005 | 0 | 0 | 0 | 0.26 | 0.27 | 3.09 | 3.16 | ||
| December 2005 | 2.59 | 0 | 0 | 0.3 | 0.98 | 2.95 | 3.19 | |||
| January 2006 | 2.48 | 0.18 | 0 | 0 | 0.84 | 2.81 | 0.92 | |||
| February 2006 | 0.84 | 6.19 | 3.2 | 0.18 | 0.71 | 1.55 | 3.22 | |||
| March 2006 | 3.66 | 10.49 | 12.7 | 3.3 | 0.32 | 0.72 | 2.25 | |||
| Total | 9.57 | 16.86 | 15.9 | 4.04 | 3.12 | 11.12 | 12.74 | |||
| 2006–2007 | November 2006 | 0 | 0 | 0 | 0.08 | 0.68 | 0.55 | 0.98 | 2.11 | 2.65 |
| December 2006 | 0 | 0 | 0 | 0.05 | 0.57 | 1.32 | 1.66 | 2.25 | 2.37 | |
| January 2007 | 0.62 | 1.19 | 0.89 | 0.37 | 0.72 | 1.42 | 2.74 | 3.06 | 5.37 | |
| February 2007 | 0.53 | 3.26 | 3.2 | 1.18 | 0.71 | 1.55 | 3 | 2.31 | 3.88 | |
| March 2007 | 9.21 | 10.68 | 14.82 | 3.05 | 0.66 | 2.26 | 2.05 | 1.26 | 1.25 | |
| Total | 10.36 | 15.13 | 18.91 | 4.73 | 3.34 | 7.1 | 10.43 | 10.99 | 15.52 | |
Table 8.
Recharge to phreatic water with fine sand during freeze–thaw periods. Unit: Millimeters.
| Freeze–Thaw Period | Data | GTD | |||||||
|---|---|---|---|---|---|---|---|---|---|
| 0.5 m | 1.0 m | 1.5 m | 2.0 m | 3.0 m | 3.5 m | 4.0 m | 5.0 m | ||
| 2004–2005 | November 2004 | 1.35 | 2.74 | 0.03 | 0.25 | 0.94 | |||
| December 2004 | 5.65 | 0 | 0.06 | 1.45 | 3.4 | ||||
| January 2005 | 3.2 | 0.99 | 0.1 | 0.65 | 1.61 | ||||
| February 2005 | 2.34 | 1.93 | 0.67 | 0.8 | 1.43 | ||||
| March 2005 | 10.0 | 24.02 | 4.12 | 0.71 | 1.64 | ||||
| Total | 22.54 | 29.68 | 4.98 | 3.86 | 9.02 | ||||
| 2005–2006 | November 2005 | 0 | 0 | 0.03 | 0.27 | 1.74 | 3.74 | ||
| December 2005 | 6.25 | 0 | 0.01 | 0.72 | 1.95 | 2.58 | |||
| January 2006 | 4.09 | 0.15 | 0 | 0.37 | 1.71 | 1.47 | |||
| February 2006 | 0.43 | 19.12 | 3.57 | 0.39 | 1.33 | 2.84 | |||
| March 2006 | 4.25 | 16.81 | 1.61 | 0.36 | 1.61 | 0.92 | |||
| Total | 15.02 | 36.08 | 5.22 | 2.11 | 8.34 | 11.55 | |||
| 2006–2007 | November 2006 | 2.48 | 0.23 | 0 | 0.2 | 1.34 | 1.82 | 1.5 | 2.99 |
| December 2006 | 0 | 0.81 | 0 | 0.01 | 1.89 | 2.73 | 3.25 | 3.64 | |
| January 2007 | 4.09 | 0.99 | 0.03 | 0.65 | 1.61 | 2.74 | 2.6 | 5.75 | |
| February 2007 | 1.03 | 12.13 | 0.67 | 0.8 | 1.43 | 2.3 | 2.23 | 3.21 | |
| March 2007 | 4.26 | 12.37 | 1.74 | 1.36 | 0.56 | 1.05 | 1.24 | 1.44 | |
| Total | 11.86 | 26.53 | 2.44 | 3.02 | 6.83 | 10.64 | 10.82 | 17.03 | |
Table 9.
Recharge to phreatic water with sandy soil during freeze–thaw periods. Unit: Millimeters.
| Freeze–Thaw Period | Data | GTD | ||||||
|---|---|---|---|---|---|---|---|---|
| 0.5 m | 1.0 m | 1.5 m | 2.0 m | 2.5 m | 3.0 m | 3.5 m | ||
| 2004–2005 | November 2004 | 0.2 | 0.06 | 0.01 | 0.31 | 0.72 | 0.96 | |
| December 2004 | 6.96 | 0 | 1.65 | 1.92 | 2.62 | 1.32 | ||
| January 2005 | 3.22 | 0 | 0 | 0.1 | 0.79 | 0.16 | ||
| February 2005 | 3.3 | 5.29 | 0 | 0.25 | 0.65 | 0.11 | ||
| March 2005 | 5.08 | 18.99 | 0.27 | 0.28 | 0.58 | 1.82 | ||
| Total | 18.76 | 24.34 | 1.93 | 2.86 | 5.36 | 4.37 | ||
| 2005–2006 | November 2005 | 0 | 0 | 0 | 0.8 | 2.21 | 3.47 | 3.81 |
| December 2005 | 7.74 | 0 | 0 | 0 | 0.92 | 1.02 | 2.46 | |
| January 2006 | 5.89 | 0.1 | 0.1 | 0.01 | 0.96 | 1.64 | 1.93 | |
| February 2006 | 4.3 | 21.03 | 0 | 0.52 | 1.04 | 1.19 | 2.02 | |
| March 2006 | 1.05 | 3.52 | 0.47 | 0.75 | 0.95 | 0.1 | 0.22 | |
| Total | 18.98 | 24.65 | 0.57 | 2.08 | 6.08 | 7.42 | 10.44 | |
| 2006–2007 | November 2006 | 3.12 | 0.04 | 0.08 | 0.34 | 1.26 | 2.59 | 1.53 |
| December 2006 | 0 | 0 | 0 | 0.01 | 0.46 | 1.36 | 4.94 | |
| January 2007 | 7.28 | 0 | 0 | 0.06 | 0.72 | 0.32 | 1.93 | |
| February 2007 | 2.02 | 5.56 | 0.76 | 0.65 | 0.43 | 1.39 | 2.02 | |
| March 2007 | 4.58 | 13.01 | 2.5 | 1.34 | 0.7 | 1.57 | 0.47 | |
| Total | 17.0 | 18.61 | 3.34 | 2.4 | 3.57 | 7.23 | 10.89 | |
Table 10.
Results of the difference between phreatic evaporation and recharge to groundwater with sandy loam during freeze–thaw periods. Unit: Millimeters.
Table 10.
Results of the difference between phreatic evaporation and recharge to groundwater with sandy loam during freeze–thaw periods. Unit: Millimeters.
| Freeze–Thaw Period | Period | GTD | ||||||||
|---|---|---|---|---|---|---|---|---|---|---|
| 0.5 m | 1.0 m | 1.5 m | 2.0 m | 2.5 m | 3.0 m | 3.5 m | 4.0 m | 5.0 m | ||
| 2004–2005 | Freezing | −34.11 | −57.27 | −36.86 | −14.47 | −2.46 | 7.69 | |||
| Thawing | −11.23 | 18.76 | 14.91 | −1.28 | 0.4 | −1.24 | ||||
| Total | −45.34 | −38.51 | −21.95 | −15.75 | −2.06 | 6.45 | ||||
| 2005–2006 | Freezing | −29.42 | −45.99 | −24.97 | −12.38 | −0.66 | 8.09 | 5.29 | ||
| Thawing | −14.51 | 11.73 | 4.79 | 1.86 | −0.23 | −0.4 | 3.98 | |||
| Total | −43.93 | −34.26 | −20.18 | −10.52 | −0.89 | 7.69 | 9.27 | |||
| 2006–2007 | Freezing | −31.81 | −47.16 | −32.68 | −11.51 | −1.79 | 0.87 | 3.48 | 6.64 | 9.98 |
| Thawing | −8.32 | 20.99 | 16.68 | 2.48 | 0.04 | 2.35 | 3.71 | 2.8 | 4.65 | |
| Total | −40.13 | −26.17 | −16 | −9.03 | −1.75 | 3.22 | 7.19 | 9.44 | 14.63 | |
| Average | −43.13 | −32.98 | −19.38 | −11.77 | −1.57 | 5.79 | 8.23 | 9.44 | 14.63 | |
Table 11.
Results of the difference between phreatic evaporation and recharge to groundwater with fine sand during freeze–thaw periods. Unit: Millimeters.
Table 11.
Results of the difference between phreatic evaporation and recharge to groundwater with fine sand during freeze–thaw periods. Unit: Millimeters.
| Freeze–Thaw Period | Period | GTD | |||||||
|---|---|---|---|---|---|---|---|---|---|
| 0.5 m | 1.0 m | 1.5 m | 2.0 m | 3.0 m | 3.5 m | 4.0 m | 5.0 m | ||
| 2004–2005 | Freezing | −18.33 | −54.29 | −16 | −0.27 | 5.23 | |||
| Thawing | −14.14 | 20.03 | 4.46 | 0.42 | 1.93 | ||||
| Total | −32.47 | −34.26 | −11.54 | 0.15 | 7.16 | ||||
| 2005–2006 | Freezing | −15.39 | −61.51 | −11.62 | −0.55 | 4.93 | 7.2 | ||
| Thawing | −17.07 | 32.75 | 3.11 | 0.26 | 1.19 | 3.11 | |||
| Total | −32.46 | −28.76 | −8.51 | −0.29 | 6.12 | 10.31 | |||
| 2006–2007 | Freezing | −14.92 | −42.93 | −14.14 | −2.08 | 3.21 | 6.33 | 6.88 | 11.97 |
| Thawing | −14.64 | 20.61 | 2.33 | 1.82 | 1.56 | −1.56 | 2.53 | −1.79 | |
| Total | −29.56 | −22.32 | −11.81 | −0.26 | 4.77 | 9.41 | 10.18 | 16.45 | |
| Average | −31.50 | −28.45 | −10.62 | −0.13 | 6.02 | 9.86 | 10.18 | 16.45 | |
Table 12.
Results of the difference between phreatic evaporation and recharge to groundwater with sandy soil during freeze–thaw periods. Unit: Millimeters.
Table 12.
Results of the difference between phreatic evaporation and recharge to groundwater with sandy soil during freeze–thaw periods. Unit: Millimeters.
| Freeze–Thaw Period | Period | GTD | ||||||
|---|---|---|---|---|---|---|---|---|
| 0.5 m | 1.0 m | 1.5 m | 2.0 m | 2.5 m | 3.0 m | 3.5 m | ||
| 2004–2005 | Freezing | −11.93 | −48.83 | −2.0 | 1.13 | 3.45 | 2.07 | |
| Thawing | −14.51 | 23.07 | −1.83 | −0.29 | 0.41 | 1.68 | ||
| Total | −26.44 | −25.76 | −3.83 | 0.84 | 3.86 | 3.75 | ||
| 2005–2006 | Freezing | −1.76 | −47.13 | −4.73 | −0.98 | 3.39 | 5.75 | 7.87 |
| Thawing | −23 | 22.99 | −0.11 | 0.89 | 1.48 | 0.99 | 1.92 | |
| Total | −24.76 | −24.14 | −4.84 | −0.09 | 4.87 | 6.74 | 9.79 | |
| 2006–2007 | Freezing | −3.2 | −35.35 | −4.16 | −1.34 | 1.59 | 3.84 | 8.02 |
| Thawing | −16.04 | 17.09 | 1.83 | 1.47 | 0.72 | −1.53 | −1.42 | |
| Total | −19.24 | −18.26 | −2.33 | 0.13 | 2.31 | 6.6 | 10.35 | |
| Average | −23.48 | −22.72 | −3.67 | 0.29 | 3.68 | 5.70 | 10.07 | |
Table 13.
The regression coefficient and significance test of the regression equation.
| Soil Texture | Regressive Coefficient | Significance Test of Regression Equation | |||||||||
|---|---|---|---|---|---|---|---|---|---|---|---|
| Deviation | Degrees of Freedom | Mean Square Deviation | F | ||||||||
| A | B (mm) | Qreg. (mm) | Qres. (mm) | Qtatal (mm) | p | n − p − 1 | n − 1 | Sreg. (mm) | Sres (mm) | ||
| Sandy Loam | 27.404 | −28.165 | 3238.111 | 74.740 | 3312.851 | 1 | 7 | 8 | 3238.111 | 10.677 | 303.275 |
| Fine Sand | 22.737 | −19.874 | 2211.305 | 111.071 | 2322.375 | 1 | 6 | 7 | 2211.305 | 18.512 | 119.454 |
| Sandy Soil | 18.852 | −14.196 | 1000.006 | 98.773 | 1098.779 | 1 | 5 | 6 | 1000.006 | 19.755 | 50.621 |
© 2018 by the authors. Licensee MDPI, Basel, Switzerland. This article is an open access article distributed under the terms and conditions of the Creative Commons Attribution (CC BY) license (http://creativecommons.org/licenses/by/4.0/).
Share and Cite
MDPI and ACS Style
Chen, J.; Gao, X.; Zheng, X.; Miao, C.; Liu, P.; Du, Q.; Xu, Y. Transformation between Phreatic Water and Soil Water during Freeze–Thaw Periods. Water 2018, 10, 376. https://doi.org/10.3390/w10040376
AMA Style
Chen J, Gao X, Zheng X, Miao C, Liu P, Du Q, Xu Y. Transformation between Phreatic Water and Soil Water during Freeze–Thaw Periods. Water. 2018; 10(4):376. https://doi.org/10.3390/w10040376
Chicago/Turabian StyleChen, Junfeng, Xuguang Gao, Xiuqing Zheng, Chunyan Miao, Ping Liu, Qi Du, and Yongxin Xu. 2018. "Transformation between Phreatic Water and Soil Water during Freeze–Thaw Periods" Water 10, no. 4: 376. https://doi.org/10.3390/w10040376
Note that from the first issue of 2016, this journal uses article numbers instead of page numbers. See further details here.