Nitrate Attenuation in Degraded Peat Soil-Based Constructed Wetlands


1
Faculty of Agricultural and Environmental Sciences, University of Rostock, Justus-von-Liebig-Weg 6, 18059 Rostock, Germany
2
Ecohydrology Research Group, Water Institute and Department of Earth and Environmental Sciences, University of Waterloo, 200 University Avenue West, Waterloo, ON N2L 3G1, Canada
3
Baltic TRANSCOAST Research Training Group, Interdisciplinary Faculty, University of Rostock, 18059 Rostock, Germany
*
Author to whom correspondence should be addressed.
Water 2018, 10(4), 355; https://doi.org/10.3390/w10040355
Submission received: 20 February 2018
/
Revised: 14 March 2018
/
Accepted: 20 March 2018
/
Published: 22 March 2018
(This article belongs to the Special Issue Wetlands for the Treatment of Agricultural Drainage Water)
Abstract
:Constructed wetlands (CWs) provide favorable conditions for removing nitrate from polluted agricultural runoff via heterotrophic denitrification. Although the general operability of CWs has been shown in previous studies, the suitability of peat soils as a bed medium for a vertical flow through a system for nitrate attenuation has not been proven to date. In this study, a mesocosm experiment was conducted under continuous flow with conditions aiming to quantify nitrate (NO3−) removal efficiency in degraded peat soils. Input solution of NO3− was supplied at three different concentrations (65, 100, and 150 mg/L). Pore water samples were collected at different depths and analyzed for NO3−, pH, and dissolved N2O concentrations. The redox potential (Eh) was registered at different depths. The results showed that the median NO3-N removal rate was 1.20 g/(m2·day) and the median removal efficiency was calculated as 63.5%. The nitrate removal efficiency was affected by the NO3− supply load, flow rate, and environmental boundary conditions. A higher NO3− removal efficiency was observed at an input NO3− concentration of 100 mg/L, a lower flow rate, and higher temperature. The results of pore water pH and NO3− and N2O levels from the bottom of the mesocosm suggest that N2 is the dominant denitrification product. Thus, degraded peat soils showed the potential to serve as a substrate for the clean-up of nitrate-laden agricultural runoff.
1. Introduction
Nitrogen (N) is an important nutrient in terrestrial and aquatic ecosystems. Around 120 million tons of nitrogen gases (N2) per year are converted worldwide from the atmosphere into reactive nitrogen forms such as ammonium and nitrate by mineral fertilizer production and N-fixation by leguminous crops [1]. Most of the nitrogen reaching the terrestrial environment (directly or indirectly) is dissolved in surface runoff and infiltrating water. Regardless of the environmental compartment into which reactive N is released, much of the transported load ends up as NO3-N in the aquatic environment [2]. Especially in lowland catchments with intensive agriculture, NO3-N loads from agricultural fields may easily exceed 2000 kg/(km2·year), impacting drinking water quality [3]. In the German lowlands, the average NO3-N losses from tile-drained field sites were found to vary between 340 and 2180 kg/(km2·year) [4].
Constructed wetlands (CWs) are often established as engineered systems to remove nitrate (i.e., denitrification) in wastewater or agricultural runoff by microbial denitrification and plant uptake [5]. Denitrification is an anaerobic respiration process in which nitrogenous oxides, principally NO3− and NO2−, are used as terminal electron acceptors and are hence reduced into the gaseous products nitric oxide (NO), nitrous oxide (N2O), and dinitrogen (N2) [6]. CWs generally consist of designed basins containing water, substrates, and plants. The type of substrates are important in CWs, because they provide storage capacity for contaminates via adsorption processes; in addition, many chemical and biological transformation processes occur at the surfaces of the various substrates. Wood products such as chips are commonly employed as denitrification beds in constructed wetlands due to the low cost and high C:N ratio (30:1 to 300:1, depending on the wood materials) [7,8,9]. Several other substrates, such as maize cobs and wheat straw, have also been proved suitable as denitrification beds [10]. Peat soils have a relatively low permeability and high organic carbon content, which will enhance the residence time of solutes or wastewater [11,12]. Thus, peat soils could potentially serve as denitrification beds for CWs. However, there are few studies about the performance of peat soils as denitrification bed materials [13,14,15,16].
Peatlands only cover 3% of the total global land area but store about one-third of the world’s soil carbon. Drainage of peatland results in aeration and degradation of the peat, leading to the emission of greenhouse gases (e.g., CO2) and losses of organic carbon [17]. For instance, greenhouse gas emissions of a peatland in Mecklenburg–Western Pomerania (northeast Germany) was estimated to be about 6.2 million tonnes of CO2 equivalent per year [18]. Rewetting of peatlands is an effective practice to reduce greenhouse gas emissions, but may not affect nitrogen dynamics [19]. The uppermost highly degraded peat layers are recommended to be removed before any peatland restoration, because they will further release large amounts of organic compounds (e.g., dissolved organic carbon) into the downstream water bodies [20]. It has been reported that peat soils have a large amount of dead-end or closed pore volumes ranging from 40 to 80 vol % of total pore spaces [21,22,23]. Large numbers of immobile pores can be found in oxygen-depleted water regions, providing a favorable region for denitrification [15]. Highly degraded peat samples have been shown to have a high fraction of small (or immobile) pore regions [24], which can increase the denitrification activities. They can thus can be used as a suitable substrate for nitrate attenuation in CWs. This could be especially interesting in landscapes with scattered spots of fen peat. These local small-scale drained peatlands and wetlands have often been unsuccessfully converted into crops or grasslands, and may serve in the future as CWs for the cleanup of agricultural runoff [15,25].
In this study, we use a mesocosm experiment setup under controlled flux conditions to investigate the NO3− turnover processes in a lowland fen with highly degraded peat soils (soil organic matter content of 55% by weight) and examine the suitability of degraded peat for denitrification beds. The objectives of the study were: (1) to quantify the nitrate removal rate and efficiency under continuous flow conditions over a long-term period; (2) to explore the factors affecting the nitrate removal efficiency in peat soils; and (3) to evaluate the possibility of using degraded peat as filter medium in a constructed wetland to reduce nitrates from agricultural runoff.
2. Materials and Methods
2.1. Field Site and Sampling
The peat for the mesocosm experiment was collected from a small fen at Dummerstorf, 15 km southeast of the city of Rostock, Germany. It is a typical drained peatland in northern Germany with a highly degraded peat top soil. The soil carbon content of the top soil is 33.0% by weight [15,26]. The uppermost highly degraded peat was removed (0–20 cm depths) and transported to a greenhouse at the University of Rostock for the mesocosm experiment. The peat sample was homogenized manually (not sieved to maintain stable aggregates) using a clean rod, and any field-grown plant roots were removed. The peat material originated from a field, which is subjected to regular plowing; we thus assume that the mesocosm setup with homogenized peat material still reflects field conditions [15]. Homogenization was considered necessary to prevent the establishment of preferential flow paths and ensure the validity of the study.
2.2. Mesocosm Experimental Setup
To simulate a vertical flow through constructed wetland with open surface water, a container (polyethylene box) with dimensions of 100 cm length × 50 cm height × 30 cm width was used as experimental vessel (Figure 1). Drainage was facilitated through a 4-cm-thick layer of gravel at the bottom of the container, covered with a geo-textile membrane. Peat soil with field moisture content was filled into the container and the redox probes were installed vertically at different depths during the filling procedure. The depth of the peat in the mesocosm was 40 cm, with a total volume of 0.12 m³. Bulk density was adjusted according to field conditions. The space above the peat was used to maintain a surface water table of 3 to 4 cm above the soil. The mesocosm container with peat soil was saturated from the bottom to minimize and remove the entrapped air from the peat, and during the experiments, the flow direction followed the gravimetric potential from top to bottom. The design of the flow through vessel corresponded to a constructed vertical flow wetland with an open water surface, as can be established in tile-drained landscapes where small scale fens often develop in local depressions.
The input solution (pH = 7) contained 244 mg/L potassium nitrate (KNO3) with three different NO3− concentrations adjusted to 65, 100, and 150 mg/L. An NO3− concentration of 65 mg/L (N65) was chosen to represent the average annual NO3− concentration in the ditch near the peat excavation site [27]. NO3− concentrations of 100 mg/L (N100) and 150 mg/L (N150) represented two and three times the threshold given in the standard drinking water guidelines (50 mg/L [28]), respectively. The turnover experiment was conducted from April to August 2011. N65 was firstly applied, application continued for 50 days, and then the N100 was continuously applied for 28 days. After that, the concentration was shifted to N150 and maintained for 42 days. Water sampling along the flow path was performed after the turnover experiment.
The flow rate (Q) for the entire experiment was maintained at about 24 liters per day (with a flux of about 8 cm/day; q = Q/A, A is the cross-sectional area of the bed container) and was adjusted by varying the hydraulic head. A self-constructed tipping counter, converting an effluent volume of 0.07 liter into an electric pulse, registered the flow rate. The redox potential Eh (mV) was measured at −5, −10, −15, −20, −25, and −30 cm depths below the peat surface by using custom-made 6-mm-diameter redox platinum electrodes (Sentec Ltd. Braintree, Essex, UK) connected to a Delta T DL2e data logger (Delta T Devices Ltd., Cambridge, UK). The measured values were corrected to the standard hydrogen potential E0 (mV) by adding the temperature-corrected voltage of the reference electrode according to the manufacturer´s specifications. The temperature was additionally registered in the container with a Pt100 resistor-type temperature sensor (Ziehl industrie-elektronik GmbH, Schwaebisch Hall, Germany). More details about a similar mesocosm experimental setup can be found in Kleimeier et al. [15].
2.3. Pore Water Sampling
Six micro-piezometers (8-mm PVC pipes) were installed along the flow-path of the mesocosm for the pore water sampling at different depths. Piezometers were mounted horizontally into the peat-body in 5-cm intervals along the central flow path with Teflon gasket tape. The effluent sampling was performed automatically in 12-h intervals, using an ISCO 6712 automated portable sampler (Teledyne Isco Inc., Lincoln, NE, USA). The sampling ports were water- and gas-tight, not interfering with the adjusted flow rate.
The water and gas samples along the flow path were sampled with a 50-mL Braun Perfusor syringe (Carl Roth GmbH, Karlsruhe, Germany), 0.45-µm syringe-filters (Carl Roth GmbH, Karlsruhe, Germany), and a drip-infusion bag containing nitrogen gas. A syringe was connected to the piezometer (via a flexible extension tube, Carl Roth GmbH, Karlsruhe, Germany) to extract 50 mL of gas containing pore water. The sample (25 mL) was transferred into a second syringe, passing through the 0.45-µm filter. Immediately thereafter, 25 mL of N2-gas were added to the syringe to create an anaerobic headspace via a 3-way luer-lock valve. The water samples were degassed by a 90-s ultrasonic treatment immediately after the sampling. The water sample was then transferred into 30-mL PE flasks, gassed with N2 (to maintain the anaerobic state), and stored at 4 °C until analysis. The gas-phase was transferred into two 10-mL Exetainers (Labco, Ltd., Lampeter, Wales, UK), and analyzed for N2O using a gas chromatograph (Shimadzu Europa GmbH, Kyoto, Japan). The content of dissolved gas was calculated using Henry´s law. In addition, for the water samples, nitrate (NO3−) concentrations were analyzed with an iron chromatograph (METROHM IC 700, Metrohm GmbH & Co. KG Filderstadt, Filderstadt, Germany).
2.4. Parameters and Statistical Analyses
The input NO3-Nload and nitrate removal rate (NO3-NR) are given in consumed mass per unit of time and area, g/(m2·day).
where Cin is the inflow solution concentration (mg/L); Q is the flow rate (L/day); A is the cross-sectional area of the mesocosm system (m2); and ΔC is the difference between the inflow and effluent (Cout) concentrations. The nitrate removal efficiency (Neffi) was calculated as follows:
In order to derive a statistical model that represents the observed nitrate removal rate and efficiency as a function of environmental parameters (temperature, flow rate, and redox potential), the redox potential was grouped into three redox zones: zone 1, aerobic (>500 mV); zone 2, anoxic (150 mV < Eh < 500 mV); and zone 3, anaerobic (Eh < 150 mV) [15,29]. It was intended to calculate the thickness of the soil layer having anoxic or anaerobic conditions over the investigated time (cm/day, namely as the thickness and time duration of redox zone (TDzone). Thus, TDzone1, TDzone2, and TDzone3 represent the thickness and time duration of redox zone 1, zone 2, and zone 3, respectively. Non-parametric Kruskal–Wallis [30] tests were performed to analyze whether nitrate removal rate, efficiency, and environmental parameters differed significantly among the three different nitrate input stages. To reveal the influence of nitrate load and environmental parameters on nitrate removal rate and efficiency, a stepwise linear regression analysis was conducted and all statistical analyses and modeling were performed using the default “stats” package of R [31].
3. Results
3.1. Nitrate Turnover
The amount of nitrate (NO3-N) applied in the various stages of the experiment ranged from 0.30 to 3.91 g/(m2·day) as determined on a daily basis analysis. The highest average input loading of 2.66 g/(m2·day) NO3-N was observed for the N150 experimental stage. The median NO3-N removal rate over the whole experiment was measured as 1.20 g/(m2·day) (Table 1). Removal efficiency of the entire mesocosm was 63.5%. The median value of difference between nitrate input and effluent concentrations (ΔC, Cinput-Coutput) was 64.0 mg/L. Although three nitrate concentrations (N65, N100, and N150) were supplied into the mesocosm, there was no significant difference in nitrate removal rate between N65, N100, and N150, whereas significances in nitrate load, NO3-N removal efficiency, and ΔC were observed (Table 1). A higher ΔC was observed at N100. The lowest nitrate removal efficiency occurred at N150 with an average value of 49.0%. With decreases in the applied nitrate concentration to N100 and N65, the nitrate removal efficiency increased to 83.0% and 72.7%, respectively.
3.2. Environmental Factors
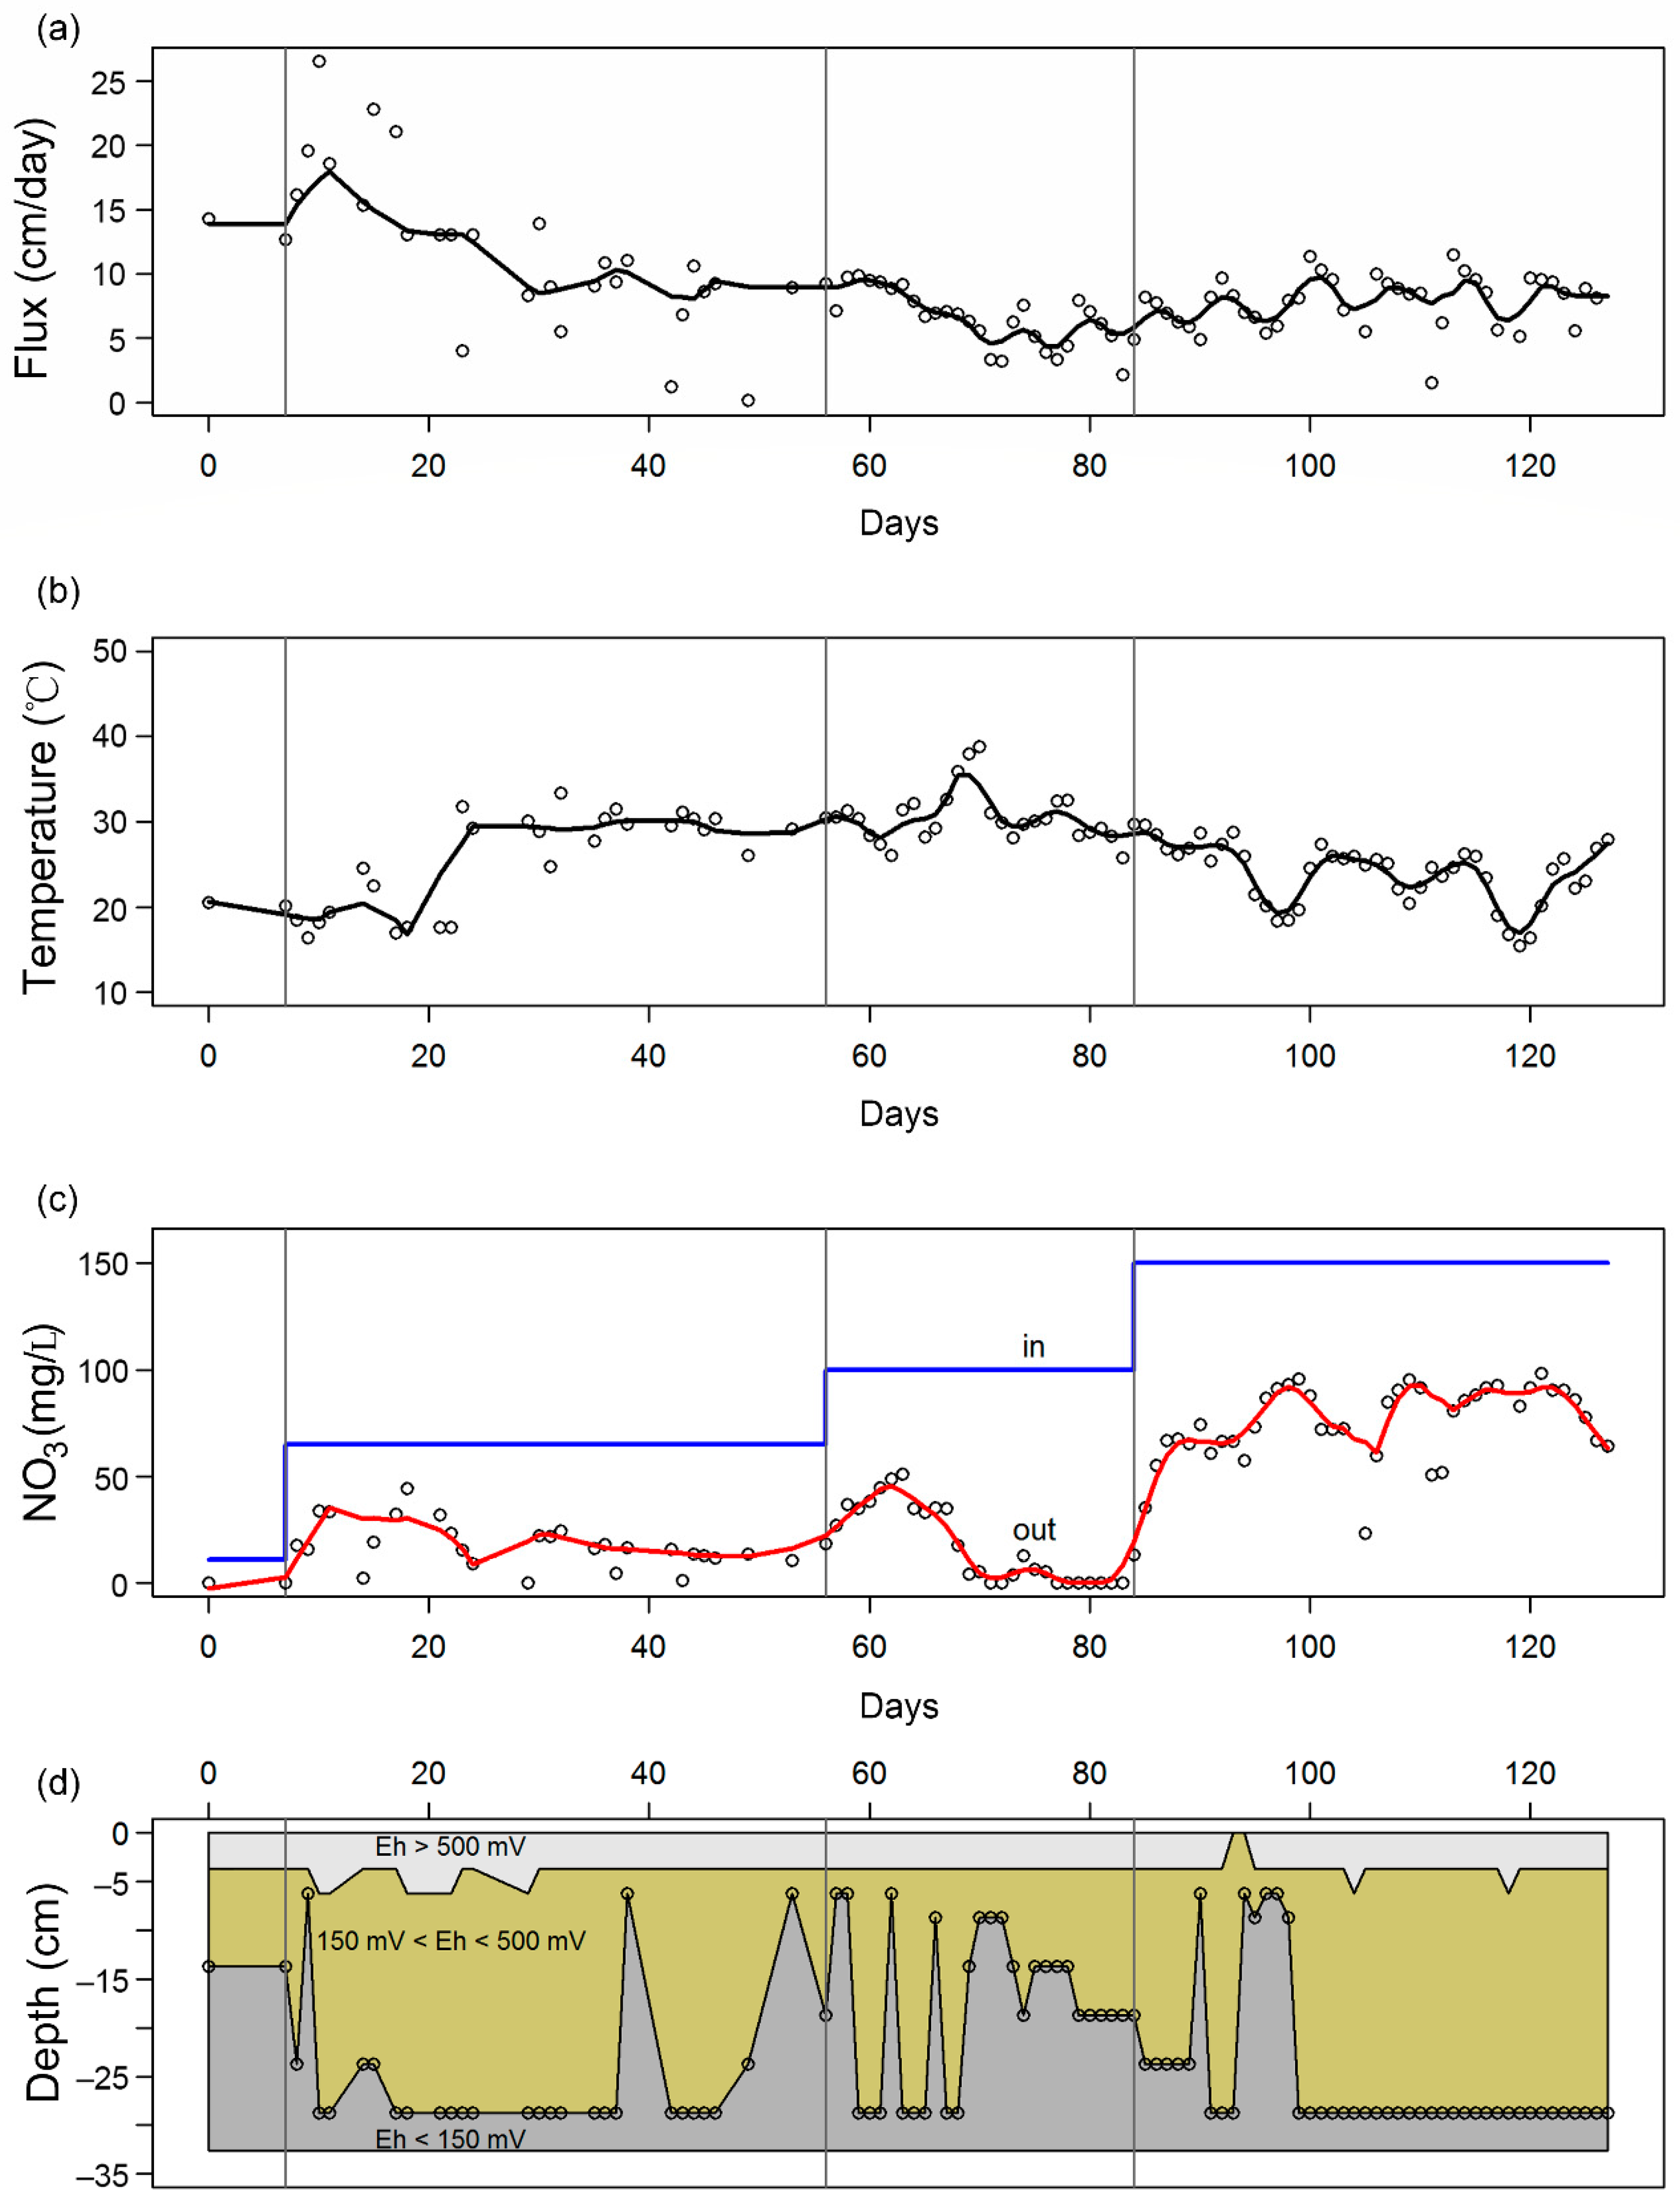
Temporal variation of the temperature and fluxes over the entire experimental period are illustrated in Figure 2. The mean volumetric flow was 25.8 L/day with a standard deviation of 12.9 L/day. The mean temperature was 26.2 °C and varied between daily average values of 15.5 °C and 38.8 °C over the 120 days of the experiment. A redox potential of less than 500 mV was observed at 5 cm soil depth and remained almost constant over the entire experiment period (Figure 2). Redox potentials at 5 to 15 cm depth ranged from 150 mV to 500 mV. Below a 30-cm depth, the redox potential remained under 150 mV over the observation period.
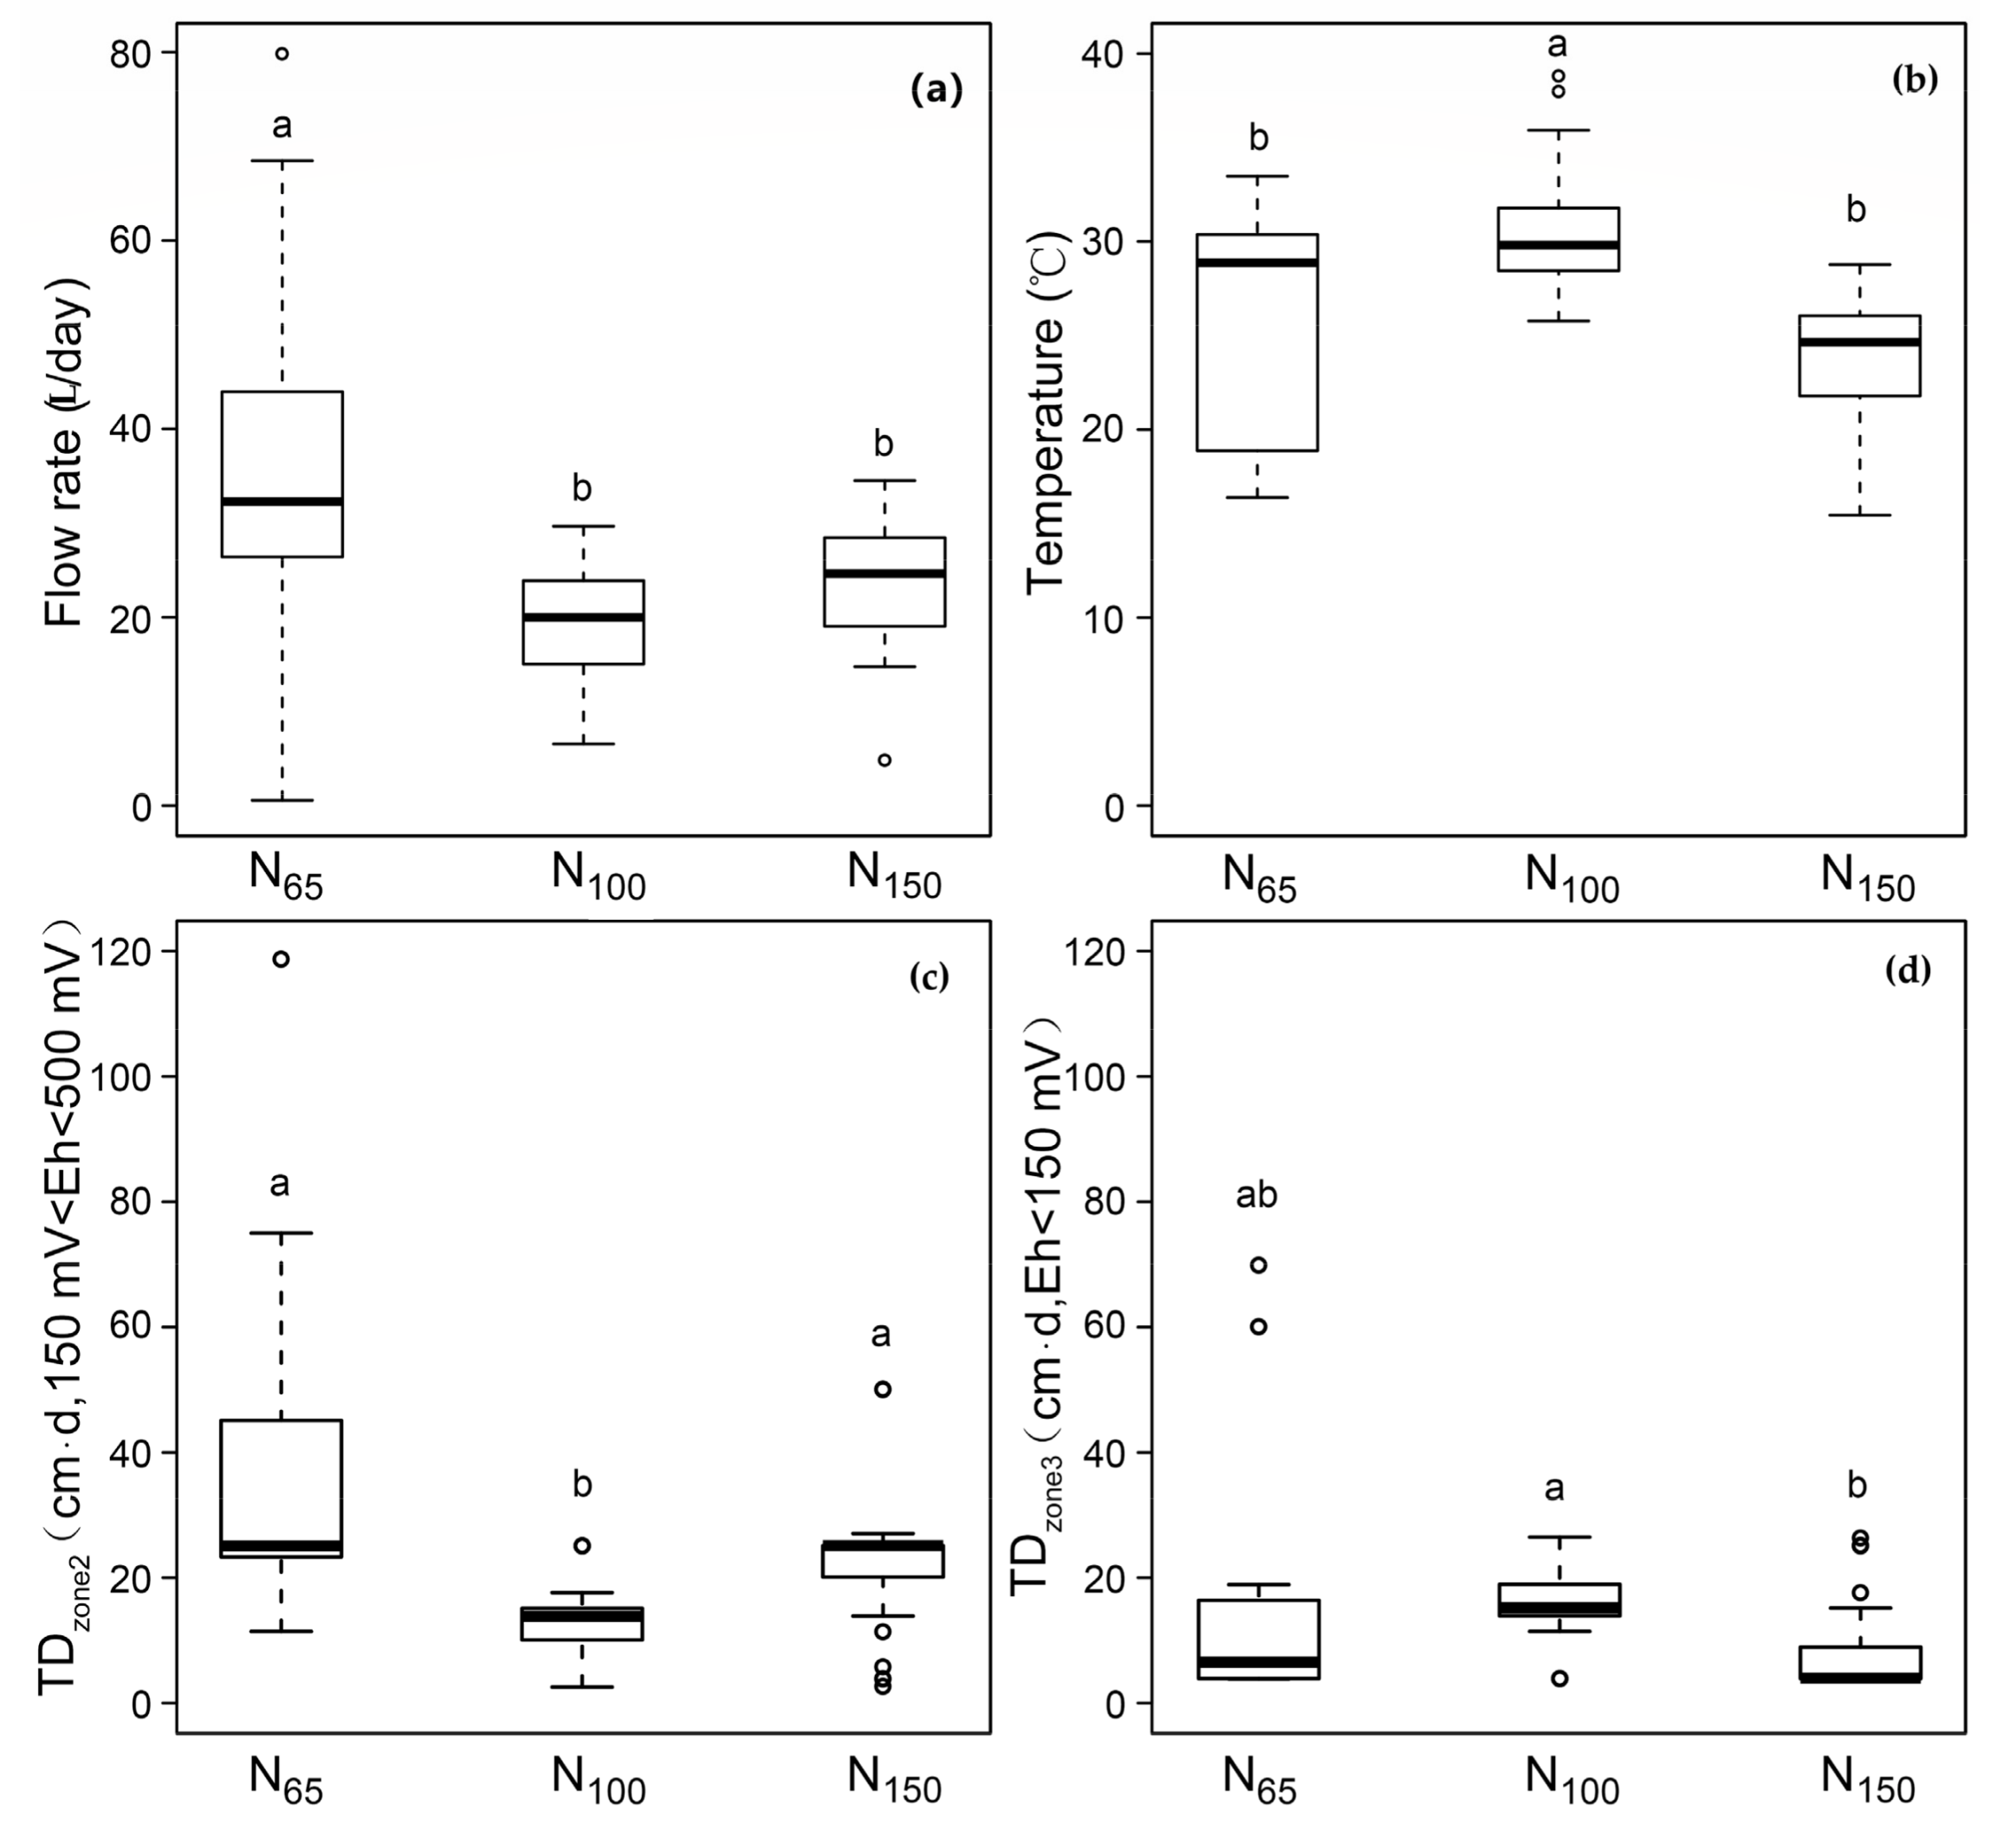
The temperature and flux varied between the three experimental stages of N65, N100, and N150 inputs (Figure 3). The flow rates at N65 were significantly higher than those at N100 and N150, although we intended to maintain a constant flow rate. The average temperature for the N100 stage was 30.5 °C, which was higher than that at N65 (25.6 °C) and N150 (23.8 °C). No significant differences in the thickness and time duration of the redox zone Eh < 500 mV among N65, N100, and N150 were detected. For denitrification zones (150 mV < Eh < 500 mV and Eh < 150 mV), the lowest values of TDzone2 and TDzone3 were observed in N100 and N150 stages, respectively (Figure 3).
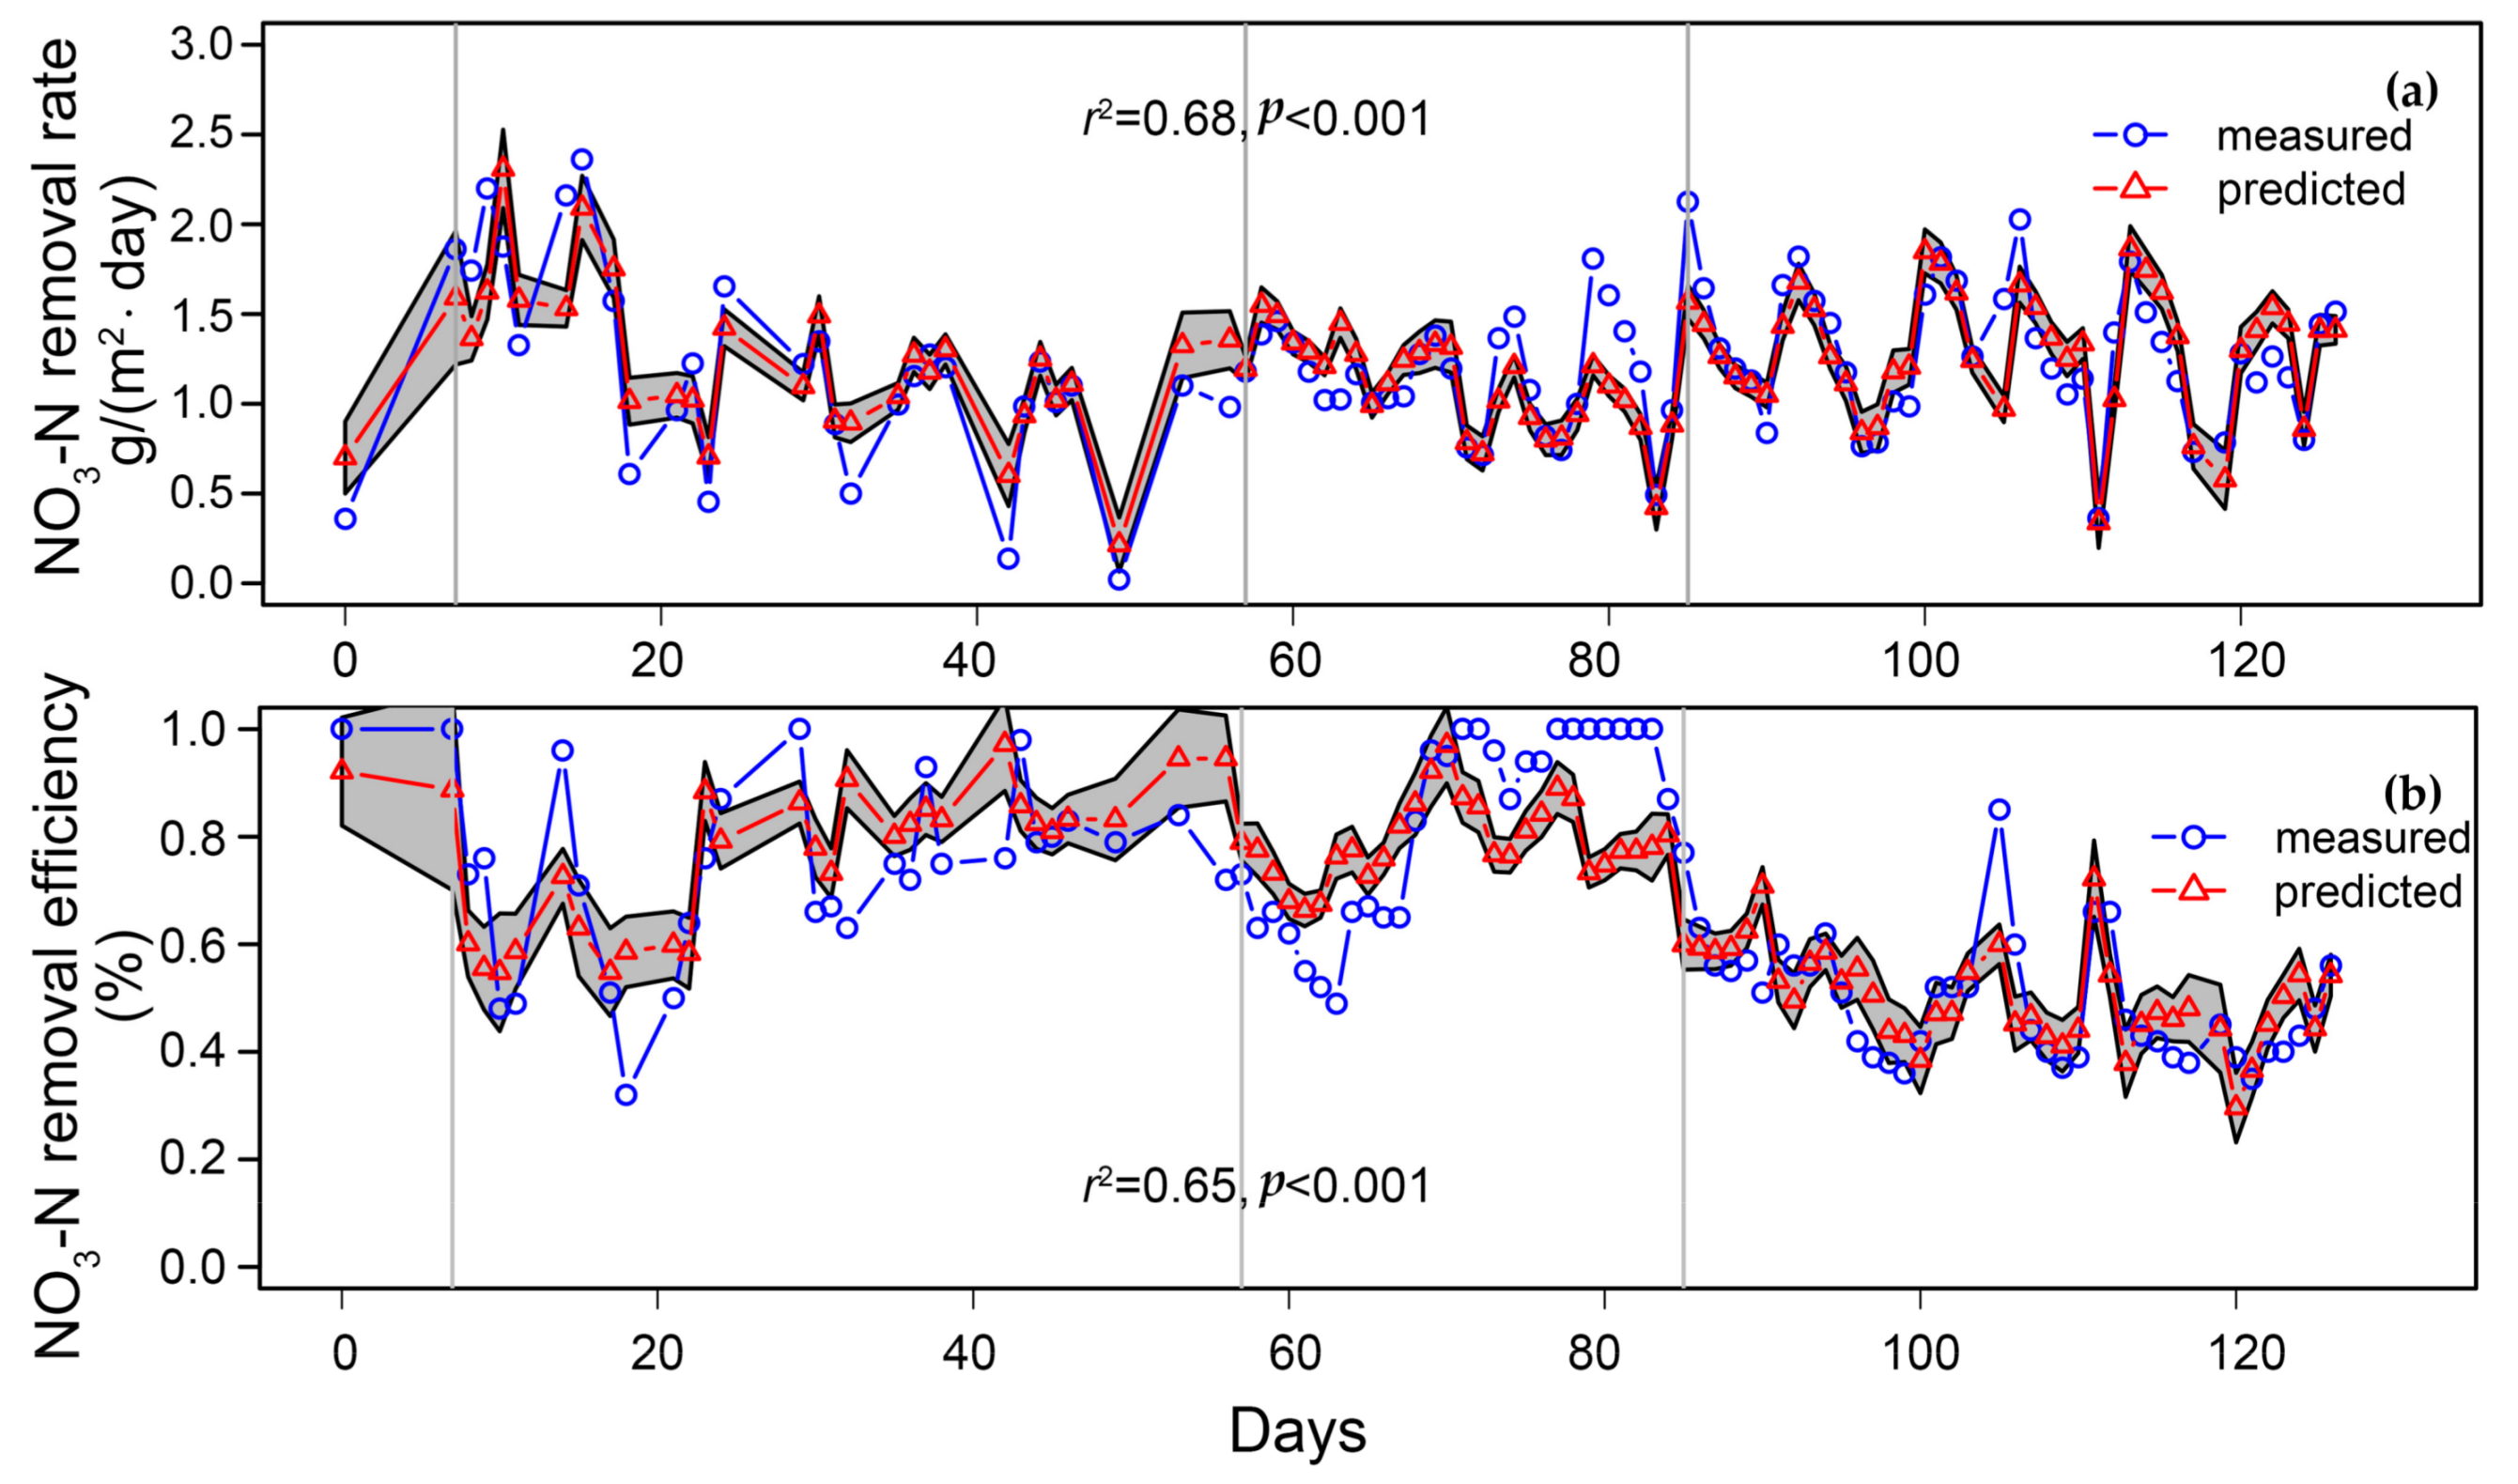
A stepwise linear regression analysis was conducted to delineate the individual specific effect of temperature and flux variations on nitrate turnover processes. The models with four parameters were developed to predict the nitrate removal rate and efficiency (Figure 4). A summary of these linear model results is given in Table 2. According to the r2 statistic, the regression models revealed a 68% and 65% of the overall variance for estimation of nitrate removal rate and efficiency, respectively. In both models, most of the variability was attributable to the nitrate load (about 48%). The flux and temperature variations together accounted for approximately 20% of the total variation. Among them, the temperature contributes to 10% of the total variance.
4. Discussion
4.1. Nitrate Removal Rate and Efficiency
The nitrate removal rate of a biological denitrification process is strongly dependent on the multitude of possible C-sources for denitrification and the range of applied nitrogen loads. Nitrate removal is generally limited by the availability of C-sources [7]; adding an extra carbon source to denitrification bacteria in CWs could enhance the denitrification rate. In this study, a peat soil served as a C-source for the denitrification processes (C:N ratio of 10:1) [15]. The observed nitrate removal rates (1.21 g/(m2·day), NO3-N) are significantly higher than those reported for CWs with mineral soils and natural wetlands (NO3-N from 0.06 to 0.92 g/(m2·day)) [32,33]. The values were within nitrate removal rates found for woodchips (ranging from 0.7 to 5.0 g/(m2·day) NO3-N) [7,34]. The obtained nitrate removal efficiency is higher than that reported for coco-peat (54%) and organic soils (20%) [16,35]. The reason probably was that lower oxygen concentrations (lower redox potential values) were observed in this study, especially at the bottom of the container. The nitrate removal rate at N100 was only a little lower than the rates estimated for wood-based filters (87% to 97%) [36]. However, at a later stage of the N100 variant, nitrate was almost completely removed (>95%), suggesting denitrification is limited by the nitrate concentration [36,37]. Thus, peat soils may have a comparable ability to wood products for removing nitrate in CWs.
4.2. Nitrate Load, Hydraulic Load, and Nitrate Removal Rate
Under nitrate-limiting conditions, an increasing nitrate input load would accelerate the nitrate removal process [38]. In this study, increasing the mean nitrate load from 1.46 g NO3-N m−2 day−1 (N100) to 2.66 NO3-N g/(m2·day) (N150) did not significantly improve the nitrate removal rate. We therefore assume that environmental factors (e.g., soil temperature) restrained the denitrification processes at N150. When a nitrate load of less than 1.72 g/(m2·day) NO3-N was supplied to the system, the nitrate effluent concentration (<10 mg/L NO3-N or 50 mg/L NO3) was always lower than the standard values for drinking water quality. However, at a larger nitrate load (e.g., 2.7 g/(m2·day)), the effluent concentration would often fall into the worst water quality class (>20 mg/L NO3−N). For the setting in this study, the nitrate load should be limited to below 1.7 g/(m2·day) if degraded peat soil is used as the bed material to ensure water quality standards. In the regression models, the coefficient of the input load was positive for the nitrate removal rate but negative for nitrate removal efficiency because the nitrate removal rate increased less than the input load. Thus, removal efficiency decreased with increasing nitrate input load.
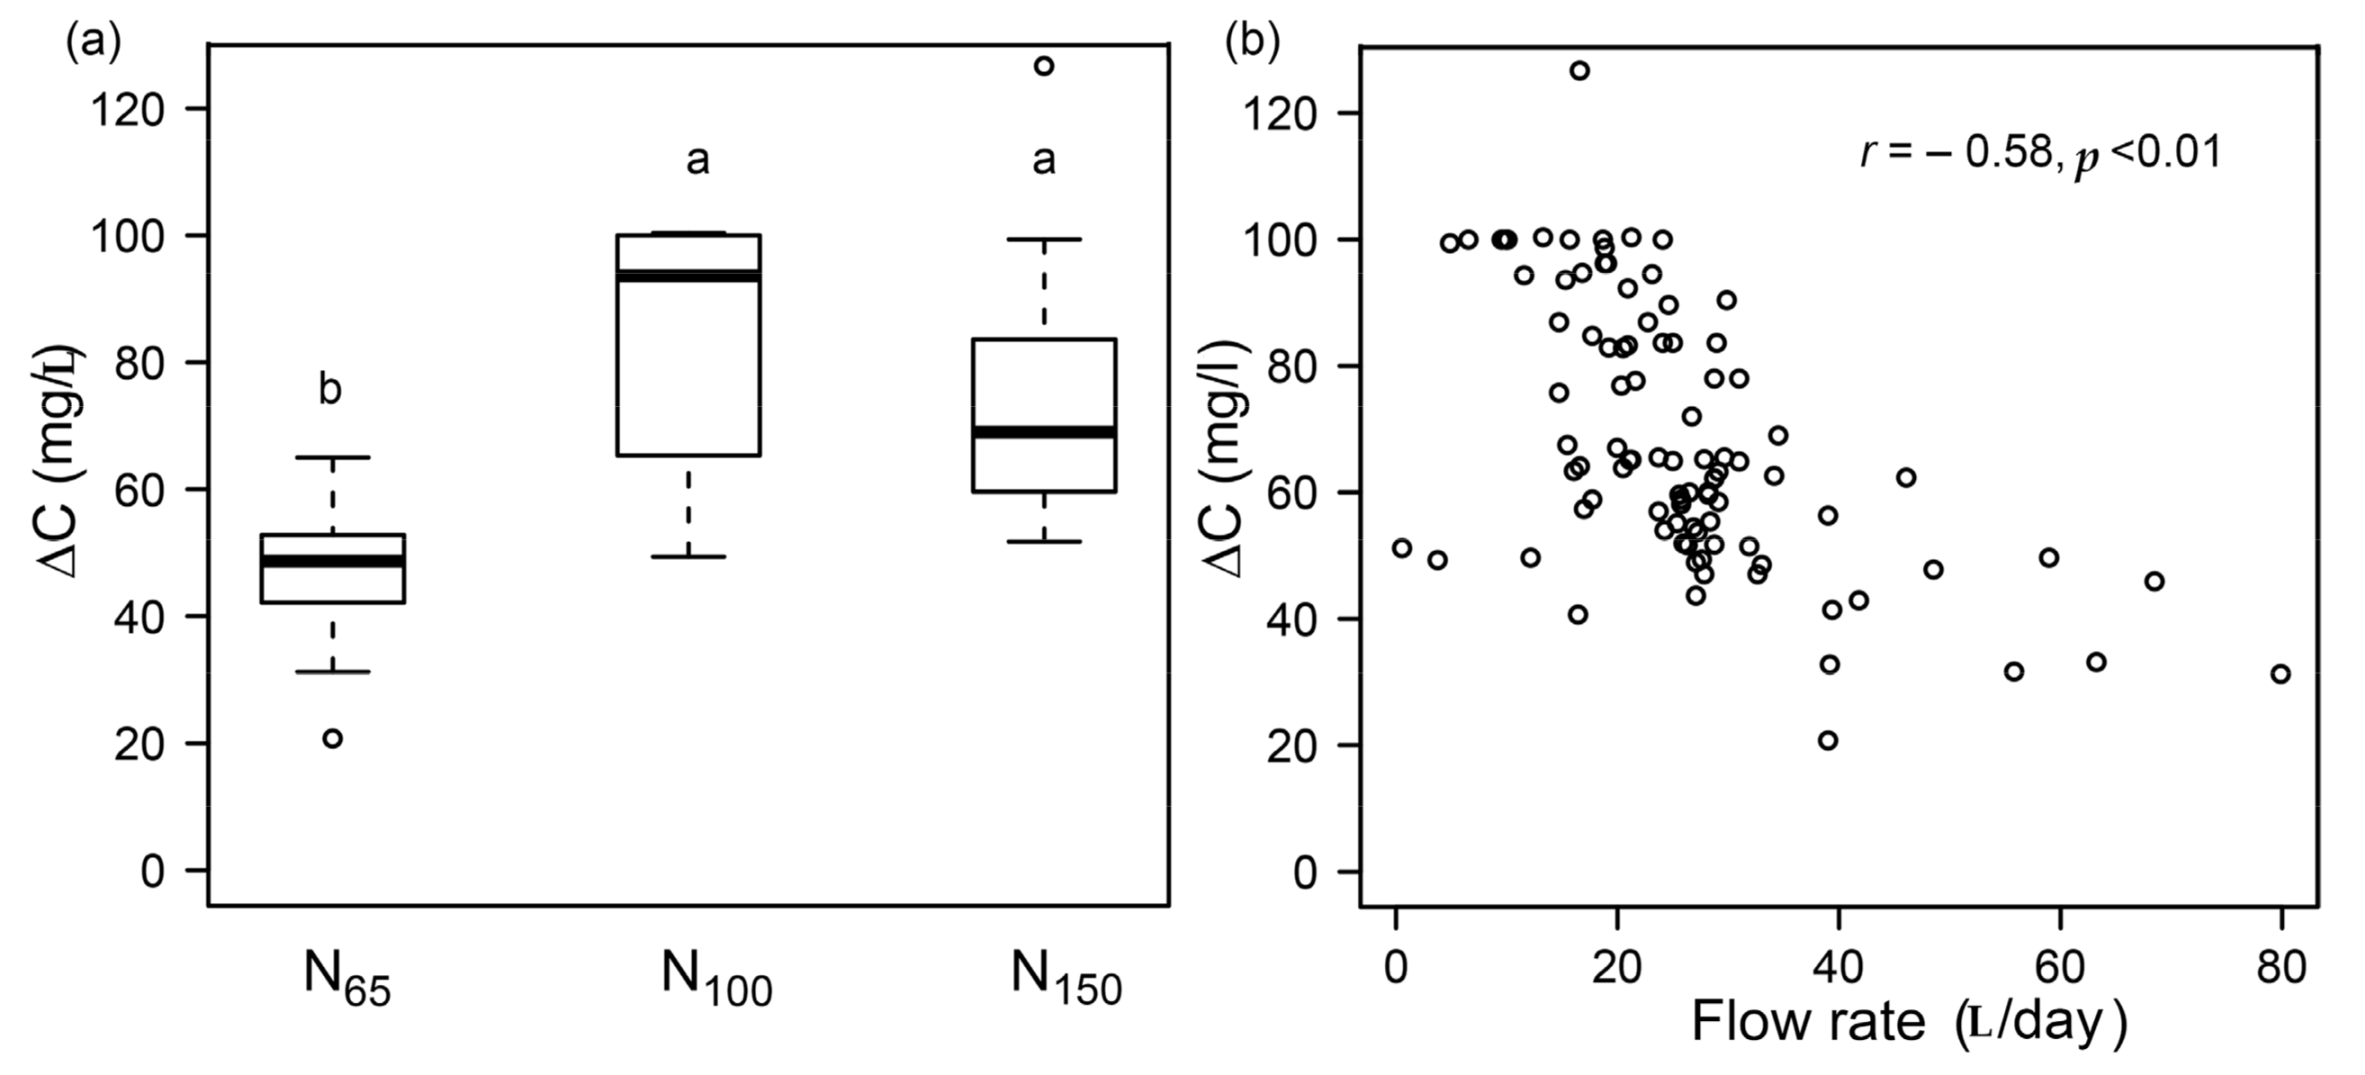
It has been reported that a higher hydraulic load commonly leads to high nitrate removal in CWs [39] because a higher flow rate often means a higher nitrate load and thus more nitrate available for denitrifying bacteria [40]. In this study, a positive relation between the hydraulic load and nitrate removal rate could be confirmed from the daily data set (Pearson’s correlation coefficient of 0.67, p < 0.01). Our results are in line with a previous study [39], which stated that the nitrate removal rate is higher under a high hydraulic load condition. However, nitrate input load (Cinput × Q) rather than flow rate (Q) has a high negative correlation with removal efficiency (Pearson’s correlation coefficient of 0.69, p < 0.01). Therefore, the status of an environmental system such as a catchment shall be evaluated on the basis of the total nutrient mass that has been released into the system. Lower ΔC values were observed for N65 at which the hydraulic load was highest (Figure 5a). Comparable ΔC values were obtained for N100 and N150. We assumed that under a comparable nitrate load, faster flow rates would shorten the nitrate retention time in the system, resulting in a less effective transformation process [41]. For N150, the output nitrate concentration always exceeds the standards for nitrate in drinking water (NO3−, 50 mg/L). Therefore, nitrate removal is very efficient up to an input concentration of 100 mg/L. When summarizing all data, a medium negative correlation between flow rate and ΔC (Figure 5b) indicates that the retention time plays an important role in the nitrate attenuation in peat.
4.3. Influence of the Temperature and Redox Potential on Nitrate Reduction
The nitrate removal efficiency is temperature- and oxygen-dependent [42,43,44] because higher temperature and oxygen availability increase the microbial activity in soils. In mineral soils, optimum temperatures for nitrification range from 15 to 35 °C [45] and for denitrification from 25 to 35 °C [46]. The highest nitrate removal efficiency was observed at the N100 period in which higher temperatures (about 30 °C) prevailed. Likewise, the regression model analysis clearly expressed the importance of temperature for the denitrification process in this study, where the temperature was more important than the extent and duration of oxygen-depleted zones (Table 2). A positive relationship was also found between nitrate removal efficiency and the TDzone of denitrification zones, with redox potentials of less than 150 mV (Pearson’s correlation coefficient of 0.31, p < 0.01). The thickness and time duration of the denitrification zone represent another factor affecting the nitrate removal efficiency, although they are less less important than temperature, flow rate, and input loading (Table 2).
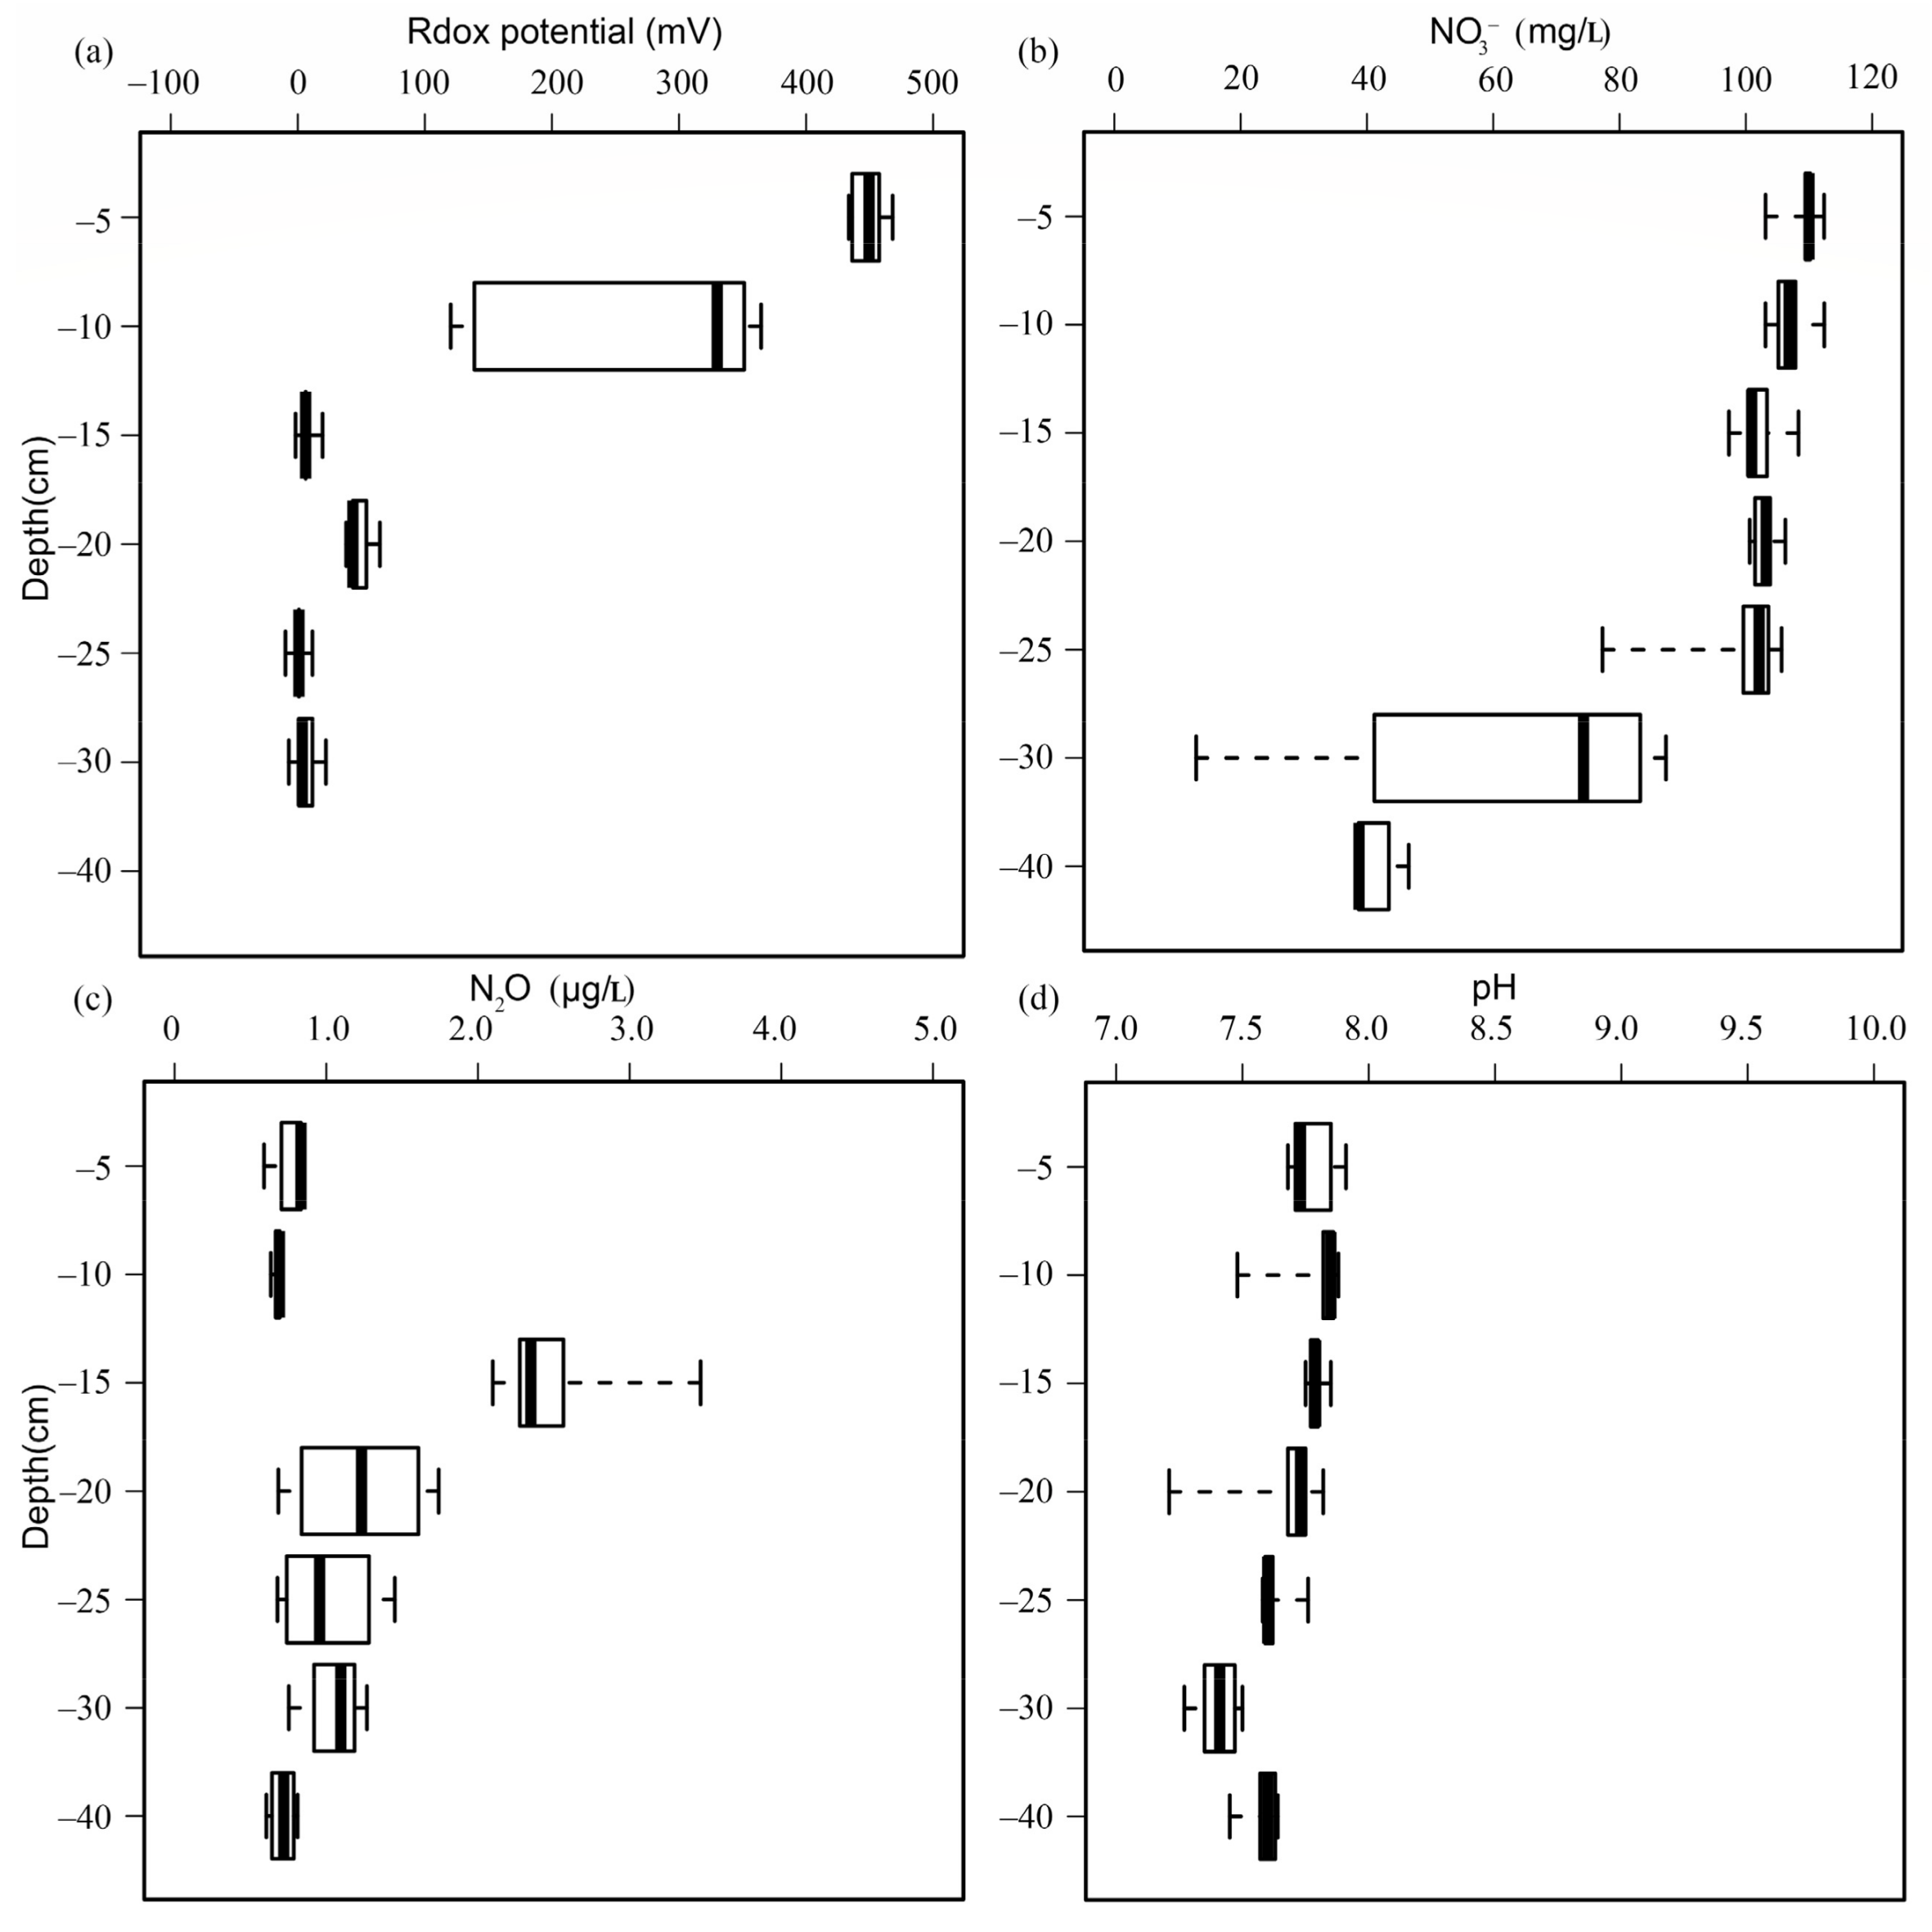
4.4. Nitrate Turnover Along the Flow Path
Redox-sensitive solution sampling with a 5-cm resolution along the central flow path was conducted additionally to the regular automated effluent sampling. Measurements for nitrate and pH as well as the dissolved gas N2O are shown in Figure 6. As expected, the redox potential decreases with increasing depth. Below a depth of 15 cm, the conditions are anaerobic. In general, nitrate concentrations were relatively high in the upper 25 cm. Lower nitrate concentrations were found closer to the bottom of the mesocosm in areas with lower redox potential indicating the bottom part of the container as the active denitrifying zone. The pH values ranged between 7.5 and 8, suggesting that N2 is the dominant denitrification product [47]. The dissolved N2O concentrations at all depths were low, confirming that the denitrifying bacteria convert nitrate to nitrogen gas (N2) under anaerobic conditions [48].
5. Conclusions
In this study, we examined the suitability of degraded peat as a bed medium and C-source for nitrate removal in constructed wetlands. The nitrate removal rates and efficiency in degraded peat soils were comparable to those observed in woodchips reactors. The observed nitrate removal efficiency was strongly affected by the nitrate load and the environmental parameters, including flow rate, temperature, and redox potential. The highest removal efficiency (and ΔC) was obtained at N100, with a lower flow rate and higher temperature. The lowest nitrate removal efficiency occurred at N150, with an average value of 49.0%, where the nitrate removal efficiency increased to 83.0% and 72.7% with decreases in the applied nitrate concentration to N100 and N65, respectively. Under a comparable nitrate input load, a continuous and low flow rate over a long-term period would extend the nitrate retention time, resulting in a more effective transformation process. The results showed that under a comparable nitrate load conditions, the nitrate retention time gets shorter under faster flow rates, resulting in a less effective nitrate transformation process. This paper clearly demonstrates the suitability of degraded peat as a bed medium for nitrate removal in constructed wetlands. For practical field-scale applications, the “flushing effect” of nitrate and dissolved organic carbon at early stages of the establishment of a CW should be taken into account to avoid unintended contamination of surface water bodies [15].
Acknowledgments
The European Social Fund (ESF) and the Ministry of Education, Science and Culture of Mecklenburg–Western Pomerania funded this work within the scope of the project WETSCAPES (ESF/14-BM-A55-0028/16). This study was conducted within the framework of the Research Training Group ‘Baltic TRANSCOAST’ funded by the DFG (Deutsche Forschungsgemeinschaft) under grant number GRK 2000 ([email protected]). This is Baltic TRANSCOAST publication no. GRK2000/0011. Christian Kleimeier is grateful to funding from the Department Maritime System of the University of Rostock.
Author Contributions
Christian Kleimeier and Haojie Liu contributed equally to this work. Christian Kleimeier designed the experiment; Haojie Liu and Christian Kleimeier conducted the experiment and analyzed the data; Haojie Liu wrote the original draft; Christian Kleimeier, Fereidoun Rezanezhad and Bernd Lennartz contributed in reviewing and editing the manuscript.
Conflicts of Interest
The authors declare no conflict of interest.
References
- Rockström, J.; Steffen, W.; Noone, K.; Persson, Å.; Chapin, F.S.; Lambin, E.; Lenton, T.M.; Scheffer, M.; Folke, C.; Schellnhuber, H.J.; et al. A safe operating space for humanity. Nature 2009, 461, 472–475. [Google Scholar] [CrossRef] [PubMed]
- Hey, D.L.; Kostel, J.A.; Crumpton, W.G.; Mitsch, W.J.; Scott, B. The roles and benefits of wetlands in managing reactive nitrogen. J. Soil Water Conserv. 2012, 67, 47A–53A. [Google Scholar] [CrossRef]
- Syswerda, S.P.; Basso, B.; Hamilton, S.K.; Tausig, J.B.; Robertson, G.P. Long-term nitrate loss along an agricultural intensity gradient in the Upper Midwest USA. Agric. Ecosyst. Environ. 2012, 149, 10–19. [Google Scholar] [CrossRef]
- Tiemeyer, B.; Lennartz, B.; Kahle, P. Analysing nitrate losses from an artificially drained lowland catchment (North-Eastern Germany) with a mixing model. Agric. Ecosyst. Environ. 2008, 123, 125–136. [Google Scholar] [CrossRef]
- Lin, Y.F.; Jing, S.R.; Lee, D.Y.; Chang, Y.F.; Shih, K.C. Nitrate removal from groundwater using constructed wetlands under various hydraulic loading rates. Bioresour. Technol. 2008, 99, 7504–7513. [Google Scholar] [CrossRef] [PubMed]
- Pell, M.; Wörman, A. Biological Wastewater Treatment Systems. In Encyclopedia of Ecology; Sven, E., Fath, B., Eds.; Academic Press: Oxford, UK, 2008; pp. 426–441. [Google Scholar]
- Warneke, S.; Schipper, L.A.; Bruesewitz, D.A.; McDonald, I.; Cameron, S. Rates, controls and potential adverse effects of nitrate removal in a denitrification bed. Ecol. Eng. 2011, 37, 511–522. [Google Scholar] [CrossRef]
- Vogan, J.L. The use of Emplaced Denitrifying Layers to Promote Nitrate Removal from Septic Effluent. Mater’s Thesis, University of Waterloo, Waterloo, ON, Canada, 1993. [Google Scholar]
- Gibert, O.; Pomierny, S.; Rowe, I.; Kalin, R.M. Selection of organic substrates as potential reactive materials for use in a denitrification permeable reactive barrier (PRB). Bioresour. Technol. 2008, 99, 7587–7596. [Google Scholar] [CrossRef] [PubMed]
- Cameron, S.G.; Schipper, L.A. Nitrate removal and hydraulic performance of organic carbon for use in denitrification beds. Ecol. Eng. 2010, 36, 1588–1595. [Google Scholar] [CrossRef]
- Liu, H.; Forsmann, D.M.; Kjaergaard, C.; Saki, H.; Lennartz, B. Solute transport properties of fen peat differing in organic matter content. J. Environ. Qual. 2017, 16, 1106–1113. [Google Scholar] [CrossRef] [PubMed]
- McCarter, C.P.R.; Price, J. The transport dynamics of chloride and sodium in a ladder fen during a continuous wastewater polishing experiment. J. Hydrol. 2017, 549, 558–570. [Google Scholar] [CrossRef]
- Gunes, K. Restaurant Wastewater Treatment by Constructed Wetlands. Clean-Soil Air Water 2007, 35, 571–575. [Google Scholar] [CrossRef]
- Amha, Y.; Bohne, H. Denitrification from the horticultural peats: Effects of pH, nitrogen, carbon, and moisture contents. Biol. Fertil. Soils 2011, 47, 293–302. [Google Scholar] [CrossRef]
- Kleimeier, C.; Karsten, U.; Lennartz, B. Suitability of degraded peat for constructed wetlands—Hydraulic properties and nutrient flushing. Geoderma 2014, 228–229, 25–32. [Google Scholar] [CrossRef]
- Jin, M.; Carlos, J.; McConnell, R.; Hall, G.; Champagne, P. Peat as Substrate for Small-Scale Constructed Wetlands Polishing Secondary Effluents from Municipal Wastewater Treatment Plant. Water 2017, 9, 928. [Google Scholar] [CrossRef]
- Limpens, J.; Berendse, F.; Blodau, C.; Canadell, J.G.; Freeman, C.; Holden, J.; Roulet, N.; Rydin, H.; Schaepman-Strub, G. Peatlands and the carbon cycle: From local processes to global implications—A synthesis. Biogeosciences 2008, 5, 1475–1491. [Google Scholar] [CrossRef]
- Mluv, M.V. Konzept zum Schutz und zur Nutzung der Moore. In Fortschreibung des Konzeptes zur Bestandssicherung und zur Entwicklung der Moore; Ministerium für Landwirtschaft, Umwelt und Verbraucherschutz Mecklenburg-Vorpommern: Schwerin, Germany, 2009; 109p. [Google Scholar]
- Van Dijk, J.; Stroetenga, M.; Bos, L.; Bodegom, P.M.V.; Verhoef, H.A.; Aerts, R. Restoring natural seepage conditions on former agricultural grasslands does not lead to reduction of organic matter decomposition and soil nutrient dynamics. Biogeochemistry 2004, 71, 317–337. [Google Scholar] [CrossRef]
- Zak, D.; Gelbrecht, J. The mobilisation of phosphorus, organic carbon and ammonium in the initial stage of fen rewetting (a case study from NE Germany). Biogeochemistry 2007, 85, 141–151. [Google Scholar] [CrossRef]
- Rezanezhad, F.; Andersen, R.; Pouliot, R.; Price, J.S.; Rochefort, L.; Graf, M. How fen vegetation structure affects the transport of oil sands process-affected waters. Wetlands 2012, 32, 557–570. [Google Scholar] [CrossRef]
- Rezanezhad, F.; Price, J.S.; Craig, J.R. The effects of dual porosity on transport and retardation in peat: A Laboratory Experiment. Can. J. Soil Sci. 2012, 92, 723–732. [Google Scholar] [CrossRef]
- Rezanezhad, F.; Price, J.S.; Quinton, W.L.; Lennartz, B.; Milojevic, T.; Van Cappellen, P. Structure of peat soils and implications for water storage, flow and solute transport: A review update for geochemists. Chem. Geol. 2016, 429, 75–84. [Google Scholar] [CrossRef]
- Kleimeier, C.; Rezanezhad, F.; Van Cappellen, P.; Lennartz, B. Influence of pore structure on solute transport in degraded and undegraded fen peat soils. Mires Peat 2017, 19, 1–9. [Google Scholar] [CrossRef]
- Ketcheson, S.J.; Price, J.S.; Carey, S.K.; Petrone, R.M.; Mendoza, C.A.; Devito, K.J. Constructing fen peatlands in post-mining oil sands landscapes: Challenges and opportunities from a hydrological perspective. Earth-Sci. Rev. 2016, 161, 130–139. [Google Scholar] [CrossRef]
- Rezanezhad, F.; Kleimeier, C.; Milojevic, T.; Liu, H.; Weber, T.K.D.; Van Cappellen, P.; Lennartz, B. The Role of Pore Structure on Nitrate Reduction in Peat Soil: A Physical Characterization of Pore Distribution and Solute Transport. Wetlands 2017, 37, 951–960. [Google Scholar] [CrossRef]
- Tiemeyer, B.; Frings, J.; Kahle, P.; Köhne, S.; Lennartz, B. A comprehensive study of nutrient losses, soil properties and groundwater concentrations in a degraded peatland used as an intensive meadow–Implications for re-wetting. J. Hydrol. 2007, 345, 80–101. [Google Scholar] [CrossRef]
- WHO. Guidelines for Drinking-Water Quality, 1st ed.; World Health Organisation: Geneva, Switzerland, 2004. [Google Scholar]
- Sigg, L. Redox potential measurements in natural waters: Significance, concepts, and problems. In Redox: Fundamental, Processes, and Applications; Schuring, J., Schulz, H.D., Fischer, W.R., Bottcher, J., Duijnisveld, W.H.M., Eds.; Springer: Berlin, Germany, 2000. [Google Scholar]
- McKight, P.E.; Najab, J. Kruskal-Wallis Test. In Corsini Encyclopedia of Psychology; John Wiley & Sons: Hoboken, NJ, USA, 2010. [Google Scholar]
- R Core Team. R: A Language and Environment for Statistical Computing; R Foundation for Statistical Computing: Vienna, Austria, 2013; ISBN 3-900051-07-0. [Google Scholar]
- Gale, P.M.; Dévai, I.; Reddy, K.R.; Graetz, D.A. Denitrification potential of soils from constructed and natural wetlands. Ecol. Eng. 1993, 2, 119–130. [Google Scholar] [CrossRef]
- Blahnik, T.; Day, J. The effects of varied hydraulic and nutrient loading rates on water quality and hydrologic distributions in a natural forested treatment wetland. Wetlands 2000, 20, 48–61. [Google Scholar] [CrossRef]
- Van Driel, P.W.; Robertson, W.D.; Merkley, L.C. Upflow reactors for riparian zone denitrification. J. Environ. Qual. 2006, 35, 412–420. [Google Scholar] [CrossRef] [PubMed]
- Saeed, T.; Afrin, R.; Al Muyeed, A.; Sun, G. Treatment of tannery wastewater in a pilot-scale hybrid constructed wetland system in Bangladesh. Chemosphere 2012, 88, 1065–1073. [Google Scholar] [CrossRef] [PubMed]
- Robertson, W.D.; Ford, G.I.; Lombardo, P.S. Wood-based filter for nitrate removal in septic systems. Trans. ASAE 2005, 48, 121–128. [Google Scholar] [CrossRef]
- Schipper, L.A.; Robertson, W.D.; Gold, A.J.; Jaynes, D.B.; Cameron, S.C. Denitrifying bioreactors—An approach for reducing nitrate loads to receiving waters. Ecol. Eng. 2010, 36, 1532–1543. [Google Scholar] [CrossRef]
- Almeida, A.; Carvalho, F.; Imaginário, M.J.; Castanheira, I.; Prazeres, A.R.; Ribeiro, C. Nitrate removal in vertical flow constructed wetland planted with Vetiveria zizanioides: Effect of hydraulic load. Ecol. Eng. 2017, 99, 535–542. [Google Scholar] [CrossRef]
- Kadlec, R.H.; Knight, R.L. Treatment Wetlands; Lewis Publishers: Boca Raton, FL, USA, 1996. [Google Scholar]
- Bastviken, S.K.; Weisner, S.E.B.; Thiere, G.; Svensson, J.M.; Ehde, P.M.; Tonderski, K.S. Effects of vegetation and hydraulic load on seasonal nitrate removal in treatment wetlands. Ecol. Eng. 2009, 35, 946–952. [Google Scholar] [CrossRef]
- Gu, C.; Hornberger, G.M.; Mills, A.L.; Herman, J.S.; Flewelling, S.A. Nitrate reduction in streambed sediments: Effects of flow and biogeochemical kinetics. Water Resour. Res. 2007, 43, W12413. [Google Scholar] [CrossRef]
- Willems, H.P.L.; Rotelli, M.D.; Berry, D.F.; Smith, E.P.; Reneau, R.B.; Mostaghimi, S. Nitrate removal in riparian wetland soils: Effects of flow rate, temperature, nitrate concentration and soil depth. Water Res. 1997, 31, 841–849. [Google Scholar] [CrossRef]
- Abdalla, M.; Jones, M.; Smith, P.; Williams, M. Nitrous oxide fluxes and denitrification sensitivity to temperature in Irish pasture soils. Soil Use Manag. 2009, 25, 376–388. [Google Scholar] [CrossRef]
- Veraart, A.J.; de Klein, J.J.M.; Scheffer, M. Warming Can Boost Denitrification Disproportionately Due to Altered Oxygen Dynamics. PLoS ONE 2011, 6, e18508. [Google Scholar] [CrossRef] [PubMed]
- Lu, Y.; Xu, H. Effects of Soil Temperature, Flooding, and Organic Matter Addition on N2O Emissions from a Soil of Hongze Lake Wetland, China. Sci. World J. 2014, 2014, 272684. [Google Scholar] [CrossRef] [PubMed]
- Rivett, M.O.; Buss, S.R.; Morgan, P.; Smith, J.W.N.; Bemment, C.D. Nitrate attenuation in groundwater: A review of biogeochemical controlling processes. Water Res. 2008, 42, 4215–4232. [Google Scholar] [CrossRef] [PubMed]
- Liu, B.; Mørkved, P.T.; Frostegård, Å.; Bakken, L.R. Denitrification gene pools, transcription and kinetics of NO, N2O and N2 production as affected by soil pH. FEMS Microbiol. Ecol. 2010, 72, 407–417. [Google Scholar] [CrossRef] [PubMed]
- De Vries, S.; Schröder, I. Comparison between the nitric oxide re-ductase family and its aerobic relatives, the cytochrome oxidases. Biochem. Soc. Trans. 2002, 30, 662–667. [Google Scholar] [CrossRef] [PubMed]
Figure 1.
Schematic diagram of the mesocosm experimental set-up and illustration of water and gas sampling locations (−5, −10, −15, −20, −25, −30 cm, and effluent).
Figure 1.
Schematic diagram of the mesocosm experimental set-up and illustration of water and gas sampling locations (−5, −10, −15, −20, −25, −30 cm, and effluent).

Figure 2.
Overview of the flux (a), temperature (b), nitrate concentration (c), and redox potential zone (d) of the mesocosm experiment.
Figure 2.
Overview of the flux (a), temperature (b), nitrate concentration (c), and redox potential zone (d) of the mesocosm experiment.

Figure 3.
Boxplot of flow conditions, temperature, and thickness and time duration of redox zone (TDzone) under different supplied nitrate concentrations of 65, 100, and 150 mg/L (N65, N100, N150, respectively). Two groups that are identified by the same letter (a, b or c) are not significantly different from each other. (a) flow rate; (b) Temperature; (c) TDzone2 (150 mV < Eh < 500 mV); (d) TDzone3 (Eh < 150 mV).

Figure 4.
Measured (blue lines) and predicted (red line) values of nitrate removal rate and efficiency with multiple linear regression models. The grey zone is the 95% confidence of the interval of predicted values. (a) NO3-N removal rate (b) NO3-N removal efficiency.
Figure 4.
Measured (blue lines) and predicted (red line) values of nitrate removal rate and efficiency with multiple linear regression models. The grey zone is the 95% confidence of the interval of predicted values. (a) NO3-N removal rate (b) NO3-N removal efficiency.

Figure 5.
Boxplot of (a) ΔC (difference between nitrate input and effluent concentrations) under different supplied nitrate concentrations (N65, N100, N150) and (b) scatter plot of flow rate (L/day) against ΔC.
Figure 5.
Boxplot of (a) ΔC (difference between nitrate input and effluent concentrations) under different supplied nitrate concentrations (N65, N100, N150) and (b) scatter plot of flow rate (L/day) against ΔC.

Figure 6.
Redox potential (a), nitrate NO3− (b), and dissolved gasses N2O (c) as well as the pH (d) at different depths in the mesocosm experiment.
Figure 6.
Redox potential (a), nitrate NO3− (b), and dissolved gasses N2O (c) as well as the pH (d) at different depths in the mesocosm experiment.


Table 1.
Nitrate as nitrogen (NO3-N) removal rate, removal efficiency and ΔC (difference between nitrate input and effluent concentrations), mean ± standard deviation, for different nitrate input concentrations: N65 (65 mg/L); N100 (100 mg/L); N150 (150 mg/L). Two groups that are identified by the same letter (a, b, or c) are not significantly different from each other.
| Nitrate Input Concentrations | Input Loading | Removal Rate | Removal Efficiency | ΔC |
|---|---|---|---|---|
| g/(m2·day) | g/(m2·day) | % | mg/L | |
| N65 | 1.72 b ± 0.90 | 1.19 a ± 0.57 | 72.7 a ± 16.1 | 47.2 b ± 10.5 |
| N100 | 1.46 b ± 0.50 | 1.15 a ± 0.30 | 83.0 a ± 18.2 | 83.0 a ± 18.2 |
| N150 | 2.66 a ± 0.69 | 1.22 a ± 0.34 | 49.0 b ± 10.9 | 73.3 a ± 16.2 |
| Median | 1.92 | 1.20 | 63.5 | 64.0 |
Table 2.
Multiple linear regression of nitrate as the nitrogen (NO3-N) removal rate and efficiency with nitrate load, temperature, flow rate, and thickness and time duration of the redox zone (TDzone). Level of significance (p < 0.05).
Table 2.
Multiple linear regression of nitrate as the nitrogen (NO3-N) removal rate and efficiency with nitrate load, temperature, flow rate, and thickness and time duration of the redox zone (TDzone). Level of significance (p < 0.05).
| Index | Independent Variables | Coefficient | Explained Variance (%) |
|---|---|---|---|
| Removal rate, g/(m2·day) | Intercept | −0.800 | - |
| Input load | 0.338 | 48.0 | |
| Temperature | 0.035 | 11.2 | |
| Flow rate | 0.014 | 6.8 | |
| TDzone3 a | 0.004 | 2.2 | |
| Adjusted r2 | 0.668 | - | |
| Removal efficiency, % | Intercept | 0.329 | - |
| Input Load | −0.152 | 46.8 | |
| Temperature | 0.018 | 8.1 | |
| Flow rate | 0.006 | 8.7 | |
| TDzone3 | 0.002 | 2.3 | |
| Adjusted r2 | 0.645 | - |
a TDzone3: Thickness and time duration (cm·day) of redox zone 3 (Eh < 150 mV).
© 2018 by the authors. Licensee MDPI, Basel, Switzerland. This article is an open access article distributed under the terms and conditions of the Creative Commons Attribution (CC BY) license (http://creativecommons.org/licenses/by/4.0/).
Share and Cite
MDPI and ACS Style
Kleimeier, C.; Liu, H.; Rezanezhad, F.; Lennartz, B. Nitrate Attenuation in Degraded Peat Soil-Based Constructed Wetlands. Water 2018, 10, 355. https://doi.org/10.3390/w10040355
AMA Style
Kleimeier C, Liu H, Rezanezhad F, Lennartz B. Nitrate Attenuation in Degraded Peat Soil-Based Constructed Wetlands. Water. 2018; 10(4):355. https://doi.org/10.3390/w10040355
Chicago/Turabian StyleKleimeier, Christian, Haojie Liu, Fereidoun Rezanezhad, and Bernd Lennartz. 2018. "Nitrate Attenuation in Degraded Peat Soil-Based Constructed Wetlands" Water 10, no. 4: 355. https://doi.org/10.3390/w10040355
Note that from the first issue of 2016, this journal uses article numbers instead of page numbers. See further details here.