Next Article in Journal
Riverbank Filtration Impacts on Post Disinfection Water Quality in Small Systems—A Case Study from Auburn and Nebraska City, Nebraska
Next Article in Special Issue
Five-Year Experimental Study on Effectiveness and Sustainability of a Dry Drainage System for Controlling Soil Salinity
Previous Article in Journal
Assessment of Changes in Water Balance Components under 1.5 °C and 2.0 °C Global Warming in Transitional Climate Basin by Multi-RCPs and Multi-GCMs Approach
Previous Article in Special Issue
Organic Amendments Influence Soil Water Depletion, Root Distribution, and Water Productivity of Summer Maize in the Guanzhong Plain of Northwest China
 
 
Correction published on 11 September 2019, see Water 2019, 11(9), 1890.
Article

Evapotranspiration of the Brazilian Pampa Biome: Seasonality and Influential Factors

by
Gisele Cristina Rubert
1,*,
Débora Regina Roberti
1,
Luis Santos Pereira
2,
Fernando L. F. Quadros
3,
Haroldo Fraga de Campos Velho
4 and
Osvaldo Luiz Leal de Moraes
5
1
Departamento de Física, Universidade Federal de Santa Maria (UFSM), Santa Maria 97105-900 RS, Brazil
2
Centro de Investigação em Agronomia, Alimentos, Ambiente e Paisagem (LEAF), Instituto Superior de Agronomia, Universidade de Lisboa, Tapada da Ajuda 1349-017 Lisboa, Portugal
3
Departamento de Zootecnia, Universidade Federal de Santa Maria (UFSM), Santa Maria 97105-900 RS, Brazil
4
Laboratório de Computação Aplicada, Instituto Nacional de Pesquisas Espaciais, São José dos Campos 12227-010 SP, Brazil
5
Centro Nacional de Monitoramento e Alertas de Desastres Naturais, São José dos Campos 12227-010 SP, Brazil
*
Author to whom correspondence should be addressed.
Water 2018, 10(12), 1864; https://doi.org/10.3390/w10121864
Submission received: 8 November 2018 / Revised: 2 December 2018 / Accepted: 11 December 2018 / Published: 15 December 2018
(This article belongs to the Special Issue Innovation Issues in Water, Agriculture and Food)

Abstract

:
Experimentally characterizing evapotranspiration (ET) in different biomes around the world is an issue of interest for different areas of science. ET in natural areas of the Brazilian Pampa biome has still not been assessed. In this study, the actual ET (ETact) obtained from eddy covariance measurements over two sites of the Pampa biome was analyzed. The objective was to evaluate the energy partition and seasonal variability of the actual ET of the Pampa biome. Results showed that the latent heat flux was the dominant component in available energy in both the autumn–winter (AW) and spring–summer (SS) periods. Evapotranspiration of the Pampa biome showed strong seasonality, with highest ET rates in the SS period. During the study period, approximately 65% of the net radiation was used for the evapotranspiration process in the Pampa biome. The annual mean ET rate was 2.45 mm d−1. ET did not show to vary significantly between sites, with daily values very similar in both sites. The water availability in the Pampa biome was not a limiting factor for ET, which resulted in a small difference between the reference ET and the actual ET. These results are helpful in achieving a better understanding of the temporal pattern of ET in relation to the landscape of the Pampa biome and its meteorological, soil, and vegetation characteristics.

1. Introduction

Many experimental studies have been carried out to quantify the evapotranspiration (ET) of different ecosystems and biomes around the world using the eddy covariance (EC) methodology, which is main methodology employed to estimate actual ET from site micrometeorological measurements [1,2]. However, the Pampa biome, characteristic of southern Brazil and part of Argentina and Uruguay, is still not well characterized using that methodology or the quantification of ET and its relationship with environmental variables. In southern Brazil, the Pampa biome presents mostly grassland vegetation interspersed with gallery forests [3]. It is a complex biome, which has different vegetation, among which the most representative is fields dominated by grasses. Related studies are lacking and the only recent one refers to characterizing the actual ET of Tifton 85 Bermudagrass as affected by the frequency of cuttings [4].
Although the flora of the Pampa biome totals more than 3000 species, it is dominated by about 450 species of forage grasses and more than 150 species of legumes. The development of this flora is due to the different effects associated with latitude, altitude, and soil fertility. Thus, the Pampa biome presents unique characteristics in terms of vegetation/grass cover [5]. This plant diversity among the species characteristic of the biome’s vegetation is what determines the vegetation growth capacity in the seasons of the year, thus defining the balance of the annual production of forage.
Human activities have converted or degraded many areas of this biome [6]. The main use of this region is cattle raising, with a variation of the animal load between the seasons [7]. As a biome that faces fragility of soil, flora, and fauna, sustainable land use in the Brazilian Pampa is only possible if economic activities are adequately conditioned by the soil and environment capacities and adaptations of its plant and animal communities, as well as the related dynamic conditions throughout the biome. It is therefore essential to improve knowledge of vegetation changes due to anthropogenic and/or climatic causes.
In this study, estimates of actual evapotranspiration (ETact) of natural vegetation of the Pampa biome using the eddy covariance methodology [1,2] were analyzed for two sites in southern Brazil—Santa Maria (SMA) and Pedras Altas (PAS)—located about 300 km from each other. Both sites are within the Pampa and have quite similar vegetation and climate. Their selection owed mainly to differences in soil hydraulic characteristics, with SMA having deep soil with a high water holding capacity and PAS having shallow sandy and stony soil with a small water holding capacity. These differences allowed us to capture the influences of soil characteristics on evapotranspiration fluxes and, thus, on the behavior of actual ET throughout the year.
Only a few eddy covariance studies exist for comparison of evapotranspiration in natural pastures. In Arizona, United States, Krishnan et al. [8] obtained daily values varying from 2.8 to 3.6 mm d−1. Hu et al. [9] showed annual variations of ET of up to 4 mm d−1 in a pasture in Inner Mongolia. Trepekli et al. [10], for a coastal grassland in the Mediterranean climate of Greece, reported maximum ET of 8.2 mm d−1 in the period of the highest air temperature (summer), while ET values were negligible in winter. Rajan et al. [11] reported that ET was strongly affected by on-site water availability in a managed pasture in the Southern Great Plains, Texas, United States.
In Brazil, evapotranspiration in some different ecosystems has been characterized using eddy covariance data, for example, in the Amazon rainforest [12,13,14], in the Pantanal biome [15], and in the Cerrado biome [16,17]. However, these ecosystems are in the tropical region, where the seasonality is dominated by precipitation rates. Differently, the Pampa biome is in the subtropical climate, where the seasonality is dominated by solar radiation and presents regular precipitation rates. Therefore, in this study, we intend to answer the following scientific questions about ET in the Pampa biome: (i) How is the partition of energy in the surface? (ii) Which are the physical processes determining the evaporative fraction? (iii) What is the seasonal variation of ET? (iv) What is the relation between actual and reference ET? (v) What is the form of the hysteresis between ET and meteorological variables on a daily timescale?

2. Materials and Methods

The study period was from 1 September 2014 to 1 September 2016 for two sites in the Pampa biome in the State of Rio Grande do Sul (RS), Brazil: Santa Maria (SMA) and Pedras Altas (PAS). This period was divided into subperiods that comprised autumn–winter (AW) and spring–summer (SS). The AW period refers to the months of April–September and SS to the months of October–March.

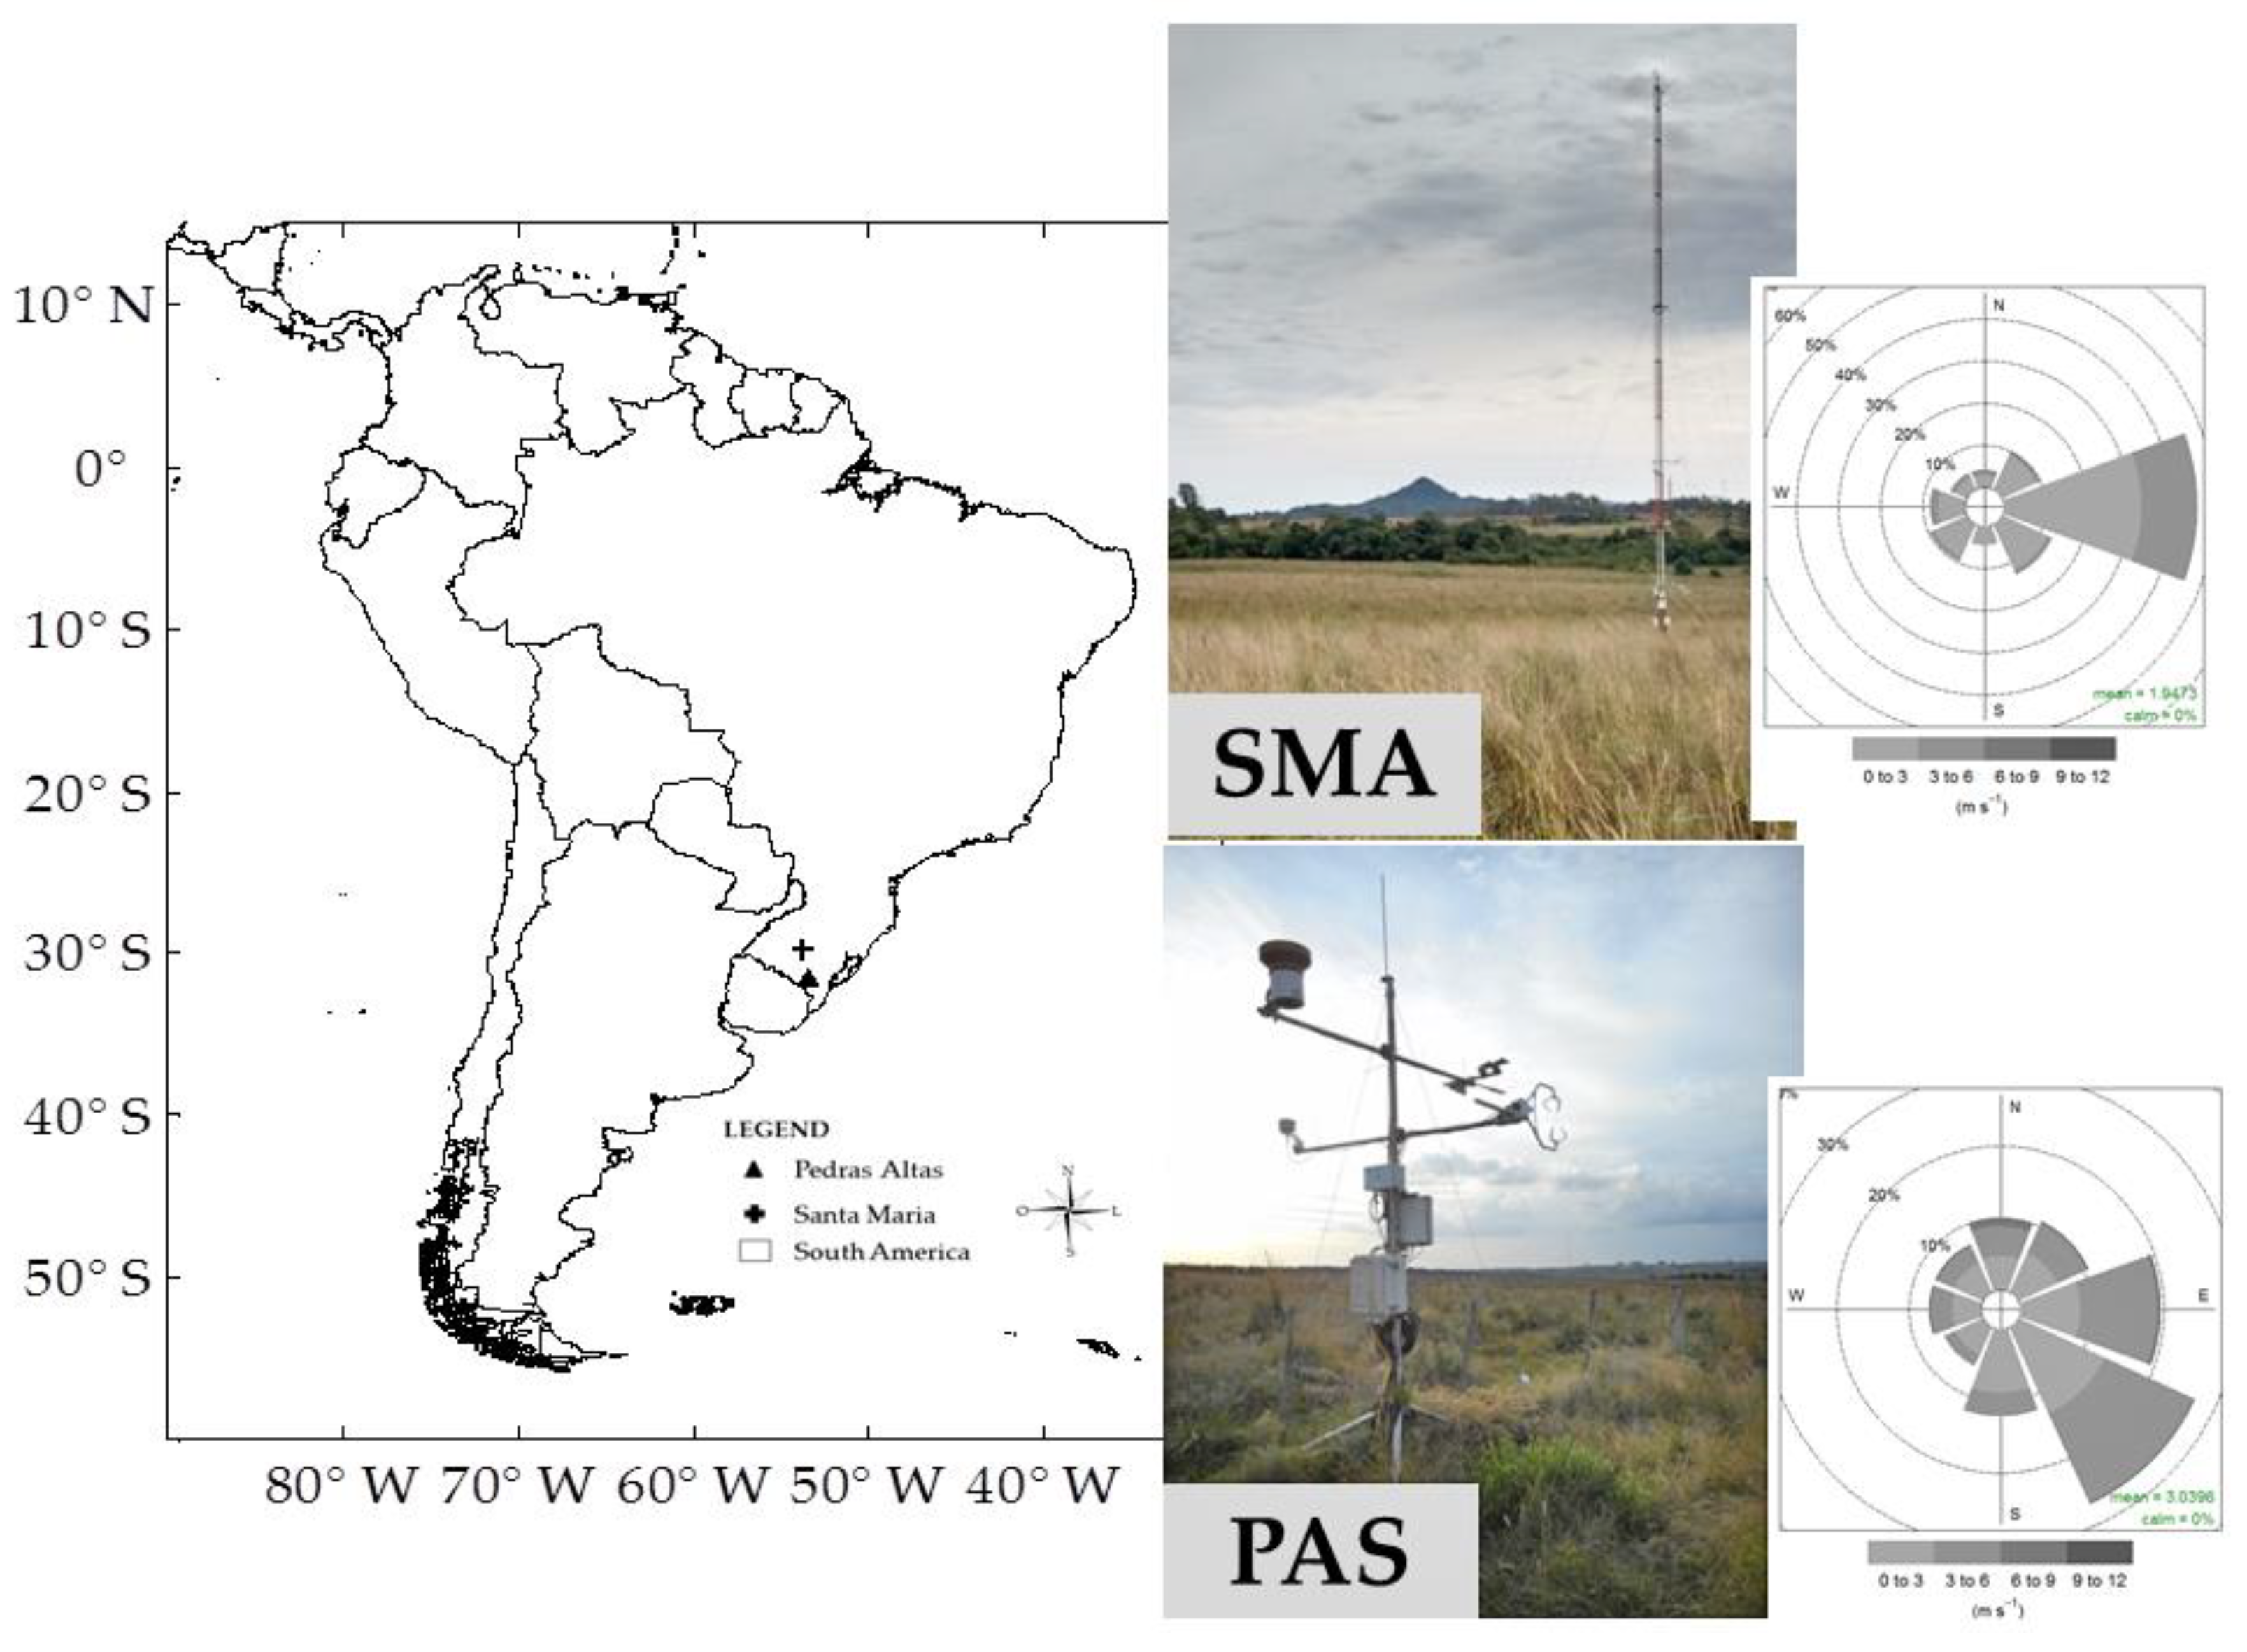
2.1. Site Description

The experimental site of SMA—29°43′27.502″ S; 53°45′36.097″ W; 88-m elevation—is located in the experimental area of the Federal University of Santa Maria, covering 24 ha of natural vegetation characteristic of the Pampa biome, near the city of Santa Maria (Figure 1). The experimental area is part of the International Long Term Ecological Research (ILTER) network. The vegetation in the study area, used as pasture for beef cattle, mainly consists of native grasses with a predominance of Andropogon lateralis, Axonopus affinis, Paspalum notatum, and Aristida laevis [18]. This composition is uniformly distributed in the study area [19]. Some studies have already been carried out in this experimental site with objectives focused on the study of the morphogenesis of native species [20,21]. The regional soil type is locally known as a “Planossolo Háplico Eutrofico” according to the exploratory map of soils of RS state [22]. These soils have high fertility and high water retention capacity. The physical properties of the soil in SMA are described in Table 1, representing a deep silt–clay–loam soil. According to the classification of Köppen [23], the climate belongs to the Cfa group, defined as temperate humid with a hot summer.
The second site, PAS—31°43.556′ S; 53°32.036′ W; 395-m elevation—is located on a private farm near the city of Pedras Altas (Figure 1). As with the Santa Maria site, there is no evidence that the area was used for another type of management than livestock. Both sites are situated within similar vegetation physiognomies in the Pampa, with a great diversity of grass species [24]. The phytophysiognomy of the PAS has double extract with predominance of creeping species, mainly stoloniferous and rhizomatous species, and also includes Axonopus affinis, Paspalum notatun, Aeristida laevis, and Iriantus angustifolium. The soil consists of Neosols and Cambisols [22], with rocky outcrops. The soil textural characteristics described in Table 1 correspond to a shallow sandy-loam soil. The climate also belongs to the Cfa classification.
The footprint of the EC was calculated using the software EddyPro® according to the methodology proposed by Kljun et al. [25]. The fetch analysis indicated that about 90% of the flux originated within a circle with a radius of 115 m for SMA and 90 m for PAS. At both sites, there were no obstacles within the footprint area. Wind in the SMA was predominantly eastern (46%), with its maximum intensity reaching 9 m s−1. The wind direction at the PAS was southeast (approximately 27%), with maximum intensity for the period reaching 11 m s−1.

2.2. Meteorological and Flux Measurements

The experimental data for both sites were obtained with flux towers. In Santa Maria, the sensor set included a 3D sonic anemometer (Wind Master Pro; Gill Instruments, Hampshire, UK), measuring wind and air temperature components, and a gas analyzer (LI7500, LI-COR Inc., Lincoln, NE, USA), measuring the H2O/CO2 concentration at 3-m height sampled at a 10-Hz frequency from 1 September 2014 to 15 June 2016. After this period, the gas analyzer and the anemometer were replaced by the sensor Integrated CO2 and H2O Open-Path Gas Analyzer and a 3D Sonic Anemometer (IRGASON, Campbell Scientific Inc., Logan, UT, USA). At the Pedras Altas site, the same variables were obtained using a sonic anemometer (CSAT3, Campbell Scientific Inc., Logan, UT, USA) and an open path infrared gas analyzer (LI7500, LI-COR Inc., Lincoln, NE, USA), set at the height of 2.5 m for the entire period.
Atmospheric variables were measured at both sites with the following sensors placed at 3-m height: air temperature and relative humidity (RH) with a thermo-hygrometer (HMP155, Vaisala, Finland), and precipitation with a rainfall sensor (TR525USW, Texas Electronics, Dallas, TX, USA). At the Santa Maria site, net radiation and short-wave incident radiation sensors (CNR4, Kipp & Zonen, Delft, The Netherlands) were used. At Pedras Altas, measurements of short-wave incident radiation (Li 200S Pyranometer—LI-COR, Lincoln, NE, USA) and net radiation (CNR2—Campbell Scientific Inc., Logan, UT, USA) were performed. At both sites, soil heat flux was measured with soil heat plates (HFP01, Hukseflux Thermal Sensors B.V., Delft, The Netherlands) placed at 0.10-m depth and soil water content was measured using water content reflectometers (CS 616, Campbell Scientific Inc., Logan, UT, USA) at a depth of 0.10 m.

2.3. Flux Data Processing and Gap Filling

The eddy covariance method was used in the high-frequency data (10 Hz) for the determination of the sensible heat flux (H) and latent heat flux (LE) over 30-min block average using EddyPro® software version 6.1 (Li-Cor, Lincoln, NE, USA). The configurations used were double rotation and correction for the effects of density [26], and the high frequency spectral correction was based on the mathematical formulations to model the attenuations due to the instrumental configuration [27]. High and low-pass filter corrections followed the methodology of Moncrieff et al. [28] and Moncrieff et al. [29], respectively. Flux quality tests followed the Mauder and Foken [30] methodology. Angle of attack correction for wind components was used according to the Nakai and Shimoyama [31] methodology. Finally, for statistical analysis, spikes removal followed the method of Vickers and Mahrt [32].
In postprocessing, LE and H data for periods that showed physically inconsistent and during precipitation events (and up to 60 min after the event) were discarded. The inconsistency referred to LE values < −40 W m−2 or > 650 W m−2 at SMA and LE < −200 W m−2 or > 650 W m−2 at PAS; H values < −60 W m−2 or > 300 W m−2 at SMA and H < −100 W m−2 or > 300 W m−2 at PAS. After data filtering, which also included malfunctioning periods, the total LE data gap was 30% at both sites and the total H data gap was 19% at SMA and 30% at PAS.
The energy balance closely followed the Foken et al. [33] methodology. With this methodology, the residual between the available energy (Rn − G) and the energy used for turbulent processes (H + LE) was partitioned between LE and H using the experimental Bowen ratio (β = H/LE) for each site.
Gaps in LE and H data were filled using the method proposed by Reichstein et al. [34] with the REddyProc package. In order to complete the missing data of the meteorological variables used in the gap-fill method, data of air temperature, relative humidity, precipitation, and solar radiation collected by the automatic stations of the National Institute of Meteorology (INMET) were used. For the SMA site, the nearest INMET station is approximately 4 km from the flux tower (29.72° W, 53.72° S, 103-m elevation). The nearest INMET station to the PAS site is located in the city of Bagé, 67 km away (at the position: 31.34° W, 54.01° S, 226-m elevation).

2.4. Evapotranspiration

The actual evapotranspiration of the Pampa biome (ETact) was estimated from the mean LE in W m−2, measured with the EC method, thus resulting in
ET act = LE L v ρ w ( 1000 ) ( Δ t )
where L v is the latent heat of vaporization (2.45 × 10⁶ J kg−1), ρ w is the water density (998 kg m−3), and Δt is the time scale used in the analysis (the same time scale of LE average). To obtain daily ET (mm d−1), the Δt was 86400 s, and to obtain hourly ET (mm h−1), Δ t was 3600 s.
The daily reference evapotranspiration, ETo (mm d−1), was computed with the FAO-PM equation [35], defined as
ET 0 = ( 0.408 Δ ( R n G ) + γ 900 T + 273 u 2 ( e s e a ) ( Δ + γ ( 1 + 0.34 u 2 ) ) )
where R n is the net radiation flux density at the crop surface (MJ m−2 d−1), G is the soil heat flux density (MJ m−2 d−1), T is the air temperature at 2-m height (°C), u 2 is the wind speed at 2-m height (m s−1), e s is the saturation vapor pressure (kPa), e a is the actual vapor pressure (kPa), Δ is the slope of the vapor pressure curve (kPa °C−1), and γ is the psychometric constant (kPa °C−1). The wind speed at 2-m velocity was estimated using the Allen et al. [35] methodology applied to the measured data.

3. Results and Discussion

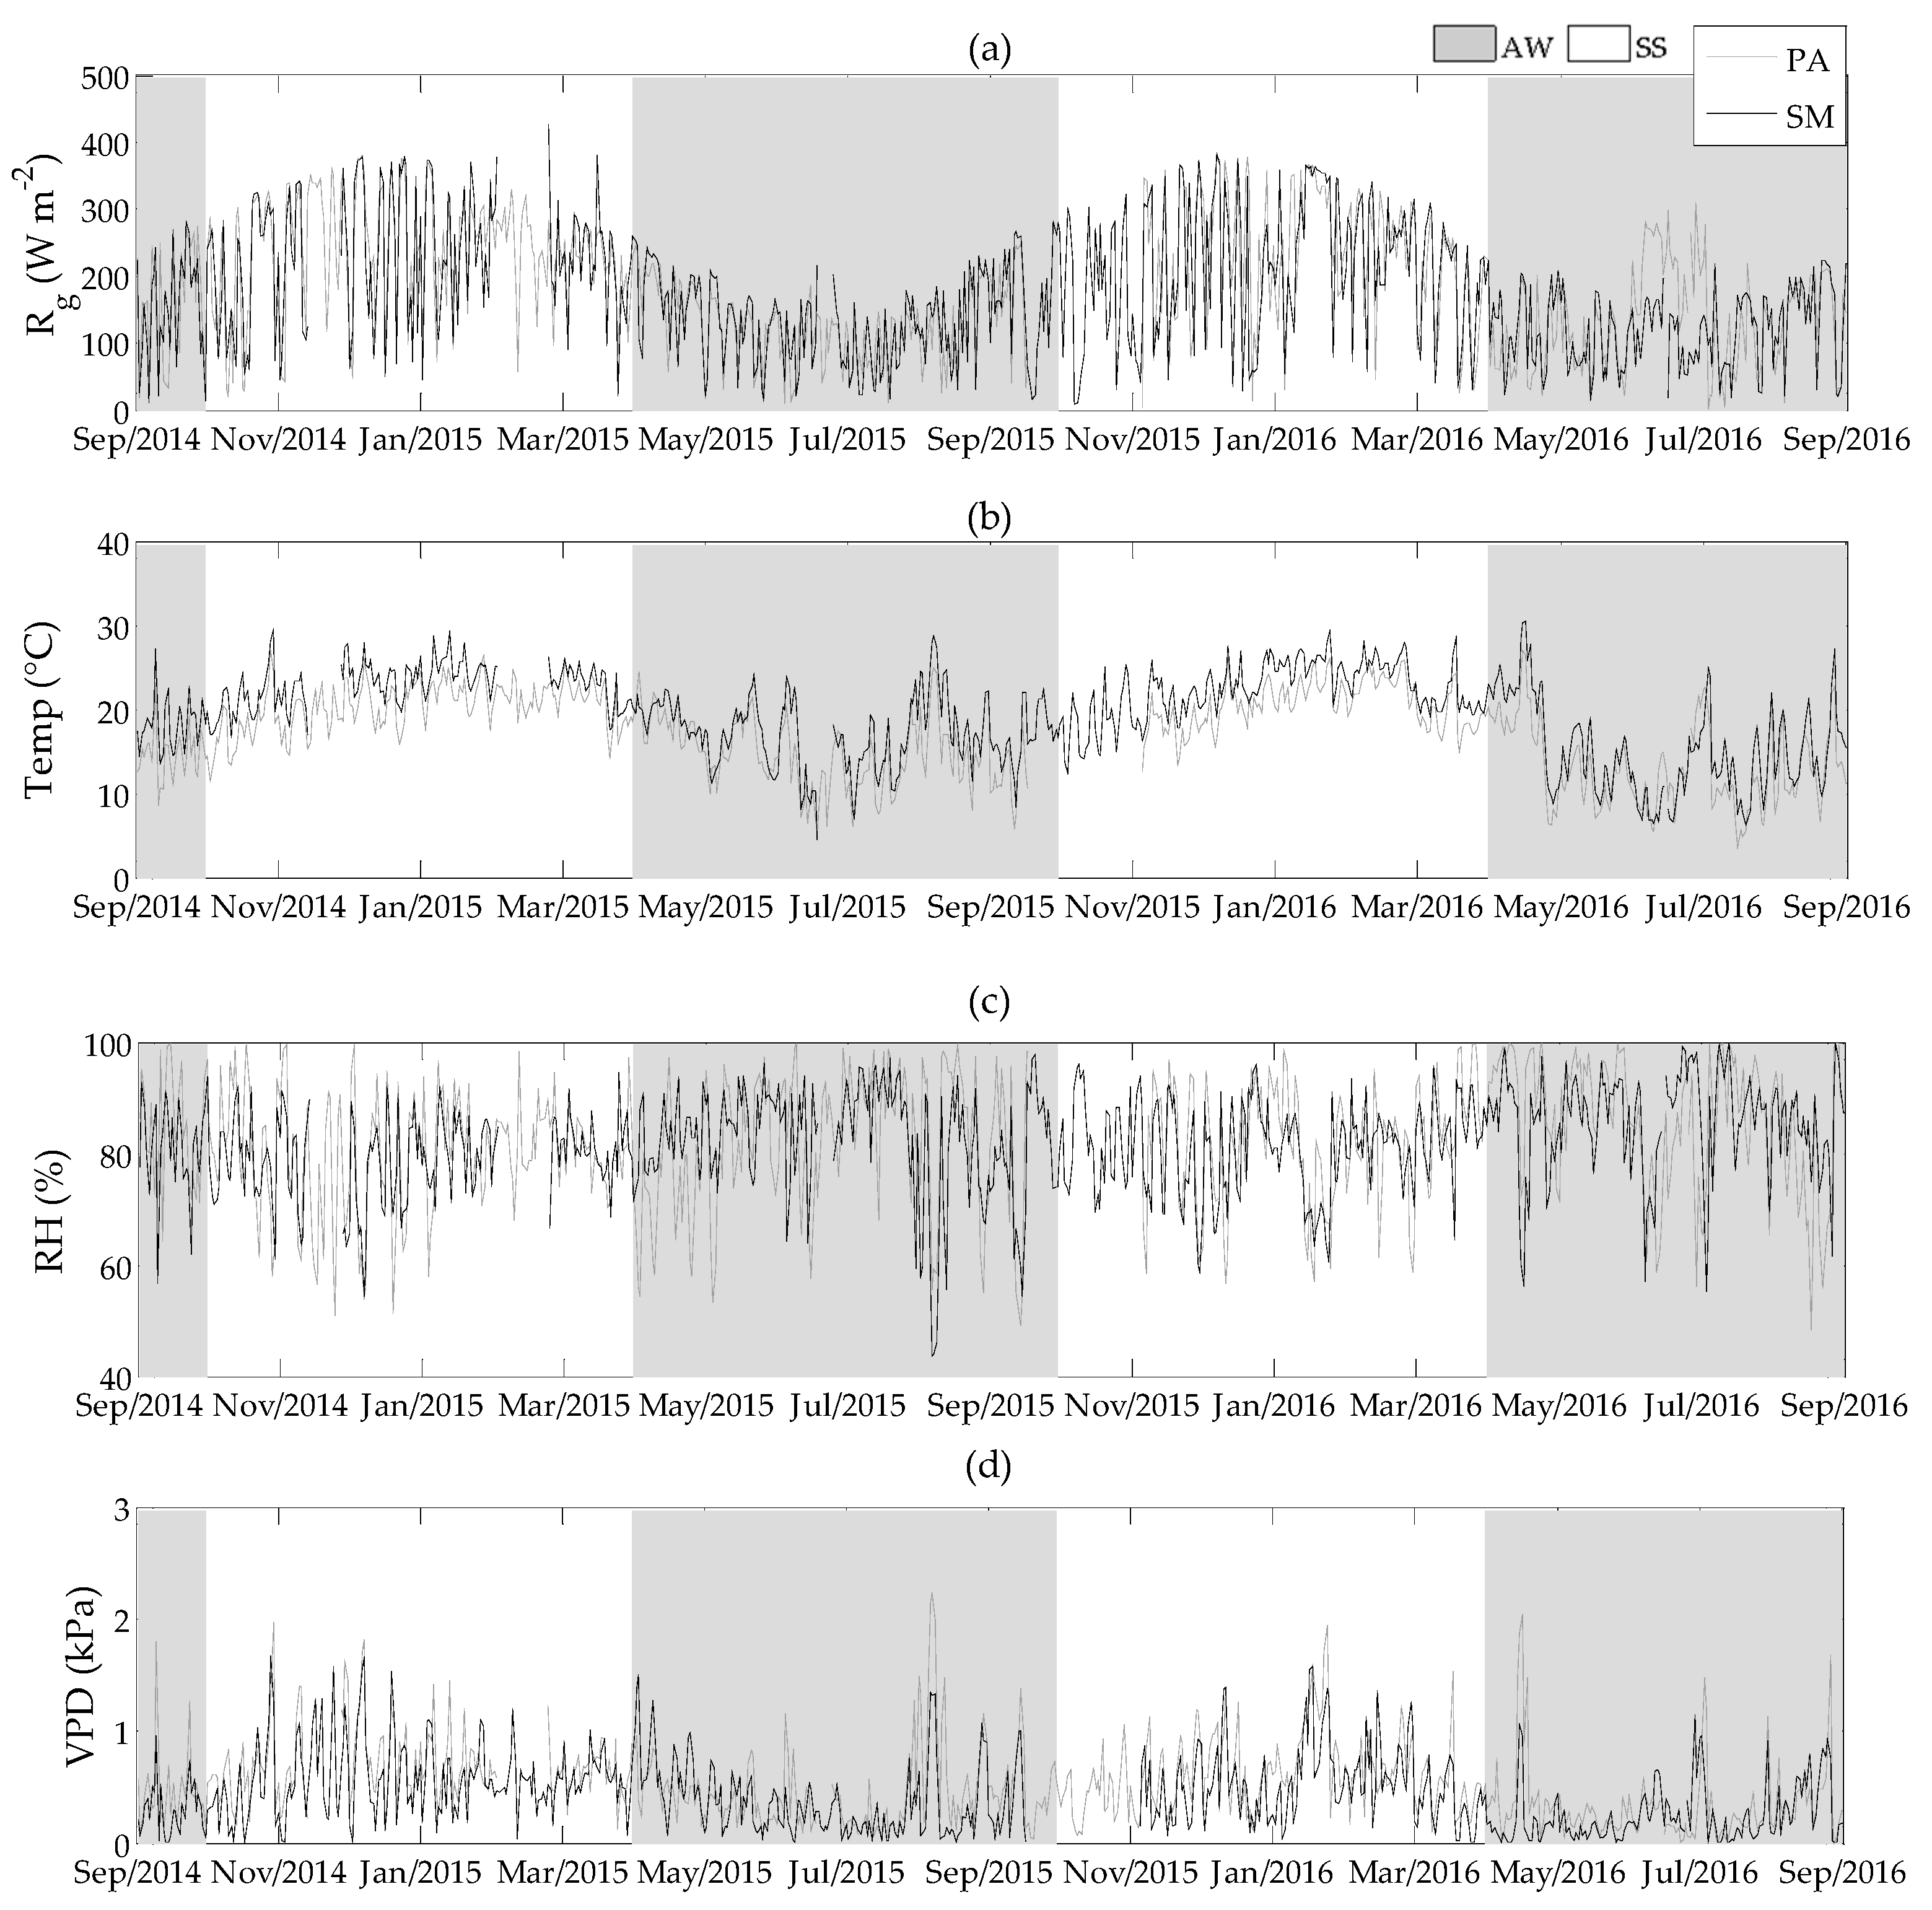
3.1. Atmosphere and Soils

The daily variation of the meteorological variables is shown in Figure 2. The incident short-wave or global radiation, Rg, presented strong seasonality. On average, Rg in the SS period was 51% and 56% higher than in the AW period in the SMA and PAS sites, respectively. For the entire study period, the mean value for Rg was 173.8 and 182.1 W m−2 for SMA and PAS, respectively. Mean values of air temperature were 19.3 and 17.1 °C, which were close to the climatological normal values (18.8 °C for SMA and 17.9 °C for PAS) [36]. Comparing AW and SS periods, the air temperature presents a well-defined seasonal variation, with daily minimum close to 4 °C in the AW season and a daily maximum of 30 °C in the SS period for both sites.
The RH of the air presented great variability throughout the year, without characterizing a seasonal pattern, and with daily mean values ranging from 43% to 100% in SMA and from 48% to 98% for PAS. The mean values of RH were 82% for both sites. The vapor pressure deficit (VPD), defined by the difference between the saturation and actual vapor pressure, ranged from 0 to 2.58 kPa per day. Its dynamics showed a pattern similar to that of air temperature in both sites. On average, for the entire period, the VPD value for the SMA site was greater than for PAS.
Figure 3 shows daily accumulated precipitation, Prec (mm), and soil water content, θ (m3 m−3). The precipitation was generally well distributed throughout the year and the total values were similar for each site in different years. For the 2014/2015 year (September 2014 to September 2015), the precipitation was 1922 mm at SMA and 1753 mm at PAS, and in 2015/2016, it was 2050 mm at SMA and 1788 mm at PAS. These values were greater than the climatological average for both sites, 1300 mm for PAS and 1617 mm for SMA. The high precipitation values in the study period, especially 2015/2016, were due to the El Niño phenomenon [37], which tends to increase precipitation in southern Brazil. For the AW and SS periods, the accumulated precipitation was 1085.6–1020 mm and 489–1377 mm for SMA and 1105–901 mm and 433.2–1102 mm for PAS, respectively, in 2014/2015–2015/2016. Although the highest cumulative precipitation occurred in the SS period for both sites, the maximum daily precipitation occurred in winter for PAS, 122 mm on 19 July 2015, and in spring for SMA, 126 mm on 7 October 2015.
The mean for soil water content was approximately 60% higher in the SMA site than at the PAS site because the soil at SMA is a clay loam soil and thus has a higher water holding capacity than at PAS, where the soil is a shallow sandy loam soil with rocky outcrops, thus having a small water holding capacity. On days when precipitation occurred, the mean values of θ reached 0.35 m3 m−3 for both sites. The PAS site showed greater variability of θ throughout the year.

3.2. Energy Balance Closure

The relationship between the available energy (Rn − G) and the turbulent heat fluxes (H + LE) was used as an indicator of the accuracy of the energy fluxes, H and LE [38]. This relationship (Figure 4) was obtained with the experimental data but excluded periods when turbulent fluxes were gap filled. The slope of the linear regression was 0.75 for SMA and 0.72 for PAS, representing an underestimation of approximately 25% of the available energy by the turbulent fluxes.
Most studies in the literature have shown a nonclosure of the energy balance of around 10%–30% [39,40,41,42,43], which is typically related to the underestimation of the turbulent fluxes measured by the eddy covariance method. Aubinet et al. [39] reported that an energy imbalance is expected since, in the accounting of the results, not all the exchanges and processes involved are considered. According to Foken et al. [44], the phenomenon of nonclosure of the energy balance on the surface is not an eddy covariance method problem but a problem related to the heterogeneity of the terrain and its influence on turbulent exchanges. They suggest that sensible and latent heat fluxes can be corrected by using the Bowen’s ratio under the assumption that the scalar similarity is fulfilled. This technique was followed in this work and the turbulent fluxes, H and LE, were corrected after partitioning the residuals of the energy balance using the Bowen’s ratio.

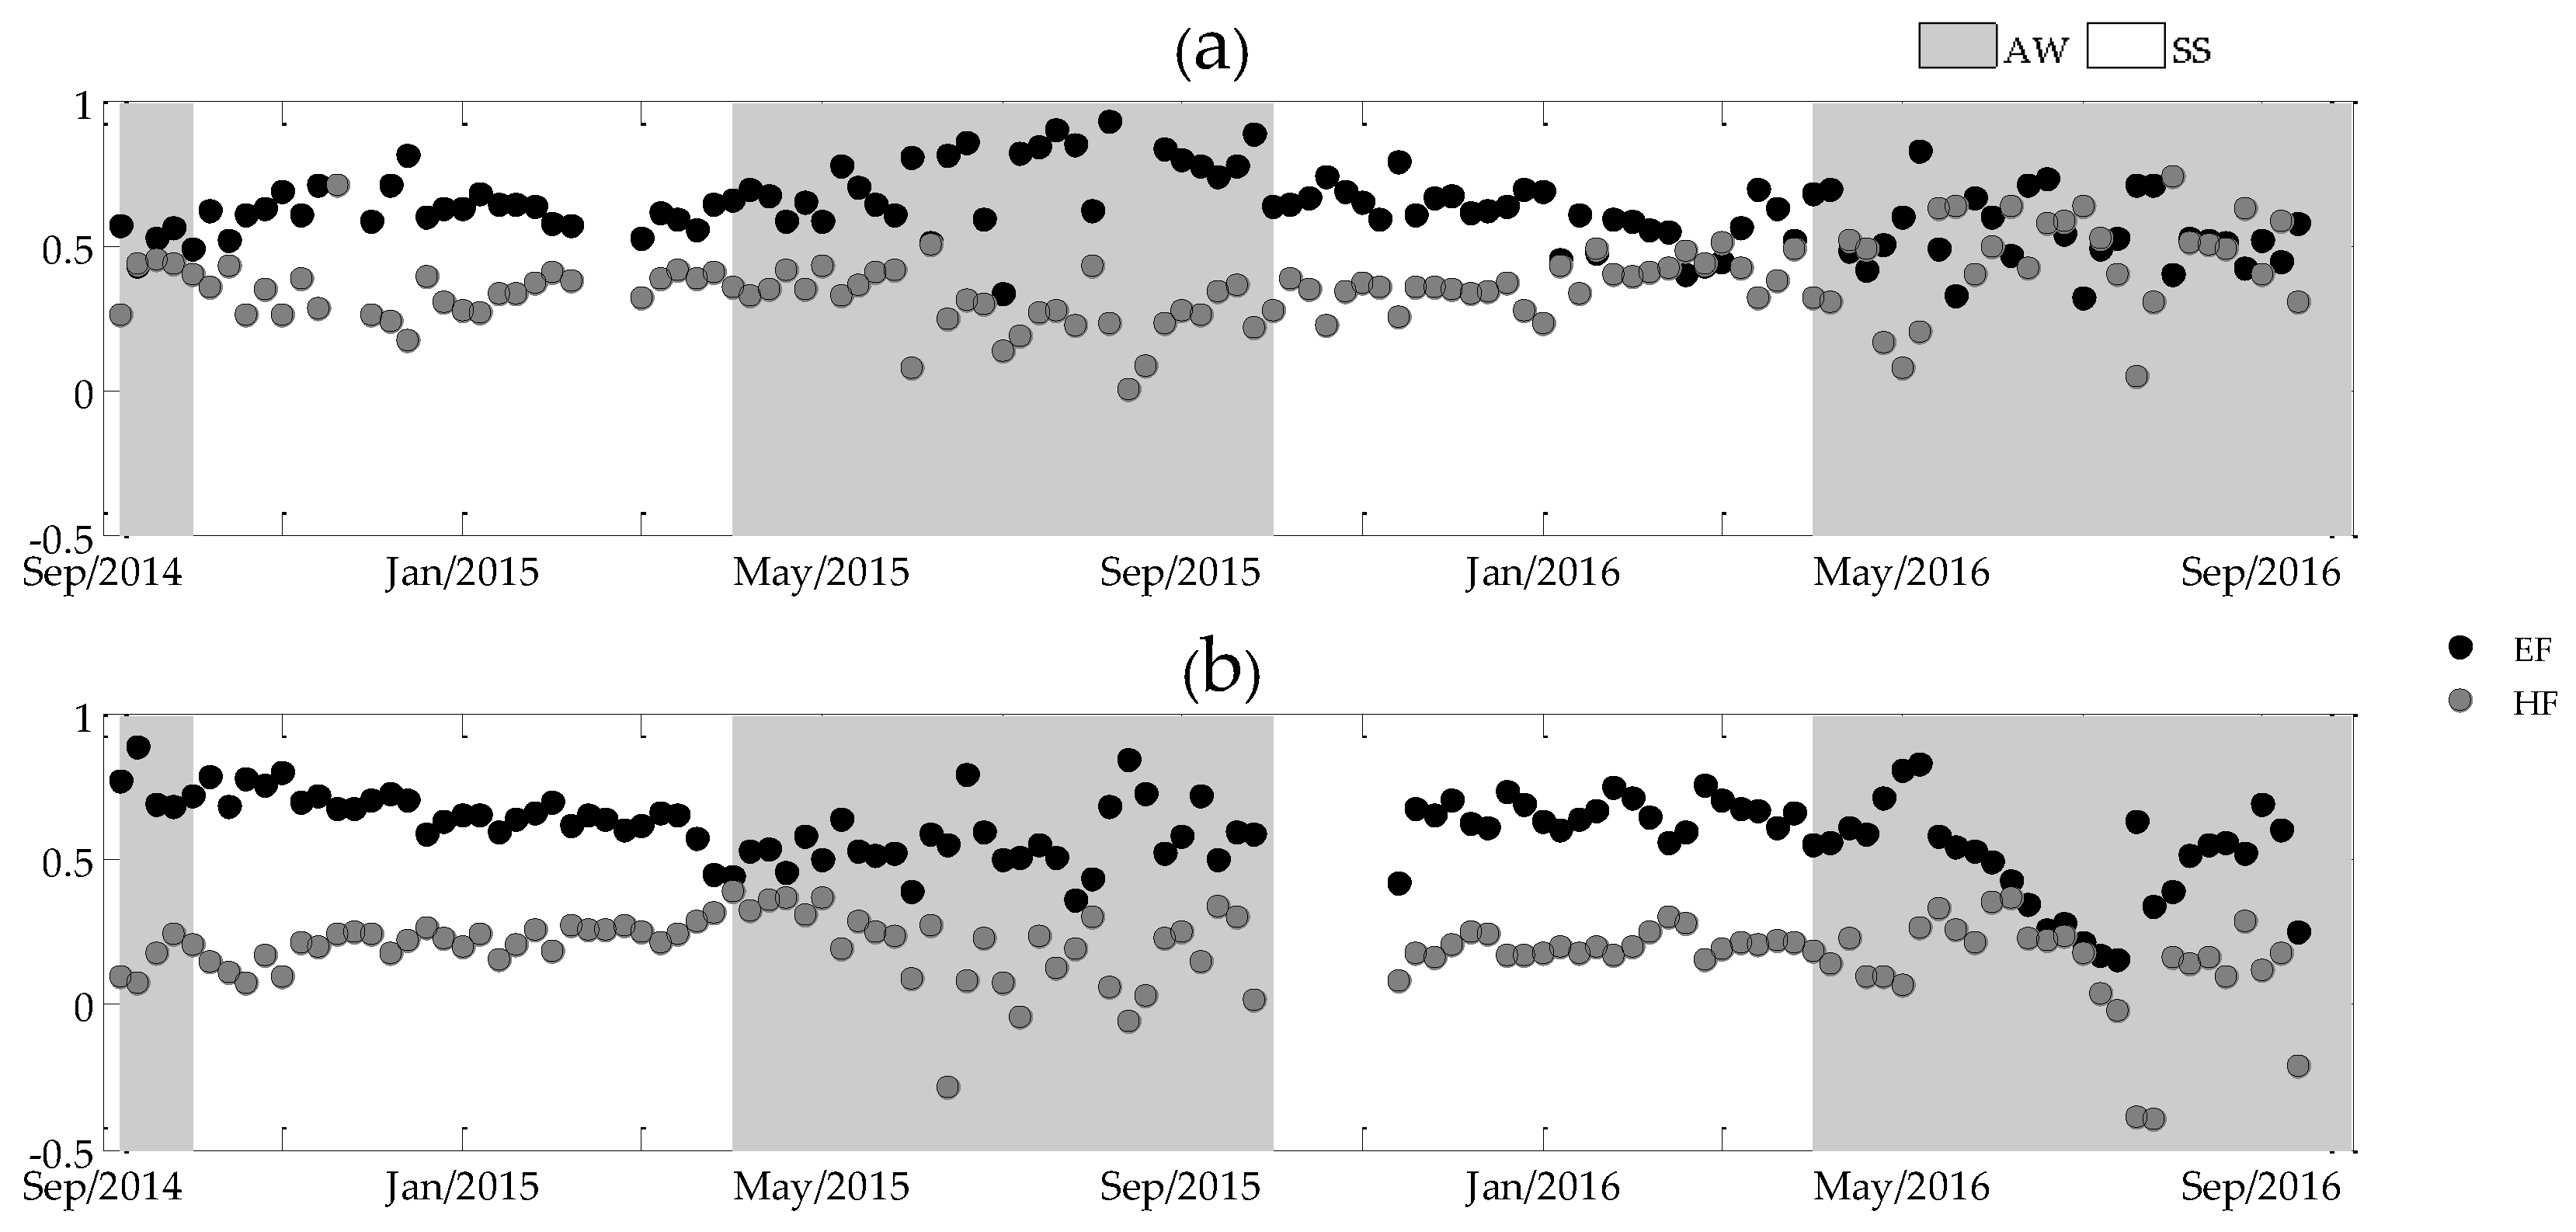
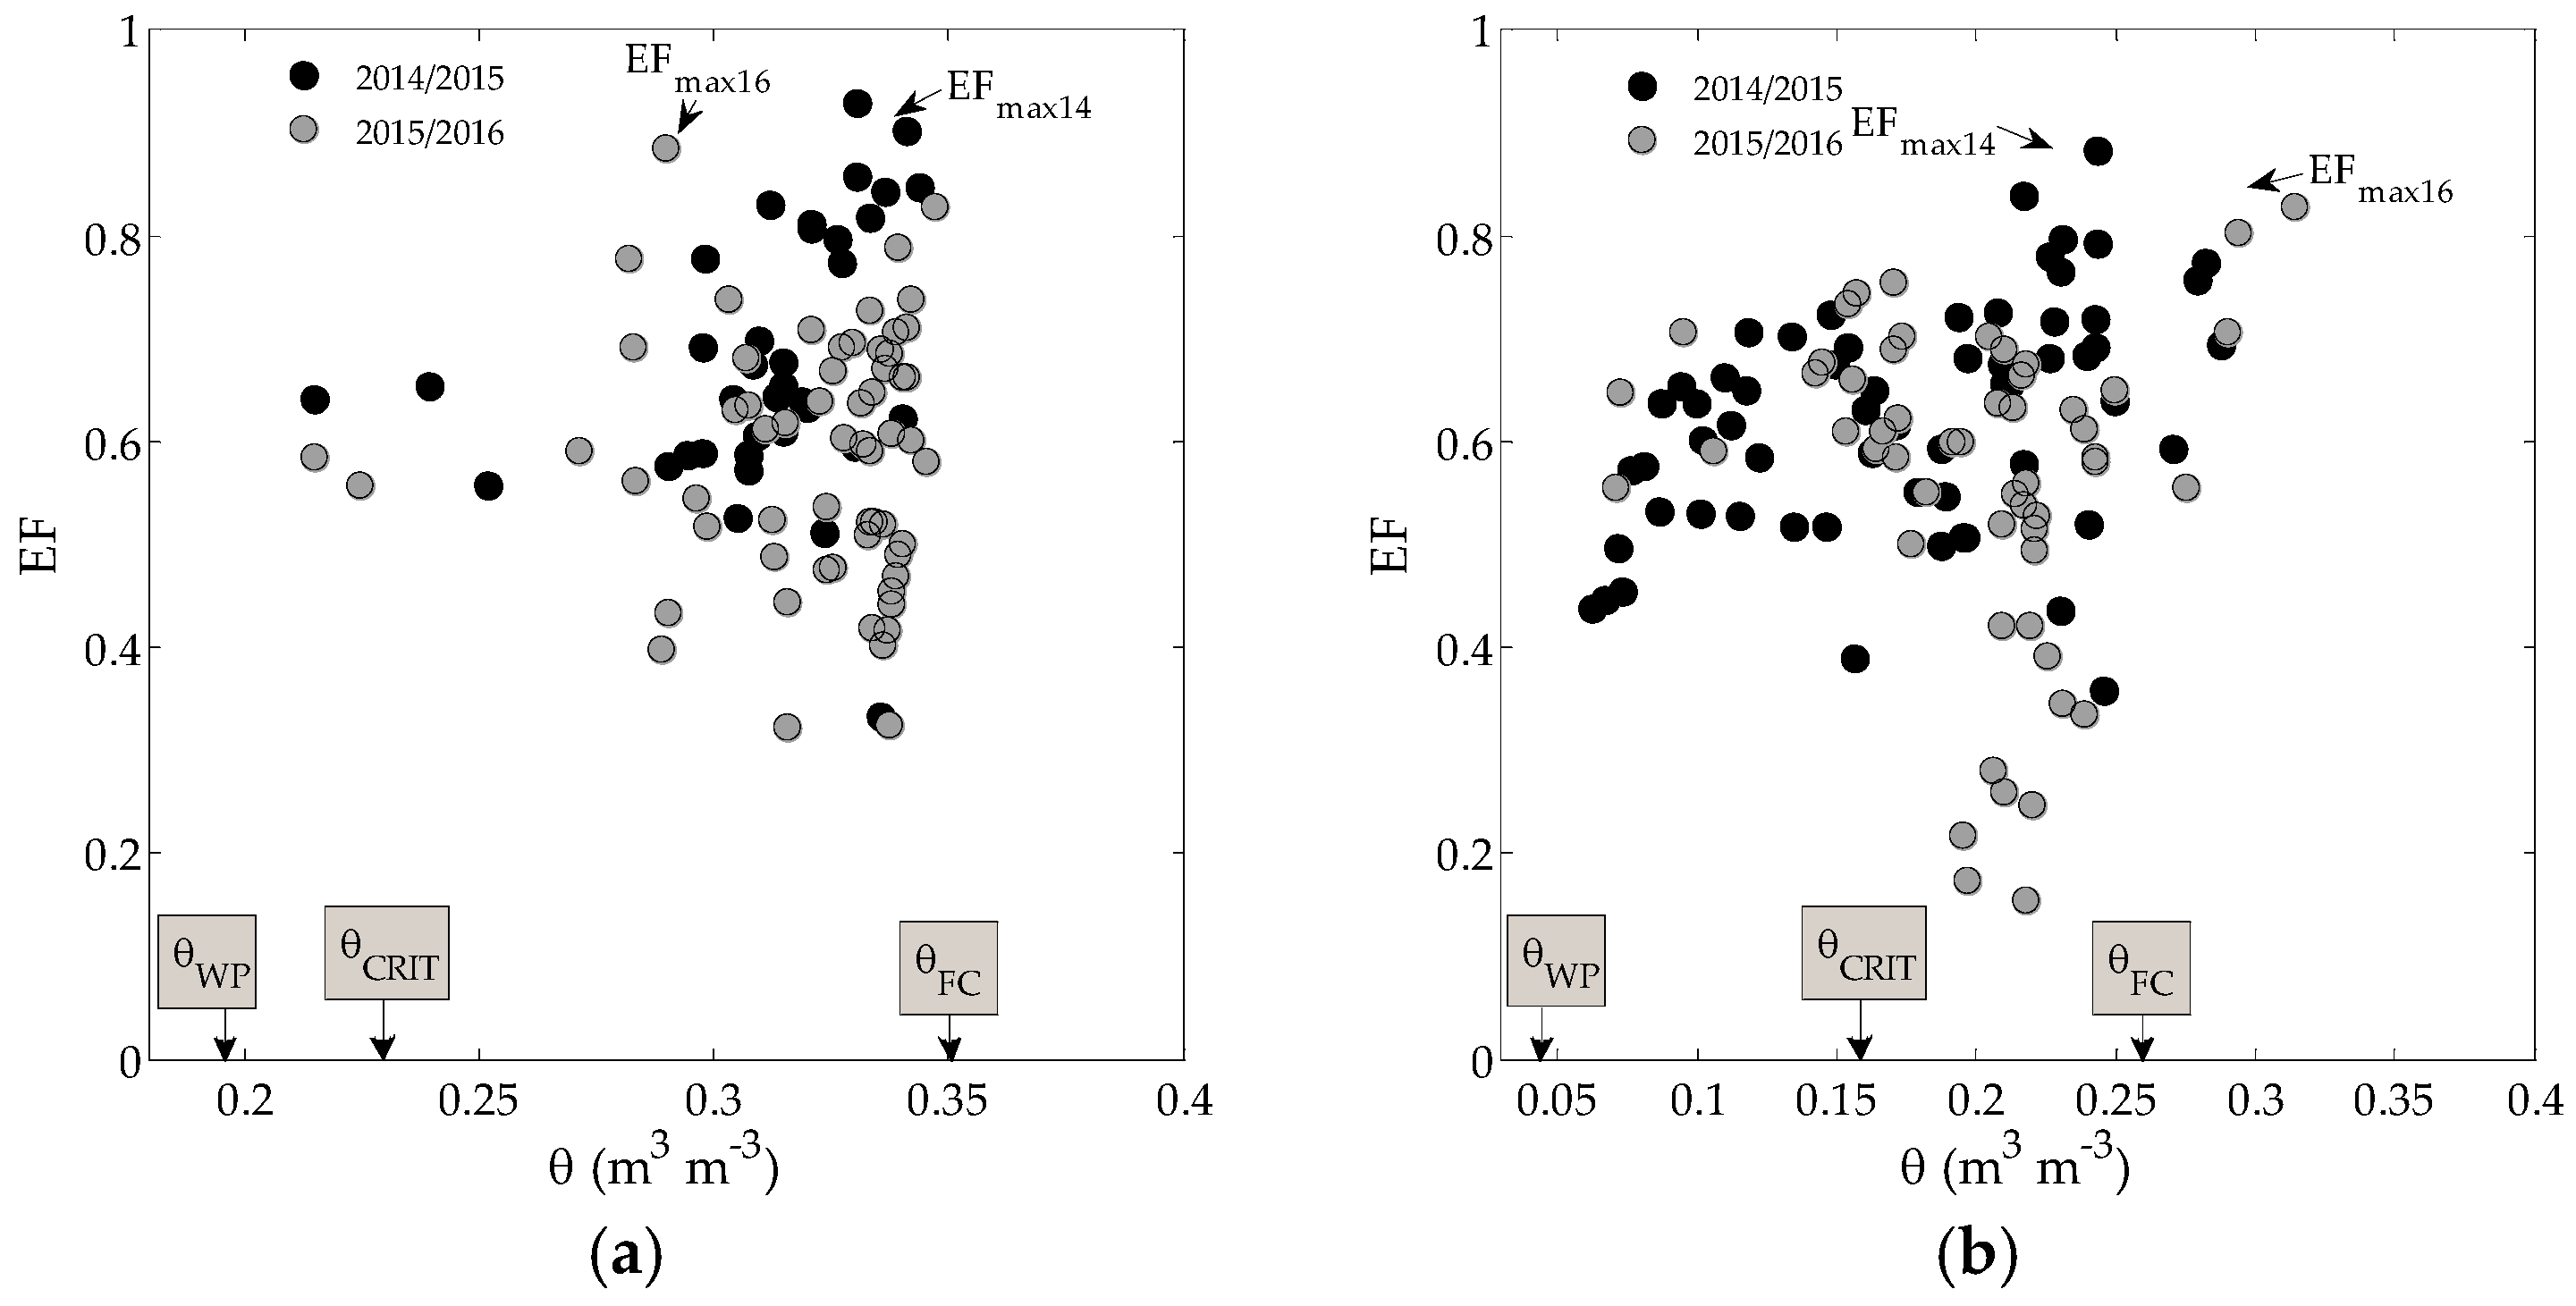
3.3. Energy and Water Availability in the Pampa Biome

The partition of the net radiation, Rn, between H (heat fraction, HF = H/Rn) and LE (evaporative fraction, EF = LE/Rn) is shown in Figure 5. Both sites presented a significant difference in the daily values of fractions HF and EF. In general, EF values were greater than HF. EF presented a more significant seasonal variation and EF decreased during the AW period, with minimums between May and August and higher values between September and October, the period of plant growth (increase in biomass production) in the Pampa [45]. Moreover, in the AW season, HF and EF presented greater daily variability, while in the SS period, that variability was small. The magnitude of the difference between HF and EF was higher during SS periods, as influenced by the water and energy availability, with increasing EF values.
The evaporative fraction in the year 2014/2015 was 0.69 for the PAS site and 0.66 for the SMA site. In the year 2015/2016, these values decreased by 8% and 11% in the PAS and SMA sites, respectively. The annual mean evaporative fraction for the total study period was 0.64 and 0.66 for the SMA and PAS sites, respectively (Table 2). Therefore, approximately 65% of the Rn was used for the evapotranspiration process in the Pampa biome. In pasture vegetation near the Mediterranean coast, Trepekli et al. [10] found that 67% of the available energy was transformed into LE during the growing season and 20% during the vegetation senescence period.
Table 2 presents the values of the evaporative fraction in other Brazilian biomes. Da Rocha et al. [13], in the Amazon rainforest, and Sanches et al. [15], in Pantanal, obtained average annual values for the evaporative fraction of about 25% and 30%, respectively, higher when compared to Pampa. Cabral et al. [17] found for Cerrado an annual mean EF similar to the results obtained in this study. Diferently, Giambelluca et al. [16] obtained EF values of 27% for Cerrado Denso and 39% for the Campo Cerrado lower than Pampa.
The evaporative fraction can be characterized into two main evapotranspiration regimes as proposed by Seneviratne et al. [46]: soil water limited or energy limited. The reduction of soil water content influences the evaporative fraction because when theta is low, the extraction of water by the roots faces additional resistances and the rate of water extraction results are smaller than the potential (not stressed) ET rate [4,35]. In other words, soil moisture provides a first-order control on land–atmosphere exchanges when it is limiting. Figure 6 shows the relationship between soil water content (θ) at 0.10-m depth and the evaporative fraction for our sites. The results did not show any peculiar relationship that could help identify those two ET regimes, so a specific analysis was required. From the experimentally measured field capacity (θFC) and permanent wilting point (θWP), the average values for these parameters for 0.1 m were θFC = 0.35 and 0.26 m3 m−3, respectively, for SMA and PAS, and θWP = 0.17 and 0.04 m3 m−3 for SMA and PAS, respectively. Shuttleworth [47] defined the critical soil water content (θCRIT) distinguishing those two evapotranspiration regimes (water or energy limited ET) as a typical value of 50%–80% of θFC. We assumed θCRIT as 65% of θFC (a mean value between 50% and 80%), thus resulting in θCRIT values of 0.23 and 0.17 m3 m−3 for SMA and PAS, respectively.
EF reached a maximum value EFmax = 0.93 for θ = 0.33 m3 m−3 in 2014/2015 and of EFmax = 0.88 for θ = 0.29 m3 m−3 in 2015/2016 at the SMA site. For the PAS site, the maximum EFs were EFmax = 0.88 for θ = 0.24 m3 m−3 in 2014/2015 and of EFmax = 0.83 for θ = 0.31 m3 m−3 in 2015/2016. These values of θ for the maximum EF were between θCRIT and θFC at both the SMA and PAS sites for 2014/2015. However, for PAS in 2015/2016, the value of θ for EFmax exceeded the values of field capacity. At the SMA site, for both years of study, ET regimes were energy limited, corresponding to values of soil water content above the critical value, θCRIT. In other words, the evaporative fraction was independent of the soil water content and the ET process was controlled by the available energy. At the PAS site, where the soil had a smaller soil water holding capacity and the soil water content remained lower than at SMA, the ET regimes were not well defined. During the two years of analysis, a greater dependence on the soil water content was observed, but values of θ higher than θCRIT were observed, namely, for EFmax, due to the large and frequent precipitation observed. These results demonstrated that the energy partitioning response to precipitation was more important at the PAS site because its soil had a low water holding capacity.
The analysis of the limiting factors, as well as the partitioning of the available energy in the turbulent fluxes, is of essential importance for the modeling of these surface processes. Bagley et al. [48] pointed out that the variables influencing the surface flux partition may change seasonally, depending on the local vegetation conditions. It could also be noticed from our results that the soil and climate behavior were influenced by seasonality, which also affected the partitioning of the turbulent flux. Gokmen et al. [49] emphasized that the overestimation of ET usually occurs in the hydrological regime where water availability is the limiting factor. Although the relationship between soil water content and evapotranspiration depends on soil type, vegetation type, and vegetation adaptation to dryness [50], the role of soil water content near the surface is significant.

3.4. Evapotranspiration Variability in the Pampa Biome

The ETact averages for the entire period at the SMA and PAS sites, 2.36 ± 1.4 and 2.56 ± 1.7 mm d−1, respectively, were very similar. Assuming the average of both sites, the Brazilian Pampa biome presented a mean annual ETact of 2.45 mm d−1. The daily ETact values ranged from close to 0 to almost 7.1 mm d−1 at both sites, with the lowest values in the AW period and the highest values in the SS period (Figure 7), coinciding with the seasonal behavior of global radiation (Figure 2a).
The daily ETact decreased dramatically on cloudy days and subsequently increased sharply. On average, the ETact in PAS was around 8% greater than in SMA (Table 3). This may be influenced by the lower wind speed and lower Rg in SMA, as described in Section 2.1 [51]. The mean ETact values during the AW period at the SMA and PAS sites were, respectively, 50% and 38% of the mean ETact in the SS period.
Between July and September 2015, higher values for ETact were observed at the SMA site. By separately analyzing the environmental variables for these days, we observed that high VPD, low relative humidity of the air, high wind intensity reaching 4.7 m s−1, and a high air temperature of about 30 °C did occur (Figure 2). These atypical days of high ETact values during AW were characterized by the “north wind phenomenon”, corresponding to the occurrence of hot and humid wind coming from Amazonia and which intensifies near Santa Maria due to its particular topography [52]. For pasture land near the Mediterranean coast, Trepekli et al. [10] reported maximum values for ETact of 8.2 mm d−1 in summer, the value of which is 15% greater than those found in our study. Those authors also reported that the values obtained for ETact greater than 8 mm d−1 were the highest ET rates previously reported in comparable study areas. These values occurred due to advection flows from the sea. However, negligible values for ETact were found in winter.
There was a small difference between annual ETact average values for the SMA and PAS sites (Table 3), approximately 2% and 13% in the years 2014/2015 and 2015/2016, respectively. These differences may be associated with the precipitation and the soil characteristics of each site. Figure 3 shows higher soil moisture for the SMA site because the soil water storage was larger there than at PAS. Annual ETact at the PAS site represented 54% and 51% of the annual precipitation for 2014/2015 and 2015/2016, respectively. Differently, at the SMA site, ETact represented 48% of the precipitation for 2014/2015, while for 2015/2016, this percentage was reduced to 39%. On average, the actual ETact represented 44% of the observed precipitation for SMA and 53% for PAS in the two years of study. Therefore, the average annual ETact in the Pampa biome (898 mm year−1) represented 48% of the accumulated precipitation (1878 mm year−1). Krishnan et al. [8] reported a study in a semiarid pasture in North America where precipitation explained more than 80% of the variance in annual evapotranspiration. Paoloni et al. [53] found on the Argentina Pampa an accumulated annual ETact of 1220 mm year−1, around 35% greater than in the Brazilian Pampa. For other Brazilians biomes, Goulart et al. [54] reported a cumulative ET of 1337.5 mm year−1 for the Pantanal, Shuttleworth [55] obtained annual ET of 1393 mm year−1 for the Amazon forest, and Almeida [56] reported 1350 mm year−1 for the Atlantic Forest biome. Da Rocha et al. [13], studying the Amazonia region, reported daily values of 3.96 mm d−1 in the dry season and 3.18 mm d−1 in the wet season. Therefore, the Brazilian Pampa biome presents a smaller annual ET than most Brazilian biomes (Table 2) but with greater seasonality. Furthermore, Giambelluca et al. [16] reported small seasonal variability for Cerrado Denso (CD) and Campo Cerrado (CC) vegetation in the central region of Brazil, with a variation of around 1–1.5 mm d−1. The annual mean was 2.25 and 1.91 mm d−1 for ET in CD and CC, respectively. Thus, the ETact in the Pampa biome was greater and had higher seasonality than both Cerrado biomes in central Brazil.
Daily mean ETact and ETo exhibited a similar seasonal pattern for both sites in the Pampa biome in southern Brazil. Different from ETact, ETo was greater (around 3%) in SMA than at PAS (Table 3). On average, ETact represented 83% of the ETo for the SMA site and about 92% for PAS (Table 3). These high values of the ratio of ETact/ETo indicate that the Pampa has high water availability, since natural grass has an ET rate close to the ideal grass crop assumed as a reference crop. Daily maximum ETo values were 8 and 7.2 mm d−1 for the SMA and PAS sites, respectively. The greatest differences between ETact and ETo occurred by March 2016 in SMA and by early 2015 in PAS, which were observed in transitional periods between climate seasons, likely due to greater thermal amplitude and higher net radiation that occurred during those periods.
ETact was significantly correlated with ETo at both sites analyzed (Figure 8). The Pearson correlation coefficient (r) relating ETact and ETo at the SMA and PAS sites was 0.92 and 0.95, respectively. These results suggest that ETo was a good indicator of ETact in the Pampa biome because soil water availability did not restrict ETact, the values of which were close to ETo. This indicates that the seasonal variability of ETact was determined by atmospheric forcing, mainly, Rn and VPD. The lowest values of ETact and ETo were observed during the AW period, whereas the opposite was observed in the SS period, then associated with a greater variability of differences between ETact and ETo. The higher correlation between ETact and ETo was observed at the PAS site, which is coherent with the previous analysis about the energy and water availability in Section 3.4.

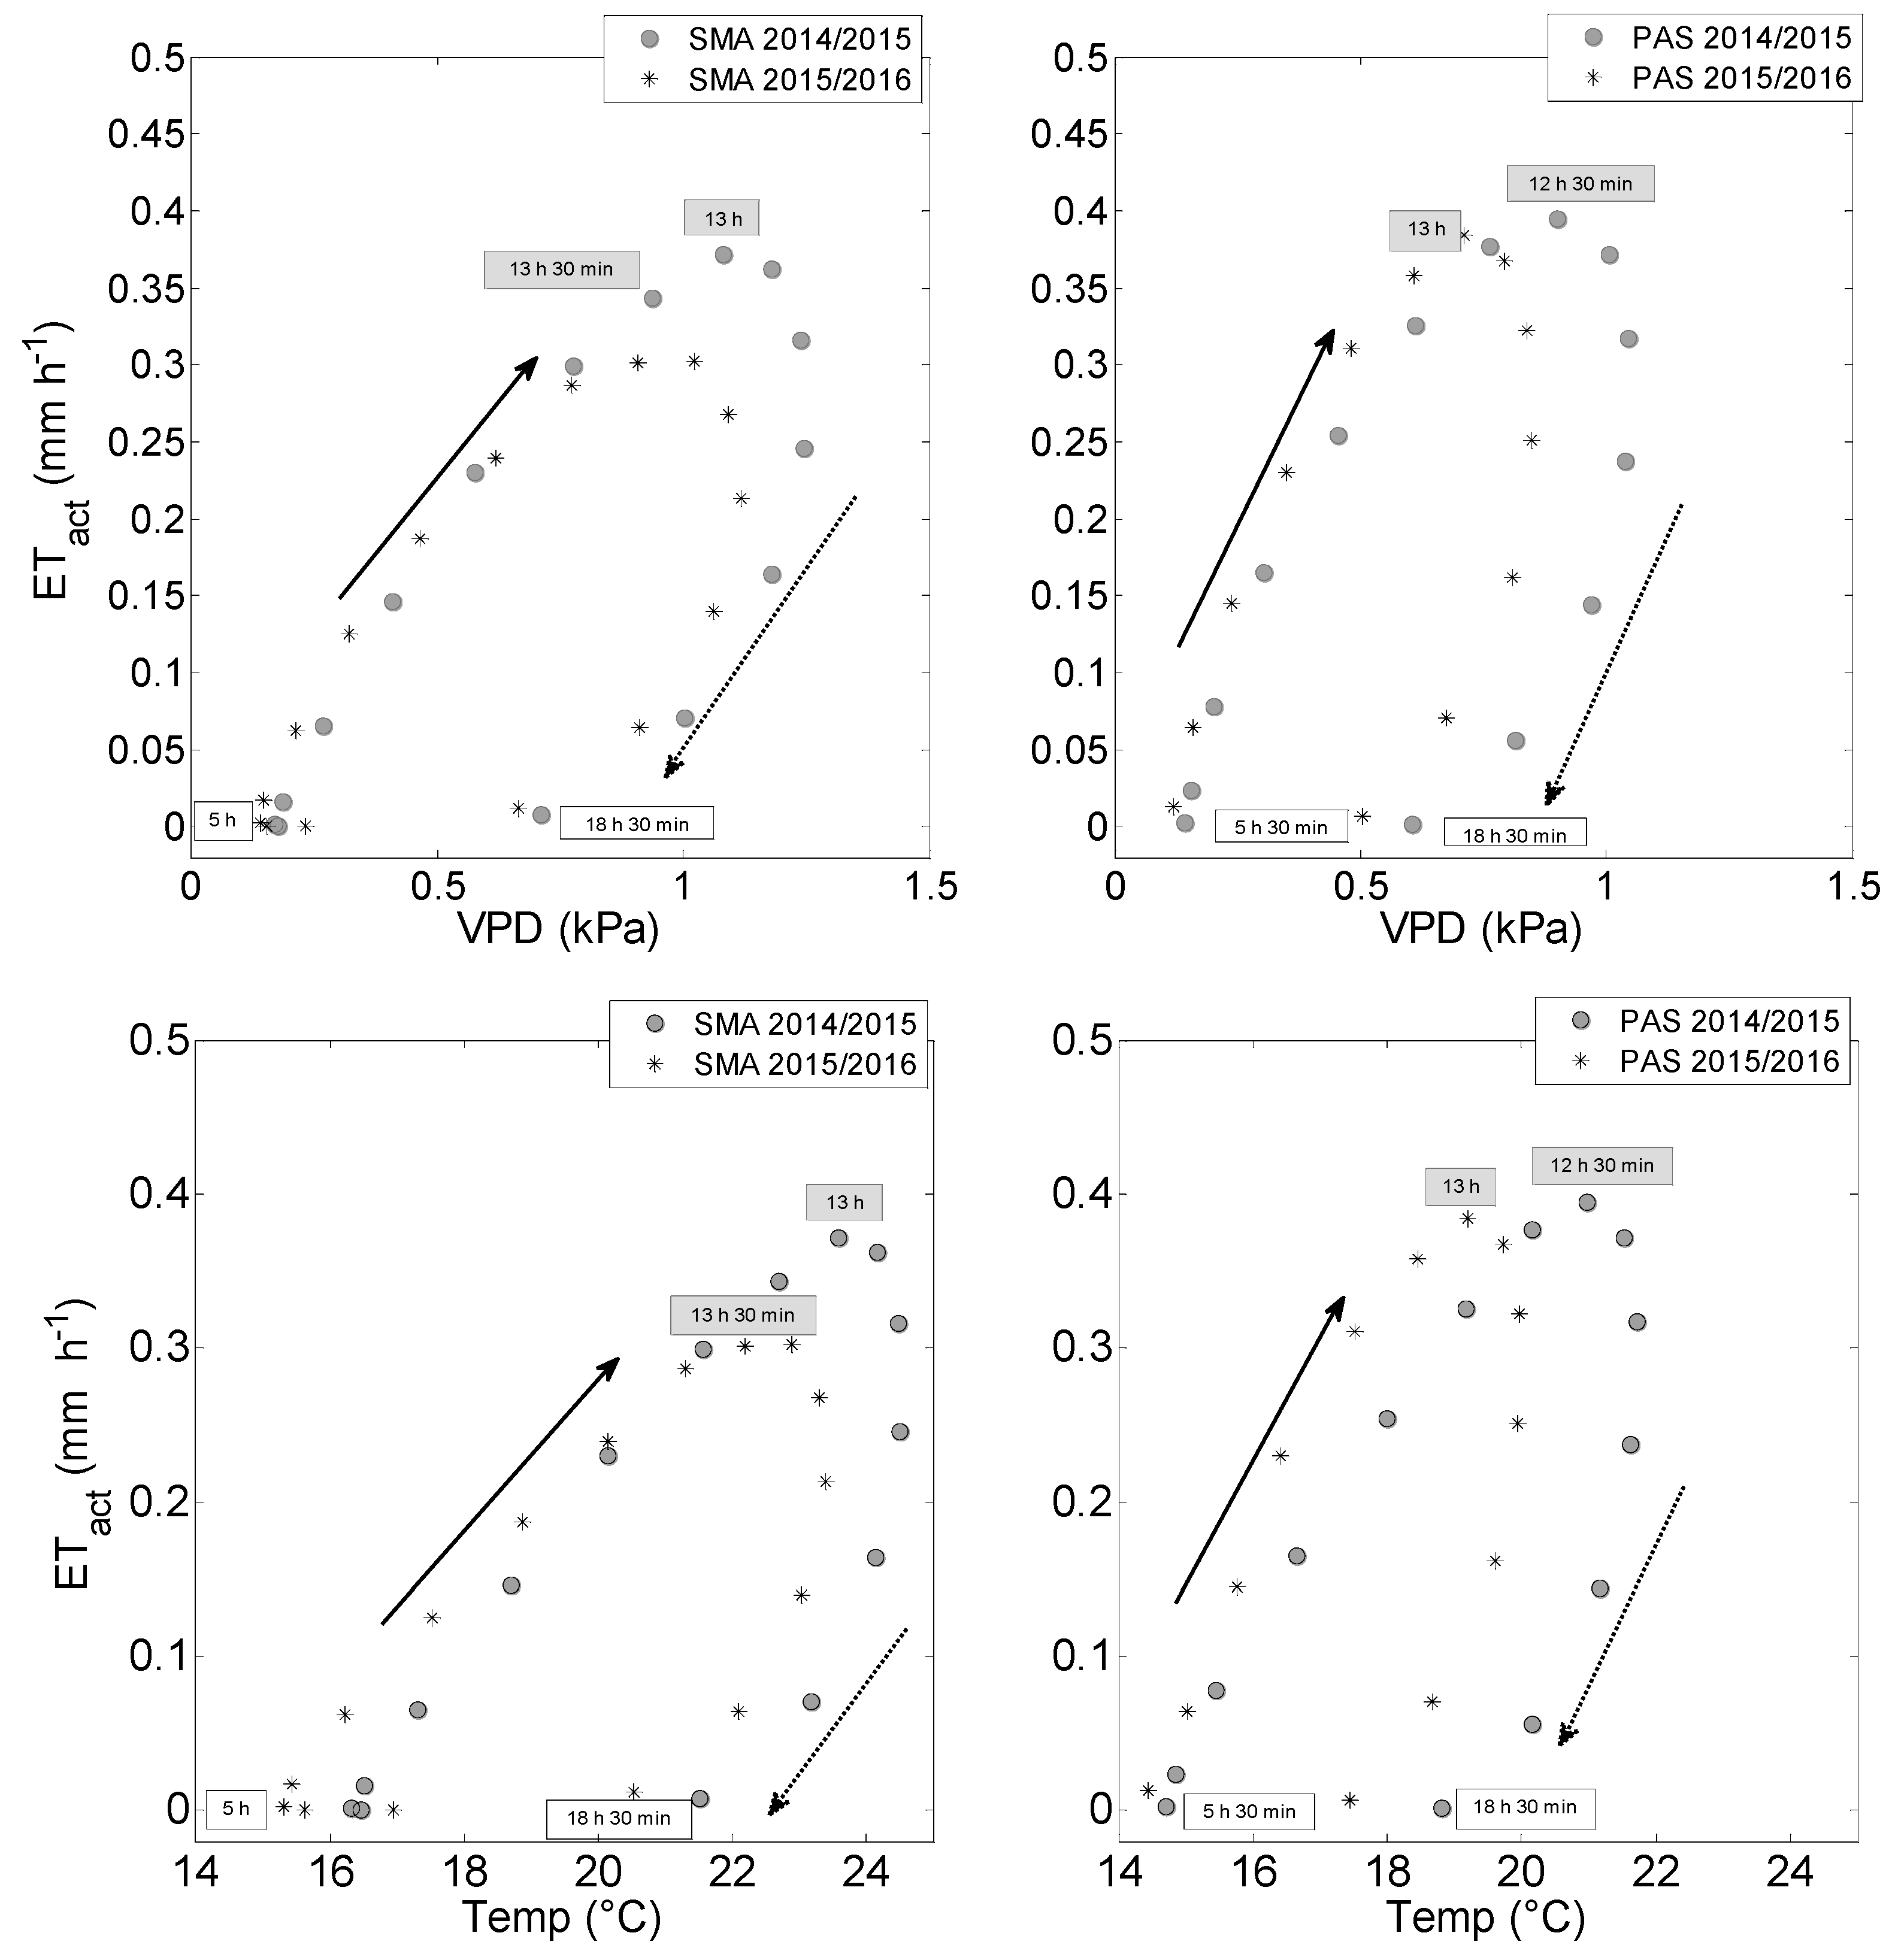
3.5. Hysteretic Relations between ETact and Meteorological Variables

The concept of hysteresis is related to the ability of a system to absorb and recover from disturbances. Hysteresis can therefore be defined as the dependence of a variable response not only on the value of a variable driving but also on its past history [57]. Hysteretic relations were also found between the diurnal variation in evapotranspiration and vapor pressure deficit.
Here, hysteresis loops clockwise in the relationships between ETact and vapor pressure deficit (VPD) and air temperature (Temp) were observed in the average daily cycles of 2014/2015 and 2015/2016 (Figure 9), respectively. No hysteretic loops were observed for both sites in ETact relations with the net radiation; instead, a better ETact correlation with this variable was observed. Zheng et al. [58] also reported hysteresis loops on air temperature and VPD relationships with ETact. Likewise, they did not observe an ET hysteresis response to the net radiation variability.
ETact values during the night were around zero and were removed from the hysteresis curves. Frequently, the latent heat flux was negative at night in the sites analyzed, indicating dew formation [40]. At night, ETact values showed slight variations, but at the beginning of the morning, the ETact values increased rapidly and peaked at approximately 12:30 to 1:30 p.m. (local time).
For both sites, ETact increased as soon as VPD increased in the morning. ETact decreased with the reduction of VPD in the afternoon. A similar behavior was observed by Zheng et al. [58] and Ahrends et al. [59]. The increase in ETact in the morning and a subsequent decrease in the afternoon may be directly related to the available energy and the soil water content available to the plants. The opening and/or closing of the stomata may contribute to the appearance of hysteresis. Previous studies have found that stomata responded differently to changes in environmental factors during stomatal control processes, with greater stomatal conductance in the morning [60,61], indicating higher surface conductance and, therefore, a higher evapotranspiration rate compared to the afternoon. Summarizing, stomatal control affects canopy transpiration and avoids excessive water loss on days when the vapor pressure deficit is greater.
The hysteresis loops between ETact and air temperature for SMA and PAS sites were similar to those found between ETact and VPD. The maximum ETact for the year 2014/2015 occurred with the air temperature 1 °C higher than in the year 2015/2016, for both sites. Also, for the 2015/2016, the hysteresis loops shifted to the right side, representing ETact that were small in the morning and greater in the afternoon. In 2015/2016, ETact in the morning was higher for the same air temperature when compared to the year 2014/2015, which agreed with the fact that the average air temperature was then higher. The climatic conditions of the sites controlled the evaporative rate. Thus, in Pedras Altas, the occurrence of stronger winds favored evapotranspiration.
Regarding the intensity of response of ETact to the meteorological variables, we can conclude that the hysteresis was weaker in ETact–Temperature relations when compared to the ETact–VPD relation. The intensity of the hysteresis could be measured through the area formed by the hysteresis loops (normalizing both axes). Thus, the highest areas obtained were in the ETact–VPD ratios for the Pedras Altas site, averaging 7% of the difference between sites. The values obtained for the areas are presented in Table 4. For ETact–Temperature relations, the areas had close values for both sites. The largest difference, approximately 8.3%, occurred in hysteresis loops in the ETact–VPD relationship for the Santa Maria site between the years 2014/2015 and 2015/2016. In this way, we can conclude that for the Pampa biome, the ETact responded more strongly to the VPD than to temperature, with a hysteresis mean area 74% larger than that relative to the ETact–Temperature relationship.

4. Conclusions

The evapotranspiration over the Brazilian Pampa biome was assessed at two sites where observations were performed using eddy covariance. The results allowed us to find answers to various scientific questions:
(i) How is the partition of energy in the surface?
During the study period, approximately 65% of the available energy was used for evapotranspiration in the Pampa biome. Although there were significant differences in the soil moisture conditions between the sites analyzed, there was no apparent distinction in the energy partition. The latent heat flux was the main energy balance component in both the AW and SS periods. While the latent heat flux presented strong seasonality, the sensible heat flux presented a low amplitude through the year. In general, the energy balance components were higher in the SS period than during AW.
(ii) Which are the physical processes determining the evaporative fraction?
In the analyzed sites of the Pampa biome, both soil moisture and available energy were not identified as limiting factors for evapotranspiration. Although the vegetation of both sites was composed of the same species and the soil properties were different, the high water availability in both sites did not affect the energy partition.
(iii) What is the seasonal variability of ETact?
The Pampa biome presented strong seasonality of evapotranspiration, with the highest evapotranspiration rates in the SS period, where the vegetation was in active growth and, therefore, had higher biomass production. Even in periods when there was less biomass production of the vegetation in the Pampa, during AW, evapotranspiration corresponded to a high fraction of the available energy. The annual mean of ETact was 2.45 mm d−1. Daily values of ETact were very similar between sites.
(iv) What is the relation of the actual to the reference ET?
The water availability in the Pampa biome was not a limiting factor for ETact since LE was the principal fraction of net radiation, which resulted in few differences between the reference ET and the actual ET. These conditions allowed ETo to be used as an indicator of ET in the Pampa biome. ETact was higher in PAS, while ETo was higher in SMA. These differences were not fully clarified in this study, but it could be hypothesized that this behavior related to differences in soil water dynamics influencing ETact. It is also assumed that those differences are likely associated with vegetation biophysical control, such as canopy surface conductance and canopy structure, which needs to be further investigated.
(v) What is the relationship between ETact and meteorological variables on a daily timescale?
The ETact responded linearly to the net radiation but showed hysteresis when related to VPD and air temperature, with similar values for both sites, although responding more strongly to VPD. Clockwise hysteresis loops were observed relative to both variables.
This first study on evapotranspiration of the Pampa biome provides some understanding of the processes and driving forces and factors influencing ET variability. Further studies are required for other areas where ecosystems are differently affected by grazing or by agricultural systems, as well as where vegetation may be influenced by elevation, namely, relative to lowlands. In addition, relating biome ET studies with crop ET studies may also aid in understanding the complexity of these processes.
Summarizing, the Pampa biome is a complex ecosystem where the processes of surface–atmosphere interaction are dependent on weather, climate, soil, and vegetation. In this way, the preservation of this biome is essential for the maintenance of climate, animal, and plant species, as well as local culture.

Author Contributions

The study was planned by G.C.R. and D.R.R., lab data analysis was performed and writing was performed by G.C.R. L.S.P. discussed a few features of the experiments and revised the article writing together with D.R.R. F.L.F.Q. conceived the experiment in Santa Maria Site. D.R.R., H.F.d.C.V., and O.L.L.d.M. obtained the instrumented flux towers.

Funding

The authors acknowledge the National Council for Scientific and Technological Development (CNPq—Brazil), the Coordination for the Improvement of Higher Education Personnel (CAPES—Brazil), the Foundation for Research of Rio Grande do Sul State (FAPERGS), and the Financier of Studies and Projects (FINEP—Brazil) for funding the reported study.

Acknowledgments

The authors acknowledge the staff of the Micrometeorology Lab of the Federal University of Santa Maria for the technical support provided, particularly relative to the flux towers and the eddy covariance instrumentation.

Conflicts of Interest

The authors declare no conflict of interest.

References

  1. Baldocchi, D.D.; Hincks, B.B.; Meyers, T.P. Measuring biosphere atmosphere exchanges of biologycally related gases with micrometeorological methods. Ecology 1988, 69, 1331–1340. [Google Scholar] [CrossRef]
  2. Allen, R.G.; Pereira, L.S.; Howell, T.A.; Jensen, M.E. Evapotranspiration information reporting: I. Factors governing measurement accuracy. Agric. Water Manag. 2011, 98, 899–920. [Google Scholar] [CrossRef]
  3. Overbeck, G.E.; Müller, S.C.; Fidelis, A.; Pfadenhauer, J.; Pillar, V.D.; Blanco, C.C.; Boldrini, I.I.; Both, R.; Forneck, E.D. Brazil’s neglected biome: The South Brazilian Campos. Perspect. Plant Ecol. Syst. 2007, 9, 101–116. [Google Scholar] [CrossRef]
  4. Paredes, P.; Rodrigues, G.J.; Petry, M.T.; Severo, P.O.; Carlesso, R.; Pereira, L.S. Evapotranspiration partition and crop coefficients of Tifton 85 bermudagrass as affected by the frequency of cuttings. Application of the dual Kc approach. Water 2018, 10, 558. [Google Scholar] [CrossRef]
  5. Boldrini, I.I.; Overbeck, G.E.; Trevisan, R. Biodiversidade de plantas. In Os Campos do Sul, 1st ed.; Pillar, V.P., Lange, O., Eds.; UFRGS: Porto Alegre, Brazil, 2015; pp. 53–70. ISBN 978-85-66106-50-3. [Google Scholar]
  6. Pillar, V.D.P.; Müller, S.C.; Castilhos, Z.M.S.; Jacques, A.V.A. Campos Sulinos—Conservação e uso Sustentável da Biodiversidade, 3rd ed.; Ministério do Meio Ambiente: Brasília, Brazil, 2009; 443p, ISBN 978-85-7738-117-3.
  7. Nabinger, C.; Ferreira, E.T.; Freitas, A.K.; Carvalho, P.C.F.; Sant’Anna, D.M. Produção animal com base no campo nativo: Aplicações de resultados de pesquisa. In Campos Sulinos—Conservação e uso Sustentável da Biodiversidade, 3rd ed.; Ministério do Meio Ambiente: Brasília, Brazil, 2009; pp. 175–199. ISBN 978-85-7738-117-3. [Google Scholar]
  8. Krishnan, P.; Meyers, T.P.; Scott, R.L.; Kennedy, L.; Heuer, M. Energy exchange and evapotranspiration over two temperate semi-arid grasslands in North America. Agric. For. Meteorol. 2012, 153, 31–44. [Google Scholar] [CrossRef]
  9. Hu, Z.; Wen, X.; Sun, X.; Li, L.; Yu, G.; Lee, X.; Li, S. Partitioning of evapotranspiration through oxygen isotopic measurements of water pools and fluxes in a temperate grassland. J. Geophys. Res. Biogeosci. 2014, 119, 358–371. [Google Scholar] [CrossRef]
  10. Trepekli, A.; Loupa, G.; Rapsomanikis, S. Seasonal evapotranspiration, energy fluxes and turbulence variance characteristics of a Mediterranean coastal grassland. Agric. For. Meteorol. 2016, 226–227, 13–27. [Google Scholar] [CrossRef]
  11. Rajan, N.; Maas, S.J.; Cui, S. Extreme drought effects on summer evapotranspiration and energy balance of a grassland in the Southern Great Plains. Ecohydrology 2015, 8, 1194–1204. [Google Scholar] [CrossRef]
  12. Malhi, Y.; Pegoraro, E.; Nobre, A.D.; Pereira, M.G.P.; Grace, J.; Culf, A.D.; Clement, R. Energy and water dynamics of a central Amazonian rain forest. J. Geophys. Res. 2002, 107, 8061. [Google Scholar] [CrossRef]
  13. Da Rocha, H.R.; Goulden, M.L.; Miller, S.D.; Menton, M.C.; Pinto, L.D.V.O.; de Freitas, H.C.; Silva Figueira, A.M. Seasonality of water and heat fluxes over a tropical forest in eastern Amazonia. Ecol. Appl. 2004, 14, S22–S32. [Google Scholar] [CrossRef]
  14. Da Rocha, H.R.; Manzi, A.; Cabral, O.M.; Miller, S.D.; Goulden, M.L.; Saleska, S.R.; Coupe, N.R.; Wofsy, S.C.; Borma, L.S.; Artaxo, P.; et al. Patterns of water and heat flux across a biome gradient from tropical forest to savanna in Brazil. J. Geophys. Res. 2009, 114, 1–8. [Google Scholar] [CrossRef]
  15. Sanches, L.; Vourlitis, G.L.; Alves, M.C.; Pinto-Júnior, O.B.; Nogueira, J.S. Seasonal patterns of evapotranspiration for a Vochysia divergens Forest in the Brazilian Pantanal. Wetlands 2011, 31, 1215–1225. [Google Scholar] [CrossRef]
  16. Giambelluca, T.W.; Scholz, F.G.; Bucci, S.J.; Meinzer, F.C.; Goldstein, G.; Hoffmann, W.A.; Franco, A.C.; Bucherta, M.P. Evapotranspiration and energy balance of Brazilian savannas with contrasting tree density. Agric. For. Meteorol. 2009, 149, 1365–1376. [Google Scholar] [CrossRef]
  17. Cabral, O.M.R.; da Rocha, H.R.; Gash, J.H.; Freitas, H.C.; Ligo, M.A.V. Water and energy fluxes from a woodland savanna (Cerrado) in southeast Brazil. J. Hydrol. Reg. Stud. 2015, 4, 22–40. [Google Scholar] [CrossRef]
  18. Santos, A.B. dos; de Quadros, F.L.F.; Confortin, A.C.C.; Seibert, L.; Ribeiro, B.S.R.; Severo, P.O.; Casanova, P.T.; Machado, G.G. Rio Grande do Sul State’s (Brazil) native grasses morphogenesis under rotational grazing during spring and summer. Ciência Rural 2014, 44, 97–103. [Google Scholar] [CrossRef]
  19. Quadros, F.L.F.; Pillar, V.P. Dinâmica vegetacional em pastagem natural submetida a tratamentos de queima e pastejo. Ciência Rural 2001, 31, 863–868. [Google Scholar] [CrossRef] [Green Version]
  20. Oliveira, L.B.; Soares, E.M.; Jochims, F.; Tiecher, T.; Marques, A.R.; Kuinchtner, B.C.; Rheinheimer, D.S.; de Quadros, F.L.F. Long-Term Effects of Phosphorus on Dynamics of an Overseeded Natural Grassland in Brazil. Rangel. Ecol. Manag. 2015, 68, 445–452. [Google Scholar] [CrossRef]
  21. Confortin, A.C.C.; Quadros, F.L.F.; Santos, A.B.; Seibert, L.; Severo, P.O.; Ribeiro, B.S.R. Leaf tissue fluxes of Pampa biome native grasses submitted to two grazing intervals. Grass Forage Sci. 2016, 71, 1–9. [Google Scholar] [CrossRef]
  22. Instituto Brasileiro de Geografia e Estatística. Available online: http://mapas.ibge.gov.br/tematicos/solos (accessed on 25 May 2017).
  23. Kottek, M.; Grieser, J.; Beck, C.; Rudolf, B.; Rubel, F. World Map of the Köppen-Geiger climate classification updated. Meteorol. Z. 2006, 15, 259–263. [Google Scholar] [CrossRef]
  24. Overbeck, G.E.; Boldrini, I.I.; Carmo, M.R.B.; Garcia, E.N.; Moro, R.S.; Pinto, C.E.; Trevisan, R.; Zannin, A. Fisionomia dos Campos. In Os Campos do Sul, 1st ed.; Pillar, V.P., Lange, O., Eds.; UFRGS: Porto Alegre, Brazil, 2015; pp. 33–41. ISBN 978-85-66106-50-3. [Google Scholar]
  25. Kljun, N.; Calanca, P.; Rotach, M.W.; Schmid, H.P. A simple parameterisation for flux footprint predictions. Bound.-Lay. Meteorol. 2004, 112, 503–523. [Google Scholar] [CrossRef]
  26. Webb, E.K.; Pearman, G.I.; Leuning, R. Correction of flux measurements for density effects due to heat and water vapor transfer. Q. J. R. Meteorol. Soc. 1980, 106, 85–100. [Google Scholar] [CrossRef]
  27. Gash, J.H.C.; Culf, A.D. Applying linear de-trend to eddy correlation data in real time. Bound.-Lay. Meteorol. 1996, 79, 301–306. [Google Scholar] [CrossRef]
  28. Moncrieff, J.; Clement, R.; Finnigan, J.; Meyers, T. Averaging, Detrending, and Filtering of Eddy Covariance Time Series. In Handbook of Micrometeorology; Lee, X., Massman, W., Law, B., Eds.; Springer: Dordrecht, The Netherlands, 2004; Volume 29, pp. 7–31. ISBN 978-1-4020-2265-4. [Google Scholar]
  29. Moncrieff, J.B.; Massheder, J.M.; Bruin, H.; Elbers, J.; Friborg, T.; Heusinkveld, B.; Kabat, P.; Scott, S.; Soegaard, H.; Verhoef, A. A system to measure surface fluxes of momentum, sensible heat, water vapor and carbon dioxide. J. Hydrol. 1997, 188–189, 589–611. [Google Scholar] [CrossRef]
  30. Mauder, M.; Foken, T. Impact of post-field data processing on eddy covariance flux estimates and energy balance closure. Meteorol. Z. 2006, 15, 597–609. [Google Scholar] [CrossRef]
  31. Nakai, T.; Shimoyama, K. Ultrasonic anemometer angle of attack errors under turbulent conditions. Agric. For. Meteorol. 2012, 18, 162–163. [Google Scholar] [CrossRef]
  32. Vickers, D.; Mahrt, L. Quality control and flux sampling problems for tower and aircraft data. J. Atmos. Ocean. Technol. 1997, 14, 512–526. [Google Scholar] [CrossRef]
  33. Foken, T. The energy balance closure problem: An overview. Ecol. Appl. 2008, 18, 1351–1367. [Google Scholar] [CrossRef]
  34. Reichstein, M.; Falge, E.; Baldocchi, D.; Papale, D.; Aubinet, M.; Berbigier, P.; Bernhofer, C.; Buchmann, N.; Gilmanov, T.; Granier, A.; et al. On the separation of net ecosystem exchange into assimilation and ecosystem respiration: Review and improved algorithm. Glob. Chang. Biol. 2005, 11, 1424–1439. [Google Scholar] [CrossRef]
  35. Allen, R.G.; Pereira, L.S.; Raes, D.; Smith, M. Crop Evapotranspiration—Guidelines for Computing Crop Water Requirements; FAO Irrigation and Drainage Paper 56; FAO: Rome, Italy, 1998; p. 300. [Google Scholar]
  36. INMET—Instituto Nacional de Meteorologia. Available online: http://www.inmet.gov.br/portal/ (accessed on 21 March 2018).
  37. Climate Prediction Center—NOAA. Available online: http://origin.cpc.ncep.noaa.gov/products/analysis_monitoring/ensostuff/ONI_v5.php (accessed on 19 October 2017).
  38. Wilson, K.B.; Hanson, P.J.; Mulholland, P.J.; Baldocchi, D.D.; Wullschleger, S.D. A comparison of methods for determining forest evapotranspiration and its components: Sap-flow, soil water budget, eddy covariance and catchment water balance. Agric. For. Meteorol. 2001, 106, 153–168. [Google Scholar] [CrossRef]
  39. Aubinet, M.; Grelle, A.; Ibrom, A.; Rannik, U.; Moncrieff, J.; Foken, T.; Kowalski, A.S.; Martin, P.H.; Berbigier, P.; Bernhofer, C.; et al. Estimates of the annual net carbon and water exchange of forests: The EUROFLUX methodology. Adv. Ecol. Res. 2000, 30, 113–175. [Google Scholar] [CrossRef]
  40. Wilson, K.B.; Allen, G.; Falge, E.; Aubinet, M.; Baldocchi, D.; Berbigier, P.; Bernhofer, C.; Ceulemans, R.; Dolman, H.; Field, C.; et al. Energy balance closure at FLUXNET sites. Agric. For. Meteorol. 2002, 113, 223–243. [Google Scholar] [CrossRef] [Green Version]
  41. Kanda, M.; Inagaki, A.; Letzel, M.O.; Raasch, S.; Watanabe, T. LES study of the energy imbalance problem with eddy covariance fluxes. Bound.-Lay. Meteorol. 2004, 110, 381–404. [Google Scholar] [CrossRef]
  42. Sánchez, J.M.; Caselles, V.; Rubio, E.M. Analysis of the energy balance closure over a FLUXNET boreal forest in Finland. Hydrol. Earth Syst. Sci. 2010, 14, 1487–1497. [Google Scholar] [CrossRef] [Green Version]
  43. Barr, A.G.; Van der Kamp, G.; Black, T.A.; McCaughey, J.H.; Nesic, Z. Energy balance closure at the BERMS flux towers in relation to the water balance of the White Gull Creek watershed 1999–2009. Agric. For. Meteorol. 2012, 153, 3–13. [Google Scholar] [CrossRef]
  44. Foken, T.; Leuning, R.; Oncley, S.R.; Mauder, M.; Aubinet, M. Corrections and data quality control. In Eddy Covariance: A Practical Guide to Measurement and Data Analysis; Aubinet, M., Vesala, T., Papale, D., Eds.; Springer: Dordrecht, The Netherlands, 2012; pp. 85–131. ISBN 978-94-007-2350-4. [Google Scholar]
  45. Kuplich, T.M.; Moreira, A.; Fontana, D.C. Série temporal de índice de vegetação sobre diferentes tipologias vegetais no Rio Grande do Sul. Rev. Bras. Eng. Agríc. Ambient. 2013, 17, 1116–1123. [Google Scholar] [CrossRef] [Green Version]
  46. Seneviratne, S.I.; Corti, T.; Davin, E.L.; Hirschi, M.; Jaeger, E.B.; Lehner, I.; Orlowsky, B.; Teuling, A.J. Investigating soil moisture–climate interactions in a changing climate: A review. Earth Sci. Rev. 2010, 99, 125–161. [Google Scholar] [CrossRef]
  47. Shuttleworth, W.J. Evaporation. In Handbook of Hydrology; Maidment, D.R., Ed.; McGraw-Hill Inc.: New York, NY, USA, 1993; pp. 4.1–4.53. [Google Scholar]
  48. Bagley, J.E.; Kueppers, L.M.; Billesbach, D.P.; Williams, I.N.; Biraud, S.C.; Torn, M.S. The influence of land cover on surface energy partitioning and evaporative fraction regimes in the U.S. Southern Great Plains. J. Geophys. Res. Atmos. 2017, 122, 5793–5807. [Google Scholar] [CrossRef]
  49. Gokmen, M.; Vekerdy, Z.; Verhoef, A.; Verhoef, W.; Batelaan, O.; van der Tol, C. Integration of soil moisture in SEBS for improving evapotranspiration estimation under water stress conditions. Remote Sens. 2012, 121, 261–274. [Google Scholar] [CrossRef]
  50. Teuling, A.J.; Seneviratne, S.I.; Williams, C.; Troch, P.A. Observed timescales of evapotranspiration response to soil moisture. Geophys. Res. Lett. 2006, 33, L23403. [Google Scholar] [CrossRef]
  51. Mortarini, L.; Stefanello, M.; Degrazia, G.; Roberti, D.; Castelli, S.T.; Anfossi, D. Characterization of wind meandering in low-wind-speed conditions. Bound.-Lay. Meteorol. 2016, 161, 165–182. [Google Scholar] [CrossRef]
  52. Arbage, M.C.A.; Degrazia, G.A.; Welter, G.S.; Roberti, D.R.; Acevedo, O.C.; Moraes, O.L.L.; Ferraz, S.T.; Timm, A.U.; Moreira, V.S. Turbulent statistical characteristics associated to the north wind phenomenon in Southern Brazil with application to turbulent diffusion. Phys. A Stat. Mech. Appl. 2008, 387, 4376–4386. [Google Scholar] [CrossRef]
  53. Paoloni, J.D.; Sequeira, M.E.; Fiorentino, C.E.; Amiotti, N.M.; Vazquez, R.J. Waterresources in the semi-arid Pampa–Patagonia transitional region of Argentina. J. Arid Environ. 2003, 53, 257–270. [Google Scholar] [CrossRef]
  54. Goulart, M.A.; Sanches, L.; Vilani, M.T.; Pinto Júnior, O.B. Análise da evapotranspiração por wavelet de Morlet em área de Vochysia divergens Pohl no Pantanal. Rev. Bras. Eng. Agríc. Ambient. 2015, 19, 93–98. [Google Scholar] [CrossRef] [Green Version]
  55. Shuttleworth, W.J. Evaporation from Amazonian rain forest. Proc. R. Soc. 1988, 233, 321–346. [Google Scholar] [CrossRef]
  56. Almeida, A.C.; Soares, J.V. Comparação entre uso de água em plantações de eucalyptus grandis e floresta ombrófila densa (mata atlântica) na costa leste do Brasil. Rev. Árvore 2003, 27, 159–170. [Google Scholar] [CrossRef]
  57. Zuecco, G.; Penna, D.; Borga, M.; van Meerveld, H.J. A versatile index to characterize hysteresis between hydrological variables at the runoff event timescale. Hydrol. Process. 2016, 30, 1449–1466. [Google Scholar] [CrossRef]
  58. Zheng, H.; Wang, Q.; Zhu, X.; Li, Y.; Yu, G. Hysteresis responses of evapotranspiration to meteorological factors at a diel timescale: Patterns and causes. PLoS ONE 2014, 9, e98857. [Google Scholar] [CrossRef]
  59. Ahrends, H.E.; Lind, H.R.; Schween, J.H.; Crewell, S.; Stadler, A.; Rascher, U. Diurnal Dynamics of Wheat Evapotranspiration Derived from Ground-Based Thermal Imagery. Remote Sens. 2014, 6, 9775–9801. [Google Scholar] [CrossRef] [Green Version]
  60. Takagi, K.; Tsuboya, T.; Takahashi, H. Diurnal hysteresis of stomatal and bulk surface conductances in relation to vapor pressure deficit in a cool temperate wetland. Agric. For. Meteorol. 1998, 91, 177–191. [Google Scholar] [CrossRef]
  61. Bai, Y.; Zhu, G.; Su, Y.; Zhang, K.; Han, T.; Ma, J.; Wang, W.; Ma, T.; Feng, L. Hysteresis loops between canopy conductance of grapevines and meteorological variables in an oasis ecosystem. Agric. For. Meteorol. 2015, 214–215, 319–327. [Google Scholar] [CrossRef]
Figure 1. Location of study areas in the Pampa biome—Santa Maria (SMA) and Pedras Altas (PAS)—with the respective wind rose for the study period.
Water 10 01864 g001
Figure 2. Daily values of meteorological variables: (a) Global Radiation—Rg (W m−2), (b) Air Temperature—Temp (°C), (c) Relative Humidity—RH (%), and (d) Vapor Pressure Deficit—VPD (kPa). The hatched areas indicate the autumn–winter (AW) periods.
Water 10 01864 g002
Figure 3. Daily accumulated precipitation, Prec (mm d−1), and volumetric soil moisture at 0.1-m depth, θ (m3 m−3), for (a) SMA and (b) PAS. The bar plot represents accumulated daily precipitation and the lines represents θ. The hatched areas indicate the AW periods. Observations were not performed from September 2014 to January 2015 at SMA.
Water 10 01864 g003
Figure 4. Scatterplots of the half-hour energy balance closure: the available energy (Rn − G) vs. turbulent heat fluxes (H + LE) at (a) SMA and (b) PAS. The solid blue line represents the linear fit of the data. For reference, the 1:1 line is also shown (dashed black line).
Water 10 01864 g004
Figure 5. Six-day average of the evaporative fraction (EF = LE/Rn) and heat fraction (HF = H/Rn) for (a) SMA and (b) PAS from September 2014 to September 2016. The hatched areas refer to the AW periods.
Water 10 01864 g005
Figure 6. Evaporative fraction, EF, vs. soil water content, θ (m3 m−3), for (a) SMA and (b) PAS. Gray rectangles indicate the position of values of θCRIT (critical soil water content), θFC (experimentally measured field capacity), and θWP (permanent wilting point).
Water 10 01864 g006
Figure 7. Seasonal variability of actual daily evapotranspiration (ETact) at SMA and PAS sites from September 2014 to September 2016. The hatched areas refer to the AW periods.
Water 10 01864 g007
Figure 8. Scatterplots of daily ETact and ETo for (a) SMA and (b) PAS. The black dots are for the AW period and the gray dots are for the SS period. The solid blue line represents the linear fit of all data. For reference, the 1:1 line is also shown (dashed black line).
Water 10 01864 g008
Figure 9. Hysteretic loops relating actual ETact and VPD (top panels) and air temperature (bottom panels) for SMA (left panels) and PAS (right panels) for different years. The arrows indicate the direction of the hysteresis effect—morning with a solid arrow and afternoon with a dashed arrow. Gray rectangles indicate the timing (hour) when maximum ET occurs. White rectangles indicate the inversion timing (hour) of the ET signal.
Water 10 01864 g009
Table 1. Physical properties of the soil at the experimental sites in the SMA and PAS sites in southern Brazil.
Depth *
(cm)
Sand
(%)
Clay
(%)
Silt
(%)
Field Capacity θFC
(m3 m−3)
Permanent Wilting Point θWP
(m3 m−3)
Macroporosity
(m3 m−3)
Microporosity
(m3 m−3)
Santa Maria
0547.1216.9035.970.340.120.100.36
1042.8520.0937.050.310.110.120.33
2540.0322.6137.360.240.120.130.35
4534.3632.7032.940.350.130.130.37
7526.4743.7129.820.410.210.120.42
10028.8140.0631.130.410.160.080.42
11017.4534.2848.270.400.260.050.40
12517.7427.9554.310.370.250.080.41
14514.9430.6554.410.420.170.050.43
Pedras Altas
0559.300.8139.890.310.030.120.32
1558.110.9040.980.260.030.130.28
3056.331.0142.660.230.040.160.24
5054.351.1844.450.230.050.160.24
* Soil depths refer to the horizons not affected by saturation water.
Table 2. Annual mean of evaporative fraction (EF) of various Brazilian biomes.
BiomeEF = LE/RnReference
Pampa0.66This study, PAS site
Pampa0.64This study, SMA site
Amazon rainforest0.86Da Rocha et al. [13]
Pantanal0.80Sanches et al. [15]
Cerrado0.68Cabral et al. [17]
Cerrado Denso (CD)0.48Giambelluca et al. [16]
Campo Cerrado (CC)0.40Giambelluca et al. [16]
Table 3. Daily mean of actual evapotranspiration, ETact (mm d−1), and reference evapotranspiration, ETo (mm d−1), for the Pampa biome sites of Santa Maria and Pedras Altas relative to various periods.
PeriodSiteETact (mm d−1)ETo (mm d−1)
Autumn and Winter, AWSanta Maria1.581.93
Pedras Altas1.421.73
Spring and Summer, SSSanta Maria3.153.83
Pedras Altas3.683.74
Annual2014/2015Santa Maria2.562.89
Pedras Altas2.602.72
2015/2016Santa Maria2.162.79
Pedras Altas2.492.82
Two-year periodSanta Maria2.362.84
Pedras Altas2.562.76
Table 4. Normalized area of hysteresis between ETact and VPD and air temperature for SMA and PAS for different years. The average is represented by mean ± standard deviation.
Site2014/20152015/2016
ETact–VPDSMA0.07640.0833
PAS0.08760.0842
Average0.0829 ± 0.0047
ETact–TemperatureSMA0.02200.0229
PAS0.02280.0197
Average0.0218 ± 0.0015

