Review

Why We Should Include Soil Structural Dynamics of Agricultural Soils in Hydrological Models

1
Institute for Integrated Management of Material Fluxes and of Resources (UNU-FLORES), United Nations University, Ammonstraße 74, 01067 Dresden, Germany
2
Institute of Soil Science and Site Ecology, Technische Universität Dresden, Pienner Straße 19, 01737 Tharandt, Germany
3
Institute of Hydraulics and Rural Water Management, University of Natural Resources and Life Sciences, Muthgasse 18, 1190 Vienna, Austria
*
Authors to whom correspondence should be addressed.
Water 2018, 10(12), 1862; https://doi.org/10.3390/w10121862
Submission received: 22 November 2018 / Revised: 11 December 2018 / Accepted: 13 December 2018 / Published: 15 December 2018
(This article belongs to the Special Issue Soil Hydrology in Agriculture)

Abstract

:
Surface soil structure is sensitive to natural and anthropogenic impacts that alter soil hydraulic properties (SHP). These alterations have distinct consequences on the water cycle. In this review, we summarized published findings on the quantitative effects of different agricultural management practices on SHP and the subsequent response of the water balance components. Generally, immediately after tillage, soils show a high abundance of large pores, which are temporally unstable and collapse due to environmental factors like rainfall. Nevertheless, most hydrological modeling studies consider SHP as temporally constant when predicting the flow of water and solutes in the atmosphere-plant-soil system. There have been some developments in mathematical approaches to capture the temporal dynamics of soil pore space. We applied one such pore evolution model to two datasets to evaluate its suitability to predict soil pore space dynamics after disturbance. Lack of knowledge on how dispersion of pore size distribution behaves after tillage may have led to over-estimation of some values predicted by the model. Nevertheless, we found that the model predicted the evolution of soil pore space reasonably well (r2 > 0.80 in most cases). The limiting factor to efficiently calibrate and apply such modeling tools is not in the theoretical part but rather the lack of adequate soil structural and hydrologic data.

1. Introduction

The need for sustainable intensification of agriculture to feed our growing population against the backdrop of climate change has led to worldwide attention on agricultural management practices (AMP) that are adaptive towards these challenges. AMP can denote multiple measures such as tillage, fertilization, plantation, fallows, etc. Such practices are often not separate but are part of the broad spectrum of sustainable land-management practices [1]. Although AMP are applied as instantaneous interventions, their effects on soil structure are active over various time scales (Figure 1, [2]). On long-term scales (years to decades), land-use changes such as deforestation or conversion from pasture to cropland result in long-term adaptation of soil structure [3,4,5,6]. On the other hand, tillage is the most analyzed AMP and, along with crop management (e.g., cover crops, crop rotation), affects the soil structure on a seasonal scale [6,7,8]. As a consequence, how much water infiltrates, evaporates, or leaks depends not only on the climate and vegetation but also on the geometry of the soil pore space, pore size distribution (PoSD), and soil structure.
While the textural or intra-aggregate pores in agricultural soils are not expected to vary over time, the structural or inter-aggregate pores, which drain at saturated and near-saturated conditions, are most affected by AMPs and natural stresses like rainfall, freeze-thaw (FT) and wetting-drying (WD) cycles [9,10]. The retention and transport of water and nutrients in the soil which are governed by soil hydraulic properties (SHP) are also affected as a result. Nevertheless, the temporal variations of soil pore space and SHP are often not addressed in hydrological modeling studies. In fact, an invariant pore system is assumed when modeling the transport of water and solutes in the atmosphere-plant-soil system [11]. Ignoring the alterations in soil pore space and SHP may lead to incorrect predictions of water and solute fluxes and therefore to invalid statements, misrepresentations and finally to poor decision making, for instance by policymakers and land-use planners.
In recent years, there have been advancements in using mathematical models to evaluate the impacts of AMP, climate and land cover on water balance components and erosion risks [12,13] as well as the temporal evolution of soil PoSD [14]. The few studies that have included these dynamics in mechanistic hydrological models have shown that it results in better and more reliable modeling outcomes [6,8,15,16,17,18]. Therefore, efforts have been made in the direction of investigating and modeling the temporal evolution of soil PoSD. In this context, Or et al. [19] proposed to use the Fokker–Planck equation (FPE) to capture the changes in soil pore space geometry following tillage with time and pore radius. Nonetheless, Vereecken et al. [20] identified that ‘approaches to simulating temporal changes of soil structure … are relatively rare and at an early stage of development’. Quantifying the temporal dynamics of soil structure is essential to gain a holistic perspective on the physical support services of soil and to understand the response of crop systems to changing soil water contents.
As a basis to understand the changes in soil hydrology due to AMP or climate change, a better understanding of dynamics in soil pore space is required [19,21,22,23]. This knowledge may help us develop tools for sustainable food production and integrated use of natural resources [6,16,24,25]. Based on these assertions, the objective of this paper is to review the temporal dynamics of SHP due to AMP and environmental impacts and the response of soil water simulations to the incorporation of time variant SHP. We then applied the model of Or et al. [19] to two water retention data sets to evaluate its suitability to predict the evolution of soil PoSD following tillage as well as when there is a change in tillage regime. Through this review article, we intend to contribute to the development of tools to model temporal changes in soil structure and incorporate them in hydrological models.

2. Impacts of Anthropogenic and Environmental Influences on SHP

2.1. Overview of SHP

Generally, SHP refer to the soil water retention function (θ(h)) and the hydraulic conductivity function (K(h)) [26,27]. θ(h) is the relationship between volumetric water content (θ) and soil water head (h) and is theoretically based on the soil PoSD via the law of capillarity. θ(h) reflects the ability of the soil to hold and retain water whereas K(h) governs the movement of water and nutrients in the soil. SHP influence the plant available water capacity (PAWC), plant rooting depth and pattern as well as the dynamics of hydrological-biogeochemical processes. Both θ(h) and K(h) are influenced by soil structure, texture, organic matter, chemical and biological properties. Accurate modeling of flow and transport processes in the soil requires good understanding of pore space and SHP dynamics and their hydrological impacts.
SHP are defined by parameters that are obtained from direct measurements of θ(h) and K(h) or through indirect methods. Direct measurements of SHP enable capturing site-specific information of soil structure with high spatial and temporal resolutions. Here, water retention is generally measured in the laboratory using undisturbed soil samples from pressure heads close to saturation till h = −1000 cm which is a methodologically based limit. After that, usually, the next few measurement points are below this value till h = −15,200 cm (wilting point) using disturbed samples. Retention data are interpolated and the goodness of SHP parameterization is a function of the number of available measurement points and the required fitting of points coming from different techniques of measurements. With respect to the conductivity measurements, unsaturated hydraulic conductivity (Ku) is generally measured in the field using disk or tension infiltrometers (e.g., [6,8]) while in the lab, evaporation method is employed (e.g., [10]). Saturated hydraulic conductivity (Ks) is often determined in the field using single or double ring infiltrometers or using hood infiltrometer [28]. Recently, Weninger et al. [29] evaluated the combination of different measurement methods to parameterize SHP to predict soil water dynamics. The authors concluded that a combination of field and lab measurements (e.g., hood infiltrometer in combination with the evaporation method) may provide a basis for representative predictions of soil water dynamics.
There are also developments in visual soil evaluation methods that help to assess the structural state of a soil (for review and future directions in this technique, see [30,31]). Proceeding, indirect methods estimate SHP from readily and easily available data that are more convenient and less expensive. For instance, pedotransfer functions (PTF) are empirical relationships between models of soil parameters and easily available proxy variables on soil properties. Though they have become an indispensable tool for modeling soil processes, their ability to capture spatio-temporal dynamics of soil properties have been under debate [32].
The estimated parameters, either through direct or indirect methods, are then used as inputs which define SHP in numerical modeling techniques. Model functions for θ(h) and K(h) have been subject to extensive research and have resulted in a large number of combined water-retention-hydraulic-conductivity models (for a recent example, see [33]) for a performance evaluation of the most used θ(h) models, see [34]). A widely used example is based on the assumption of a lognormal PoSD (f(r)) [35]:
f ( r ) =   ϕ 0 r σ 2 π e [ ln ( r r m ) ] 2 2 σ 2   where 0 f 0 ( r ) d r =   ϕ 0 ,   0 < r <  
where ϕ0 [-] is the total initial porosity, rm [L] is the initial median pore radius or geometric mean and σ [-] is the standard deviation of the log-transformed pore radius. Integrating Equation (1) yields an expression for θ(h) which may be combined with corresponding models to derive an expression for the relative hydraulic conductivity. For example, description of hydrophysical properties of the soil using θ(h) and K(h) by van Genuchten–Mualem method [33,36,37] is frequently used. θ(h) obtained from Equation (1) shows great flexibility in representing θ in the wet and dry ranges for all soil types.

2.2. Dynamics of SHP

For agricultural soils, tillage is the most widely used management practice that has the greatest effect on soil structure [7,38]. Tillage is defined as mechanical manipulation of soil for crop production and it alters the soil moisture regime as well as infiltration and evapotranspiration processes [39]. Based on the depth and intensity of soil disturbance, tillage systems can be classified into conventional tillage (CT), reduced tillage (RT), and no tillage (NT). Generally, CT represents the most intensive tillage treatment and includes manual or mechanized plowing using chisels, moldboards, and disk cultivators to a depth of about 30 cm [7]. Under RT, at least 30% of the crop residues are left in the field and it involves treatments such as mulch, ridge and contour tillage [39,40]. NT involves little or no soil disturbance and physical impact is usually limited to seedbed preparation. In addition, cover crops and crop rotation practices are undertaken to maintain or enhance soil fertility and improve soil quality. They improve environmental benefits (i.e., in soil and water conservation) and provide ecosystem services that address food security and overall agricultural sustainability [41]. The effects of AMPs on SHP have been quantified by several studies [7,42,43,44,45]. Strudley et al. [7] presented a state of the science review on the tillage effects on SHP in space and time. The authors found that most tillage practices have considerable effects on SHP immediately after tillage which then diminish with time. However, it was seen that the effects of tillage (e.g., comparison of CT vs. NT) did not produce consistent results which was attributed to factors such as soil type, climate, location as well as the challenge to separate the effects of temporal and spatial variations. Table 1 lists selected studies on the impact of AMPs on SHP published after 2008 from which some studies are discussed in detail below.

2.2.1. Effects of Tillage

Kargas et al. [54] investigated the temporal dynamics of θ(h) and Ks for sites under annual rototillage (RoT) and NT on surface soil kept bare using glyphosate as well as NT under weed cover in Attica, Greece. Undisturbed soil samples were taken in the months following tillage and water retention curves were determined in the laboratory using a sand-kaolin box in the pressure head range h = 0 to −200 cm (h = 0, −40, −80, −120, −160, −200 cm). The authors observed reduced Ks values and decreasing θ(h) under RoT in relation to NT due to destruction of the pore sequences and their continuity that existed before application of tillage. Additionally, raindrop impact rapidly disintegrated soil aggregates into single particles and reduced soil pore space which has also been observed by [2,8,42]. This caused a further reduction in the Ks values for all treatments. However, Ks recovered for all treatments during spring and summer which is advocated to changes in the soil pore space conditions created by the intensity and frequency of WD cycles [2]. Aggregate disintegration due to rainfall may occur through slaking and/or mechanical breakdown related to the kinetic energy of a specific event [59].
Schwen et al. [8] investigated the temporal variability of SHP under CT, RT and NT on SHP for two years in a wheat field. The infiltration measurements were performed using a disc infiltrometer for h values of −10, −4, −1 and 0 cm. Both Ks and saturated water content (θs) strongly decreased after tillage in both CT and RT due to raindrop-induced pore sealing and settling. Furthermore, the near-saturated hydraulic conductivity varied in the order of CT > RT > NT and a lower volume of hydraulically active pores were observed in winter due to FT cycles and raindrop impact. FT cycles lead to expansion of water volumes as it freezes in the soil and exerts considerable pressure on the soil pore walls leading to reduced Ks and infiltration rates. Furthermore, Xu and Mermond [15] studied the effects of CT, NT and sub-soiling tillage (conducted using a sub-soiler till 40 cm depth to structurally disrupt compacted subsurface layer and rototilled till a depth of 15 cm to break down large clods). In wet years, subsoiling promoted infiltration when compared to NT and CT and reduced the risk of water logging in the fields. Meurer et al. [60] reviewed the effects of CT, intermediate tillage (chisel, disk, harrow, mulch plough) and NT on soil organic carbon. The authors found significant differences in bulk density (ρb) between the three tillage treatments. For soil organic carbon, they found that intermediate tillage and NT contributed to higher organic carbon content in the top 30 cm of the soil when compared to CT. Organic matter content has implications for soil macropore characteristics, water transmission and K(h) and may impact soil structural resilience towards rainfall, WD and FT cycles [61,62].

2.2.2. Effects of Cover Crops

The effects of cover crops on SHP were studied by Blanco-Canqui et al. [41]. Cover crops promoted aggregate stability by means of roots generating organic binding agents. In the long-term and in combination with NT, cover crops promoted Ks by increasing macroporosity and pore connectivity and increased water infiltration and storage. A review of Ball et al. [63] on the role of crop-rotations indicated that the amount of organic matter incorporated into the soil was more important to preserve soil structure than the farming technique employed. Crop-rotation led to development of macropores due to root growth and faunal activity which influenced the water and nutrient availability in the soil. The study by Bhattacharyya et al. [64] showed that a crop-rotation of soybean–pea in combination with NT resulted in higher unsaturated hydraulic conductivity values at suctions of −2 and −4 kPa. A 3.5% decrease in ρb was observed for cover crop plots when compared to no-cover plots by Haruna and Nkongolo [65]. Furthermore, management decisions such as the number of crops and crop type in a rotation also have significant effects on soil organic matter and biota. For instance, McDaniel et al. [66] found that increasing the number of crops from two to three increases the total carbon by almost 3.6%. Similarly, an increase of 33% in organic carbon was observed by Tiemann et al. [67] when the number of crops were increased from one (monoculture) to five. Organic matter content accelerates the formation of macroaggregates which promotes soil water retention and transmission [68]. Blanco-Canqui and Ruis [69] highlighted the need for accompanying AMPs, such as cover crops, diversified cropping systems and manure, together with NT in order to achieve a beneficial soil physical environment for crop growth.

2.2.3. Effects of Land-Use Change

The evolution of PoSD and SHP after a shift in tillage regime from CT to NT or to pasture and grassland has also been evaluated. For instance, Schwärzel et al. [6] characterized changes in soil structure and SHP due to a crop-pasture rotation cycle in Canterbury, New Zealand in the period from 2008–2009. Undisturbed soil cores were used to determine water retention curves by means of dewatering using ceramic plates connected to a hanging water column (h = −10, −31, −100, −316, −1000, 15,800 cm) and fitted to the Kosugi lognormal distribution model. The authors observed a reduction in mean pore sizes and an increase in the spread of pores (σ in Equation (1)) as well as a loss of large pores. This indicates that macropore rich structure created by tillage is rather unstable and subject to rapid collapse [70]. Hu et al. [71], who investigated the contribution of different pore classes to flow under four different land-uses, found that K(h) showed a significant change only at h = −15 cm for all four land-uses. Furthermore, a study by Yu et al. [52] investigated the effects of different kinds of land-use (cropland and grassland) on soil structure in the Zhongghou catchment in the Loess Plateau region of China in the period 2012–2013. Undisturbed soil cores were used to determine the water retention curves by means of evaporation method and pressure cell (h = −10, −20, −31, −63, −100, −200, −316, −15,000 cm) and fitted to the model of van Genuchten [37]. The authors observed that conversion from CT to grassland or forest tended to promote infiltration capacity, Ks due to creation of meso- and macropores that also increases the soil’s water retention capacity.
Summing up, from the results of the above studies and the outcomes of the studies listed in Table 1, it is observed that immediately after tillage, soils generally show an abundance of large pores. However, these pores are unstable and the PoSD changes with time due to biological activity, rainfall, WD and FT cycles as well as shrink–swell phenomena [10,72]. Raindrop impact on agricultural soils generally leads to aggregate breakdown, compaction, soil crusting and reduced infiltration capacity [56]. As a result, the variance of the PoSD (σ2 in the case of [35]) increases indicating a heterogenization of the pore system. Frequently, a reduction in the transmission pores or macropores (50 < r < 500 µm) and an increase in the storage pores or micro and mesopores (0.5 < r < 50 µm) is observed in the months following tillage or when there is a shift in tillage regime from CT to NT or pasture. Ks decreases in periods of rainfall due to sealing of pores and settlement [73,74] and increases in spring due to biological activity and WD cycles [50,74]. The presence of cover crops and crop rotation cycles lead to development of macropores, pore connectivity and increase of organic carbon which enhances soil water infiltration and storage.

2.3. Inconsistencies in the Outcomes on Dynamics of SHP

From the previous section, it can be concluded that SHP are subject to temporal variations post-tillage through a season or after a shift in the tillage regime. However, studies that have reported alterations in SHP are inconsistent in their outcomes and they vary across experimental designs, locations and soil types [7] (see Table 1). For instance, Blanco-Canqui et al. [44] did not observe any significant impact on Ks and θ after long-term CT while Schwen et al. [16] observed a strong decrease in Ks and θ under CT. These contradictory findings may be explained by differences in land-cover (continuous corn vs. winter-wheat), use of different equipment for CT (chisel plow, tandem disk vs. moldboard plow) and soil composition.
In some cases, NT and RT exhibited an increase in near-zero infiltration rates and hydraulic conductivity which is associated with macropore connectivity while in others water infiltration rates may be greater for soils under CT [7,44]. Most studies have also reported an increase in ρb under NT due to soil densification in the absence of soil turnover by tillage operations [69,75]. The contradictory results may be attributed to temporal variability of soil infiltration rates; Water infiltration is higher immediately following tillage because tillage creates a macropore rich structure after which there is generally a collapse of large pores. This is associated with a decrease in infiltration in the weeks following the event.
Despite progress in methods to quantify SHP, there exist inconsistencies in the results from different management practices on SHP. These inconsistencies may be due to the use of different methods for the characterization of SHP. Different measurement techniques may result in different initial and boundary conditions being applied so that the behavior of SHP may actually depend on the technique used rather than on the intrinsic nature of soils [76]. Some authors used laboratory methods for the characterization of K(h) (e.g., multi-step outflow method) while others used field methods (e.g., tension infiltrometer). Field techniques are often inconclusive owing to the variability of soil structure, especially in the upper layers of the soil. Moreover, some field methods (such as disc or hood infiltrometer) are able to account for the contribution of macropores to the infiltration rate and soil hydraulic conductivity at saturation [28] whereas other methods (such as double ring infiltrometer) cannot differentiate the contribution of macro-, meso- and micropores to the water flow. Laboratory measurements are generally seen as more precise and straightforward than those in the field [76,77] because they can be conducted in a controlled environment whereas field measurements are subject to variations and conditions of the field. In this context, Basile et al. [78] reported that by using water content measured at zero head and air entry value, both measured in the field, it was possible to derive field hydraulic functions from laboratory functions with adequate approximation. However, reliable measurements of near-saturated hydraulic conductivity in the laboratory depend on the soil core size where the soil sample has to be large enough to represent the soil horizon at the pedon scale [76]. The relationship between the sample volume and variability in SHP measurement is an example of the concept of representative elementary volume (REV). If a REV does not have approximately 20 elementary units of soil structure, issues such as non-detection of large-range spatial structures of SHP and observation of inaccurate values of SHP may emerge [79].
Different stages of root growth also affect the outcome of SHP measurements. Murphy et al. [80] found a decrease in Ks in wheat from sowing to tillering phases of plant growth. However, almost 17% of the roots produced from emergence decayed when the plants reached the phase of stem elongation while 37% of the roots decayed by the ripening stage which led to an increase in Ks. Bodner et al. [81] studied the root effects on macroscopic pore parameters and found that rooting densities greater than 0.5% of pore space stabilized soil structure against pore loss. The authors also observed that coarse root systems increased macroporosity by 30%. Ajayi et al. [82] observed strong contribution of root development to improved pore networks and pore continuity for conversion of CT to grassland over a 19-year period. It is often difficult, however, to separate land-use induced changes from changes caused by other factors such as climate.
Strudley et al. [7] highlighted that many studies usually investigate contrasted “snapshots” of different treatments; i.e., an instantaneous capture of soil conditions immediately after AMPs without considering the evolution of the soil pore space at later stages. Furthermore, most studies dealing with the impact of management practices focus only on the uppermost layers of the soil profile [9,19,83]. This may be appropriate for soil dynamics on a rather short temporal scale such as changes induced by weather or tillage. However, mid- and long-term changes of management practices and long-term climate change effects have a significant influence in deeper soil layers [5,11,84].
The described inconsistencies hamper the generalization of results on the impacts of AMP on SHP. Often, experimental protocols (e.g., experiment designs, measurement times, sample sizes, etc.) are not rigorous enough to reveal the differences between different AMP [85]. Particularly at high and low values of h, there is a lack of reliable data owing to the difficulty in measurement in these ranges. For a better generalization of results from different measurements, there is a need for accurate and harmonized description of methods used to quantify alterations in SHP. Science-based quantitative data and standardization of research methodologies are critical towards improving our interpretation of results from different experiments on management practices. Derpsch et al. [85] suggest certain steps towards standardizing research protocols, particularly when designing NT experiments. An effort to standardize most aspects of NT including weed cover, soil moisture at seeding, equipment details and crop-rotation sequences among other factors is made. Besides, it is important that all AMP are described in a detailed manner and be inclusive of relevant antecedent conditions as well as all actions taken from beginning till the end of the experiment.

3. Time Variable SHP in Soil Water Simulations

The alterations in SHP have distinct effects on evapotranspiration, groundwater recharge, water storage capacity, surface runoff and groundwater flow in a watershed [86]. The sensitivity of soils and the response of the water cycle to soil structure alterations are site-specific and driven by environmental interactions, i.e., between climate, topography and geological substrate that control soil formation [40] and intensity and direction of water fluxes. This section addresses the response of using temporally variant SHP in hydrological and land-use models.
Simulations that consider time variant SHP in hydrological modeling studies are challenging and require an adequate set of soil hydraulic parameters. Though limited in number, the studies that have considered these variations show promising results to improve the accuracy of our numerical simulations for soil water balance. Xu and Mermoud [15] used a simulation model with time-dependent hydraulic conductivity parameters to predict the effect of CT, RT and subsoiling tillage on the components of the soil water balance during the summer maize growing season. They found that using temporally variant hydraulic conductivity values improved the model’s predictive capability in estimating percolation (losses of more than 6% in wet years by subsoiling), water storage (13–14% lesser storage under subsoiling), transpiration and evaporation (lower actual evaporation in subsoiled plots).
Schwen et al. [8] studied the impacts of CT, RT and NT on SHP (derived from inverse simulation of frequent tension infiltrometer measurements) for two seasons and implemented the changes interpolated to a daily base in water balance simulations. The application of time-variable SHP significantly improved the agreement of near-surface θ and water storage in the profile to a depth of 30 cm for all tillage treatments in both seasons. The root mean square error (RMSE) values for storage was reduced by 93% while the average relative error was halved for both θ and water storage. Similarly, Alletto et al. [17] quantified the temporal dynamics of SHP in a conventional maize monoculture and included the results of the modified SHP due to CT in modeling the water dynamics of the area. The efficiency of the whole simulation period increased by 40% when using varying θ(h) and the results had a low RMSE value when compared to the simulation with constant soil parameters. The results of this study indicate that the assumption of time-invariable, i.e., constant SHP leads to a poor description of water dynamics and to an over- or under-estimation of water drainage.
An effort to include the modified SHP for rainfall-runoff simulations was undertaken by Wahren et al. [5]. The authors studied the effects of afforestation on runoff and soil water storage in foothill catchments in NE Germany for arable land, 6- and 50-year old afforestation sites and ancient natural forest. It was seen that changes in SHP were already detectable in the 6-year site. Two cases were compared in the rainfall-runoff simulations: one with constant SHP and the other with altered SHP after land-use change. It was seen that inclusion of altered SHP in modeling led to an increase in the simulated soil water storage by more than 50% and resulted in a more realistic description of the land-use effects on the soil water balance. The authors recommend considering changes in both vegetation and soil properties in rainfall-runoff models.
Finally, Bormann et al. [87] did a comparison of three hydrological models (SWAT, TOPLATS, WASIM) to assess the importance of considering changes in soil properties as part of land-use scenario calculation. PTF were used to obtain the parameters of the hydrological model. The water balance was simulated based on land-use scenarios using both changed and unchanged SHP. All three models were considerably sensitive to the changes in soil properties. It was also observed that if the effects of land-use and of an additional change in SHP are set into relation, both the changes demonstrate effects in the same order of magnitude.
Despite evidence that soil structure is subject to temporal variations and inclusion of these dynamics lead to better modeling results, SHP are set constant over time in most simulation studies. Most hydrological models that predict water fluxes under changing environmental conditions do not consider that alterations in land-use will also induce changes such as SHP [87]. Such studies usually assume only a change in the vegetation cover and overlook the dynamics of the soil structure in the process. However, there are some steps that have been taken in the direction of capturing the complex dynamics of tilled soils which are discussed in the following section.

4. Modeling Techniques to Capture Evolution of PoSD Post-Tillage

In general, few mathematical expressions were found to be appropriate for a continuous expression of the temporal dynamics of PoSD following management activities. The approach presented by Xu and Mermoud [15] used an empirical time-dependent decay function for Ks for soil water simulations. The described temporal variations of Ks were introduced in the van Genuchten-Mualem equation [36,37] to obtain time-dependent hydraulic conductivity values of partly saturated soils. As a result, the capability of the model for predicting the effects of different tillage components on soil water balance improved, particularly for subsoiling tillage.
A stochastic approach to simulate rainfall-driven soil water dynamics in the unsaturated zone using a non-linear, space domain random walk of water particles was proposed by Zehe and Jackisch [88]. Soil water particles are constant in mass and volume and their movement can be expressed by a divergent form of the Richards equation, an equivalent of the Fokker–Planck equation (FPE). Ultimately, the model accounted for the varying mobility of soil particles in different soil pore sizes. The approach was a feasible alternative to the Richards equation for simulated wetting and drying phases while also accounting for preferential and non-equilibrium flow. However, the model by Zehe and Jackisch [88] did not accurately represent long-term drainage phases in fast draining soils.
Post-tillage changes in soil PoSD tend to evolve in rather predictable pathways such as (1) loss of large pores or reduction in the mean pore size, (2) reduction in overall porosity, and (3) change in the spread of pore radii [19]. In this context, Or et al. [19] proposed to use the FPE to capture the changes in PoSD following tillage:
f t = r ( D ( r , t ) f r )   r ( V ( r , t ) f ) M ( t ) f  
where f is the PoSD or frequency [L−1] of pores as a function of time t [T] and pore radius r [L], D the dispersion coefficient [L2T−1], V the drift coefficient [LT-1] and M the degradation coefficient [T−1]. D and V quantify the changes with time of the variance of the PoSD and mean pore radius, respectively, while M is a first-order degradation factor representing instantaneous pore loss, i.e., the fraction of pores that are lost due to instantaneous collapse. An analytical solution for the FPE was obtained by Leij et al. [9,83] when subjecting the FPE to an initial condition such as Equation (1) and a zero-probability flux in the upper and lower boundaries. The coefficients can be determined from moment analyses or from independent models. For more details on the model and its analytical solution, see [9,19,83]. The coefficients of the FPE encompass the physical processes that occur during the evolution of PoSD as a response to external stresses.
We applied this pore space evolution model and its analytical solution to results presented in two studies involving water retention data for different tillage treatments. Comprehensive measurements for the evolution of PoSD with time are limited. From the limited studies available, we selected two studies—one from USA and one from Spain—on the basis that they had data sets for temporal stages following tillage as well as for land-use change. We assessed the suitability of the model to predict the dynamics of soil PoSD due to seasonal changes following tillage as well as for evolution of PoSD when there is a change in tillage regimes. The Kosugi parameters according to Equation (1) and the r2 and RMSE values for the studies are listed in Table 2.

4.1. Model Application: Data Sets

4.1.1. Washington, USA

Fuentes et al. [89] analyzed the temporal dynamics of SHP – both seasonal and under CT and NT—from 2001 to 2002 at sites in Washington, USA. The CT during sampling was under a spring wheat (Triticum aestivum L.) and spring pea (Pisum sativum) rotation while NT was under winter wheat. Primary tillage operations were performed in October 2000 and 2001 and soil samples were taken on 16 May (46 days after tillage) and 30 November in 2001 and on 22 April, 26 June and 18 September in 2002. Water retention curves for h = 0 to −40 cm were measured using the hanging water column method while a pressure plate extractor was used for h = −100 to −1000 cm (h = −1, −2, −4, −8, −10.5, −12.5, −30, −40, −100, −200, −300, −400, −600, −1000 cm) and fitted to the van Genuchten [37] model. We predicted the seasonal evolution of CT following tillage only after the 2001 tillage as there was only one measurement after tillage in 2000. For the change in tillage regime from CT to NT, we used the dataset immediately following tillage for CT and the corresponding measurement for NT in 2001. The predictions were done for two depths 0–3 cm and 3–6 cm.

4.1.2. Zaragoza, Spain

Peña-Sancho et al. [42] studied the dynamics of SHP under CT and NT for a fallow period (in a cereal—fallow rotation) in Zaragoza, Spain from 2011–2012. Tillage took place in March 2012. The different stages of sampling were—pre-tillage (S1), after tillage (S2), after tillage + rain (S3), late fallow (S4) and just before tillage operations (S5). Soil volumetric water content was measured in the laboratory using Time Doman Reflectometry (h = −5, −15, −30, −100, −500, −1000, −5000 and −15,000 cm) and fitted to the van Genuchten [37] model. We used the retention data for CT and NT for 10–20 cm soil depth to predict the seasonal evolution of PoSD from S2 to S5 as well as for the change in tillage regime.

4.2. Results and Model Suitability

For Section 4.1.1, Figure 2a,b show the observed and predicted frequencies for both the seasonal evolution of PoSD following CT and the PoSD evolution from CT to NT respectively for the 0–3 cm depth while Figure 2c,d show the same for 3–6 cm depth. For Section 4.1.2, Figure 2e,f show the observed and predicted frequencies for both the seasonal evolution of PoSD following CT and the PoSD evolution from CT to NT respectively for the 10–20 cm depth. Data points show f(r) values that correspond to measured retention data. In general, the results indicate that the pore evolution model is able to capture to a certain extent the evolution of PoSD for both seasonal variations following tillage and for a change in the tillage regime. The coefficients of the FPE, which were calculated from moment analyses as well as from existing models, capture the physical processes following tillage. The r2 and RMSE values indicate good fits of the observed and predicted values in the pressure head range between 0 to 330 cm (r ≥ 5 µm), where the evolution of larger or inter-aggregate pores mainly take place.
For the study from Fuentes et al. [89], the data from 0–3 cm depth show more temporal variations than for the 3–6 cm depth. This is attributed to the surface layer being more prone to environmental and natural disturbances. The smaller pores (r < 5 µm) become more prevalent through the season. The same is the case when there is a shift in the tillage regime from CT to NT. For the study from Peña-Sancho et al. [42], r2 value are close to 90% in the 10–20 cm depth where the soil is not directly affected by rainfall events. We also investigated the pore evolution model for this study on the surface soil at 0–10 cm (results not displayed) and we found that lower r2 and RMSE values indicating poor conformation of the model to the observed values. This implies that the model may have to be calibrated for high intensity rainfalls on the surface as the coefficients may not be able to capture the rapid collapse of the soil structure in such cases.
A closer look at the results reveals that the model exhibits better fits for the change in tillage regimes when compared to the seasonal evolution of soil PoSD. The change in the mean pore radius denoted by V and the degradation term M have been studied over the years and they adequately capture the evolution of the newly formed larger pores after tillage which are structurally unstable towards a more stable PoSD [19]. However, the dispersion coefficient or the instantaneous variance D poses a challenge. Or et al. [19] suggest that though some experimental evidence indicates that D decreases with a reduction in V, there is virtually no information on the rate of these changes and their dependency on the pore size. From Figure 2, it can be observed that there is an over-estimation of the predicted values in some cases which may come down to how we estimate dispersivity. Perhaps, a new term or a factor that takes into account the time-variable nature of dispersion may improve the modeling outcomes for seasonal evolution of PoSD. Nonetheless, the model in its current state still captures the temporal dynamics of PoSD reasonably well as is seen from the r2 and RMSE values (Table 2).
Ultimately, this approach is promising as it incorporates the changes in soil pore parameters directly into the governing relations of the model. It can be further extended to predict temporal changes in saturated and unsaturated hydraulic conductivities, for instance, by using the Kozeny–Carman relationship [90,91]. Calibration and assessment of the model performance will only be valid if the model is systematically applied to data sets in different locations under different soil types and AMP. However, the lack of sufficient studies so far in this regard will make evaluation of the model challenging.

5. Summary and Outlook

Surface structural pore space continuously changes on spatial and temporal scales due to a wide range of natural and anthropogenic factors. These variations also alter SHP as well as the water budget components. Herein, we reviewed the impacts of AMP and changing atmospheric boundary conditions on PoSD and consequently SHP. Most of the studies indicate that tillage is followed by creation of large pores which collapse rapidly because of rainfall events, FT and WD cycles. Moreover, there is a heterogenization (increase in the variance of the PoSD curve) of soil PoSD for both seasonal evolution of PoSD following tillage as well as when there is a change in tillage regime. The studies, however, are not consistent in their outcomes due to different methods for characterization of SHP (field and laboratory methods), different experimental designs and measurements taken at different stages of plant growth. A need for harmonization of research methodologies for generalization of results of the impacts of different management practices on SHP and the water cycle was identified.
The changes in SHP have consequences for the soil water budget components. There have been very few efforts to include time variant SHP in hydrological models. The limited studies that have incorporated the temporal dynamics have shown that it increases the model’s accuracy and reliability. In this context, we applied a sophisticated modeling approach with an analytical solution [9,19,83] that describes changes in PoSD with time and pore radius to two case studies. The model was able to capture the dynamics of soil PoSD following CT as well as when there was a change from CT to NT well. Parameterizing the model using long-term SHP measurements under different AMP and locations will help to better evaluate the suitability of the model and to calibrate its coefficients as well as improve model performance, especially for the seasonal evolution of PoSD. To our knowledge, the approach by Or et al. [19] has not been applied to a complex time series of measured hydraulic parameters in a systematic manner. The combination of the soil pore space evolution model with predicting changes in the soil hydraulic conductivity function has also not yet been tested against measured data. Future research on these topics may pave the way to include time variant SHP in hydrological modeling studies.
There arise several questions with respect to inclusion of temporal variations of SHP in measurement strategies and hydrological modeling. How often or frequently should we take measurements to account for temporal variations in SHP? How long will it take for the soil structure to reach a quasi-static equilibrium after a land-use change or management practice? How would we separate the changes induced by a combination of agricultural management practices and how can we standardize the measurement process? How complex and feasible will a process-based model be that takes into account the interaction between different environmental and anthropogenic factors to account for temporal variation of SHP? To answer these questions using modeling tools, the limiting factor is not in the theoretical part but rather the lack of adequate soil structural and hydrologic data.

Author Contributions

Conceptualization, K.S. and P.C.; software, P.C.; writing—original draft preparation, P.C.; writing—review and editing, J.K., T.W., S.J., A.S., K.S. and K.H.-F.; supervision, K.S.; project administration, K.S.; funding acquisition, K.S., A.S. and K.H.-F.

Funding

This work was supported by the German Research Foundation (DFG) under SCHW 1448/6-1, FE 504/11-1 and the Austrian Science Fund (FWF) under I-2122 B16.

Acknowledgments

Our gratitude goes to Atiqah Fairuz Salleh for her editorial input towards improving the manuscript. Two anonymous reviewers and the guest editor, Basile helped to improve the manuscript significantly.

Conflicts of Interest

The authors declare no conflict of interest.

References

  1. Dumanski, J.; Peiretti, R. Modern concepts of soil conservation. Int. Soil Water Conserv. Res. 2013, 1, 19–23. [Google Scholar] [CrossRef]
  2. Bodner, G.; Scholl, P.; Loiskandl, W.; Kaul, H.-P. Environmental and management influences on temporal variability of near saturated soil hydraulic properties. Geoderma 2013, 100, 120–129. [Google Scholar] [CrossRef] [PubMed]
  3. Schwaerzel, K.; Bohl, H.P. An easily installable groundwater lysimeter to determine waterbalance components and hydraulic properties of peat soils. Hydrol. Earth Syst. Sci. Discuss. 2003, 7, 23–32. [Google Scholar] [CrossRef] [Green Version]
  4. Bodner, G.; Loiskandl, W.; Buchan, G.; Kaul, H.-P. Natural and management-induced dynamics of hydraulic conductivity along a cover-cropped field slope. Geoderma 2008, 146, 317–325. [Google Scholar] [CrossRef]
  5. Wahren, A.; Feger, K.H.; Schwaerzel, K.; Munch, A. Land use effects on flood generation - considering soil hydraulic measurements in modelling. Adv. Geosci. 2009, 21, 99–107. [Google Scholar] [CrossRef]
  6. Schwärzel, K.; Carrick, S.; Wahren, A.; Feger, K.-H.; Bodner, G.; Buchan, G. Soil Hydraulic Properties of Recently Tilled Soil under Cropping Rotation Compared with Two-Year Pasture. Vadose Zone J. 2011, 10, 354. [Google Scholar] [CrossRef]
  7. Strudley, M.; Green, T.; Ascough, J., II. Tillage effects on soil hydraulic properties in space and time: State of the science. Soil Tillage Res. 2008, 99, 4–48. [Google Scholar] [CrossRef]
  8. Schwen, A.; Bodner, G.; Scholl, P.; Buchan, G.D.; Loiskandl, W. Temporal dynamics of soil hydraulic properties and the water-conducting porosity under different tillage. Soil Tillage Res. 2011, 113, 89–98. [Google Scholar] [CrossRef]
  9. Leij, F.J.; Ghezzehei, T.A.; Or, D. Modeling the dynamics of the soil pore-size distribution. Soil Tillage Res. 2002, 64, 61–78. [Google Scholar] [CrossRef]
  10. Bormann, H.; Klaassen, K. Seasonal and land use dependent variability of soil hydraulic and soil hydrological properties of two Northern German soils. Geoderma 2008, 145, 295–302. [Google Scholar] [CrossRef]
  11. Peth, S.; Nellesen, J.; Fischer, G.; Horn, R. Non-invasive 3D analysis of local soil deformation under mechanical and hydraulic stresses by μCT and digital image correlation. Soil Tillage Res. 2010, 111, 3–18. [Google Scholar] [CrossRef]
  12. Krysanova, V.; Hattermann, F.; Wechsung, F. Development of the ecohydrological model SWIM for regional impact studies and vulnerability assessment. Hydrol. Process. 2005, 19, 763–783. [Google Scholar] [CrossRef]
  13. Hurkmans, R.T.W.L.; Terink, W.; Uijlenhoet, R.; Moors, E.J.; Troch, P.A.; Verburg, P.H. Effects of land use changes on streamflow generation in the Rhine basin: Effects of land use changes on streamflow. Water Resour. Res. 2009, 45. [Google Scholar] [CrossRef]
  14. Sandin, M.; Koestel, J.; Jarvis, N.; Larsbo, M. Post-tillage evolution of structural pore space and saturated and near-saturated hydraulic conductivity in a clay loam soil. Soil Tillage Res. 2017, 165, 161–168. [Google Scholar] [CrossRef]
  15. Xu, D.; Mermoud, A. Modeling the soil water balance based on time-dependent hydraulic conductivity under different tillage practices. Agric. Water Manag. 2003, 63, 139–151. [Google Scholar] [CrossRef]
  16. Schwen, A.; Bodner, G.; Loiskandl, W. Time-variable soil hydraulic properties in near-surface soil water simulations for different tillage methods. Agric. Water Manag. 2011, 99, 42–50. [Google Scholar] [CrossRef]
  17. Alletto, L.; Pot, V.; Giuliano, S.; Costes, M.; Perdrieux, F.; Justes, E. Temporal variation in soil physical properties improves the water dynamics modeling in a conventionally-tilled soil. Geoderma 2015, 243–244, 18–28. [Google Scholar] [CrossRef]
  18. Feki, M.; Ravazzani, G.; Ceppi, A.; Milleo, G.; Mancini, M. Impact of Infiltration Process Modeling on Soil Water Content Simulations for Irrigation Management. Water 2018, 10, 850. [Google Scholar] [CrossRef]
  19. Or, D.; Leij, F.J.; Snyder, V.; Ghezzehei, T.A. Stochastic model for posttillage soil pore space evolution. Water Resour. Res. 2000, 36, 1641–1652. [Google Scholar] [CrossRef] [Green Version]
  20. Vereecken, H.; Schnepf, A.; Hopmans, J.W.; Javaux, M.; Or, D.; Roose, T.; Vanderborght, J.; Young, M.H.; Amelung, W.; Aitkenhead, M.; et al. Modeling Soil Processes: Review, Key Challenges, and New Perspectives. Vadose Zone J. 2016, 15. [Google Scholar] [CrossRef] [Green Version]
  21. Pleshchinskii, N.B.; Khramchenkov, M.G.; Khramchenkov, É.M. Mathematical modeling of the rheology of swelling systems. J. Eng. Phys. Thermophys. 2005, 78, 1142–1148. [Google Scholar] [CrossRef]
  22. Assouline, S.; Or, D. Conceptual and Parametric Representation of Soil Hydraulic Properties: A Review. Vadose Zone J. 2013, 12. [Google Scholar] [CrossRef]
  23. Galiullina, N.E.; Khramchenkov, M.G. Some Characteristic Features Of Unsaturated Swelling Porous Media Deformation. J. Eng. Phys. Thermophys. 2015, 88, 293–298. [Google Scholar] [CrossRef]
  24. Lal, R. Challenges and opportunities in soil organic matter research. Eur. J. Soil Sci. 2009, 60, 158–169. [Google Scholar] [CrossRef]
  25. Martín, M.Á.; Martínez, F.S.J.; Perfect, E.; Lado, M.; Pachepsky, Y. Soil structure and function in a changing world: Characterization and scaling. Geoderma 2017, 287, 1–3. [Google Scholar] [CrossRef]
  26. Dexter, A.R. Advances in characterization of soil structure. Soil Tillage Res. 1988, 11, 199–238. [Google Scholar] [CrossRef]
  27. Van Genuchten, M.Th.; Pachepsky, Y.A. Hydraulic Properties of Unsaturated Soils. In Encyclopedia of Agrophysics; Gliński, J., Horabik, J., Lipiec, J., Eds.; Springer: Dordrecht, The Netherlands, 2011; pp. 368–376. ISBN 978-90-481-3584-4. [Google Scholar]
  28. Schwaerzel, K.; Punzel, J. Hood Infiltrometer—A New Type of Tension Infiltrometer. Soil Sci. Soc. Am. J. 2007, 71, 1438–1447. [Google Scholar] [CrossRef]
  29. Weninger, T.; Bodner, G.; Kreiselmeier, J.; Chandrasekhar, P.; Julich, S.; Feger, K.-H.; Schwärzel, K.; Schwen, A. Combination of Measurement Methods for a Wide-Range Description of Hydraulic Soil Properties. Water 2018, 10, 1021. [Google Scholar] [CrossRef]
  30. Emmet-Booth, J.P.; Forristal, P.D.; Fenton, O.; Ball, B.C.; Holden, N.M. A review of visual soil evaluation techniques for soil structure. Soil Use Manag. 2016, 32, 623–634. [Google Scholar] [CrossRef]
  31. Guimarães, R.M.L.; Lamandé, M.; Munkholm, L.J.; Ball, B.C.; Keller, T. Opportunities and future directions for visual soil evaluation methods in soil structure research. Soil Tillage Res. 2017, 173, 104–113. [Google Scholar] [CrossRef]
  32. Pachepsky, Y.; Rajkai, K.; Tóth, B. Pedotransfer in soil physics: Trends and outlook—A review. Agrokém. És Talajt. 2015, 64, 339–360. [Google Scholar] [CrossRef]
  33. Terleev, V.; Nikonorov, A.; Badenko, V.; Guseva, I.; Volkova, Y.; Skvortsova, O.; Pavlov, S.; Mirschel, W. Modeling of Hydrophysical Properties of the Soil as Capillary-Porous Media and Improvement of Mualem-Van Genuchten Method as a Part of Foundation Arrangement Research. Adv. Civ. Eng. 2016, 2016, 1–7. [Google Scholar] [CrossRef]
  34. Matlan, S.J.; Mukhlisin, M.; Taha, M.R. Performance Evaluation of Four-Parameter Models of the Soil-Water Characteristic Curve. Sci. World J. 2014, 2014, 1–12. [Google Scholar] [CrossRef] [PubMed]
  35. Kosugi, K. Lognormal distribution model for unsaturated soil hydraulic properties. Water Resour. Res. 1996, 32, 2697–2703. [Google Scholar] [CrossRef]
  36. Mualem, Y. A new model for predicting the hydraulic conductivity of unsaturated porous media. Water Resour. Res. 1976, 12, 513–522. [Google Scholar] [CrossRef]
  37. Van Genuchten, M.T. A Closed-form Equation for Predicting the Hydraulic Conductivity of Unsaturated Soils. Soil Sci. Soc. Am. J. 1980, 44, 892–898. [Google Scholar] [CrossRef]
  38. Pare, N.; Andrieux, P.; Louchart, X.; Biarnes, A.; Voltz, M. Predicting the spatio-temporal dynamic of soil surface characteristics after tillage. Soil Tillage Res. 2011, 114, 135–145. [Google Scholar] [CrossRef]
  39. Busari, M.A.; Kukal, S.S.; Kaur, A.; Bhatt, R.; Dulazi, A.A. Conservation tillage impacts on soil, crop and the environment. Int. Soil Water Conserv. Res. 2015, 3, 119–129. [Google Scholar] [CrossRef] [Green Version]
  40. Horel, Á.; Tóth, E.; Gelybó, G.; Kása, I.; Bakacsi, Z.; Farkas, C. Effects of Land Use and Management on Soil Hydraulic Properties. Open Geosci. 2015, 7, 742–754. [Google Scholar] [CrossRef]
  41. Blanco-Canqui, H.; Shaver, T.M.; Lindquist, J.L.; Shapiro, C.A.; Elmore, R.W.; Francis, C.A.; Hergert, G.W. Cover Crops and Ecosystem Services: Insights from Studies in Temperate Soils. Agron. J. 2015, 107, 2449. [Google Scholar] [CrossRef] [Green Version]
  42. Peña-Sancho, C.; López, M.V.; Gracia, R.; Moret-Fernández, D. Effects of tillage on the soil water retention curve during a fallow period of a semiarid dryland. Soil Res. 2017, 55, 114–123. [Google Scholar] [CrossRef] [Green Version]
  43. Pires, L.F.; Borges, J.A.R.; Rosa, J.A.; Cooper, M.; Heck, R.J.; Passoni, S.; Roque, W.L. Soil structure changes induced by tillage systems. Soil Tillage Res. 2017, 165, 66–79. [Google Scholar] [CrossRef]
  44. Blanco-Canqui, H.; Wienhold, B.J.; Jin, V.L.; Schmer, M.R.; Kibet, L.C. Long-term tillage impact on soil hydraulic properties. Soil Tillage Res. 2017, 170, 38–42. [Google Scholar] [CrossRef]
  45. Green, T.R.; Ahuja, L.R.; Benjamin, J.G. Advances and challenges in predicting agricultural management effects on soil hydraulic properties. Geoderma 2003, 116, 3–27. [Google Scholar] [CrossRef]
  46. Kodesová, R.; Jirku, V.; Kodes, V.; Muhlhanselova, M.; Nikodem, A.; Zigova, A. Soil structure and soil hydraulic properties of Haplic Luvisol used as arable land and grassland. Soil Tillage Res. 2011, 111, 154–161. [Google Scholar] [CrossRef]
  47. Sacco, D.; Cremon, C.; Zavattaro, L.; Grignani, C. Seasonal variation of soil physical properties under different water managements in irrigated rice. Soil Tillage Res. 2012, 118, 22–31. [Google Scholar] [CrossRef]
  48. Hu, W.; Shao, M.A.; Si, B.C. Seasonal changes in surface bulk density and saturated hydraulic conductivity of natural landscapes. Eur. J. Soil Sci. 2012, 63, 820–830. [Google Scholar] [CrossRef]
  49. Fouli, Y.; Cade-Menun, B.J.; Cutforth, H.W. Freeze–thaw cycles and soil water content effects on infiltration rate of three Saskatchewan soils. Can. J. Soil Sci. 2013, 93, 485–496. [Google Scholar] [CrossRef]
  50. Bodner, G.; Scholl, P.; Kaul, H.-P. Field quantification of wetting-drying cycles to predict temporal changes of soil pore size distribution. Soil Tillage Res. 2013, 133, 1–9. [Google Scholar] [CrossRef]
  51. Jirků, V.; Kodešová, R.; Nikodem, A.; Mühlhanselová, M.; Žigová, A. Temporal variability of structure and hydraulic properties of topsoil of three soil types. Geoderma 2013, 204–205, 43–58. [Google Scholar] [CrossRef]
  52. Yu, M.; Zhang, L.; Xu, X.; Feger, K.-H.; Wang, Y.; Liu, W.; Schwärzel, K. Impact of land-use changes on soil hydraulic properties of Calcaric Regosols on the Loess Plateau, NW China. J. Plant Nutr. Soil Sci. 2015, 178, 486–498. [Google Scholar] [CrossRef]
  53. Oliveira, S.P.; Cândido, M.J.D.; Weber, O.B.; Xavier, F.A.S.; Ortiz Escobar, M.E.; Oliveira, T.S. Conversion of forest into irrigated pasture II. Changes in the physical properties of the soil. CATENA 2016, 143, 70–77. [Google Scholar] [CrossRef]
  54. Kargas, G.; Kerkides, P.; Sotirakoglou, K.; Poulovassilis, A. Temporal variability of surface soil hydraulic properties under various tillage systems. Soil Tillage Res. 2016, 158, 22–31. [Google Scholar] [CrossRef]
  55. Dörner, J.; Dec, D.; Thiers, O.; Paulino, L.; Zúñiga, F.; Valle, S.; Martínez, O.; Horn, R. Spatial and temporal variability of physical properties of Aquands under different land uses in southern Chile. Soil Use Manag. 2016, 32, 411–421. [Google Scholar] [CrossRef]
  56. Vaezi, A.R.; Ahmadi, M.; Cerdà, A. Contribution of raindrop impact to the change of soil physical properties and water erosion under semi-arid rainfalls. Sci. Total Environ. 2017, 583, 382–392. [Google Scholar] [CrossRef] [PubMed]
  57. Kuhwald, M.; Blaschek, M.; Brunotte, J.; Duttmann, R. Comparing soil physical properties from continuous conventional tillage with long-term reduced tillage affected by one-time inversion. Soil Use Manag. 2017, 33, 611–619. [Google Scholar] [CrossRef]
  58. De Almeida, W.S.; Panachuki, E.; de Oliveira, P.T.S.; da Silva Menezes, R.; Sobrinho, T.A.; de Carvalho, D.F. Effect of soil tillage and vegetal cover on soil water infiltration. Soil Tillage Res. 2018, 175, 130–138. [Google Scholar] [CrossRef]
  59. Xiao, H.; Liu, G.; Zhang, Q.; Fenli, Z.; Zhang, X.; Liu, P.; Zhang, J.; Hu, F.; Elbasit, M.A.M.A. Quantifying contributions of slaking and mechanical breakdown of soil aggregates to splash erosion for different soils from the Loess plateau of China. Soil Tillage Res. 2018, 178, 150–158. [Google Scholar] [CrossRef]
  60. Meurer, K.H.E.; Haddaway, N.R.; Bolinder, M.A.; Kätterer, T. Tillage intensity affects total SOC stocks in boreo-temperate regions only in the topsoil—A systematic review using an ESM approach. Earth-Sci. Rev. 2018, 177, 613–622. [Google Scholar] [CrossRef]
  61. Chaplot, V.; Cooper, M. Soil aggregate stability to predict organic carbon outputs from soils. Geoderma 2015, 243, 205–213. [Google Scholar] [CrossRef]
  62. Ibrahim, V.E.; Osborne, S.L.; Schumacher, T.E.; Riedell, W.E. Corn Residue Removal Effects on Hydraulically Effective Macropores. Commun. Soil Sci. Plant Anal. 2018, 49, 1491–1501. [Google Scholar] [CrossRef]
  63. Ball, B.C.; Bingham, I.; Rees, R.M.; Watson, C.A.; Litterick, A. The role of crop rotations in determining soil structure and crop growth conditions. Can. J. Soil Sci. 2005, 85, 557–577. [Google Scholar] [CrossRef] [Green Version]
  64. Bhattacharyya, R.; Prakash, V.; Kundu, S.; Gupta, H.S. Effect of tillage and crop rotations on pore size distribution and soil hydraulic conductivity in sandy clay loam soil of the Indian Himalayas. Soil Tillage Res. 2006, 86, 129–140. [Google Scholar] [CrossRef]
  65. Haruna, S.I.; Nkongolo, N.V. Cover Crop Management Effects on Soil Physical and Biological Properties. Procedia Environ. Sci. 2015, 29, 13–14. [Google Scholar] [CrossRef]
  66. McDaniel, M.D.; Tiemann, L.K.; Grandy, A.S. Does agricultural crop diversity enhance soil microbial biomass and organic matter dynamics? A meta-analysis. Ecol. Appl. 2014, 24, 560–570. [Google Scholar] [CrossRef] [PubMed]
  67. Tiemann, L.K.; Grandy, A.S.; Atkinson, E.E.; Marin-Spiotta, E.; McDaniel, M.D. Crop rotational diversity enhances belowground communities and functions in an agroecosystem. Ecol. Lett. 2015, 18, 761–771. [Google Scholar] [CrossRef] [PubMed]
  68. Kushwaha, C.P.; Tripathi, S.K.; Singh, K.P. Soil organic matter and water-stable aggregates under different tillage and residue conditions in a tropical dryland agroecosystem. Appl. Soil Ecol. 2001, 16, 229–241. [Google Scholar] [CrossRef]
  69. Blanco-Canqui, H.; Ruis, S.J. No-tillage and soil physical environment. Geoderma 2018, 326, 164–200. [Google Scholar] [CrossRef]
  70. Xie, S.; Jian-jun, Q.; Yuan-ming, L.; Zhi-wei, Z.; Xiang-tian, X. Effects of freeze-thaw cycles on soil mechanical and physical properties in the Qinghai-Tibet Plateau. J. Mt. Sci. 2015, 12, 999–1009. [Google Scholar] [CrossRef]
  71. Hu, W.; Shao, M.; Wang, Q.; Fan, J.; Horton, R. Temporal changes of soil hydraulic properties under different land uses. Geoderma 2009, 149, 355–366. [Google Scholar] [CrossRef]
  72. Alletto, L.; Coquet, Y. Temporal and spatial variability of soil bulk density and near-saturated hydraulic conductivity under two contrasted tillage management systems. Geoderma 2009, 152, 85–94. [Google Scholar] [CrossRef]
  73. Cameira, M. Soil macropore dynamics affected by tillage and irrigation for a silty loam alluvial soil in southern Portugal. Soil Tillage Res. 2003, 70, 131–140. [Google Scholar] [CrossRef]
  74. Mubarak, I.; Mailhol, J.C.; Angulo-Jaramillo, R.; Bouarfa, S.; Ruelle, P. Effect of temporal variability in soil hydraulic properties on simulated water transfer under high-frequency drip irrigation. Agric. Water Manag. 2009, 96, 1547–1559. [Google Scholar] [CrossRef]
  75. McVay, K.A.; Budde, J.A.; Fabrizzi, K.; Mikha, M.M. Management Effects on Soil Physical Properties in Long-Term Tillage Studies in Kansas. Soil Sci. Soc. Am. J. 2006, 70, 434–438. [Google Scholar] [CrossRef]
  76. Basile, A.; Coppola, A.; Mascellis, R.D.; Randazzo, L. Scaling Approach to Deduce Field Unsaturated Hydraulic Properties and Behavior from Laboratory Measurements on Small Cores. Vadose Zone J. 2006, 5, 1005–1016. [Google Scholar] [CrossRef]
  77. Wassar, F.; Gandolfi, C.; Rienzner, M.; Chiaradia, E.A.; Bernardoni, E. Predicted and measured soil retention curve parameters in Lombardy region north of Italy. Int. Soil Water Conserv. Res. 2016, 4, 207–214. [Google Scholar] [CrossRef]
  78. Basile, A.; Ciollaro, G.; Coppola, A. Hysteresis in soil water characteristics as a key to interpreting comparisons of laboratory and field measured hydraulic properties: Hysteresis in field/laboratory hydraulic properties. Water Resour. Res. 2003, 39. [Google Scholar] [CrossRef]
  79. Mallants, D.; Mohanty, B.P.; Vervoort, A.; Feyen, J. Spatial analysis of saturated hydraulic conductivity in a soil with macropores. Soil Technol. 1997, 10, 115–131. [Google Scholar] [CrossRef]
  80. Murphy, B.W.; Koen, T.B.; Jones, B.A.; Huxedurp, L.M. Temporal variation of hydraulic properties for some soils with fragile structure. Soil Res. 1993, 31, 179–197. [Google Scholar] [CrossRef]
  81. Bodner, G.; Leitner, D.; Kaul, H.-P. Coarse and fine root plants affect pore size distributions differently. Plant Soil 2014, 380, 133–151. [Google Scholar] [CrossRef] [Green Version]
  82. Ajayi, A.E.; Horn, R.; Rostek, J.; Uteau, D.; Peth, S. Evaluation of temporal changes in hydrostructural properties of regenerating permanent grassland soils based on shrinkage properties and μCT analysis. Soil Tillage Res. 2019, 185, 102–112. [Google Scholar] [CrossRef]
  83. Leij, F.J.; Ghezzehei, T.A.; Or, D. Analytical models for soil pore-size distribution after tillage. Soil Sci. Soc. Am. J. 2002, 66, 1104–1114. [Google Scholar] [CrossRef]
  84. Schwärzel, K.; Renger, M.; Sauerbrey, R.; Wessolek, G. Soil physical characteristics of peat soils. J. Plant Nutr. Soil Sci. 2002, 165, 479–486. [Google Scholar] [CrossRef]
  85. Derpsch, R.; Franzluebbers, A.J.; Duiker, S.W.; Reicosky, D.C.; Koeller, K.; Friedrich, T.; Sturny, W.G.; Sá, J.C.M.; Weiss, K. Why do we need to standardize no-tillage research? Soil Tillage Res. 2014, 137, 16–22. [Google Scholar] [CrossRef]
  86. Dias, L.C.P.; Macedo, M.N.; Costa, M.H.; Coe, M.T.; Neill, C. Effects of land cover change on evapotranspiration and streamflow of small catchments in the Upper Xingu River Basin, Central Brazil. J. Hydrol. Reg. Stud. 2015, 4, 108–122. [Google Scholar] [CrossRef]
  87. Bormann, H.; Breuer, L.; Gräff, T.; Huisman, J.A. Analysing the effects of soil properties changes associated with land use changes on the simulated water balance: A comparison of three hydrological catchment models for scenario analysis. Ecol. Model. 2007, 209, 29–40. [Google Scholar] [CrossRef]
  88. Zehe, E.; Jackisch, C. A Lagrangian model for soil water dynamics during rainfall-driven conditions. Hydrol. Earth Syst. Sci. 2016, 20, 3511–3526. [Google Scholar] [CrossRef] [Green Version]
  89. Fuentes, J.P.; Flury, M.; Bezdicek, D.F. Hydraulic properties in a silt loam soil under natural prairie, conventional till, and no-till. Soil Sci. Soc. Am. J. 2004, 68, 1679–1688. [Google Scholar] [CrossRef]
  90. Carman, P. Fluid flow through a granular bed. Trans. Inst. Chem. Eng. 1937, 15, 150–167. [Google Scholar] [CrossRef]
  91. Kozeny, J. Uber kapillare Leitung der Wasser in Boden. Sitzungsber Akad Wiss Wien 1927, 136, 271–306. [Google Scholar]
Figure 1. Time scale and influenced soil profile depth due to agricultural management practices (AMP) and variations in atmospheric boundary conditions.
Water 10 01862 g001
Figure 2. Evolution of soil pore size distribution (a) Fuentes et al. [89]: Post CT through a season for 0–3 cm depth. (b) Fuentes et al. [89]: Change in tillage regime from CT to NT for 0–3 cm depth. (c) Fuentes et al. [89]: Post CT through a season for 3–6 cm depth) Fuentes et al. [89]: Change in tillage regime from CT to NT for 3–6 cm depth. For (a,c), the blue, pink and red dots represent the frequencies for 186, 250 and 335 days after tillage while the dashed lines of the same color show the corresponding predicted frequencies. For (b,d), the lime-yellow dots and dashed line represents the observed and predicted frequencies for NT. In both graphs, the green line shows the initial PoSD following CT (in this case, 42 days when the first measurement was taken). (e) Peña-Sancho et al. [42]: Post CT through a season for 10–20 cm depth. The blue, pink and red dots represent the frequencies for 62, 124 and 220 days after tillage while the dashed lines of the same color show the corresponding predicted frequencies. (f) Peña-Sancho et al. [42]: Change in tillage regime from CT to NT for 10–20 cm depth. The lime-yellow dots and dashed line represents the observed and predicted frequencies for NT. In both graphs, the green line shows the initial PoSD following CT (in this case, 1 day when the first measurement was taken).
Water 10 01862 g002aWater 10 01862 g002b
Table 1. Effects on soil hydraulic properties (SHP) due to agricultural management practices and atmospheric impacts published after 2008.
StudyStudy PeriodLocationSoil Type Properties MeasuredLand-Use/CoverEffects on SHP
[10]2006Oldenburg, GermanyPodzol and Stagnosolρb, KsCH, KuEM, ICDRI, θ(h)Forest, grassland and cropland with CTLow ρb immediately after CT followed by gradual increase through a season as well as low Ks, Ku. Both forest and grassland show the opposite trend. IC, Ku and Ks was highest in forest.
[46]2008Prague, Czech RepublicHaplic Luvisolρb, KsCH, θ(h)CT (after harvest of winter barley) and grasslandLower θ(h), Ku under CT compared to grassland. Higher Ks values in CT indicating greater fraction of larger pores and pore connectivity.
[6]2008–2009Canterbury, New Zealand Haplic CambisolKsHI, KuHI,TI, θ(h)CT and pastureKs and Ku values under CT were 4 times higher than under pasture and flow active macropores were 80% larger. Pasture showed a more balanced PoSD.
[8]. 2008–2010Raasdorf, Lower AustriaTypic VermudollKsTI, KuTI, θ(h)CT, RT, NT under winter wheatKs, Ku increased in the order CT < RT < NT. Higher connectivity and smaller tortuosity of macropores under NT.
[47]2005Piedmont, NW ItalyTypic Endoaqueptρb, KuTICT under rice and maize with different water management systemsProgressive soil compaction and increase in ρb, destruction of macro- and mesopores due to submerging water and rainfall.
[48]2007–2009Liudaogou watershed, ChinaCalcaric Arenosol and Calcaric Regosolρb, KsCH4 different mixed shrub landscapesOver-winter increase of Ks and decrease of Ks in the drying season due to FT and WD cycles. Reverse trend was observed in ρb.
[49]2011Saskatchewan, CanadaHaploborollθ(h) and infiltration ratePrairieLower infiltration rates because of increased FT cycles, importance of antecedent soil moisture conditions for potential ice formation in soil pores.
[50]2009–2012Raasdorf, Lower AustriaChernozemθ(h)Post harvest agricultural soils under NTWD cycles enhanced macroporosity, decreased pore heterogeneity. Prediction of temporal changes in soil PoSD from environmental variables.
[51]2007–2010Hněvčeves, Čáslav & Humpolec, Czech RepublicHaplic Luvisol, Greyic Phaeozem, Haplic CambisolAggregate stability, ρb, Ks, KuTI, θ(h)CT under winter barley and winter and spring wheatVariable trends in SHP for all the years depending on rainfall, plant growth and tillage. Different Ks results were observed when different measurement methods were used
[17]2012Lamothe, FranceStagnic Luvisolρb, KsTI, KuTI, θ(h)CT under maizeIncrease in ρb and decrease in Ks over the growing season of the crop from seeding to harvest. Unstable porosity after tillage
[52]-Zhonggou catchment, ChinaCalcaric RegosolKsHI, KuHI, θ(h)Forest (black locus), grassland and cropland (under CT with rape)Creation of temporary macropores after tillage after which there is a decrease in PAWC. Conversion from CT to grassland or forest increases IC and Ks.
Forest demonstrated increases macropore connectivity and water storage capacity.
[53]2010Ceará, BrazilTypic HapludultAggregate stability, θ(h)Natural vegetation forest converted to irrigated pasture for 10 years Lesser total porosity and macroporosity in irrigated pasture compared to natural vegetation. Reduction in θ(h) under pasture.
[54]2010–2013Attica, GreeceTypic XerofluventKsCH, θ(h)Rototillage and NT with bare soil and NT with weed coverRototillage caused a decrease in the number of mesopores and an increase in the micropores. Smaller Ks values for all three management practices after rain events and an increase in Ks during dry periods.
[55]2013Southern ChileHisti-Silandic Andosolθ(h)Land-use change from native forest to naturalized grasslandSoils under grassland showed smaller water storage capacity, air capacity and permeability compared to forest. Land-use changes affected spatial and temporal variability of soil physical functions.
[42]2011–2012Zaragoza, SpainHypercalcic Calcisolρb, θ(h)CT, RT and NT on fallow landTillage operations caused a decrease in ρb. Rainfall was a major factor that affected the θ(h) curve due to disintegration and deformation of soil aggregates.
[43]2010–2013Ponta Grossa, BrazilTypic Haplorthoxθ(h)CT and NT with crop rotationBetter pore connectivity in NT. Larger values of air filled porosity for NT in relation to CT. Tri-modal and bi-modal PoSDs for CT and NT respectively.
[56]-NW IranCalciexereptρb, θ(h), infiltration rateRaindrop impact on CT soilsStrong increase in aggregate breakdown, ρb and compaction with high tendency to form crusts due to raindrop impact. Decrease in infiltration rate and enhanced runoff
[44]2015Nebraska, USATypic ArgiudollKsCH, θ(h), total porosity, infiltrationChisel plow, disk, moldboard plow and NTPonded infiltration was higher under moldboard plow tillage plow than for NT, disk Long-term till had no significant impact on soil porosity, Ks, θ(h) and PAWC.
[57]2014–2015Lower Saxony, GermanyLuvisolKsFH, θ(h), ρb, KuTIMoldboard plow (CT), chisel plow (RT1) and disc harrow (RT2) under winter wheatHigher Ks and K(h) in RT1 and RT2. Higher θ(h) in CT immediately after tillage both in untrafficked areas and tramlines.
[58]2013–2014Aquidauana, BrazilUltisolρb, porosity, aggregate stability, penetration resistanceCT with bare soil and soybean, NT with soybean and pastureHighest macroporosity in pasture. Higher aggregate stability in pasture and NT due to organic matter. High ρb and penetration resistance in NT. In the initial stages, soil tillage influenced infiltration the most while in the final stages, vegetation cover predominantly influenced infiltraition.
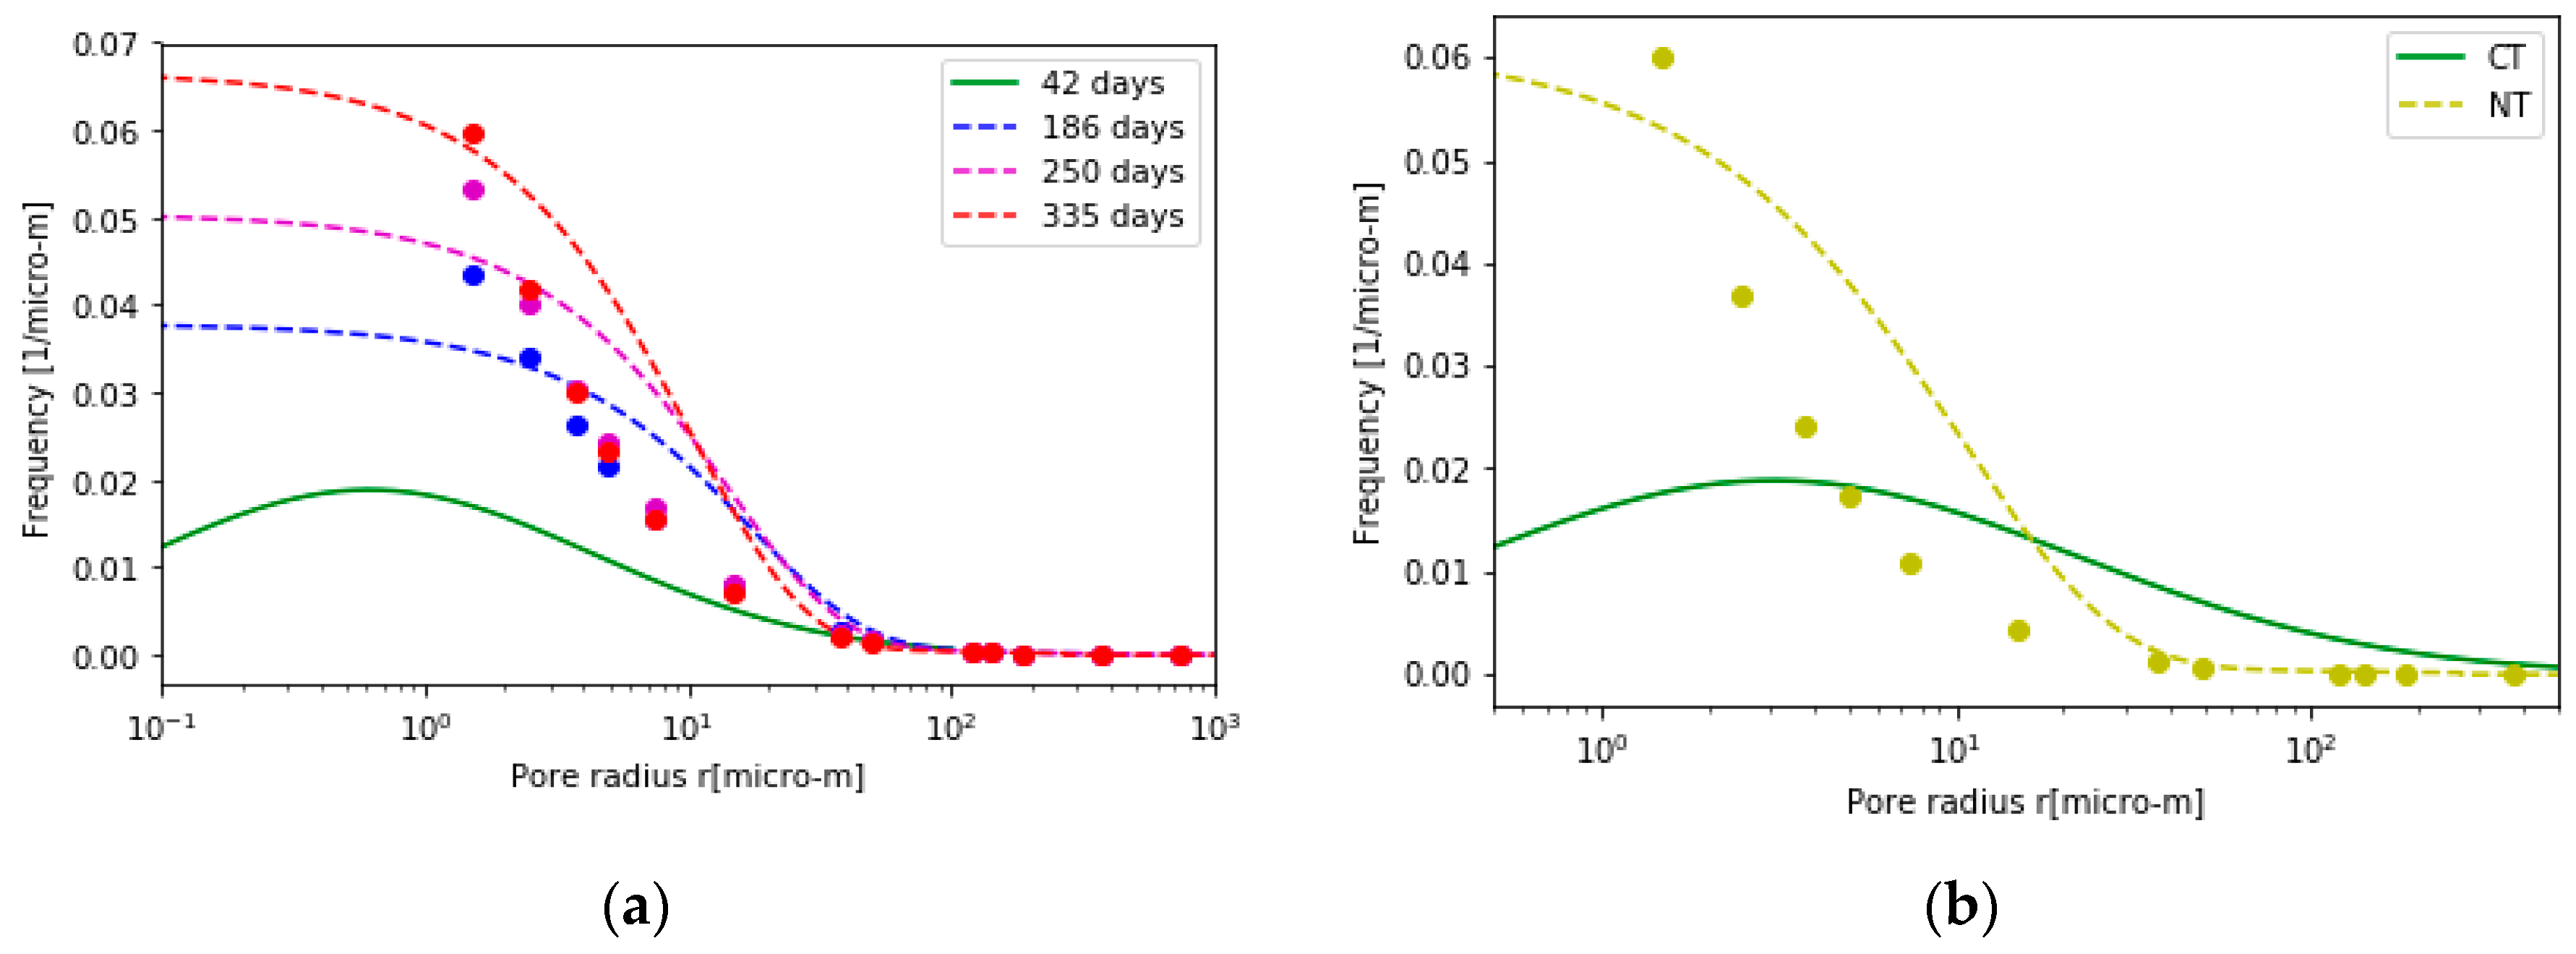
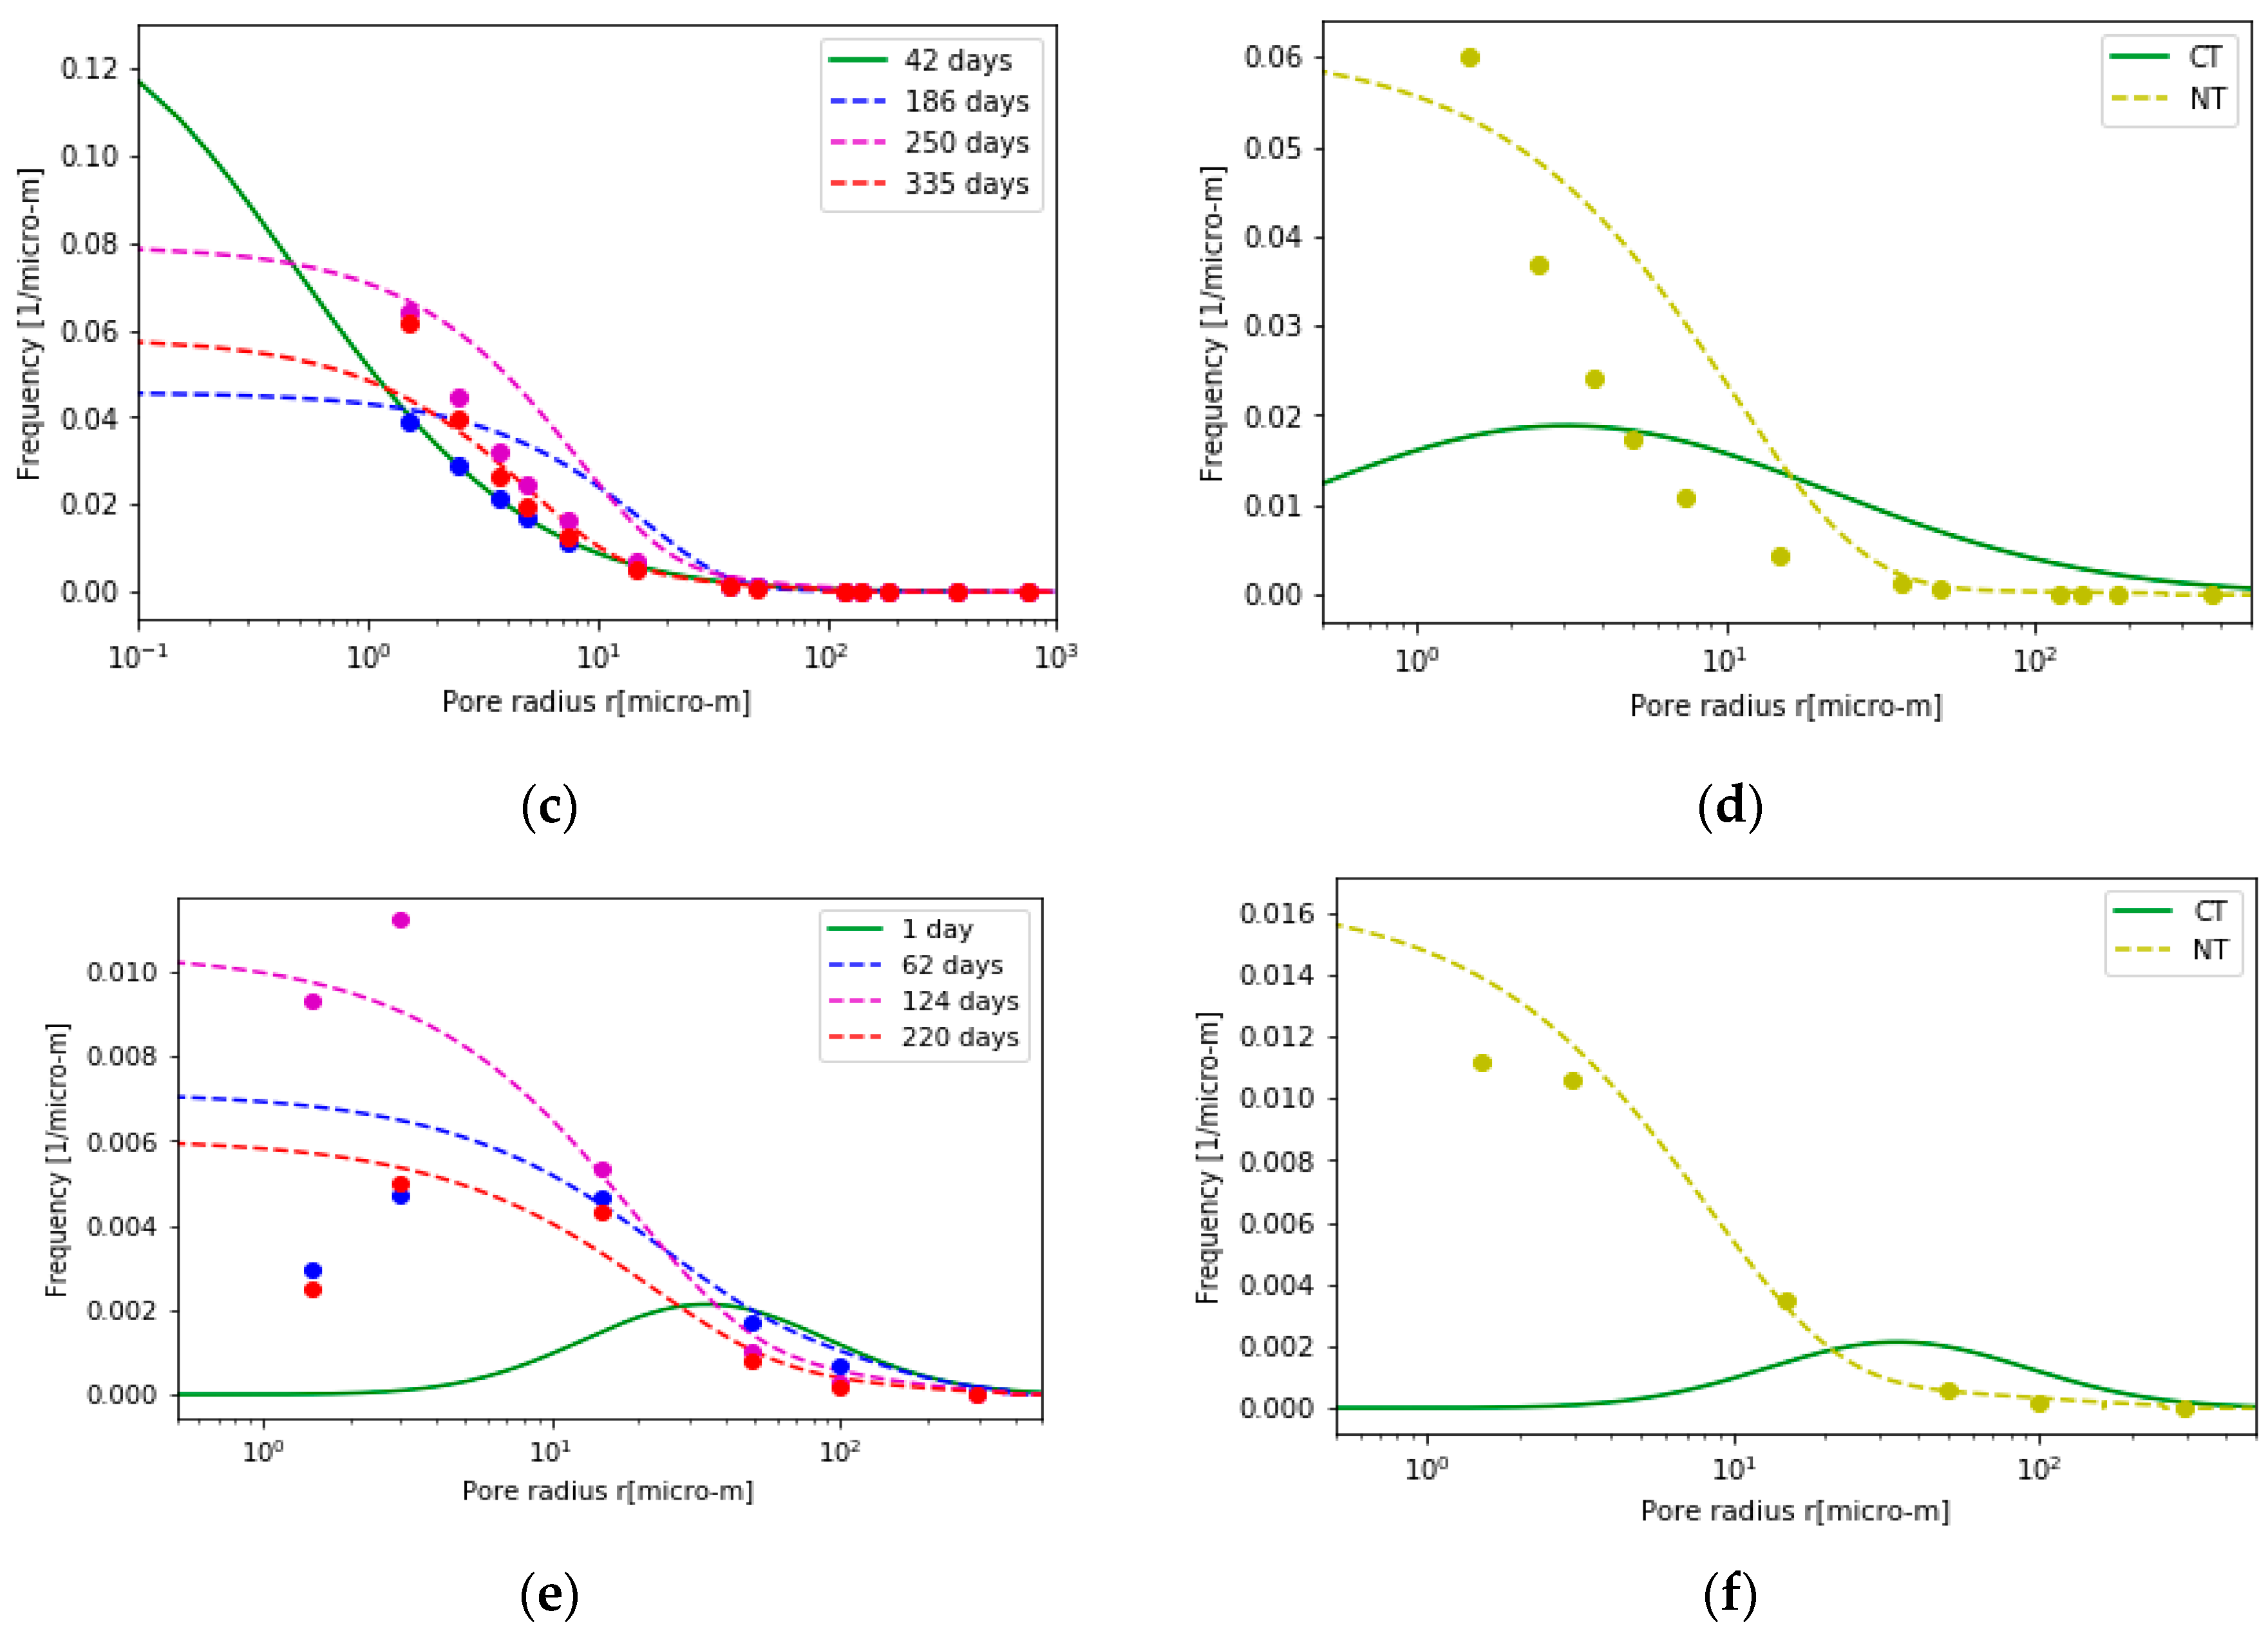
Note 1: ρb: bulk density; θ(h): water retention function; Ks: saturated hydraulic conductivity; Ku: unsaturated hydraulic conductivity; IC: infiltration capacity; NT: no-tillage; RT: reduced tillage; CT: conventional tillage; FT: freezing-thawing; WD: wetting-drying; PoSD: pore size distribution; PAWC: plant available water capacity; SHP: soil hydraulic properties. Note 2: Properties measured: the superscripts denote the following measurement method—CH: constant head; FH: falling head; EM: evaporation method, DRI: double ring infiltrometer; HI: hood infiltrometer; TI: tension infiltrometer.
Table 2. Water retention parameter and model fits.
StudyPracticeDays after Tillageθsθrσrm (µm)r2RMSE
[89]CT (0–3 cm)420.560.15001.9830.47--
1860.600.05001.8611.310.880.005
2500.610.03001.838.820.880.006
3350.570.00101.936.190.840.009
CT to NT-0.500.00102.182.430.890.01
CT (3–6 cm)420.530.00102.341.73--
1860.530.12501.877.790.730.009
2500.610.01201.955.780.840.010
3350.530.00102.143.530.890.005
CT to NT-0.500.00102.182.430.750.01
[42]CT10.490.20000.9889.36-
620.500.21001.3137.030.890.001
1240.460.21001.2515.520.840.009
2200.440.27001.0317.710.830.011
CT to NT-0.400.22001.3711.820.900.004
θs: saturated water content; θr: residual water content; σ: standard deviation of the log-transformed pore radius; rm: median pore radius; RMSE: root mean square error; NT: no tillage; CT: conventional tillage.

