Article

Spatial and Seasonal Distribution and Transportation of Different Forms of Phosphorus in the Middle Reaches of the Yarlung Zangbo River

1
State Key Laboratory of Hydraulics and Mountain River Engineering, Sichuan University, Chengdu 610065, China
2
Guangzhou Municipal Institute of Water Affairs Investigation and Design, Guangzhou 510000, China
3
Sichuan Water Conservancy Vocational College, Dujiangyan 611830, China
*
Authors to whom correspondence should be addressed.
Water 2018, 10(12), 1858; https://doi.org/10.3390/w10121858
Submission received: 17 November 2018 / Revised: 11 December 2018 / Accepted: 12 December 2018 / Published: 14 December 2018
(This article belongs to the Special Issue Environmental Chemistry of Water Quality Monitoring)

Abstract

:
The Yarlung Zangbo River basin ecosystem is fragile. The distribution and transportation of phosphorus is of great significance for aquatic environmental protection and ecological security. The sequential extraction method and molybdenum antimony anti-spectrophotometry were used to measure the concentrations of different forms of phosphorus in the surface sediments from 15 sampling sites along the middle reaches of the Yarlung Zangbo River and its tributaries. The results show that the total phosphorus concentration in the surface sediments is 194.0~540.7 mg/kg, which is mainly composed of inorganic phosphorus. The concentrations of various phosphorus forms ranked as calcium-bound phosphorus (355.6 ± 86.0 mg/kg) > soluble phosphorus (15.9 ± 10.0 mg/kg) > iron-bound phosphorus (12.4 ± 12.3 mg/kg) > organic phosphorus (9.6 ± 6.1 mg/kg) > occluded phosphorus (9.2 ± 3.8 mg/kg) > aluminum-bound phosphorus (5.4 ± 2.3 mg/kg). On the whole, phosphorus concentration is greater in wet season than dry season. Regarding the spatial distribution characteristics, there are great disparities in the different forms of phosphorus in the middle reaches of the Yarlung Zangbo River. Comprehensive analysis shows that phosphorus of this area is mainly self-generated, and concentration of bioavailable phosphorus is small, demonstrating there will not be a large release. We also drew a “specific triangle” of the different forms of phosphorus concentrations in the research area and defined the “α” angle to determine the nutrient status of the overlying water quickly and effectively. Finally, phosphorus flux of the mainstream was estimated. This research may provide information on the phosphorus of Plateau Rivers.

1. Introduction

Phosphorus is an important biogenic material in nature. It usually exists in water bodies and sediments in different forms. In river systems, P usually exists in water, suspended sediments, and sediments settled on river banks [1,2]. The adsorption and desorption processes of different forms of P between overlying water and sediments represent important patterns for P migration and transformation in aquatic ecosystems [3,4]. The analysis of different forms of P in water bodies and sediments is the premise and basis for studying these processes. It is also of great significance for aquatic environmental protection and ecological safety.
Studies on the morphology of P of sediments began in the 1980s, and a variety of chemical sequential extraction methods have been developed thus far. Different extraction methods provide a different classification of P forms [5,6,7,8], and different forms of P have different properties. After discriminating these differences, the sequential extraction method that is suitable for this research was selected. According to the sequential extraction method used in this research, P in sediments is divided into inorganic phosphorus (hereafter referred to as IP) and organic phosphorus (hereafter referred to as OP). IP can be further divided into soluble phosphorus, aluminum-bound phosphorus, calcium-bound phosphorus, iron-bound phosphorus and occluded phosphorus (hereafter referred to as SP, Al-P, Ca-P, Fe-P, and Oc-P, respectively). The sum of the concentrations of all forms of P is the total phosphorus (TP) concentration.
The morphology of P of sediments can help us distinguish the sources of P [9,10]. According to previous research [11,12], by the method used in this research, SP, Al-P, Fe-P, and OP are considered as “external P,” which may came from human activities, such as industrial wastewater, domestic sewage, and the abuse of phosphate fertilizer. Ca-P and Oc-P are considered self-generated, which may be derived from rock weathering or the death of organisms, so they are called “internal P.”
P may enter into overlying water from sediments, but the releasing ability of different forms of P is different, named mobility or bioavailability [13,14]. It is generally considered that SP, Al-P, Fe-P, and OP are mobile or bioavailable to a certain extent, while Ca-P and Oc-P are immobile and biologically unavailable. Of course, the release process is also affected by physical and chemical factors, such as the pH and temperature [15,16,17]. Whether these indicators seriously influence the release process of P in this research area was discussed and evaluated.
The Yarlung Zangbo River is a typical plateau river, with its basin located in the Qinghai-Tibet Plateau, and it has unique natural climatic conditions, such as a fragile ecological environment and strong ultraviolet radiation. The existence of permafrost in the region and climate change also affect the seasonal hydrological processes of the basin [18,19], causing the distribution pattern and transportation of P to have unique rules and characteristics. Extensive studies on P in inland water bodies around the world have been conducted for several decades, focusing on the morphology, spatial-temporal distribution, and transportation characteristics, as well as sources and exchange. Research on P in plateau river systems is generally lacking, which limits our comprehensive understanding of P in aquatic ecosystems. This research aims to obtain spatial-seasonal distribution and transportation characteristics of P and to analyze the release and increased risk of P in this research area. It is of great value for protecting the fragile ecological environment of the Qinghai-Tibet Plateau.

2. Materials and Methods

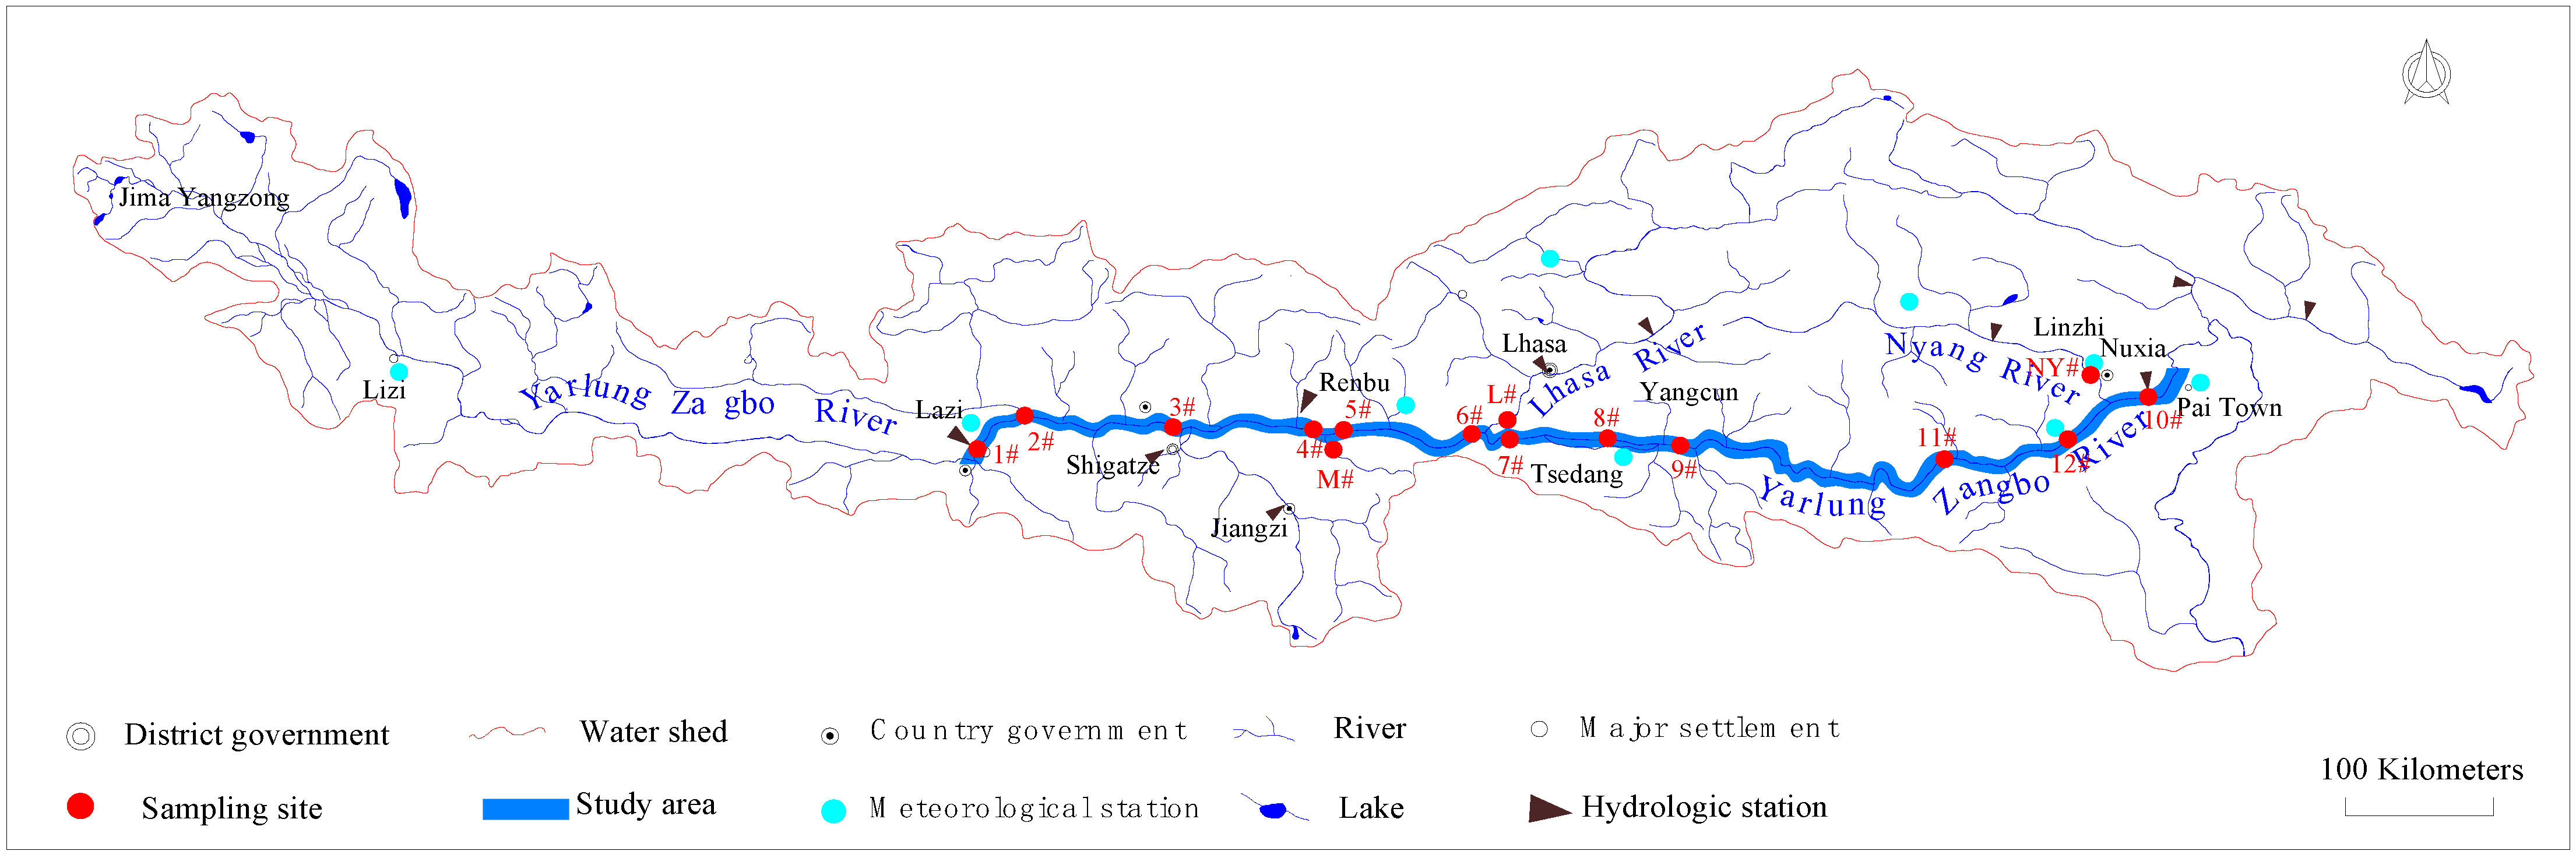
2.1. Sampling Sites and Time

The Yarlung Zangbo River (hereafter referred to as the YLZB River) is the longest plateau river in China and one of the highest rivers in the world. The total length in China is 2057 km, the drainage area is 240,000 km2, and the average elevation is above 4000 m. The middle stream starts from Lazi and ends in Pai of Milin County. The main cities, Lhasa, Shigatse, Shannan, and Nyingchi, are located in the middle reaches, which is the most developed area of Tibet.
To investigate the partition of P in the surface sediments, 15 sampling sites were set in the middle reaches of the YLZB River basin, as is shown in Figure 1. The sampling sites were mainly along the mainstream, including three tributaries, the Menqu River, the Lhasa River, and the Nyang River. The selection of some sampling locations was mainly due to their special nature, such as the Shigatse irrigation station and the widest part of YLZB River. Of course, most of the sampling sites were chosen because of the transportation convenience and because it is easy to mark, for example, hydrological stations, sites near bridges, and sites near towns.
According to the monthly flow process of the Yarlung Zangbo River [20], sample was taken three times, in August 2016, November 2016, and April 2017, to represent different water periods: the wet season, the normal season, and the dry season. In August 2016, 20 samples were collected. Some of the sites took samples in both the left bank and the right bank. This is why the number of samples is more than 15. According to the results of the first sample, there is no large difference between the left bank and the right bank, so we sampled only one bank of one site. In November 2016 and April 2017, there was one site which could not be reached, so the number of samples was 14. The sediment samples were collected within 0~5 cm from the surface of the basin and were stored in sealed bags, which were transported via refrigerated storage in a timely manner. Some samples of suspended sediments and overlying water were also obtained and transported back to the laboratory for testing. While sampling, temperatures of the sampling sites and the pH of their overlying water were also recorded.

2.2. Testing Methods

Sediment samples were first dried by air dryer after being transported back to the laboratory and then screened through a 1 mm sieve. The gradation of the sediment particles was tested by the particle size analyser (Mastersizer 3000E, Malvern Panalytical, Malvern, UK). The concentration of Ca, Fe, and Al in the chosen samples was measured by scanning electron microscope and energy dispersive spectroscopy (hereafter referred to as SEM-EDS) (SEM by JSM-7500F, JEOL Ltd., Tokyo, Japan; EDS by INCA250, Oxford Instruments, Oxford, UK).
Different forms of P were extracted step by step, based on a chemical sequential extraction method [5]. Stepwise extraction was then performed: SP, Al-P, Fe-P, Ca-P Oc-P, and OP. NH4Cl, NH4F, NaOH, H2SO4, and other reagents were used. Oscillation, centrifugation, heating, and other operations were conducted in the overall extraction procedure. Molybdenum antimony anti-spectrophotometry was carried out for testing the concentration of P via UV spectrophotometer (TU-1950, PERSEE, Beijing, China). Each sample was tested twice, and the relative standard deviation between the two results was controlled below 5%.

2.3. Model of Total Phosphorus Flux in the River

P in rivers is transported mainly through water currents and suspended sediments. The total phosphorus flux in the river was estimated according to the following simplified model [21]:
Lt = Lw + Ls
Lw = Q × Cw(dp)
Ls = Fs × Cs(tp)
Note:
  • Lt—total phosphorus flux (g/s) in the river.
  • Lw—water currents phosphorus flux (g/s).
  • Ls—suspended sediments phosphorus flux (g/s).
  • Q—flow (m3/s).
  • Cw(dp)—dissolved phosphorus content (mg/L) in water.
  • Fs—suspended sediment transport rate (kg/s).
  • Cs(tp)—total phosphorus concentration of suspended sediments (g/kg).

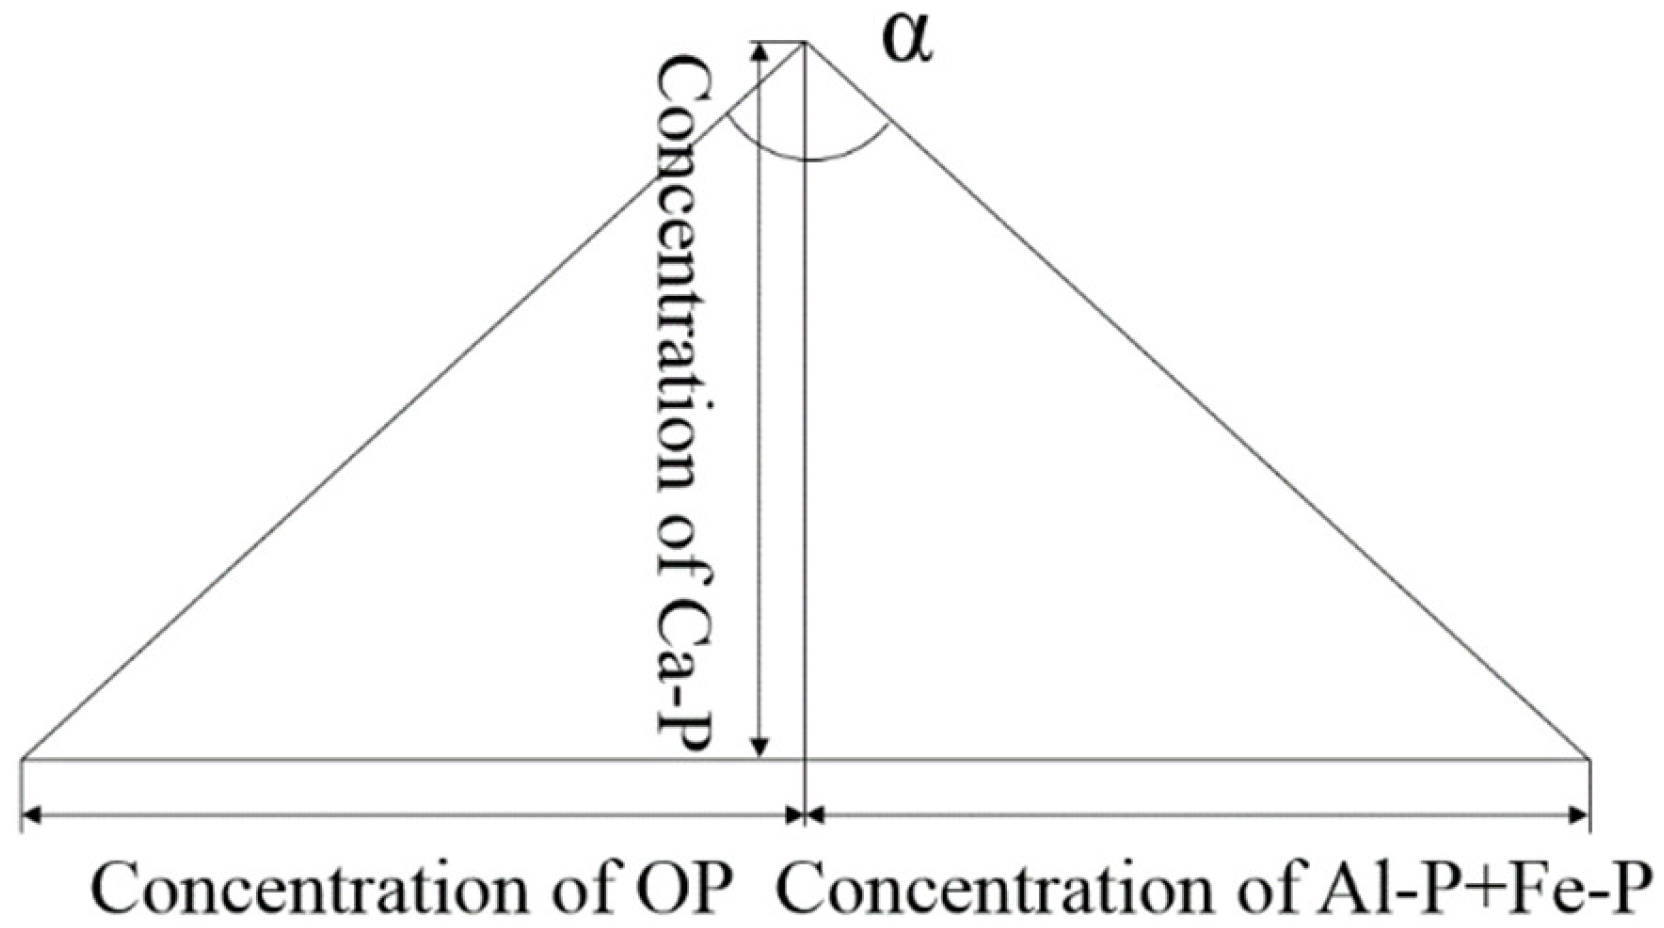
2.4. The Drawing Method of the “Specific Triangle of P”

It is generally recognized that OP, Al-P, and Fe-P are closely related to the nutrient status of the overlying water and eco-health of the sediments [22,23]. We need to judge these by comparison with other studies. There is not one simple and effective indicator that can be generalized across all studies. A “specific triangle” was drawn according to the concentrations of the certain forms of P in surface sediments, and “α” was calculated as the indicator by which we can judge the nutrient status of the overlying water and the eco-health of the sediments. The drawing method of the “specific triangle of P” is shown in Figure 2, and “α” could be gained by the equation below (“C” means concentration):
α = arctan[C(OP)/C(Ca-P)] + arctan[C(Al-P + Fe-P)/C(Ca-P)]

3. Results

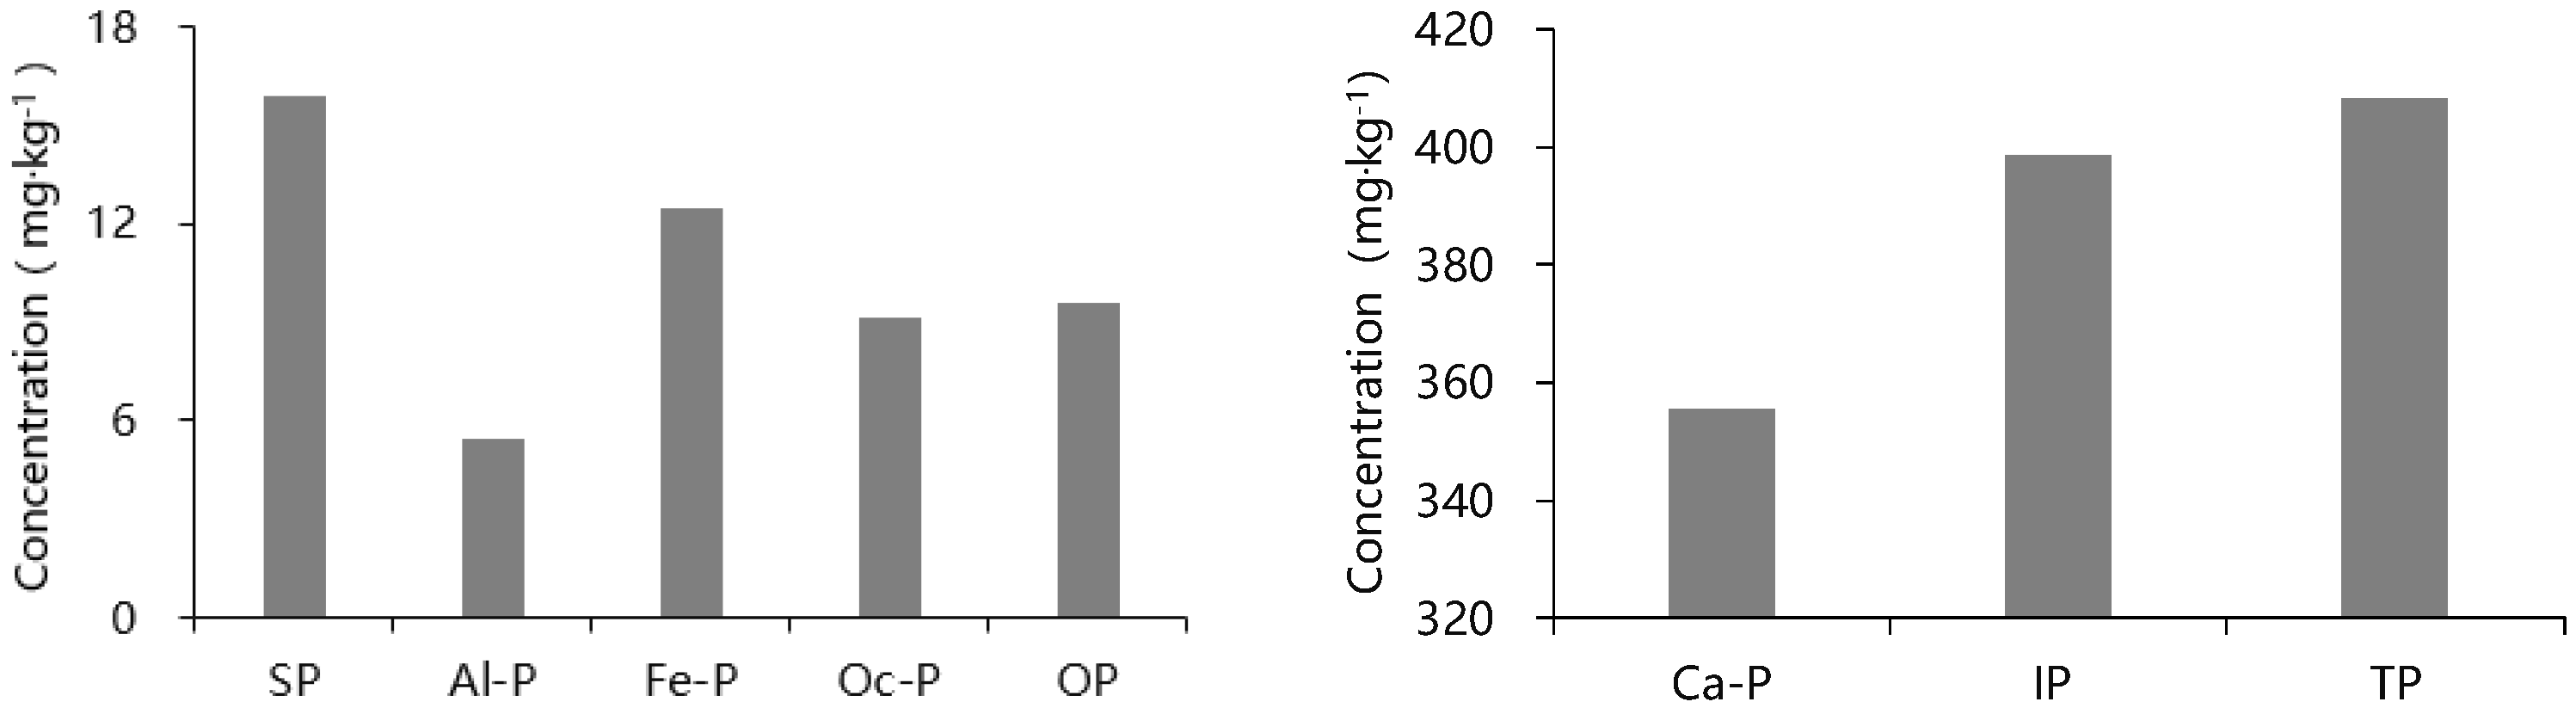
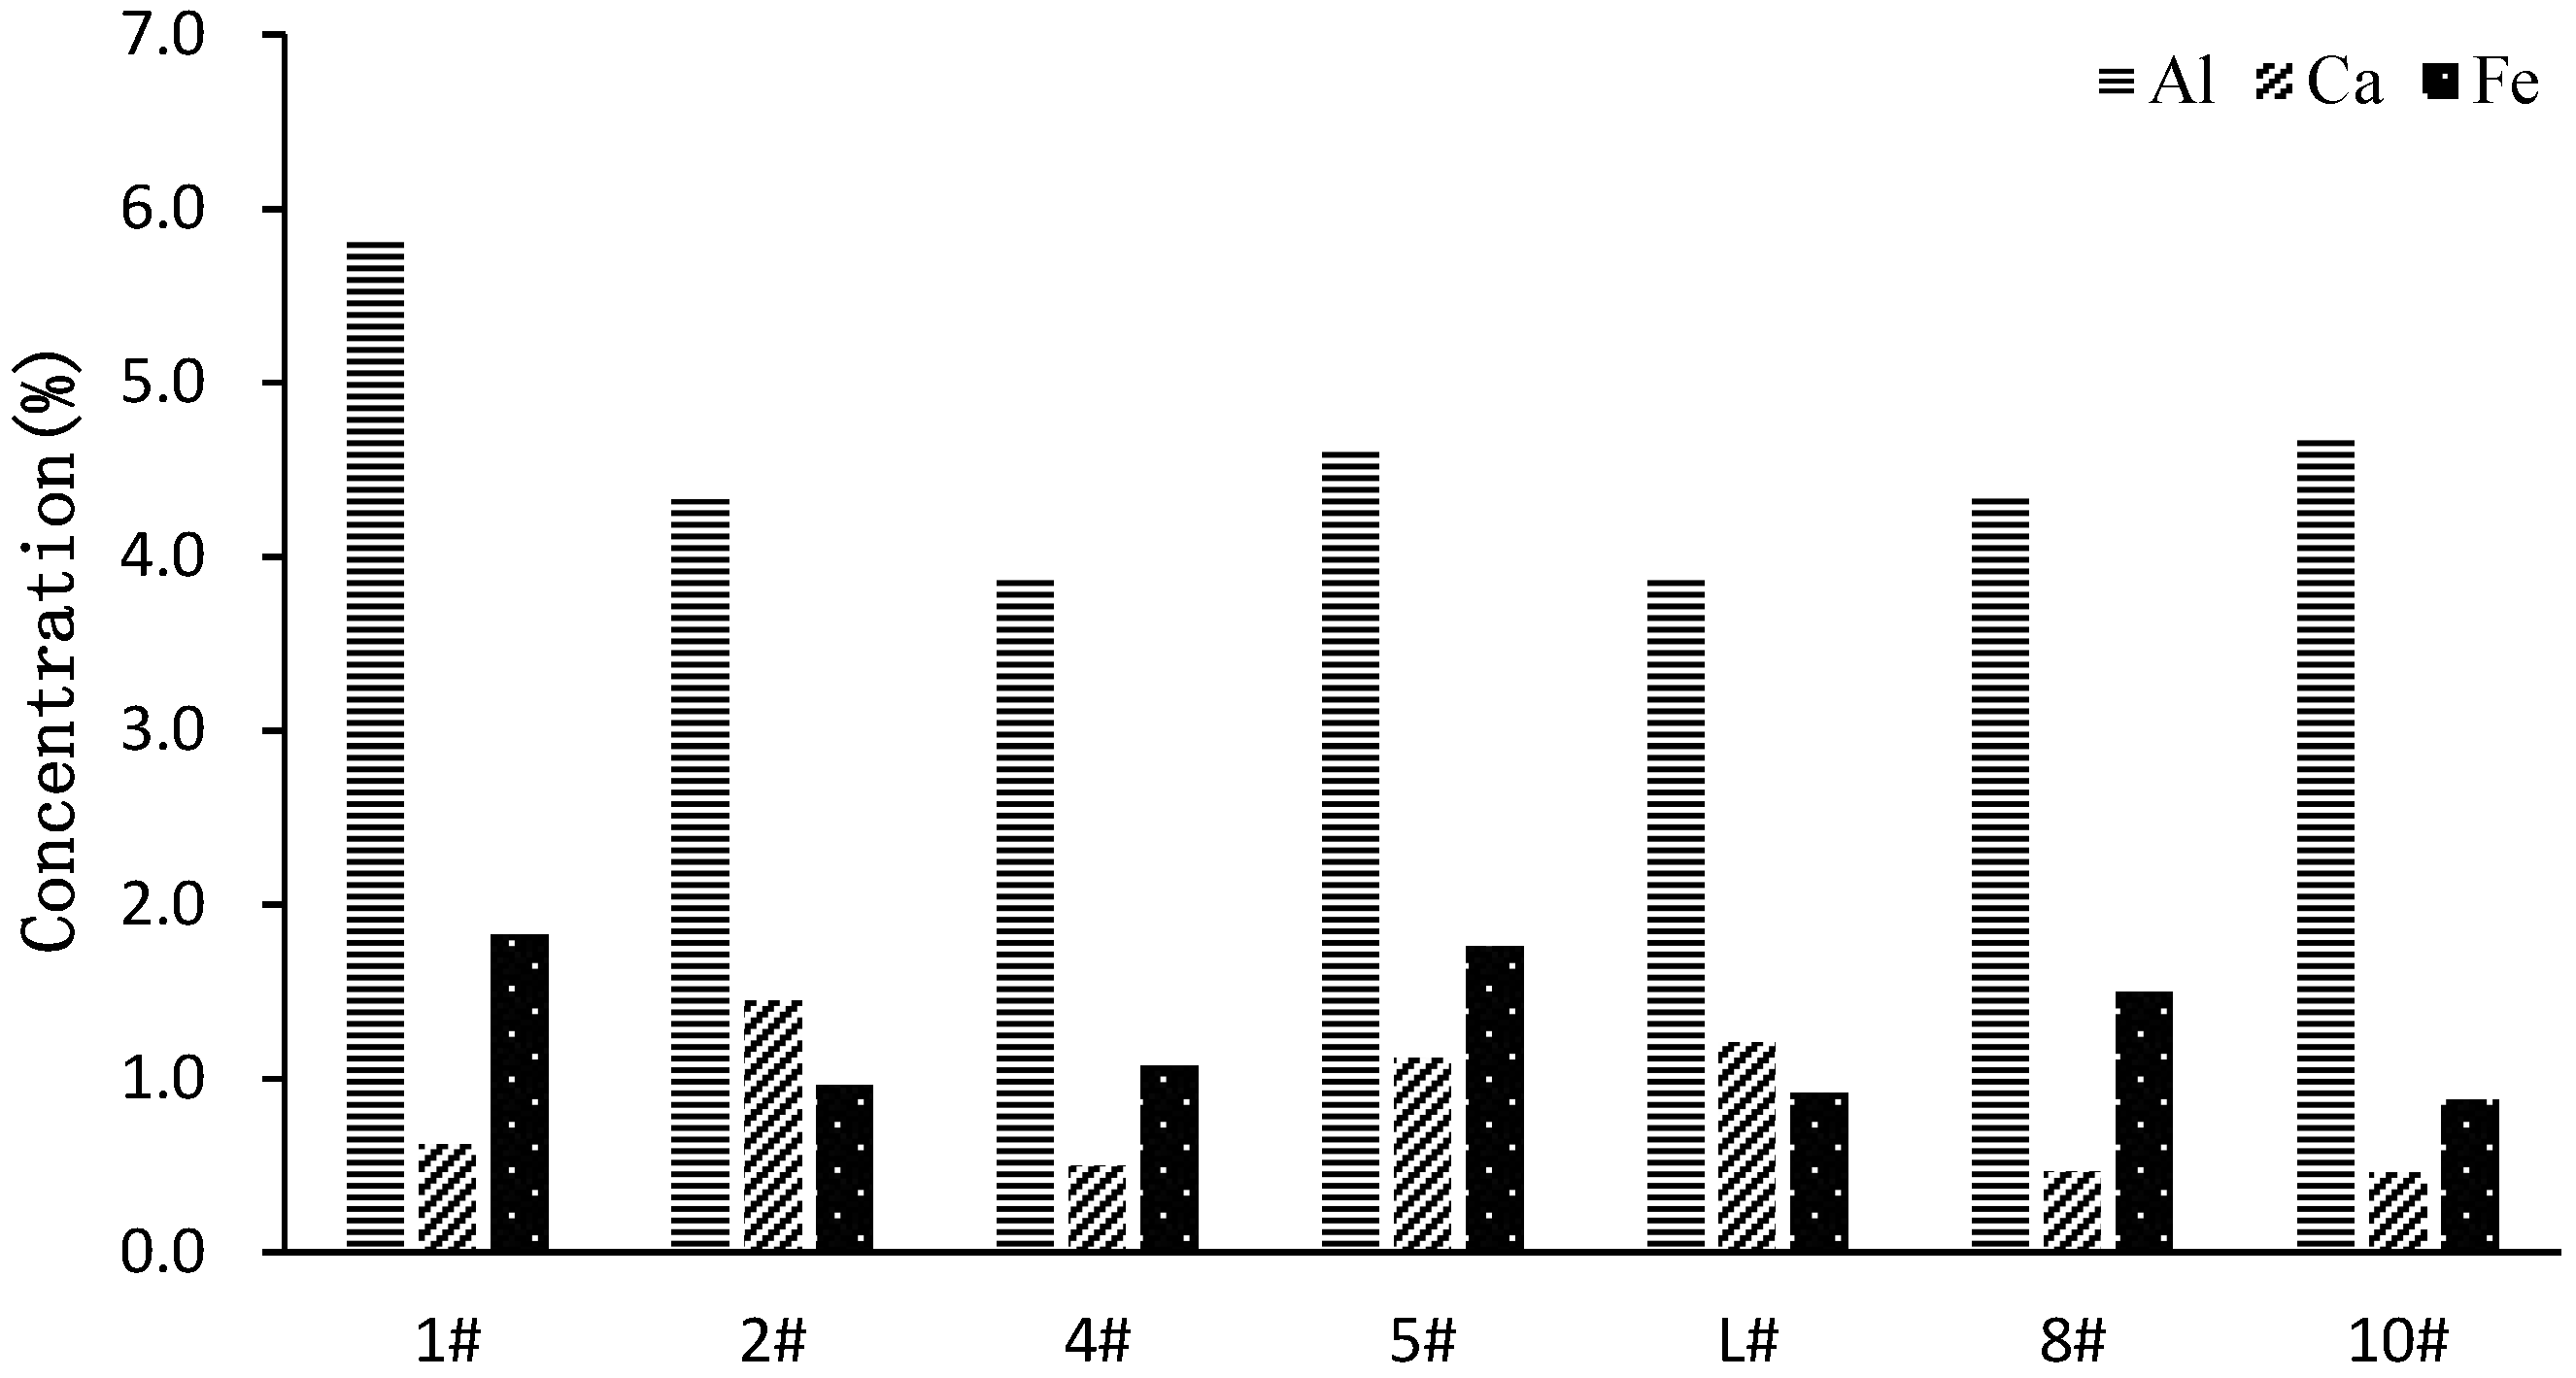
3.1. Fractal P and TP Concentration

For each sample, the concentration of SP, Al-P, Fe-P, Ca-P, Oc-P, and OP was analyzed and determined, and the sum of the concentration of each form of P was considered as the TP concentration. All test results were averaged, as shown in Figure 3. The results indicated that the concentrations were ranked as follows: Ca-P (355.6 ± 86.0 mg/kg) > SP (15.9 ± 10.0 mg/kg) > Fe-P (12.4 ± 12.3 mg/kg) > OP (9.6 ± 6.1 mg/kg) > Oc-P (9.2 ± 3.8 mg/kg) > Al-P (5.4 ± 2.3 mg/kg). The IP concentration was 398.6 ± 83.6 mg/kg, and the TP concentration of each sample was between 194.0 and 540.7 mg/kg, with an average of 408.2 mg/kg.
Figure 4 shows the ratios of IP and OP to TP. From the proportion of TP, IP accounts for 97.65% of the TP, while OP accounts for only 2.35%, the IP concentration is much larger than that of OP. It also shows the ratios of the different forms of P to the TP. The concentration of Ca-P accounts for 87.12% of the TP concentration, followed by SP (3.90%), Fe-P (3.05%), and Oc-P (2.25%). Finally, Al-P accounts for the smallest TP concentration—only 1.33%. The Ca-P concentration has an absolute advantage, and its concentration is far greater than that of other P forms.
Table 1 shows the correlations among the concentrations of various forms of P in the surface sediments. There is a positive correlation between the SP concentration and the Fe-P concentration, and this relationship is significant (R = 0.640 **, p < 0.01, n = 48). In this research area, there were significant and strong positive correlations between the Ca-P concentration and the IP concentration (R = 0.962 **, p < 0.01, n = 48), between the Ca-P concentration and the TP concentration (R = 0.955 **, p < 0.01, n = 48), and between the IP concentration and the TP concentration (R = 0.997 **, p < 0.01, n = 48).

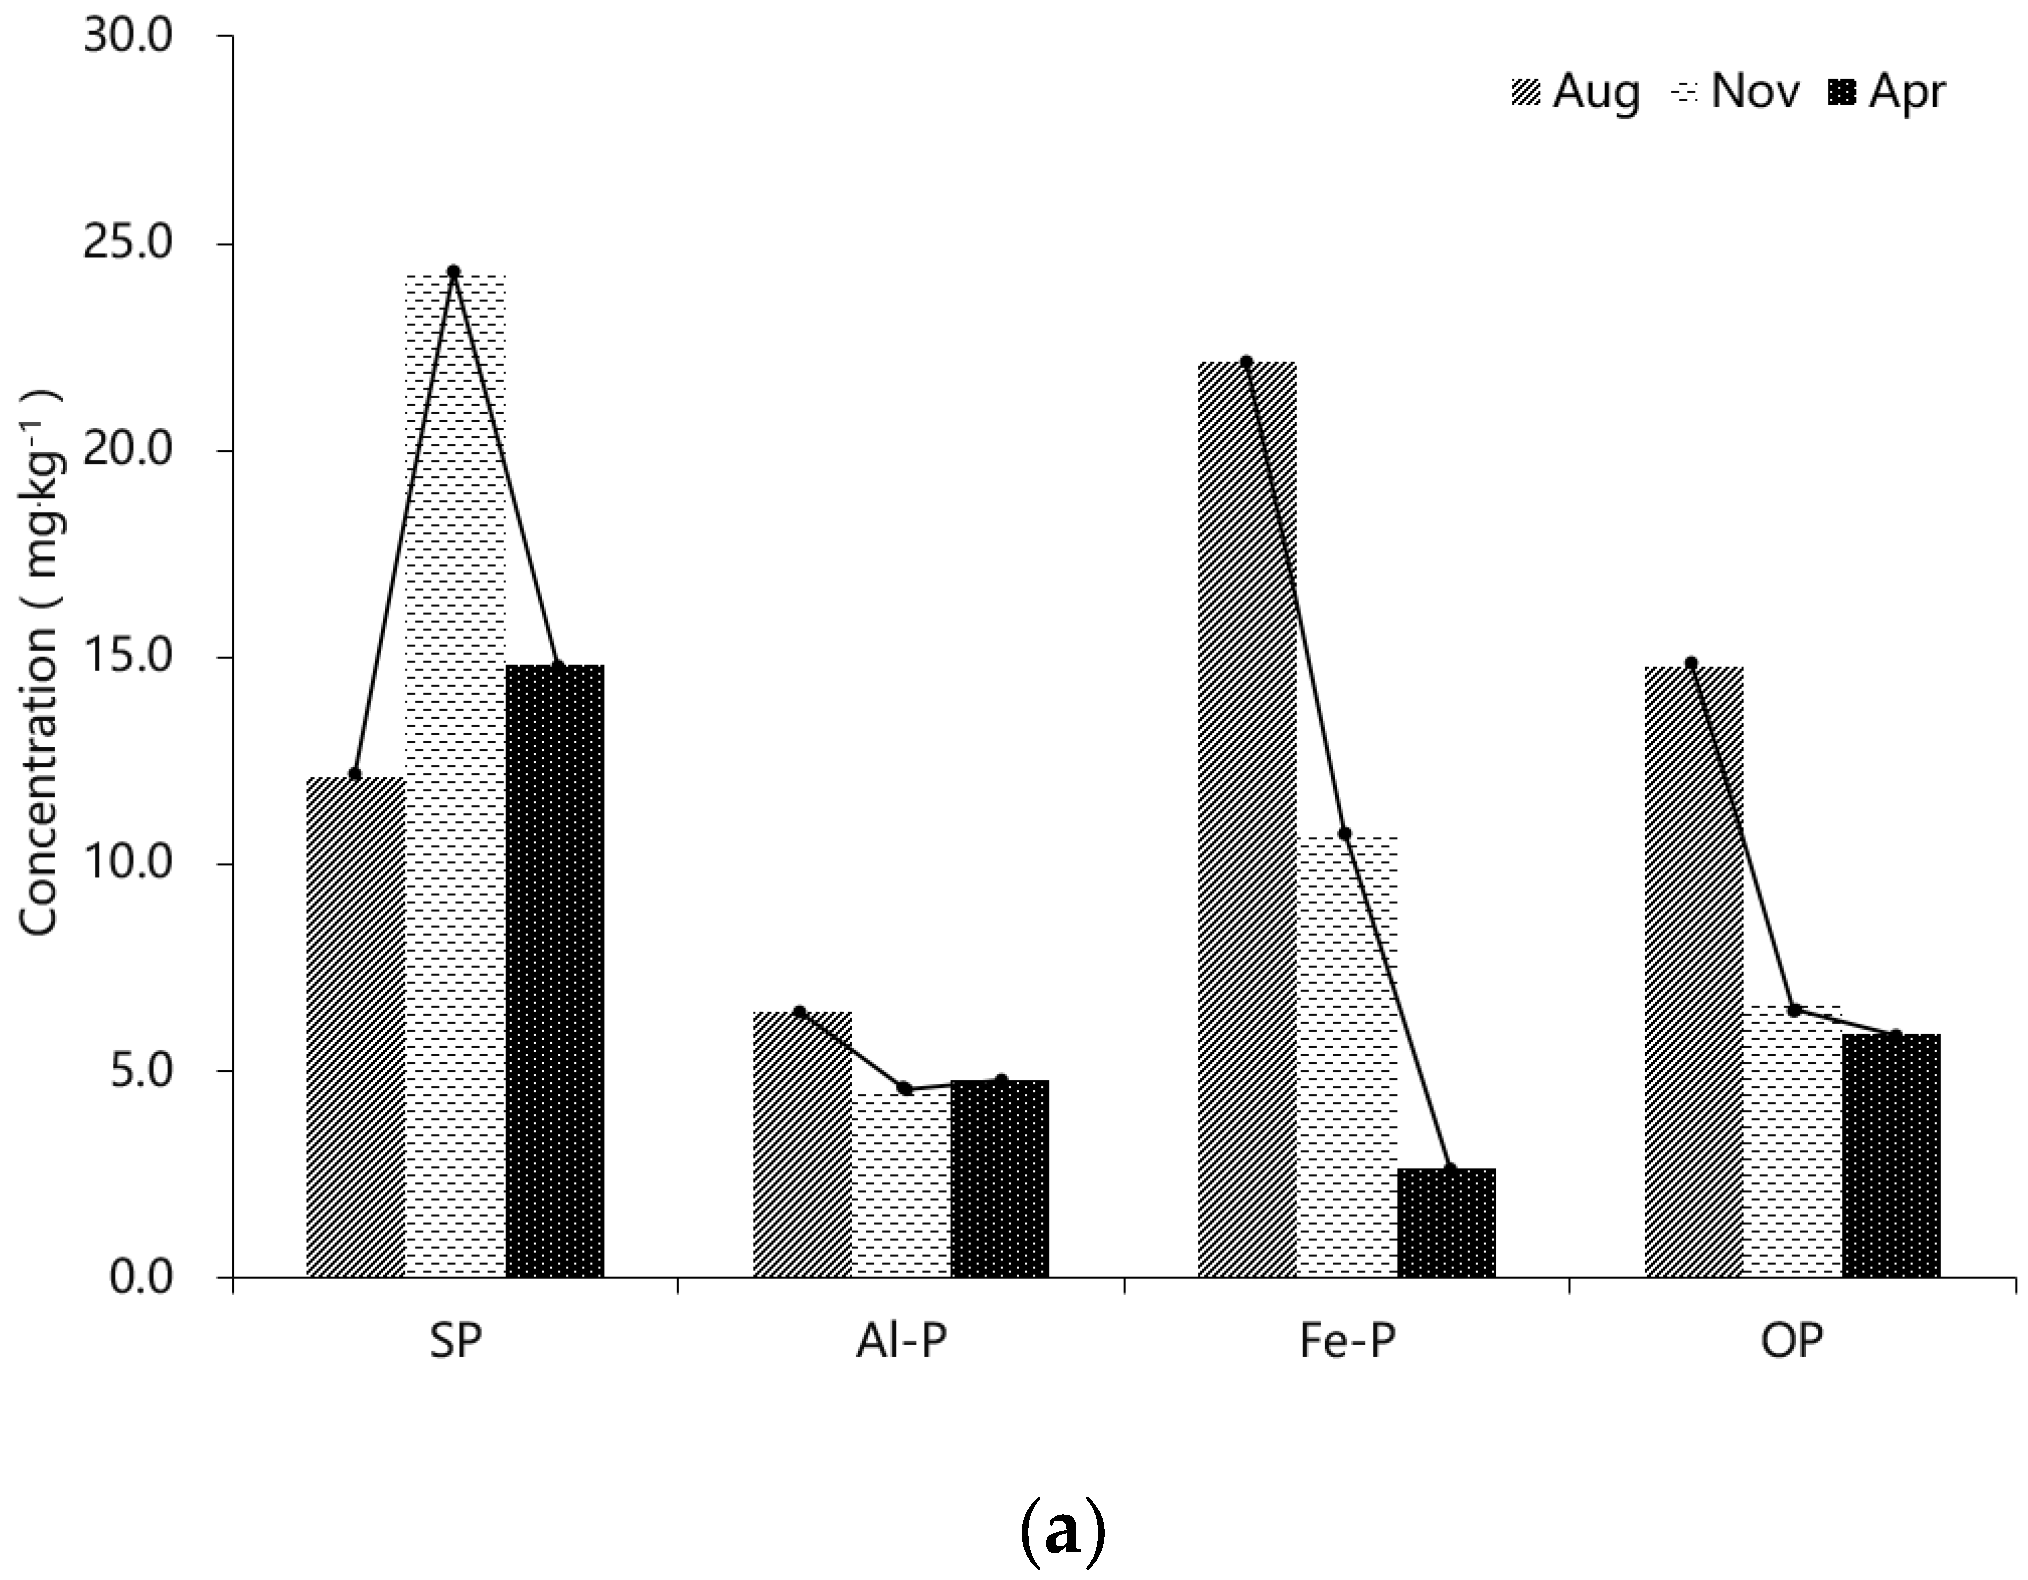
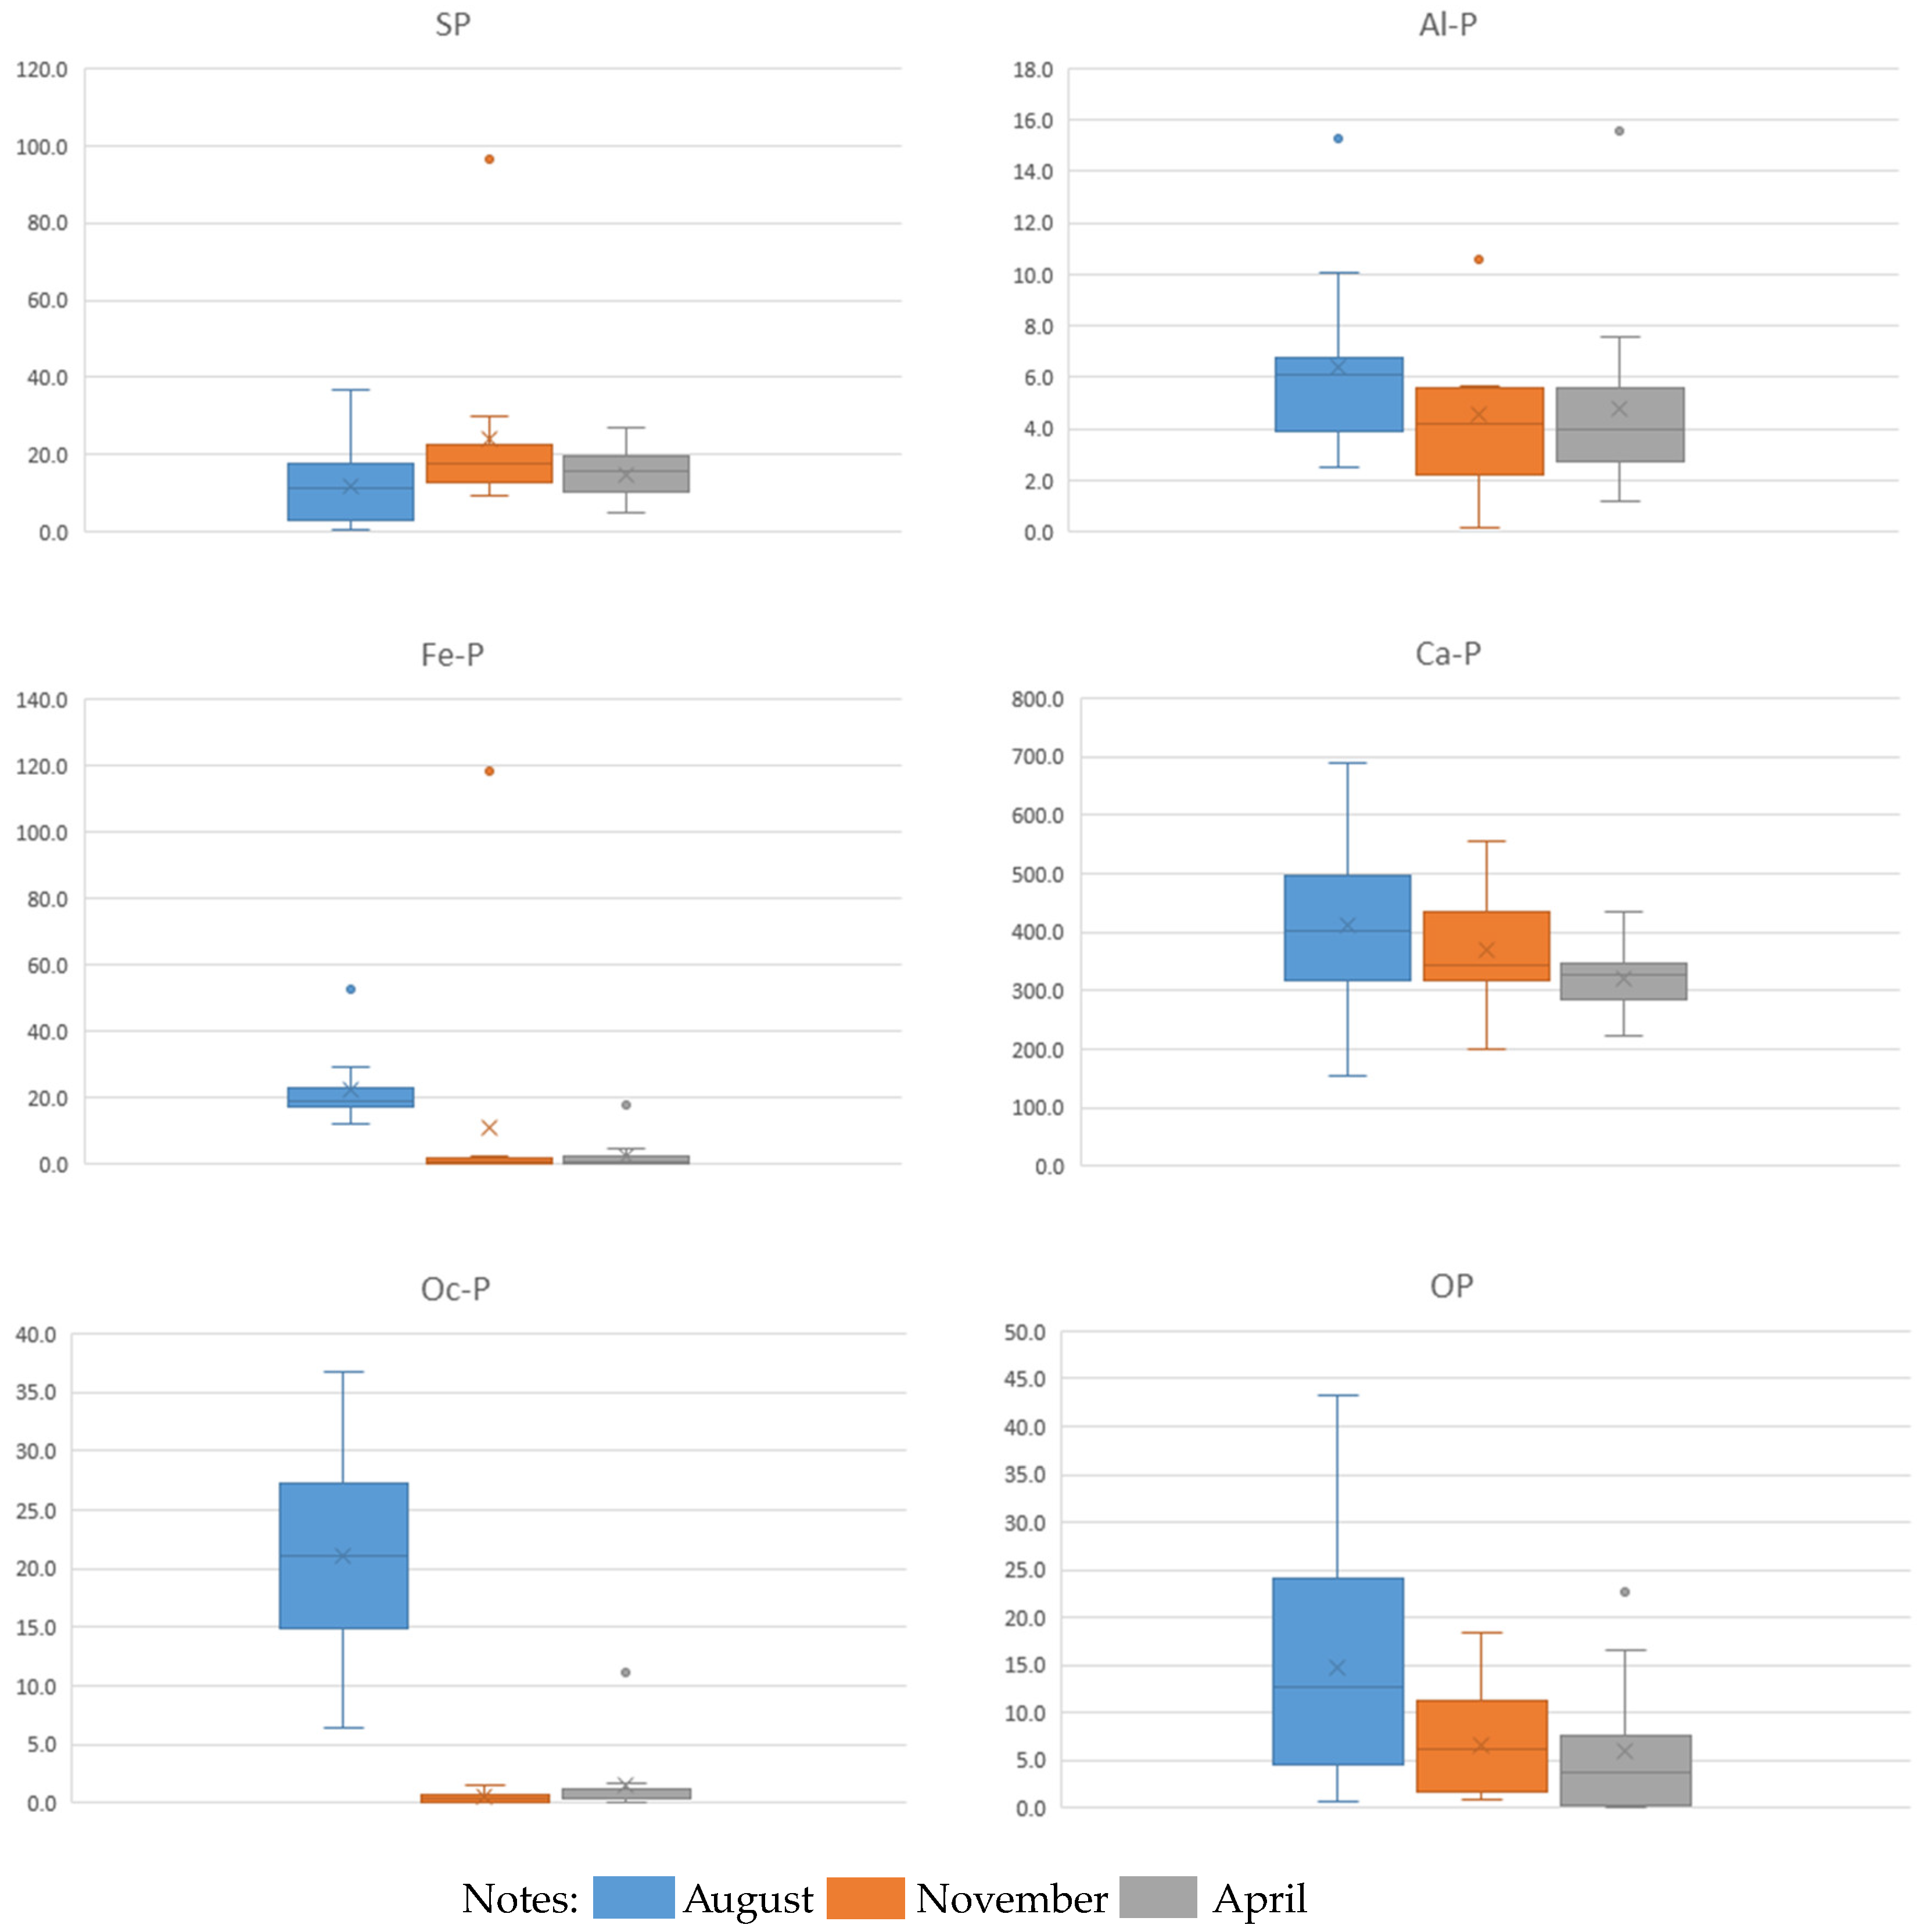
3.2. Seasonal Distribution of TP and Different Forms of P

Figure 5a,b show the changes in SP, Al-P, Fe-P, OP, Ca-P, and TP in the surface sediments of the YLZB River. The sampling time of this research was August 2016, November 2016, and April 2017, which represent the wet season, the normal season, and the dry season of the YLZB River, respectively. In August 2016, the SP concentration in the surface sediments of the YLZB River basin was 12.1 mg/kg, while the SP concentrations in November 2016 and April 2017 were 24.3 mg/kg and 14.8 mg/kg, respectively. The concentration in August 2016 was at a relatively low level. The concentrations of Al-P, Fe-P, Ca-P, and TP were higher in August than in November or April. Except for SP, other forms of P and TP all have their highest concentration in August.

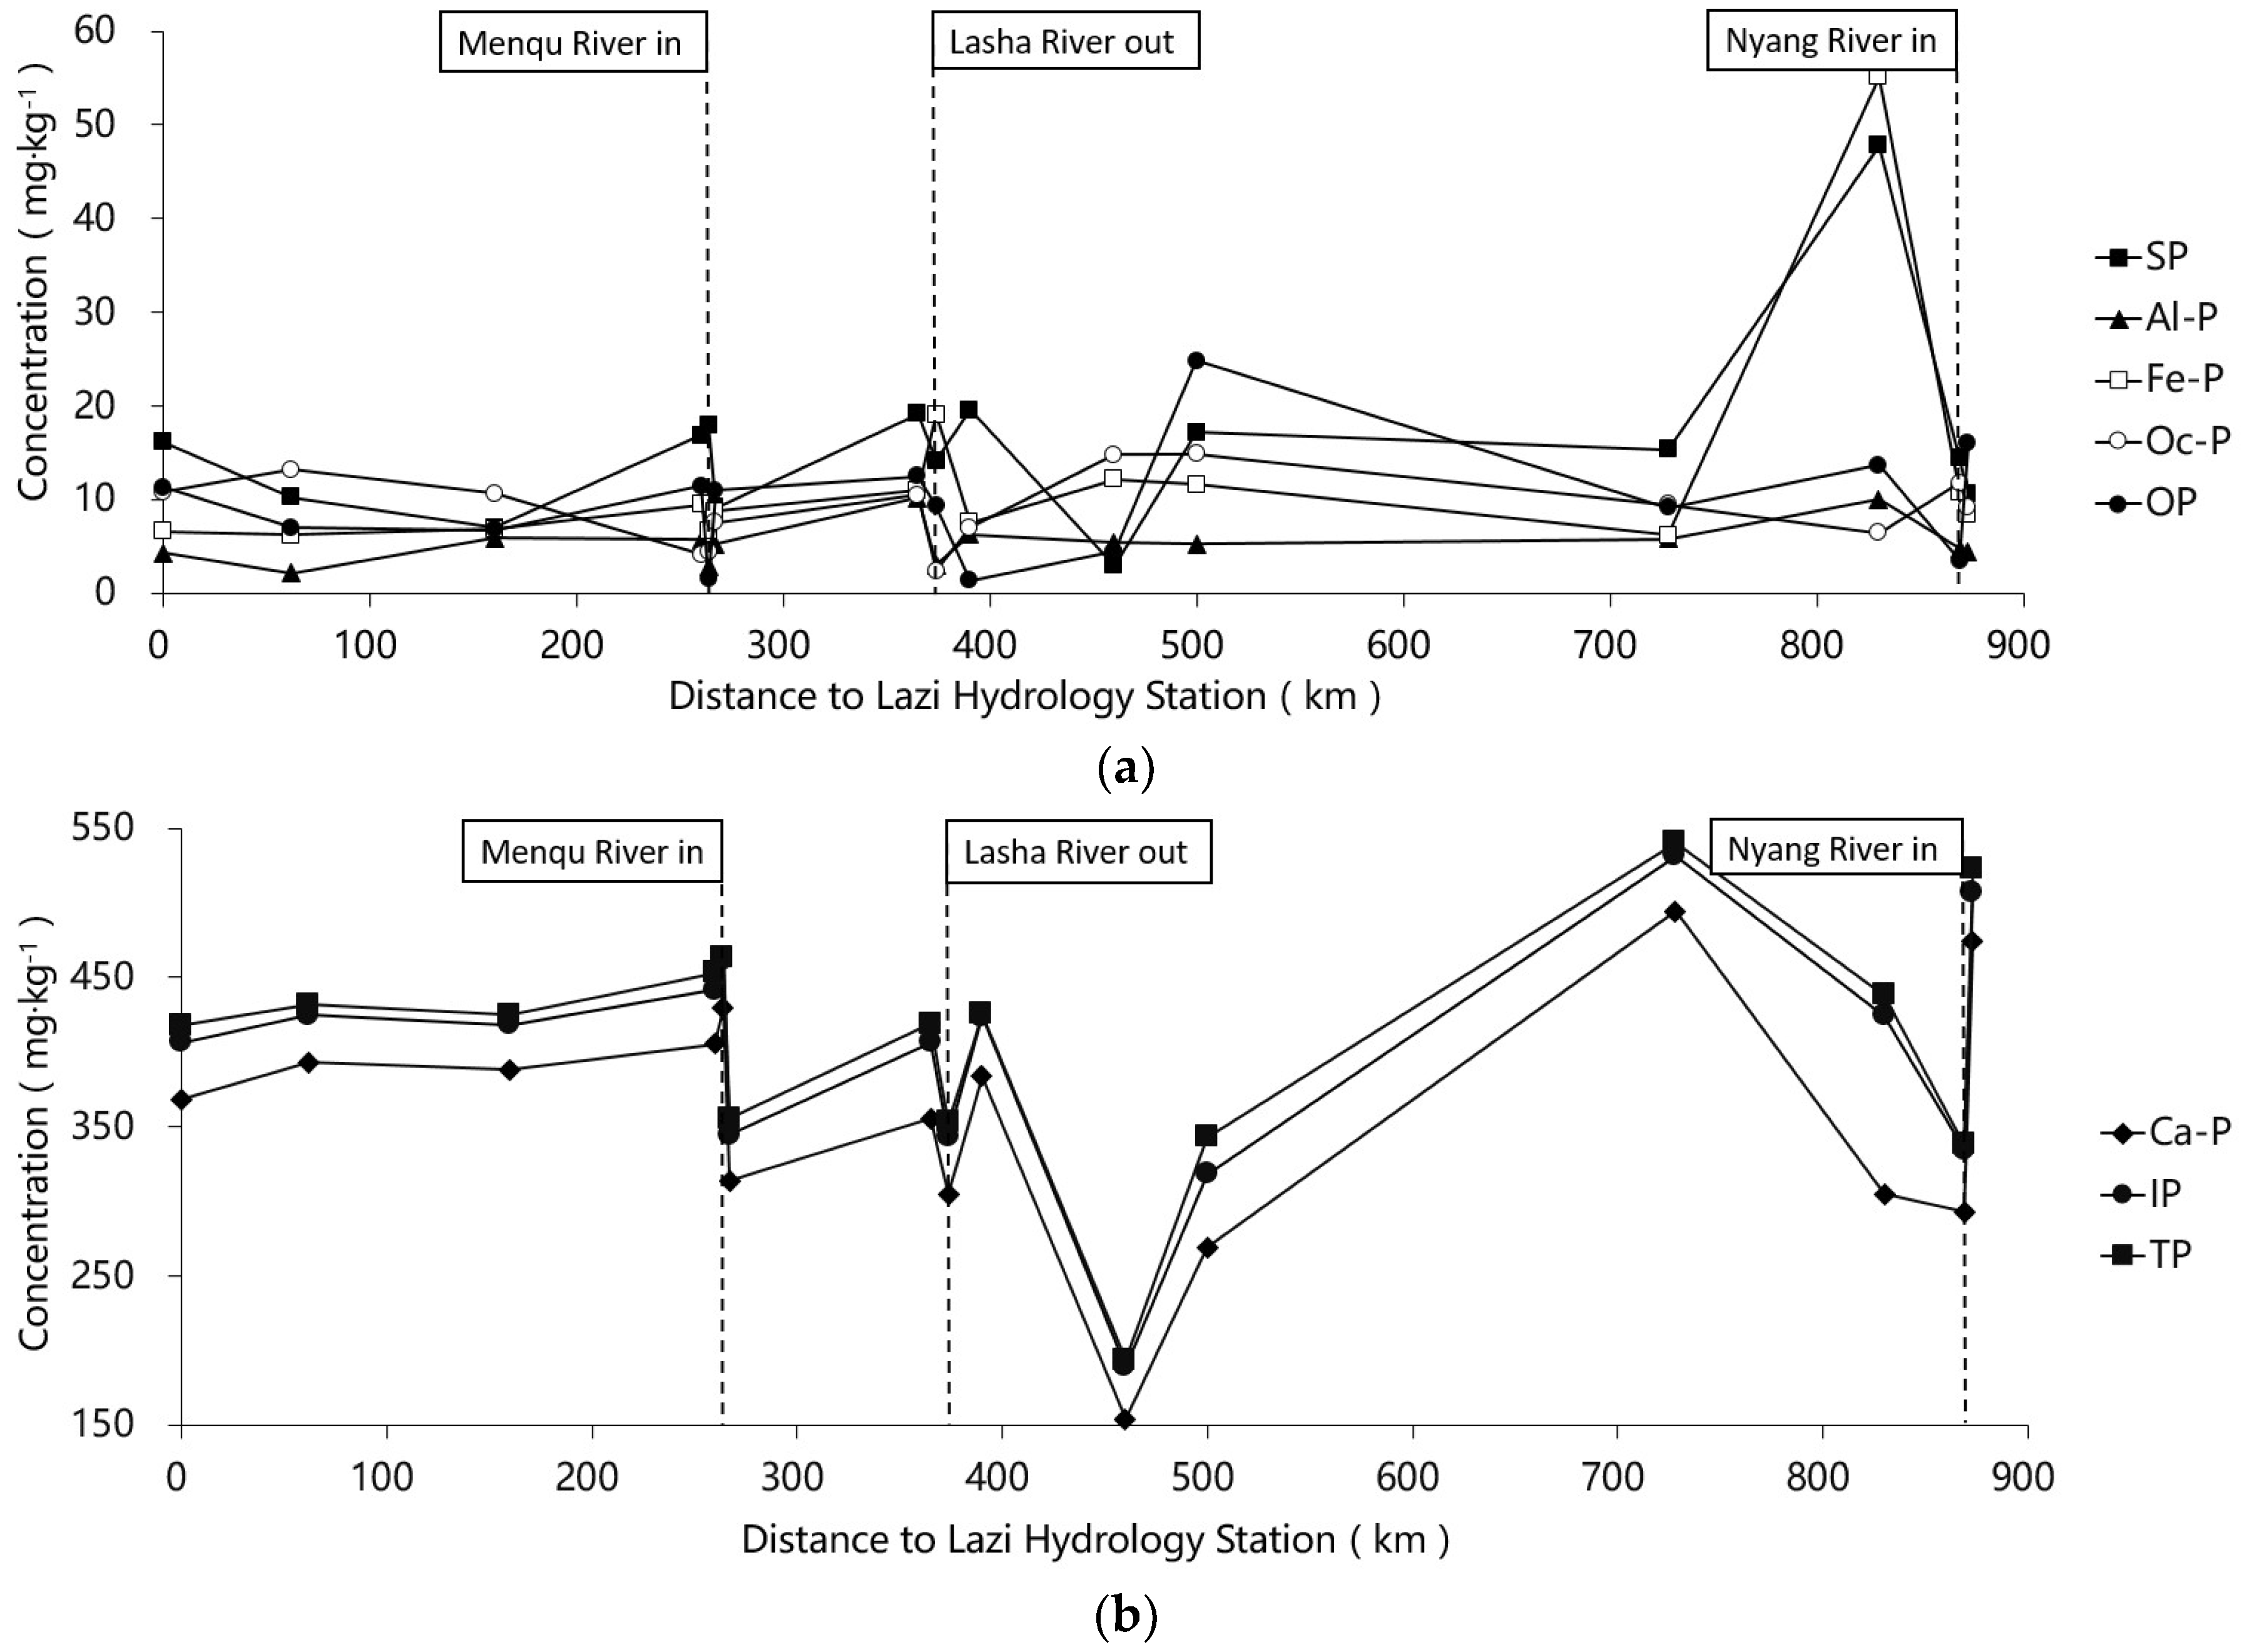
3.3. Spatial Distribution of TP and Different Forms of P

The changes of TP and different forms of P in the surface sediments of the YLZB River basin are shown in Figure 6a,b. In the figure, the positions where the three tributaries flow out from the mainstream or into the mainstream are marked, and the concentrations of the different forms of P and TP are the results obtained from the samples which were collected from each tributary sampling site. TP concentration varies from 194.0 to 540.7 mg/kg, the site which possesses the lowest TP concentration is located at the widest part of the YLZB River, and the site which possesses the highest TP concentration is near Langxian County. In the middle reaches of the YLZB River, TP concentrations remained basically unchanged in the upper part of the river. Additionally, the values of several adjacent sections were very similar. In the middle part of the research area, TP concentrations increased in the three sampling sites of the mainstream, the site of the Renbu Bridge, the site of the Qushui County Bridge, and the downstream site of the Lhasa River outlet. TP concentrations in the adjacent sections showed a dramatic change, ranging from 100 mg/kg to 200 mg/kg. The two sites with the highest TP concentration were also determined, with the values of 540.7 mg/kg at the Langxian County site and 522.7 mg/kg at the Nuxia Hydrological Station site. There is no increasing enrichment or diminishing dilution of the TP concentration below the Lazi Hydrological Station site, but there was a great difference in the TP concentration at the adjacent sites. The degree gradually increased from the upper part of the middle reaches to the lower part of the middle reaches. The difference in the TP concentrations between the adjacent sections in the upper part of the river is only 30 mg/kg, and the difference in the TP concentration between adjacent sections in the lower part of the middle reaches is relatively large, even up to 200 mg/kg. The TP concentration has a good correlation with the IP concentration (correlation coefficient = 0.997) and the Ca-P concentration (correlation coefficient = 0.955), as is shown in Table 1. Thus, the trend along the path is similar. The concentrations of SP, Al-P, Fe-P, Ca-P, Oc-P, and OP were low, and the trend was not obvious. Furthermore, there was no obvious correlation with the trend of TP.

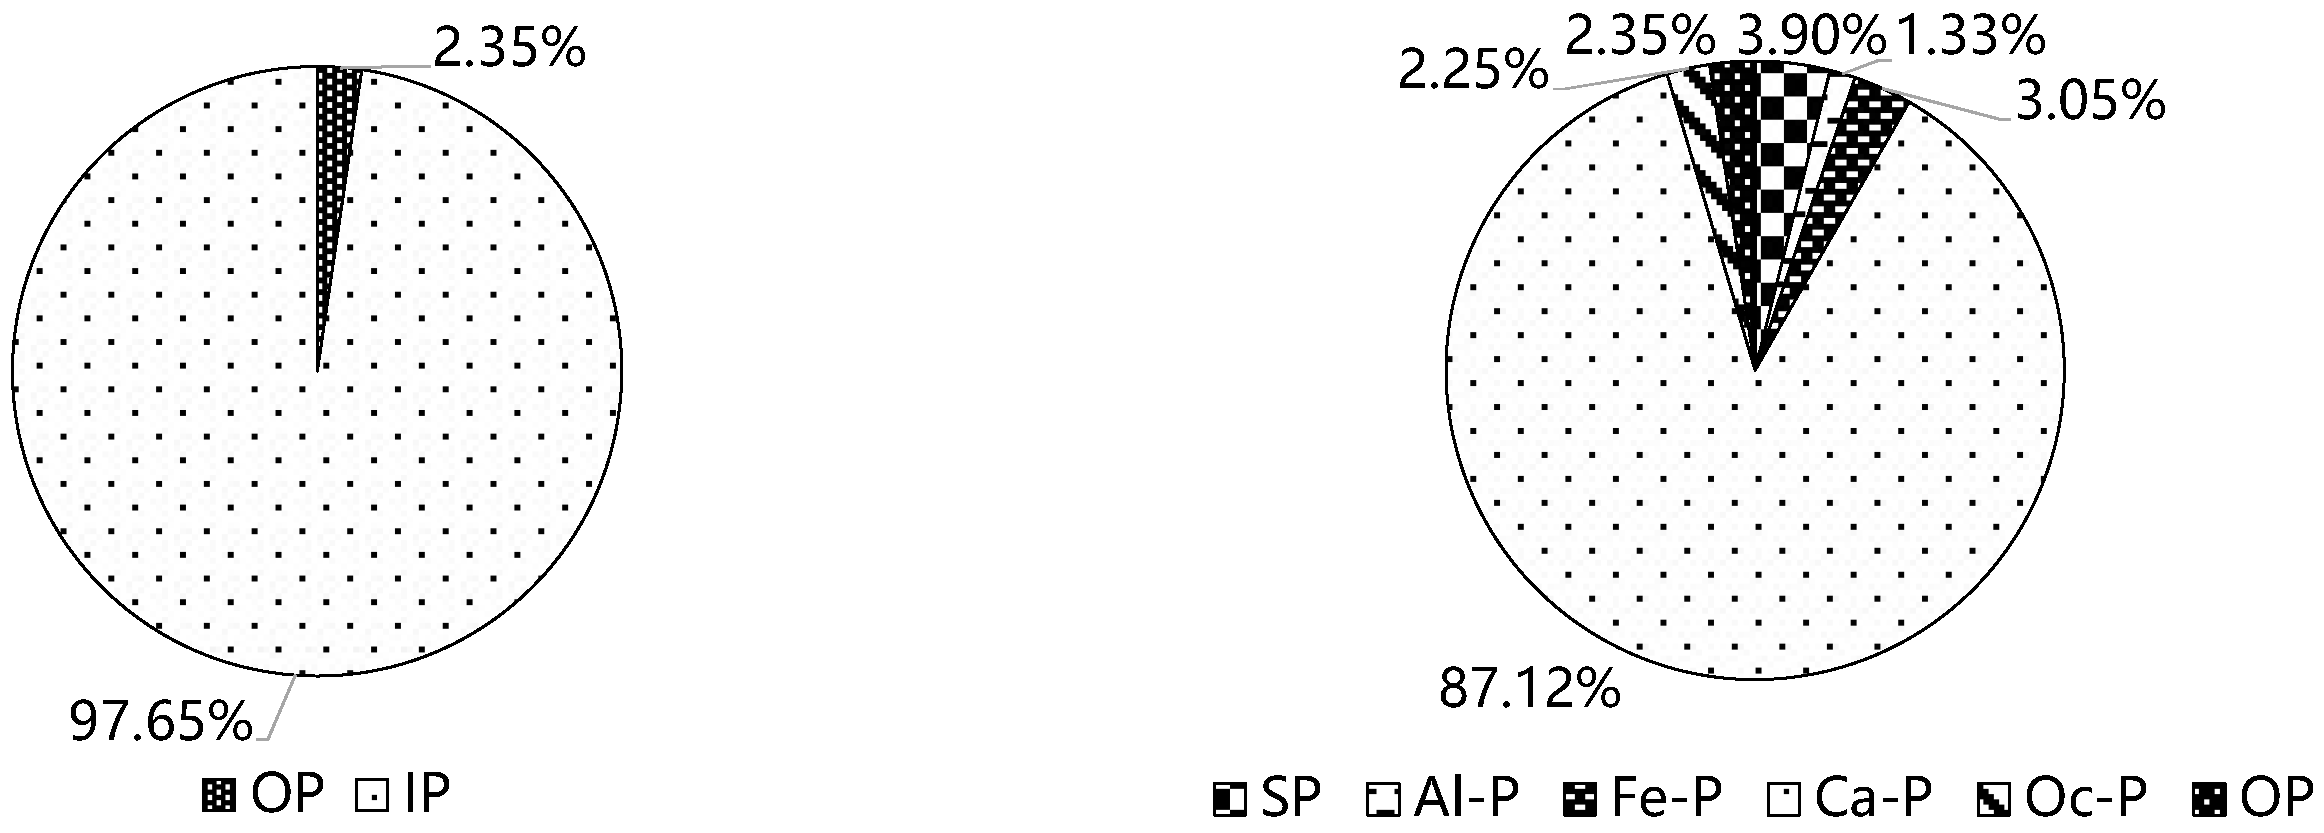
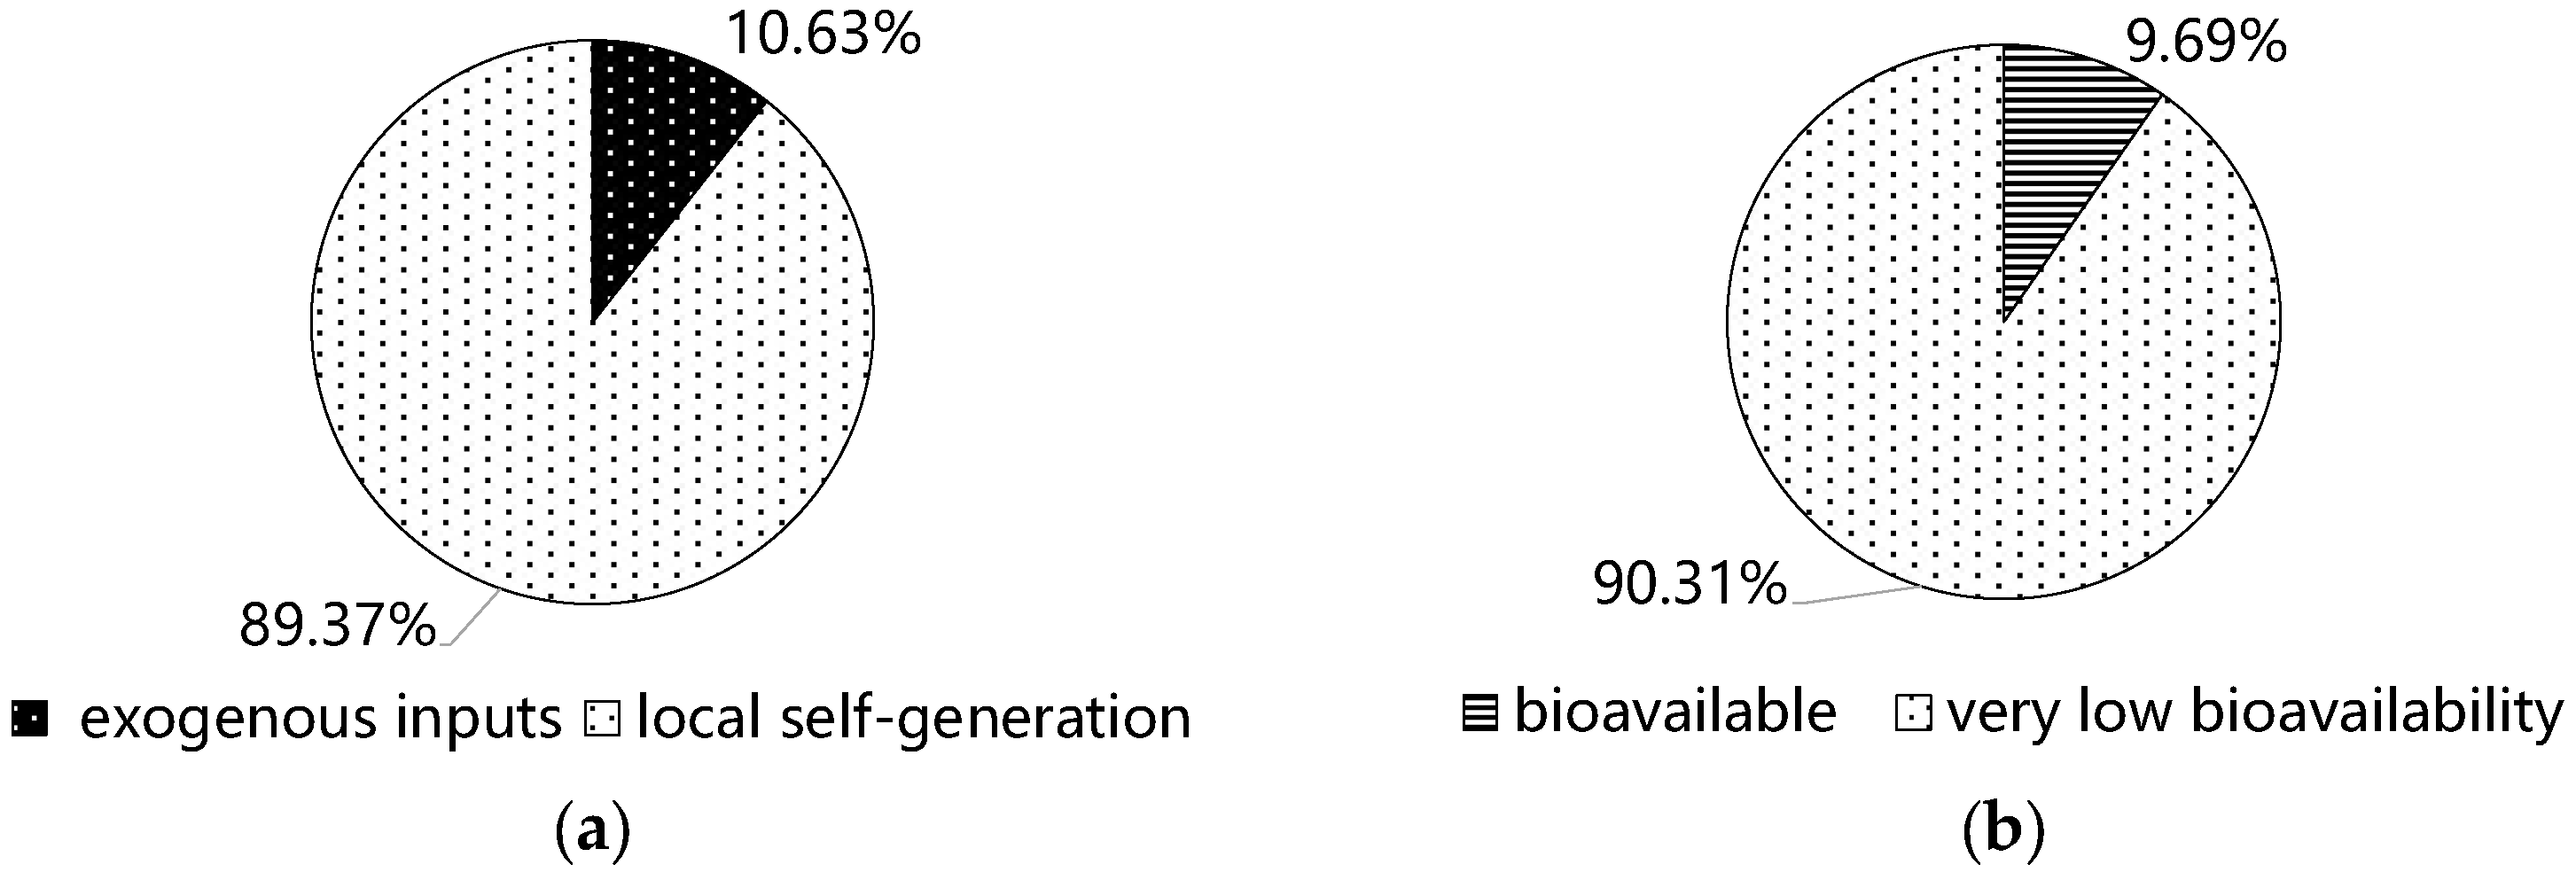
3.4. Proportion of P of Different Source and Bioavailability

As mentioned above, SP, Fe-P, Al-P, and OP, classified in this research, are mainly derived from exogenous inputs. Ca-P and Oc-P are mainly produced locally [9,10,11,12]. Figure 7a shows that the concentration of P of this area is mainly self-generated. The sum of the average concentrations of SP, Fe-P, Al-P, and OP at each sampling site is 43.3 mg/kg, which is only 10.63% of the TP concentration.
On the other hand, SP, Al-P, and Fe-P are considered to be bioavailable P and are easily released into the overlying water for bio-utilization. Sixty percent of the OP also can release into the overlying water [24]. Figure 7b shows the ratio of P concentrations with different bioavailability to the amount of TP. It can be seen from the figure that the concentration of bioavailable P in the surface sediments of the YLZB River basin is low, regardless of the ratio of TP (9.69%) or the absolute concentration (39.6 mg/kg).

3.5. Estimation of P Flux of the Mainstream

In addition to the distribution of P in sediments, the transportation of P in rivers is also a concern [25,26]. Figure 8a,b show the TP concentration in the suspended sediments and the dissolved phosphorus concentration in the water measured at the Lazi Hydrological Station, the Nugesha Hydrological Station, and the Nuxia Hydrological Station in August 2016. The results show that there is no positive correlation between the TP concentration of the suspended sediments and the dissolved phosphorus concentration of the water. The TP concentration of the suspended sediments at the Nugesha Hydrological Station site is the largest compared to the other two sites, while the dissolved phosphorus concentration in the water is the lowest.
The average monthly flow and average silt discharge for the Lazi Hydrological Station, the Nugesha Hydrological Station and the Nuxia Hydrological Station from 2009 to 2013 have been known, as is the TP concentration in the suspended sediments and the dissolved phosphorus concentration in the water for August 2016. This information can be used to calculate the P flux of the water, the P flux of the suspended sediments, and the TP flux of the river of August approximately. The results are shown in Table 2.

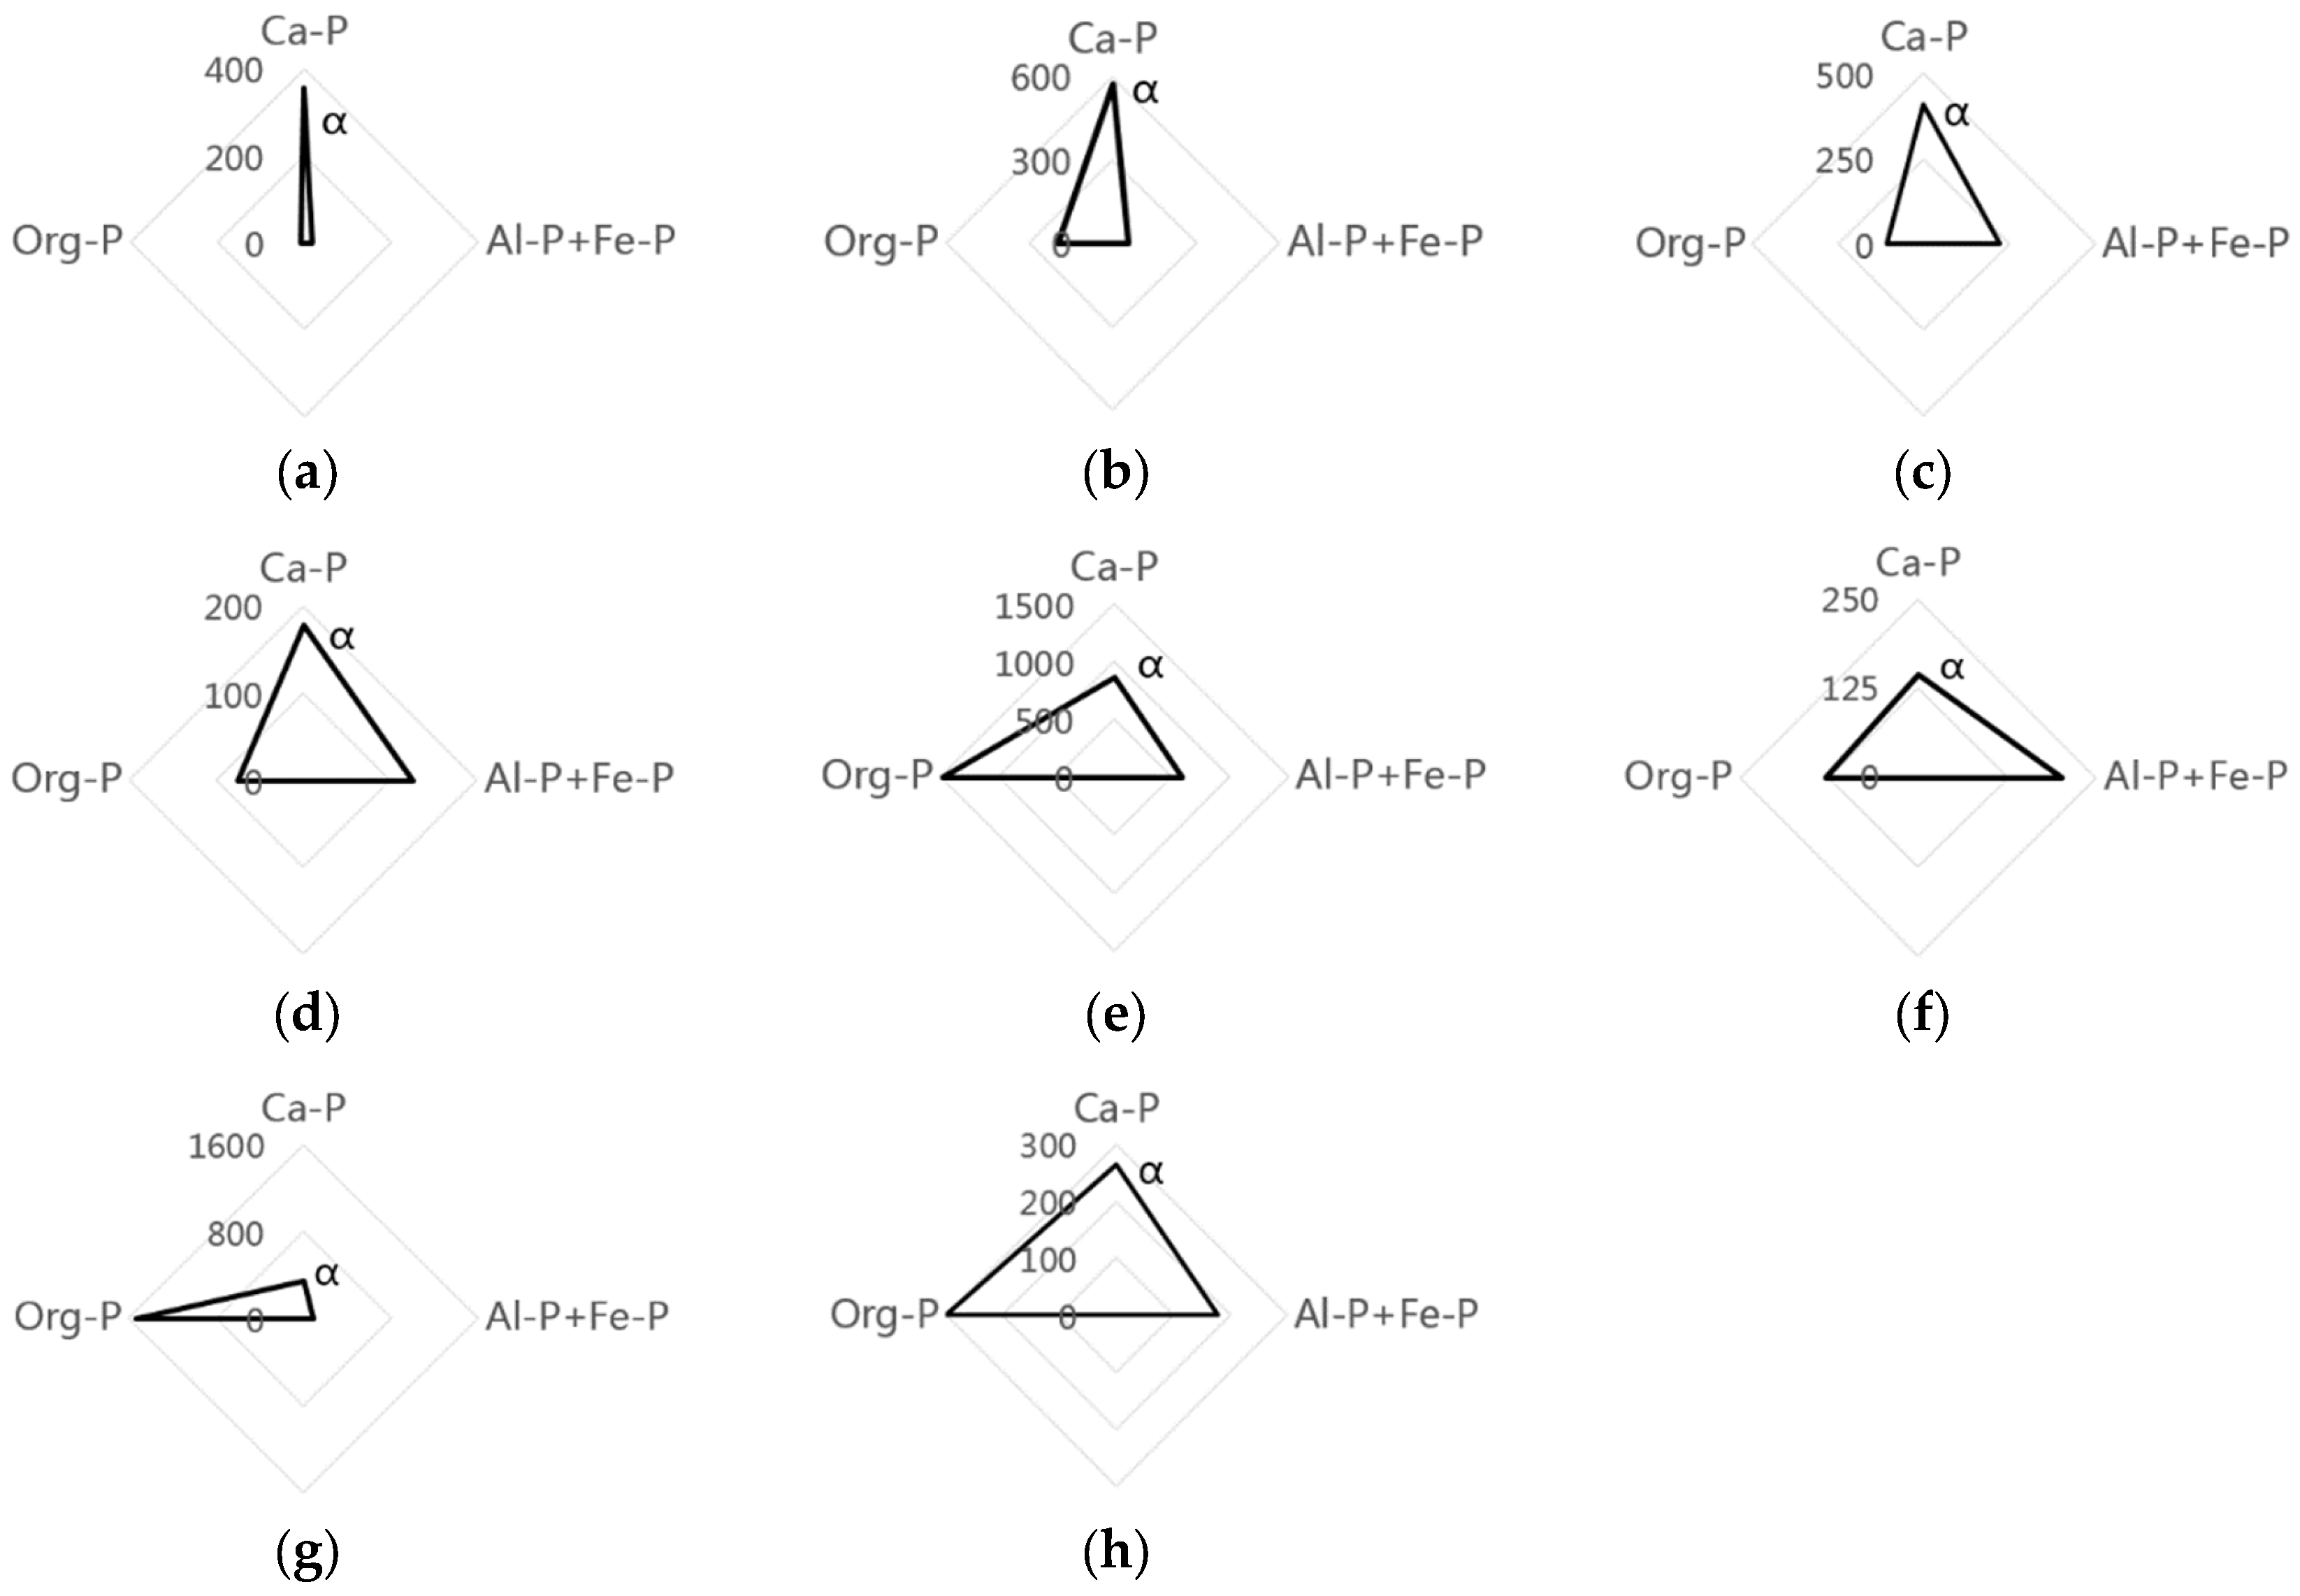
3.6. The “Specific Triangle of P” of This Research Area and Other Research Areas

Figure 9 shows the “specific triangle of P” of different research areas from Southern to Northern China. The types of overlying water bodies are rivers, lakes, or reservoirs, and the data came from publicly published papers [12,27,28,29,30,31,32].

4. Discussion

The P of river systems has been widely researched. Many conclusions have been drawn, but the problem is complex and is influenced by various types of indicators. For different research areas, there are great disparities in fractal P concentration, seasonal and spatial distribution of P in sediments and transportation characteristics of P in the river channel. Environmental settings of the river have a profound effect in these aspects, such as geology, climate, soil types, population, and human activities. It is precisely because of the unique environmental settings of the YLZB River that the P in river systems presents unique characteristics.

4.1. Comparison of Different Forms of P and TP Concentration with Other Rivers

Two different types of rivers were selected for comparison with this river to obtain an intuitive view of how the environmental indicators affect the distribution of P [33,34], as is shown in the Table 3. Land use information of the river basin came from the Chinese Resource and Environment Data Cloud Platform [35]. The dataset about population and GDP came from the 2017 Statistical Yearbook of each province or from public information from the local government [36,37,38]. The Yarlung Zangbo River is a typical plateau river. It flows through the Qinghai-Tibet Plateau, where the vegetation in the basin is mostly grassland, sparsely populated, and the degree of industrialization and urbanization is very low. By the end of 2016, the most developed Lasha in the basin, the regional GDP was only 42.2 billion. The external influences caused by municipal sewage, industrial wastewater, and agricultural non-point source pollution is small. The Minjiang River is an inland river, the middle and low reaches of it is located in Chengdu Plain, and there is a large amount of cultivated land with a large population. The Daliao river systems are composed of two main rivers, the Hunhe River and the Taizi River, of which the basin is concentrated in industrial and mining enterprises. There are many petrochemical enterprises in Liaoyang, and Anshan is a famous steel production base. The two industries both have a negative impact on the natural environment. The TP concentration of this research area ranges from 194.0 to 540.7 mg/kg. The average concentration is 408.2 mg/kg. Both the range of values and the average show that the TP concentration of this area is lower than that of the other two rivers. Fe-P is usually used to reflect the scales of impact of human activities on the environment. The concentration of Fe-P is also very low in this area, which is only 10% of the Fe-P concentration of the Minjiang River and the Daliao river systems.
In addition, the concentration of Ca-P is positively correlated with the TP concentration, and the correlation is good (correlation coefficient R = 0.955). The research on the Daliao river systems has shown that there is a good correlation between Fe-P concentration and TP concentration.

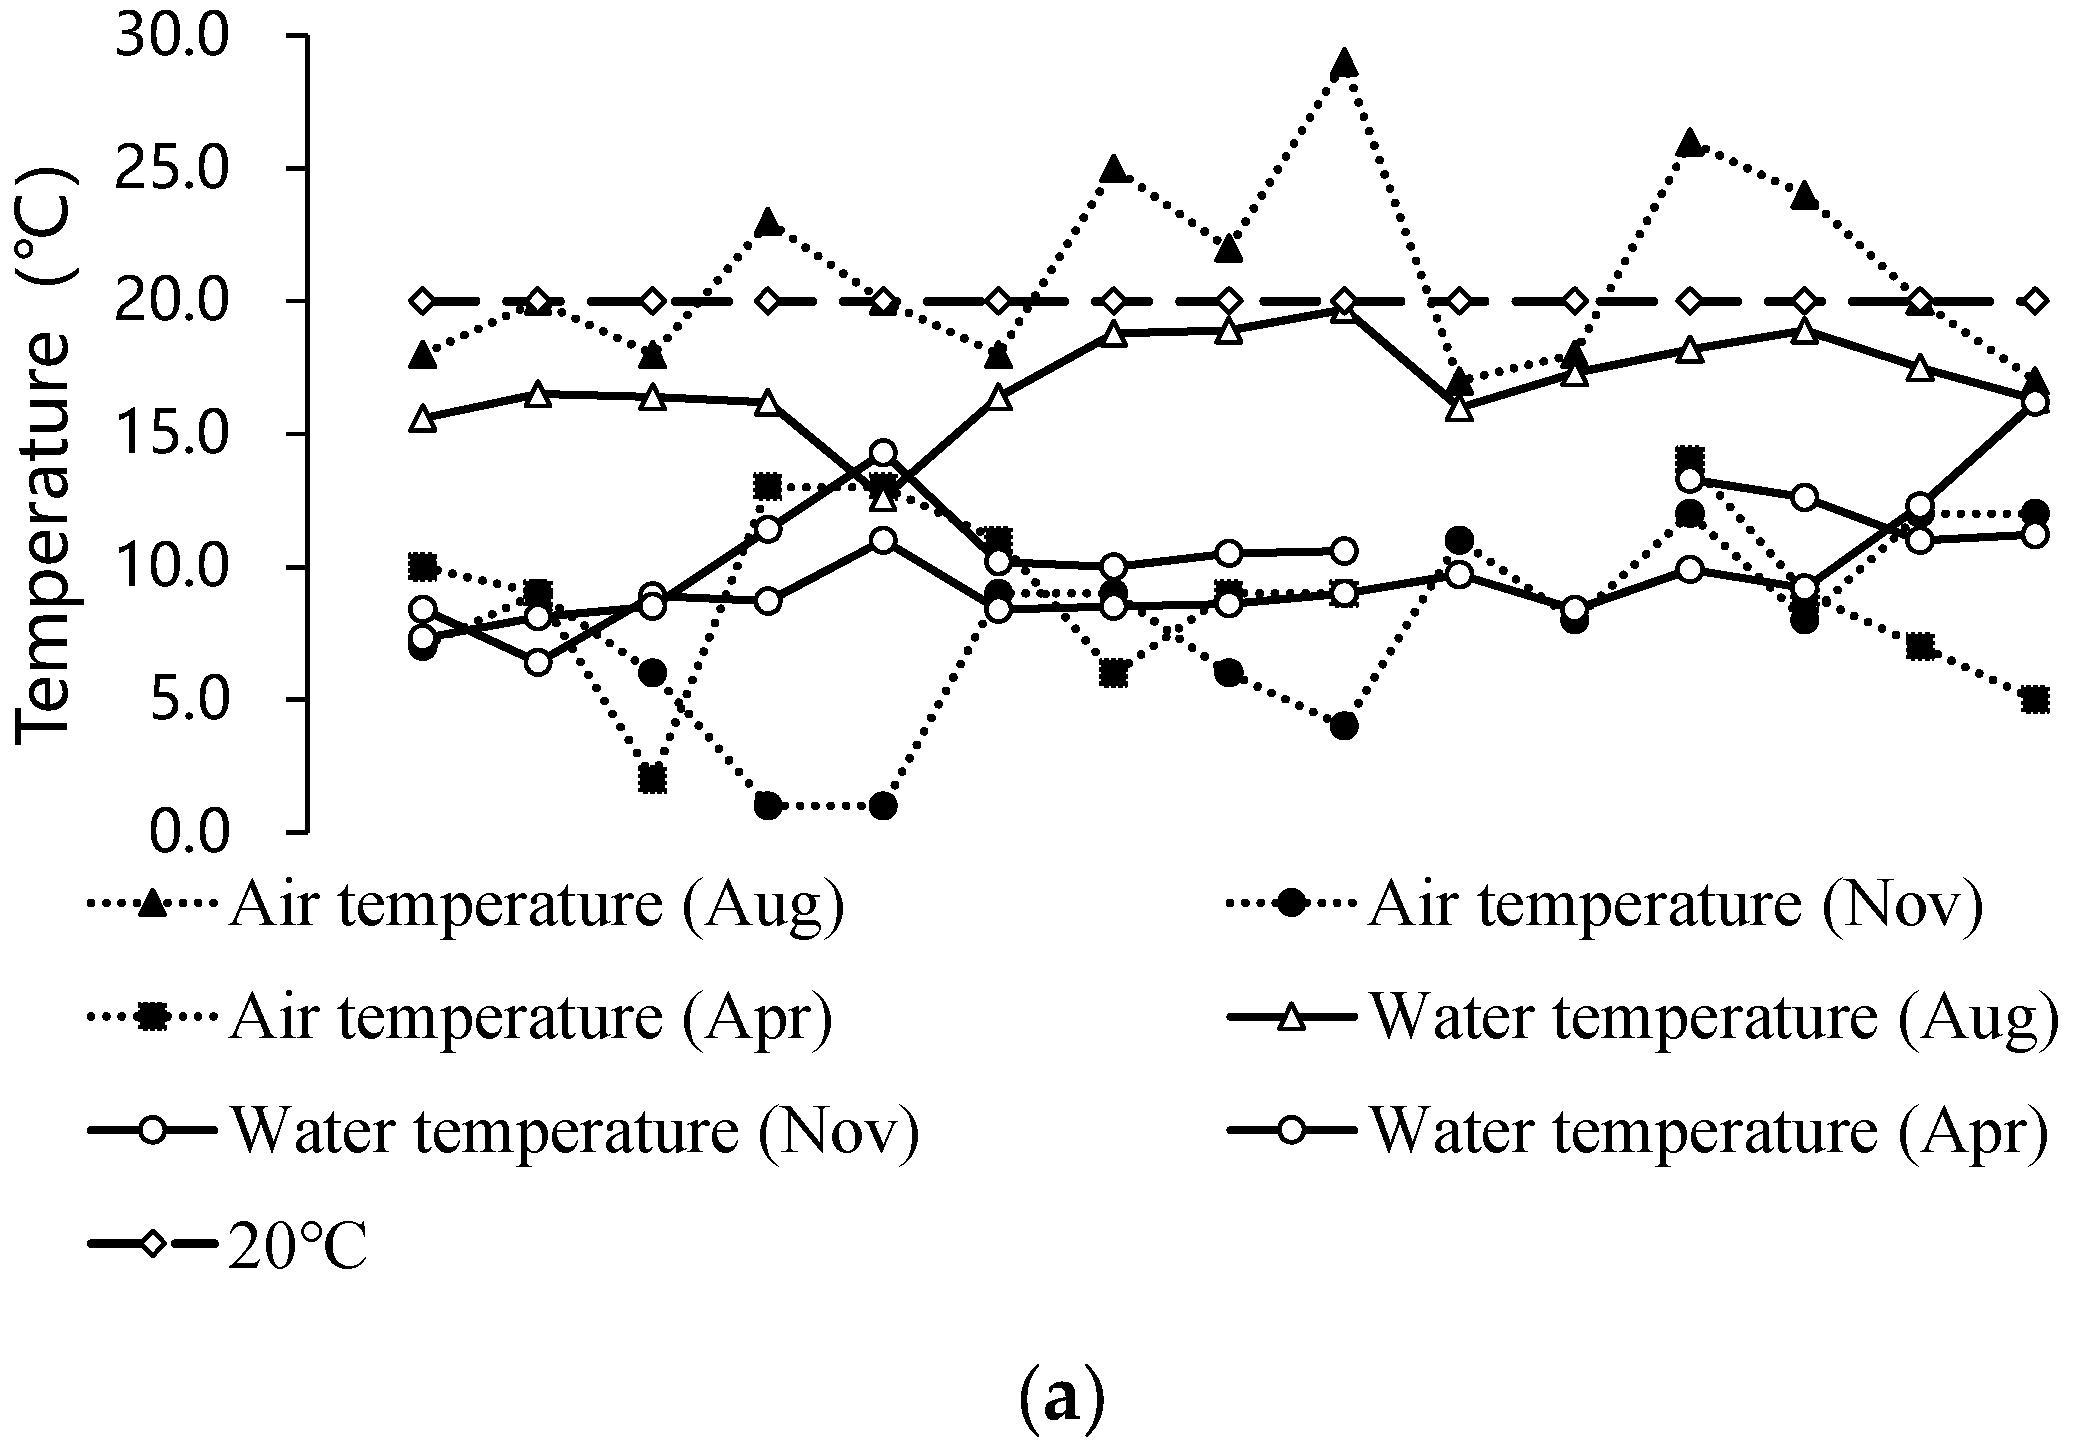
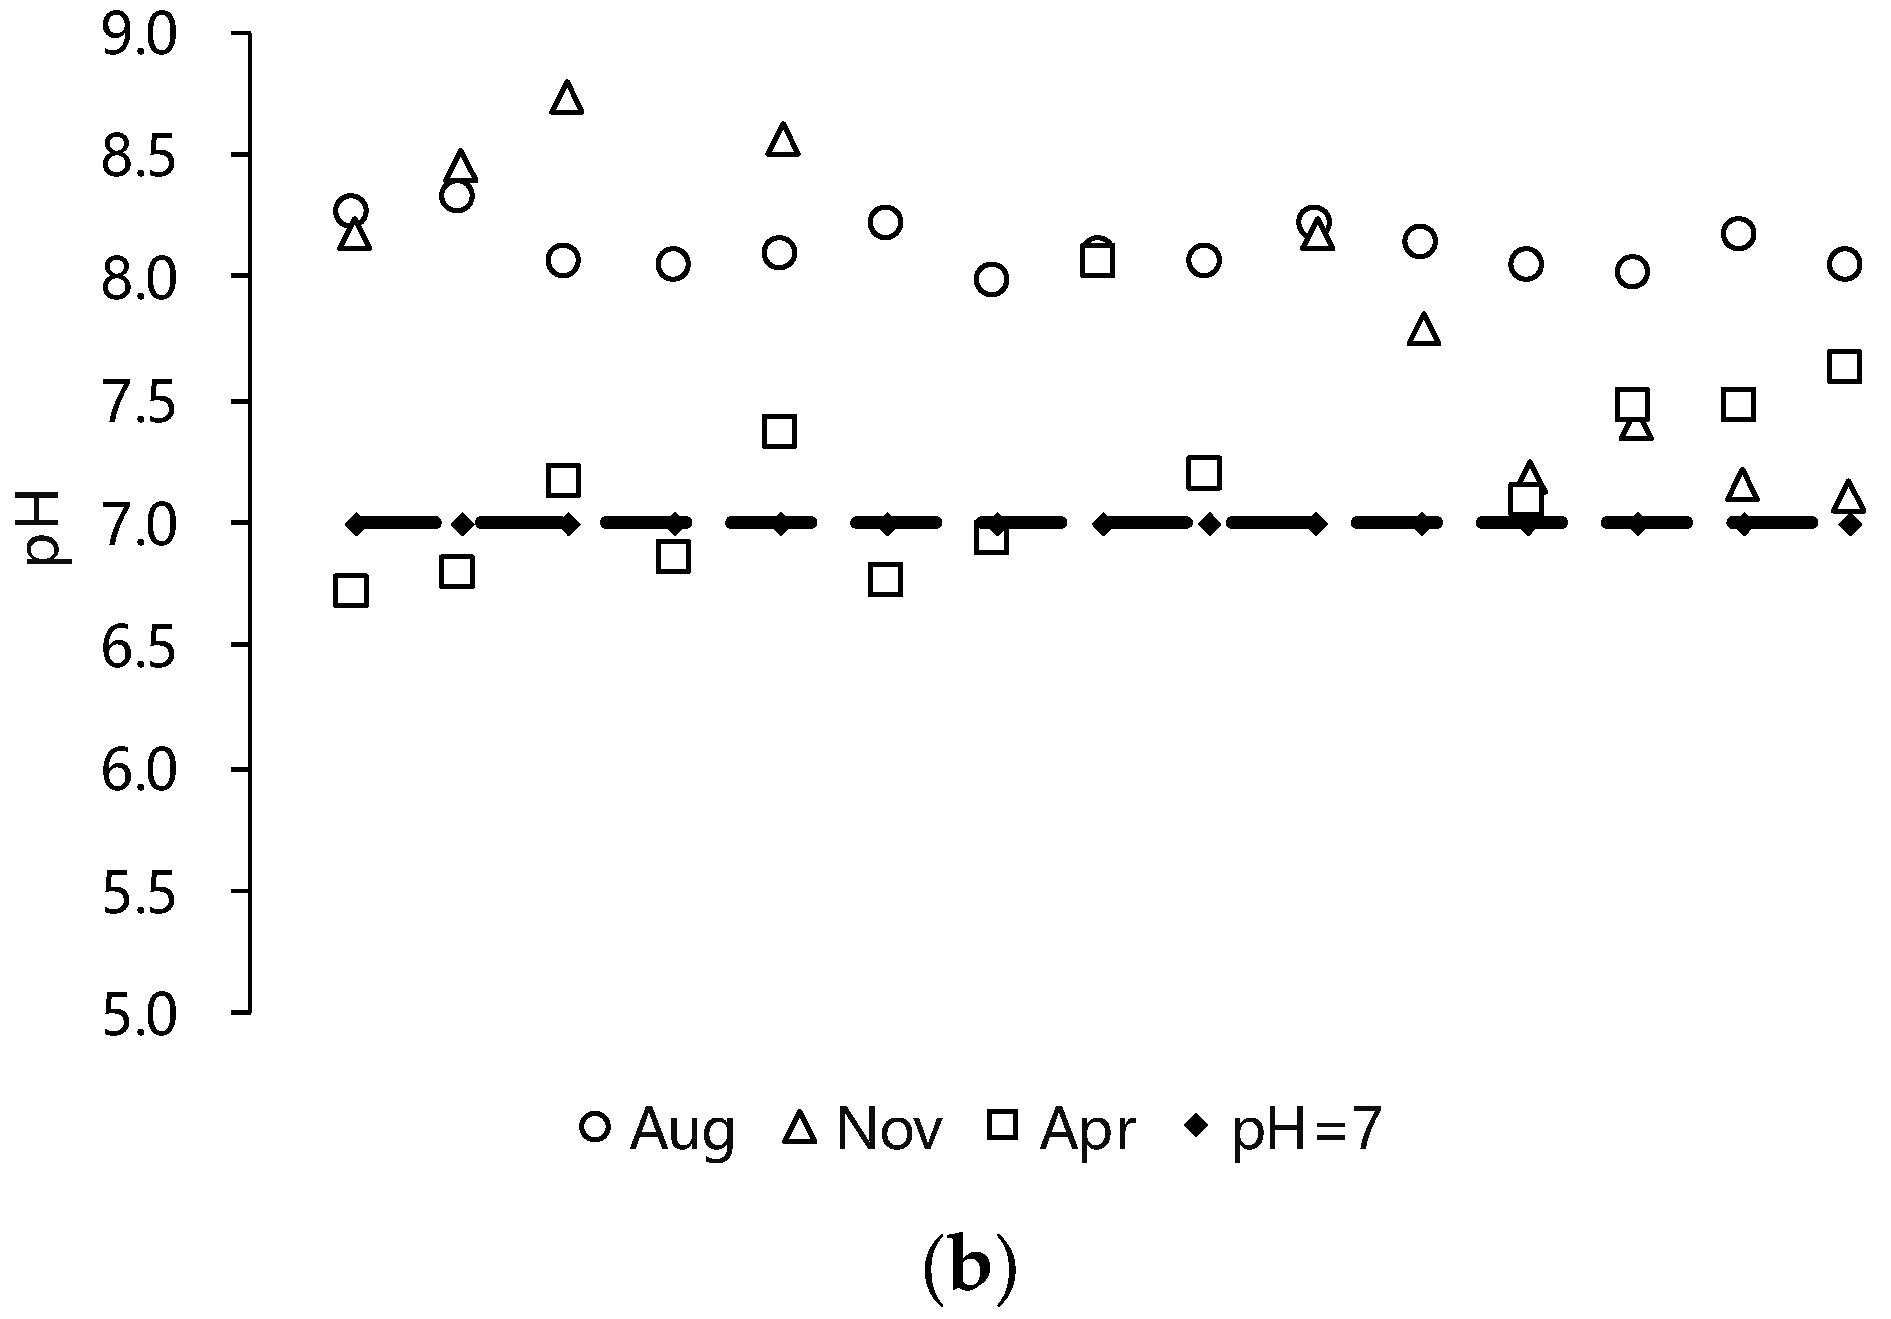
4.2. Influencing Mechanism of Seasonal Distribution

The concentration of SP is lowest in August. For other forms of P, such as Al-P, Fe-P, OP, Ca-P, and TP, the concentration is highest in August. Further evidence for that conclusion can be obtained by examining the position of the median in the boxplot of the entire dataset. Although the statistical analysis of the dataset shows that, except Ca-P, the concentration of other forms of P is fairly discrete. It does not affect the conclusion even if there are several individual points far from the average value. The position of every median of different forms of P clearly indicate their relative magnitude, as is shown in Figure 10 below.
From the previous research, it is clear that the SP is the most easily released and is more bioavailable than other forms of P. In August, the normalized difference vegetation index (NDVI) and net primary productivity (NPP) of the middle reaches of the YLZB River were higher than the levels throughout the rest of that year [39,40]. In August, the types and population density of plants are greater than those in November or April on beaches, shoaly land, and main river troughs. Moreover, SP is one of the main environmental factors that shapes the bacterioplankton community [41]. There is a great possibility that SP is used by phytoplankton or various types of plants for growth, so the concentration of SP in surface sediments is lower in August than in November or April.
In August, the flow of the YLZB River is larger than that in April or November. The water level rises, the beach land is inundated, and the precipitation process is concentrated. A large amount of surface runoff carries pollutants into the water, leading to an increase in the amount of various pollutants in the water. Therefore, P concentration in the water bodies of the YLZB River reaches its maximum in the wet season. This conclusion was verified by actually measuring the P concentration in the water bodies of the YLZB River basin [20]. There is always an exchange of substances between the overlying water and the surface sediments. The exogenous input of P into water bodies leads to an increase in the Fe-P or Al-P and OP concentrations of surface sediments first and then leads to an increase in the concentrations of Ca-P and TP [42]. The final result is in August. The concentrations of Al-P, Fe-P, Ca-P, OP, and even Oc-P were higher than those in November or April, and TP concentration was also the highest in August.

4.3. Influencing Mechanism of Spatial Distribution

As for the spatial distribution characteristics of P in the middle reaches of the YLZB River, there are great disparities in concentrations of different forms of P at different sites, as is shown in Figure 6a. The difference in TP concentration between adjacent sites in the upper part is 30 mg/kg, while the difference in the lower part is relatively large, and the highest reaches as high as 200 mg/kg, indicating that the difference in TP concentration between adjacent sites from the upper part to the lower part gradually becomes larger. The spatial distribution of P is influenced by human activities or the environmental settings of this site [15,21,42]. Every unique P value is discussed below.
Three tributary sites were selected to analyze the influence of inflow and outflow for the spatial distribution of P. The sampling site of the Menqu River has a distance of approximately 3.2 km to the estuary with the mainstream of the YLZB River. The TP concentration at the site is 463.4 mg/kg, which is slightly higher than that of the Nugesha site. The Nugesha site is located upstream of the estuary (the TP concentration is 453.4 mg/kg). The flow is relatively low, and there is a sulfur mine approximately 30 km upstream. This type of mine is generally related to serious industrial pollution. After the Menqu River merges into the YLZB River, the concentrations in the sediments at the Renbu Bridge site in the lower reach are slightly lower than those in the previous site. The Lhasa River flows out from the YLZB River, and the TP concentration of the Qushui County Bridge site, which is located upstream of the estuary, is 419.3 mg/kg. The TP concentration in the sediments of the Lhasa River site is 353.1 mg/kg. Thus, it is lower in comparison to the TP concentration in the sediments in the upper site of the estuary. The Nyang River flows into the YLZB River. The TP concentration at the Nyang River site is lower than that of the two sites upstream and downstream of the estuary. After the Nyang River flows into the mainstream of the YLZB River, the TP concentration of the mainstream site increases sharply. Based on the site survey, the two sampling sites, the Lhasa River site and the Nyang River site, have good vegetation and clear water. As a result, the TP concentration in the sediments is low. In summary, the influence of the tributary flow or the outflow on the TP concentration in the sediments of the mainstream is not fixed.
The widest part of the YLZB River was also the site with the lowest TP concentration at all sampling sites. The vegetation is good near the sampling site, and there are shrubs. In addition, the river is wide and shallow, and the river water flowing through the unit width is lower than that at other sites. The probability of exchange between the overlying water and sediments is lower, and the TP concentration of this section is lower than the TP concentration of all other sites.
The highest SP concentration and Fe-P concentration appeared at this site in the YLZB River mainstream, and the concentration of SP and Fe-P in the sediments of this site reached 47.8 and 55.1 mg/kg, respectively. This sampling site is located along the right bank, and there is an agricultural planting area present. A flood levee has been built on the left bank. For the right bank sediments, pesticide or fertilizer application and flooding in the agricultural planting area resulted in high concentrations of SP and Fe-P.

4.4. Release and Increased Risk of Different Forms of P

The release of P from sediments to overlying water is affected by multiple factors. If P in the sediments is largely released into overlying water, it will bring danger to aquatic systems. Temperature and pH of the overlying water was surveyed while taking samples. The data of these factors can be used to analyze the release risk of different forms of P.
Figure 11a shows the temperature indices for each sample in August 2016, November 2016, and April 2017. The relationship between P release and temperature has been studied by many scholars. As temperature increases, a greater concentration of P can be released into the water, and equilibrium concentration can be reached faster [17]. At 30 °C, the equilibrium concentration of P released from sediments in the overlying water is 3.3 times and 6.2 times higher at 20 and 10 °C, respectively. According to the data, the average temperature of the YLZB River basin is 13 °C. During August 2016, from the 11th to the 15th day, the temperature in the YLZB River basin is relatively high, but from the site survey it was seen that the maximum water temperature did not exceed 20 °C. This results from the high altitude of the Qinghai-Tibet Plateau. In summary, the water temperature in the YLZB River is generally low, and the water temperature will not be a major factor that causes the release of P in the surface sediments of the YLZB River basin.
Figure 11b shows that, in August 2016, the pH value of each sampling site in the water body was between 7.98 and 8.31. In November 2016, the pH value of each sampling site was between 7.11 and 9.20, which indicated weak alkalinity. In April 2017, the pH of each sampling site in the water body was between 6.71 and 8.06; overall, the sites were close to neutral, although some sites were weakly alkaline, and some were weakly acidic. According to previous research, a high pH promotes the release of NaOH-P, and a low pH promotes the release of HCl-P [15]. Under neutral conditions, the release of P is the lowest in the sediments [16,17]. Similarly, in this study, Fe-P was extracted under alkaline conditions, SP and Al-P were extracted under neutral conditions, and Ca-P was extracted under acidic conditions. The average value of each site (355.6 mg/kg) is much larger than the average value of Fe-P, SP, and Al-P at each site (12.4, 15.9, and 5.4 mg/kg, respectively). If the overlying water presents weak alkalinity and neutral conditions, the Ca-P, which is a dominant portion of the P concentration in the research area, is difficult to release. Moreover, the Fe-P, SP, and Al-P are relatively easily released, but their concentrations are relatively low. If the overlying water body is weakly acidic, Ca-P may be released. It can be seen from the figure that, in April 2017, some of the upper sites in the research area were weakly acidic, and the TP concentration in the water body was higher than that in August 2016. It can be inferred that the P desorption from sediments during the dry season is greater than the adsorption. However, because the overlying water body is weakly acidic, the number of sections is small and only appears in the dry season. Therefore, in the case of the YLZB River, P in the sediments will not be released in large quantities if the overall pH value does not drastically change.
The sediments can not only be the “source” and release P to overlying water, but also could be the “sink” and adsorb P from overlying water. Some samples were chosen and their concentrations of Ca, Al, and Fe were tested, as is shown in Figure 12. Previous research indicated that Al and Fe oxides show a very strong affinity to P [34]. In this area, the concentration of Ca is lower than that of Al and Fe. Aluminum oxides and iron oxides may exist in large amounts. Extraneous P from human activities will bound aluminum oxides and iron oxides, making sediments become the “sink” of P.
In summary, from the ratio of the TP to the absolute concentration, the concentration of bioavailable P in the surface sediments of the YLZB River basin is relatively low. By analyzing and judging the physical and chemical factors of each sampling site at a specific time, it was concluded that P in the surface sediments of the YLZB River basin will not be released in large quantities under current climatic conditions, water quality conditions, or hydrological conditions. On the other hand, if there are large amounts of P input, P concentration in the sediments could increase massively.

4.5. Transportation Characteristics of P

The transportation of P in the river mainly depends on the water, and only a small part depends on the suspended sediments in the YLZB River. In August, the P flux of suspended sediments (Ls) accounted for the total P flux (Lt) of the river: The Lazi Hydrological Station was 1.46%, the Nugesha Hydrological Station was 8.1%, and the Nuxia Hydrological Station was only 0.22%. This result is in contrast to the conclusion that the particulate P flux accounts for the vast majority of a river’s total flux in most of the world’s rivers. In most of the world’s large rivers, Ls/Lt exceeds 80–90%, and the Ls/Lt of the Amazon, Yangtze, and Yellow River is even greater than 90% [21]. These rivers have a high suspended sediment transport rate. In contrast, the suspended sediment transport rate of the YLZB River is extremely low and its water is extremely clear.
Lt increases from the upstream reaches to the downstream reaches. According to the estimation, in August, the Lt of the Lazi Hydrological Station was 22.92 kg/s, the Nugesha Hydrological Station was 59.20 kg/s, and the Nuxia Hydrological Station was 203.44 kg/s. The dissolved P in the river water, the suspended sediment transport rate, and the TP concentration of suspended sediments do not make great changes from the upstream reaches to the downstream reaches, but flow largely increases. The reason why Lt increases from the upstream reaches to the downstream reaches is the greatly increasing flow.
The analysis used August as an example to determine the transportation characteristics of P of this area. Due to the decreases in flow rate and silt discharge, according to the data, in April and November, the Lt at each hydrological station was less than that in August, and the Lt in August was 7.3 times that of April and 4.9 times that of November approximately. The wet season has an absolute advantage in the value of Lt than the normal and dry season. The P in this area was mainly transported in the wet season.

4.6. The “Specific Triangle of P” of Different Water Bodies in China

“α” of various kinds of water bodies were calculated and exhibited in the Table 4 with the corresponding of water quality or Nutrient condition. According to the 2017 Report on the State of the Environment in China, which was issued by the Ministry of Ecology and Environment of the People’s Republic of China and the Yangtze River Water Resources Bulletin [43,44], the water quality of the southwestern rivers, including the YLZB River, is excellent. The water quality of the Zhe-Min Zone (including the Luoyang River of Quanzhou Bay) is good (shows slight pollution), and the water quality in the mainstream of the Yangtze River is excellent. The trophic status index of the selected lake-type water bodies is shown in the report. It ranks from high to low as follows: Dianchi Lake, Taihu Lake, Chaohu Lake, Erhai Lake, and the Miyun Reservoir. Dianchi Lake is defined as moderately eutrophic, and Taihu Lake and Chaohu Lake are defined as mildly eutrophic. Erhai Lake and the Miyun Reservoir are defined as having a medium level of nutrients. The rank of nutrition degree set by the trophic status index in the report for these lakes is similar to the conclusion obtained by the visual judgement of the “α” angle, indicating that it is feasible to judge the water quality or nutrient condition of the overlying water based on the “α” angle. As the “α” angle approaches 0°, the Ca-P concentration is far greater than Al-P + Fe-P and OP concentration, the research area is more natural, and there is a lower level of interference caused by human factors. If the “α” angle approaches 90° or more, there is more external input of P into the surface sediments. The interference with human factors in this area increases, and the overlying water has a greater possibility of serious eutrophication.
Notably, the final shape of the “specific triangle of P” is related to the relative values of the different forms of P but has little relationship with the TP concentration. For the research area without data on the TP in the surface sediments or any other nutrient-related data, it is simple and effective to use the “α” angle to quickly judge the eutrophication risk of the overlying water. This method is also applicable to the analysis of P forms in other methods. The sum of Al-P and Fe-P in this research corresponds to NaOH-P, and Ca-P in this research corresponds to HCl-P in the SMT protocol [7,8] (which was proposed in the frame of the European Programme, Standards, Measurements and Testing of the European Commission, which was hereafter referred to as SMT protocol), respectively. This “specific triangle” can also be used to judge the eco-health of the overlying water if the SMT protocol is chosen to study the morphology of P.

5. Conclusions

In this paper, different forms of P concentrations in the surface sediments of the YLZB River basin were tested. Basic data related to P of this area have been obtained. Because of the unique environmental settings of the YLZB River basin, the distribution and transportation characteristics of P are also unique. The following conclusions have been obtained through this research:
(1)
Forms of P in the YLZB River basin were classified as Ca-P, SP, Fe-P, OP, Oc-P, and Al-P. Ca-P concentration accounts for 89.21% of the IP concentration, while IP concentration accounts for 97.65% of the TP concentration.
(2)
As for seasonal distribution, the concentration of P in the surface sediments of the YLZB River basin is generally higher in the wet season than in the normal and dry seasons. The average concentrations of Al-P, Fe-P, Ca-P, and Oc-P and OP, including IP and TP, are greater in the wet season than in the normal and dry season.
(3)
From the perspective of spatial distribution, there is no uniform distribution of P concentrations and TP concentrations in the surface sediments of the YLZB River basin. The sampling sites varied according to specific situations. From the upper part of the study section to the lower part, the degree of otherness between adjacent sites became larger.
(4)
By comparing the results of previous studies, P in the YLZB River basin is mainly self-generated, and the amount of exogenous P input is small. Moreover, the bioavailable P concentration in the surface sediments of the YLZB River is low. Under the current climatic conditions, water quality conditions, and hydrological conditions, the release of endogenous P will not become a main factor affecting the water quality of the YLZB River.
(5)
In the absence of measured data, the “α” angle of the “specific triangle of “P” can be used to determine the degree of eutrophication of the overlying water conveniently for a single research area.
(6)
According to the estimation, the P flux of the river water (Lw), the P flux of the suspended sediments (Ls), and the TP flux of the mainstream (Lt) were obtained. The flux value increases from the upstream region to the downstream region, and Lt in the mainstream is largest in the wet season, indicating that the P in this area is mainly transported in the wet season. P in the YLZB River is mainly transported by river water, not by suspended sediments.
This paper focuses on the spatial and seasonal distribution of different forms of P in the surface sediments of the middle reaches of the YLZB River basin. The research results have an important guiding role in judging the ecological and environmental health level of the plateau river basin. In the future, it may be valuable to study the release law of P in this research area.

Supplementary Materials

Supplementary File 1

Author Contributions

X.C., R.L., J.L., R.A., Y.H., and X.P. conceived and designed the research; R.A. took the samples; Y.H., X.P., W.H. and W.W. helped to test the samples; X.C. performed the data analysis and manuscript writing. All authors read and approved the manuscript.

Funding

This research was funded by the National Natural Science Foundation of China, grant number 91547211, and the Key and special project of science and technology of Sichuan Province, grant number 19ZDZX0033.

Conflicts of Interest

The authors declare no conflict of interest.

References

  1. Wang, L.; Liang, T. Distribution patterns and dynamics of phosphorus forms in the overlying water and sediment of Dongting Lake. J. Great Lakes Res. 2016, 42, 565–570. [Google Scholar] [CrossRef] [Green Version]
  2. Elrashidi, M.A.; West, L.T.; Persaud, N. Phosphorus Loss and Forms in Runoff from Watersheds in the Great Plains. Soil Sci. 2012, 177, 638–649. [Google Scholar] [CrossRef]
  3. Agudelo, S.C.; Nelson, N.O.; Barnes, P.L.; Keane, T.D.; Pierzynski, G.M. Phosphorus adsorption and desorption potential of stream sediments and field soils in agricultural watersheds. J. Environ. Qual. 2011, 40, 144–152. [Google Scholar] [CrossRef] [PubMed]
  4. Guedes, R.S.; Melo, L.C.A.; Vergütz, L.; Rodríguez-Vila, A.; Covelo, E.F.; Fernandes, A.R. Adsorption and desorption kinetics and phosphorus hysteresis in highly weathered soil by stirred flow chamber experiments. Soil Tillage Res. 2016, 162, 46–54. [Google Scholar] [CrossRef]
  5. Jin, X.; Tu, Q. The Standard Methods in Lake Eutrophication Investigation, 2nd ed.; China Environmental Science Press: Beijing, China, 1990. (In Chinese) [Google Scholar]
  6. Ruttenberg, K.C. Development of a sequential extraction method for different forms of phosphorus in marine sediments. Limnol. Oceanogr. 1992, 37, 1460–1482. [Google Scholar] [CrossRef] [Green Version]
  7. Ruban, V.; López-Sánchez, J.F.; Pardo, P.; Rauret, G.; Muntau, H.; Quevauviller, P. Selection and evaluation of sequential extraction procedures for the determination of phosphorus forms in lake sediment. J. Environ. Monit. 1999, 1, 51–56. [Google Scholar] [CrossRef] [PubMed]
  8. Ruban, V.; López-Sánchez, J.F.; Pardo, P.; Rauret, G.; Muntau, H.; Quevauviller, P. Development of a harmonised phosphorus extraction procedure and certification of a sediment reference material. J. Environ. Monit. 2001, 3, 121–125. [Google Scholar] [CrossRef]
  9. Ma, X.; Li, Y.; Zhang, M.; Zheng, F.; Du, S. Assessment and analysis of non-point source nitrogen and phosphorus loads in the Three Gorges Reservoir Area of Hubei Province, China. Sci. Total Environ. 2011, 412, 154–161. [Google Scholar] [CrossRef]
  10. Zhang, W.; White, J.R.; DeLaune, R.D. Diverted Mississippi River sediment as a potential phosphorus source affecting coastal Louisiana water quality. J. Freshw. Ecol. 2012, 27, 575–586. [Google Scholar] [CrossRef] [Green Version]
  11. Xiang, S.; Zhou, W. Phosphorus forms and distribution in the sediments of Poyang Lake, China. Int. J. Sediment Res. 2011, 26, 230–238. [Google Scholar] [CrossRef]
  12. Zhang, L.; Fan, C.X.; Chi, Q.Q.; Wang, J.J.; Qin, B.Q. Phosphorus species distribution of sediments in Lake Taihu and its main inflow rivers. Geochimica 2004, 33, 423–432, (In Chinese with English Abstract). [Google Scholar]
  13. CadeMenun, B.J. Characterization of organic phosphorus form and bioavailability in lake sediments using 31P NMR and enzymatic hydrolysis. J. Environ. Qual. 2015, 44, 882. [Google Scholar]
  14. Bastami, K.D.; Neyestani, M.R.; Raeisi, H.; Shafeian, E.; Baniamam, M.; Shirzadi, A.; Esmaeilzadeh, M.; Mozaffari, S.; Shahrokhi, B. Bioavailability and geochemical speciation of phosphorus in surface sediments of the Southern Caspian Sea. Mar. Pollut. Bull. 2018, 126, 51–57. [Google Scholar] [CrossRef] [PubMed]
  15. Jin, X.; Wang, S.; Pang, Y.; Wu, F.C. Phosphorus fractions and the effect of pH on the phosphorus release of the sediments from different trophic areas in Taihu Lake, China. Environ. Poll. 2006, 139, 288–295. [Google Scholar] [CrossRef] [PubMed]
  16. Wu, Y.; Wen, Y.; Zhou, J.; Wu, Y. Phosphorus release from lake sediments: Effects of pH, temperature and dissolved oxygen. Ksce J. Civ. Eng. 2014, 18, 323–329. [Google Scholar] [CrossRef]
  17. Sun, S.J. Simulated Experiment of Phosphorus Release from Haihe River Sediment. Res. Environ. Sci. 2008, 21, 126–131. [Google Scholar]
  18. Wang, G.; Liu, G.; Liu, L. Spatial scale effect on seasonal streamflows in permafrost catchments on the Qinghai-Tibet Plateau. Hydrol. Process. 2012, 26, 973–984. [Google Scholar] [CrossRef]
  19. Liu, J.; Zhang, W.; Liu, T.; Li, Q. Runoff Dynamics and Associated Multi-Scale Responses to Climate Changes in the Middle Reach of the Yarlung Zangbo River Basin, China. Water 2018, 10, 295. [Google Scholar] [CrossRef]
  20. Nan, S.; Li, J.; Zhang, L.; An, R.; Pu, X.; Huang, W. Distribution Characteristics of Phosphorus in the Yarlung Zangbo River Basin. Water 2018, 10, 913. [Google Scholar] [CrossRef]
  21. Zhou, J.; Zhang, M.; Li, Z. Dams altered Yangtze River phosphorus and restoration countermeasures. J. Lake Sci. 2018, 30, 865–880. [Google Scholar]
  22. Bai, X.; Ding, S.; Fan, C.; Liu, T.; Shi, D.; Zhang, L. Organic phosphorus species in surface sediments of a large, shallow, eutrophic lake, Lake Taihu, China. Environ. Pollut. 2009, 157, 2507–2513. [Google Scholar] [CrossRef] [PubMed]
  23. Nowlin, W.H.; Evarts, J.L.; Vanni, M.J. Release rates and potential fates of nitrogen and phosphorus from sediments in a eutrophic reservoir. Freshw. Biol. 2010, 50, 301–322. [Google Scholar] [CrossRef]
  24. Rydin, E. Potentially mobile phosphorus in Lake Erken sediment. Water Res. 2000, 34, 2037–2042. [Google Scholar] [CrossRef]
  25. Martha, S.; Bianchi, T.S.; Mckee, B.A. Effect of seasonal sediment storage in the lower Mississippi River on the flux of reactive particulate phosphorus to the Gulf of Mexico. Limnol. Oceanogr. 2004, 49, 2223–2235. [Google Scholar] [Green Version]
  26. Garnier, J.; Nemery, J.; Billen, G.; Théry, S. Nutrient dynamics and control of eutrophication in the Marne River system: Modelling the role of exchangeable phosphorus. J. Hydrol. 2005, 304, 397–412. [Google Scholar] [CrossRef]
  27. Liu, L.Y.; Gao, X.J.; Chen, Z.M.; Song, Z.G. Distribution and Forms of Phosphorus in Intertidal Sediments of the Yangtze Estuary. J. Fudan Univ. (Nat. Sci.) 2005, 44, 1033–1036, (In Chinese with English Abstract). [Google Scholar]
  28. Liu, L.; Liu, X.D.; Xu, Q.; Ge, X.L.; Wang, Y.H. Phosphorous Species and Their Distribution Characters in Sediments of Miyun Reservoir. Rock Min. Anal. 2003, 22, 81–85, (In Chinese with English Abstract). [Google Scholar]
  29. Yuan, D.L.; Hu, G.R.; Yu, R.L. Distribution of phosphorus forms in sediments of Luoyang Estuary, Quanzhou Bay. Chin. J. Ecol. 2010, 29, 84–90, (In Chinese with English Abstract). [Google Scholar]
  30. He, J.; Chen, C.; Deng, W.; Xu, X.; Wang, S.; Liu, W.; Wu, X.; Wang, L. Distribution and release characteristics of phosphorus in water-sediment interface of Lake Dianchi. J. Lake Sci. 2015, 27, 799–810. [Google Scholar] [Green Version]
  31. Wen, S.F.; Shan, B.Q.; Zhang, H. Spatial Distribution Character of Phosphorus Fractions in Surface Sediment from Chaohu Lake. Environ. Sci. 2012, 33, 2322–2329, (In Chinese with English Abstract). [Google Scholar]
  32. Zhao, H.C.; Wang, S.R.; Jiao, L.X.; Huang, D. Characteristics of temporal and spatial distribution of the nitrogen forms in the sediments of Erhai Lake. Res. Environ. Sci. 2013, 26, 235–242, (In Chinese with English Abstract). [Google Scholar]
  33. Yang, G.; Qin, Y.W.; Han, C.N.; Ma, Y.Q.; Liu, Z.C.; Yang, C.C. Distribution of Phosphorus Fractions in Surface Sediments of Minjiang Mainstreams. Environ. Sci. 2018, 39, 2165–2173, (In Chinese with English Abstract). [Google Scholar]
  34. Lin, C.; Wang, Z.; He, M.; Li, Y.; Liu, R.; Yang, Z. Phosphorus sorption and fraction characteristics in the upper, middle and low reach sediments of the Daliao river systems, China. J. Hazard. Mater. 2009, 170, 278–285. [Google Scholar] [CrossRef] [PubMed]
  35. 2015 China Land Use Status Remote Sensing Monitoring Database. Available online: http://www.resdc.cn/data.aspx?DATAID=184 (accessed on 1 October 2018).
  36. Knowledge about Tibet. Available online: http://www.xizang.gov.cn/ (accessed on 1 October 2018).
  37. Sichuan Statistical Yearbook. 2017. Available online: http://www.sc.stats.gov.cn/tjcbw/tjnj/2017/zk/indexch.htm (accessed on 1 October 2018).
  38. Zhejiang Statistical Yearbook. 2017. Available online: http://zjjcmspublic.oss-cn-hangzhou.aliyuncs.com/jcms_files/jcms1/web3077/site/flash/-1/2017%E7%BB%9F%E8%AE%A1%E5%B9%B4%E9%89%B4%E5%85%89%E7%9B%98%E6%94%B9%E5%90%8E20180709/indexch.htm (accessed on 1 October 2018).
  39. Zhao, L. Spatio-Temporal Patterns of the Vegetation Greenness Period and Net Primary Productivity and Their Responses to Climate Change in the Middle and Lower Reaches of Yarlung Zangbo River; East China Normal University: Shanghai, China, 2011. [Google Scholar]
  40. Lv, Y.; Dong, G.; Yang, S.; Zhou, Q.; Cai, M. Spatio-temporal variation in NDVI in the Yarlung Zangbo River basin and its relationship with precipitation and elevation. Resour. Sci. 2014, 36, 603–611. [Google Scholar]
  41. Wang, P.; Wang, X.; Wang, C.; Miao, L.; Hou, J.; Yuan, Q. Shift in bacterioplankton diversity and structure: Influence of anthropogenic disturbances along the Yarlung Tsangpo River on the Tibetan Plateau, China. Sci. Rep. 2017, 7, 12529. [Google Scholar] [CrossRef] [PubMed] [Green Version]
  42. Huang, Q.H.; Wang, Z.J.; Wang, D.H.; Wang, C.X.; Ma, M.; Jin, X.C. Origins and Mobility of Phosphorus Forms in the Sediments of Lakes Taihu and Chaohu, China. J. Environ. Sci. Health Part A Toxic/Hazard. Subst. Environ. Eng. 2005, 40, 91–102. [Google Scholar] [CrossRef]
  43. Report on the State of the Environment in China. Available online: http://www.zhb.gov.cn/hjzl/zghjzkgb/lnzghjzkgb/201706/P020170605833655914077.pdf (accessed on 1 August 2018).
  44. Yangtze River Water Resources Bulletin. 2015. Available online: http://www.cjw.gov.cn/zwzc/bmgb/2018gb/34508.html (accessed on 1 August 2018).
Figure 1. Research area and sampling sites.
Water 10 01858 g001
Figure 2. Specific triangle of P.
Water 10 01858 g002
Figure 3. P concentrations in the surface sediments.
Water 10 01858 g003
Figure 4. Average ratios of different forms of P to TP.
Water 10 01858 g004
Figure 5. Seasonal distribution of P. (a) seasonal distribution of SP, Al-P, Fe-P, Oc-P and OP; (b) seasonal distribution of Ca-P, IP and TP.
Water 10 01858 g005aWater 10 01858 g005b
Figure 6. Spatial distribution of P. (a) spatial distribution of SP, Al-P, Fe-P, Oc-P and OP; (b) spatial distribution of Ca-P, IP and TP.
Water 10 01858 g006
Figure 7. Relative proportions of different P sources (a) and different P bioavailability (b).
Water 10 01858 g007
Figure 8. P distribution in the suspended sediments (a) and water (b).
Water 10 01858 g008
Figure 9. The “specific triangle” of different research areas. (a) The YLZB River; (b) The Yangtze estuarine and tidal flat; (c) The Miyun Reservoir; (d) The Luoyang River; (e) Dianchi Lake; (f) Chaohu Lake; (g) The Yili River and the Xitiao River of the Taihu Lake basin; (h) Erhai Lake.
Water 10 01858 g009
Figure 10. Boxplot of the entire dataset for the seasonal distribution of P.
Water 10 01858 g010
Figure 11. Temperature (a) and pH (b) in the overlying water of each sample site.
Water 10 01858 g011aWater 10 01858 g011b
Figure 12. Concentrations of Ca, Al, and Fe in the surface sediments at some sites.
Water 10 01858 g012
Table 1. Correlations (Pearson’s) between different forms of P concentrations and TP concentration.
Al-PFe-PCa-POc-PIPOPTP
SP0.1660.640 **−0.057−0.357 *0.134−0.1320.121
Al-P 0.413 **−0.0040.1170.1190.2420.136
Fe-P 0.1190.2140.373 **0.2720.388 **
Ca-P 0.400 **0.962 **0.1630.955 **
Oc-P 0.463 **0.373 **0.483 **
IP 0.2210.997 **
OP 0.296 *
Notes: ** The correlation was significant at the level of 0.01 (both sides). * The correlation was significant at the level of 0.05 (both sides).
Table 2. Estimation of P flux of the mainstream of August.
SiteLazi Hydrological StationNugesha Hydrological StationNuxia Hydrological Station
Mediumsuspended sedimentswater currentsTotalsuspended sedimentswater currentsTotalsuspended sedimentswater currentsTotal
P flux
(kg/s)
0.3822.5422.925.6253.5859.200.49202.95203.44
Table 3. P and environmental settings of rivers.
Yarlung Zangbo River
(Middle Reaches)
Minjiang RiverDaliao River Systems
LocationQinghai-Tibet PlateauChengdu PlainLiaodong Bay
Length (km)1293735922
Drainage Area (km2)163,951135,88126,790
CitesShigatseLashaShannanNyingchiChengduMeishanLeshanYibinShenyangLiaoyangAnshanYinkou
Population
(10,000 persons)
799536221592300327451734179346233
GDP (100 million yuan)20242212711612,170111714071653554666714621156
Land use information Water 10 01858 i001 Water 10 01858 i002 Water 10 01858 i003
Notes1 Water 10 01858 i004 Cultivated land, 2 Water 10 01858 i005 Woodland, 3 Water 10 01858 i006 Grassland, 4 Water 10 01858 i007 Water bodies,
5 Water 10 01858 i008 Urban and rural areas, industrial and mining areas, residential land,
6 Water 10 01858 i009 Outside the province or outside the country, ocean, or unused land,
7 ● Points we use to indicate the flow of the river.
C(TP) range (mg/kg)194.0~540.7522.17~979.22479~1202
Average C(TP) (mg/kg)408.2744.98670
Average C(Fe-P) (mg/kg)12.489.92102.53
Table 4. “α” correlated with water quality or nutrient condition of different water bodies.
RiversYLZB RiverThe Yangtze Estuarine and Tidal FlatLuoyang RiverYili River and Xitiao River of Taihu Lake Basin
α4.41°24.37°58.15°91.78°
Water qualityexcellentexcellentgoodTaihu Lake: mildly eutrophic
Lakes or ReservoirsMiyun ReservoirDianchi LakeChaohu LakeErhai Lake
α43.33°94.09°96.81°82.49°
Nutrient conditionmedium level of nutrientsmoderately eutrophicmildly eutrophicmedium level of nutrients
Notes: Nutrient condition ranked as follows: moderately eutrophic > mildly eutrophic > medium level of nutrients. The data comes from [43,44]. There is no reference that shows the water quality of the Yili River or the Xitiao River of the Taihu Lake basin, but the nutrient condition of Taihu Lake is mildly eutrophic.

