Qualifying Coordination Mechanism for Cascade-Reservoir Operation with a New Game-Theoretical Methodology


State Key Laboratory of Water Resources and Hydropower Engineering Science, Wuhan University, Wuhan 430072, China
*
Author to whom correspondence should be addressed.
Water 2018, 10(12), 1857; https://doi.org/10.3390/w10121857
Submission received: 5 November 2018
/
Revised: 26 November 2018
/
Accepted: 12 December 2018
/
Published: 14 December 2018
(This article belongs to the Special Issue Economics of Water Resources Management)
Abstract
:The coordinated operation for hydropower generation in cascade reservoirs is critical to resolve the conflicts in hydropower needs between upstream and downstream reservoirs. Due to the individual rationality and collective rationality highlighted by game theory, we propose an integrated game-theoretical model to simulate the coordination behaviors among cascade reservoirs for hydropower generation. In the case study of a cascade-reservoir system in the Yangtze River of China, three operation models are compared and analyzed: the non-cooperative model, centralized model, and integrated game-theoretical model. The factors influencing the coordination efficiency of the integrated game-theoretical model are also explored in this study. The results indicate that the system’s hydropower generation obtained by the integrated game-theoretical model is closer to the ideal solution obtained by the centralized model compared to that obtained by the non-cooperative model. Moreover, individual hydropower generation in non-cooperation (rational individual gains) is guaranteed by the integrated game-theoretical model, which is neglected by the centralized model. Furthermore, the coordination efficiency of the integrated game-theoretical model is influenced by the water availability variation and regulation capacities of cascade reservoirs.
1. Introduction
The uneven distribution of water resources in temporal and spatial, rapid economic and social development are critical factors for regional water scarcity. In water-deficient regions, disputes arising over the available water resources among stakeholders are becoming ubiquitous [1,2]. Reasonable and effective allocation for water resources is a continuous need to alleviate the conflicts among stakeholders. The reservoir is considered as an important facility for reallocating water resources on spatial and temporal scales. Considering the different objectives of reservoirs, the integrated management of cascade reservoirs potentially plays a vital role in satisfying stakeholders’ possible desired utilities.
According to the classification of agents based on the different scenarios of information exchange [3], reservoirs can be classified as fully cooperative reservoirs, coordinated reservoirs, and non-cooperative reservoirs. The fully cooperative reservoirs correspond to the centralized management that is a “top-down” decision process. The centralized management assumes that all reservoir operators in the cascade-reservoir system obey the ‘central mind’ to fully cooperate and then make decisions targeting the maximum benefits for the whole system [4,5,6,7]. Therefore, ideal system-wide benefits can be produced by cooperation based on the collective rationality of reservoir operators. However, because non-cooperation involving water conflicts is common and stable [8], full cooperation without considering the individual self-interest is seldom applied in real-world management. The non-cooperative reservoirs correspond to the non-cooperative management. Following the non-cooperative management, decisions made by reservoir operators are based on individual rationality, in which self-interested reservoir operators usually focus on their local benefits rather than the system’s total benefits. However, due to the lack of cooperation, no feedback mechanism exists for decisions made by different reservoir operators, resulting in a solution that does not maximize the favorable benefits on the system scale. Therefore, traditional centralized and non-cooperative managements for cascade-reservoir system usually target the maximum benefits for either the entire system or a certain individual reservoir.
To balance the individual and system’s benefits, coordination among cascade reservoir operators is critical. Through coordination, coordinated reservoir operators not only make decisions targeting their own benefits, but also share information with the other operators to improve the system’s benefits. Giuliani et al. [3] demonstrated that the system benefits obtained by coordinated management are better than those obtained by non-cooperative management. To build coordinated models, mathematical methods have been widely used [9,10,11]. By iterative adjustment of various parameters that are related to stakeholders, it is determined whether or not different objectives are to be met. Through the bargaining process, stakeholders reach an agreement for compromise. Although the coordinated models based on mathematical methods have been successfully built for interactive systems, such models are sensitive to the complexities of systems [12]. As the number of stakeholders increases, the amount of information exchanged among stakeholders is also increased. Thus, the computation for a coordinated model built by mathematical methods for a multi-stakeholder system is considerable.
Game theory is another tool able to reflect the competition and cooperation among self-interested stakeholders [13]. For self-interested stakeholders, the individual rationality is stressed by game theory, embodying an idea of risk aversion. Game theory has been studied to resolve the conflicts in resources allocation. Salazar et al. [14] compared four game-theoretical methods in resolving conflicts for multi-objective problems. Chew et al. [15] developed a game-theoretical model for analyses of the inter-plant water integration problem. Salazar et al. [16] applied game theory to address water distribution problems in the Mexican Valley. Hipel and Walker [17] assessed the role of game theory in resolving conflicts for environmental management. Huang et al. [18] used the fuzzy Shapley value method to reallocate the pollution discharge rights based on the benefits obtained from the cooperation. Madani and Lund [19] employed game theory to solve multi-criteria decision-making problems for water resources management. Madani and Hooshyar [20] discussed three game-theoretical models to allocate benefits for cascade reservoirs. Kicsiny et al. [21] developed a dynamic game-theoretical model to simulate the water use conflicts between social and production sectors in drought emergency. Wang et al. [22] and Yang et al. [23] combined subjective weight and objective weight as a combination weight based on game theory to assess the water usage and water quality, respectively.
To the best of our knowledge, game theory has not been used to simulate the coordination behaviors in a cascade-reservoir operation. For a real-world cascade-reservoir operation, because of the geographical advantage, the upstream reservoir operators have priority to maximize their own benefits, which may weaken the benefits of downstream reservoir operators. Incorporating the game theory into the cascade-reservoir operation can make the upstream and downstream reservoir operators coordinate whilst considering individual self-interest. To realize such coordination among cascade reservoirs, an integrated game-theoretical model is proposed in this study. For the integrated game-theoretical model, there are two sub-models: a coordination model and a benefits compensation model. The coordination model is used to simulate the coordination among cascade reservoirs, and the benefits compensation model is used to guarantee individual rationality for sustainable coordination. The objectives of this study are to (1) compare the operations of a cascade-reservoir system based on the centralized model, the non-cooperative model, and the integrated game-theoretical model; (2) evaluate the impact of water availability variation on the operation efficiency of the integrated game-theoretical model; and (3) explore the potential factors affecting the efficiency of the integrated game-theoretical model.
2. Study Area and Data
2.1. Study Area
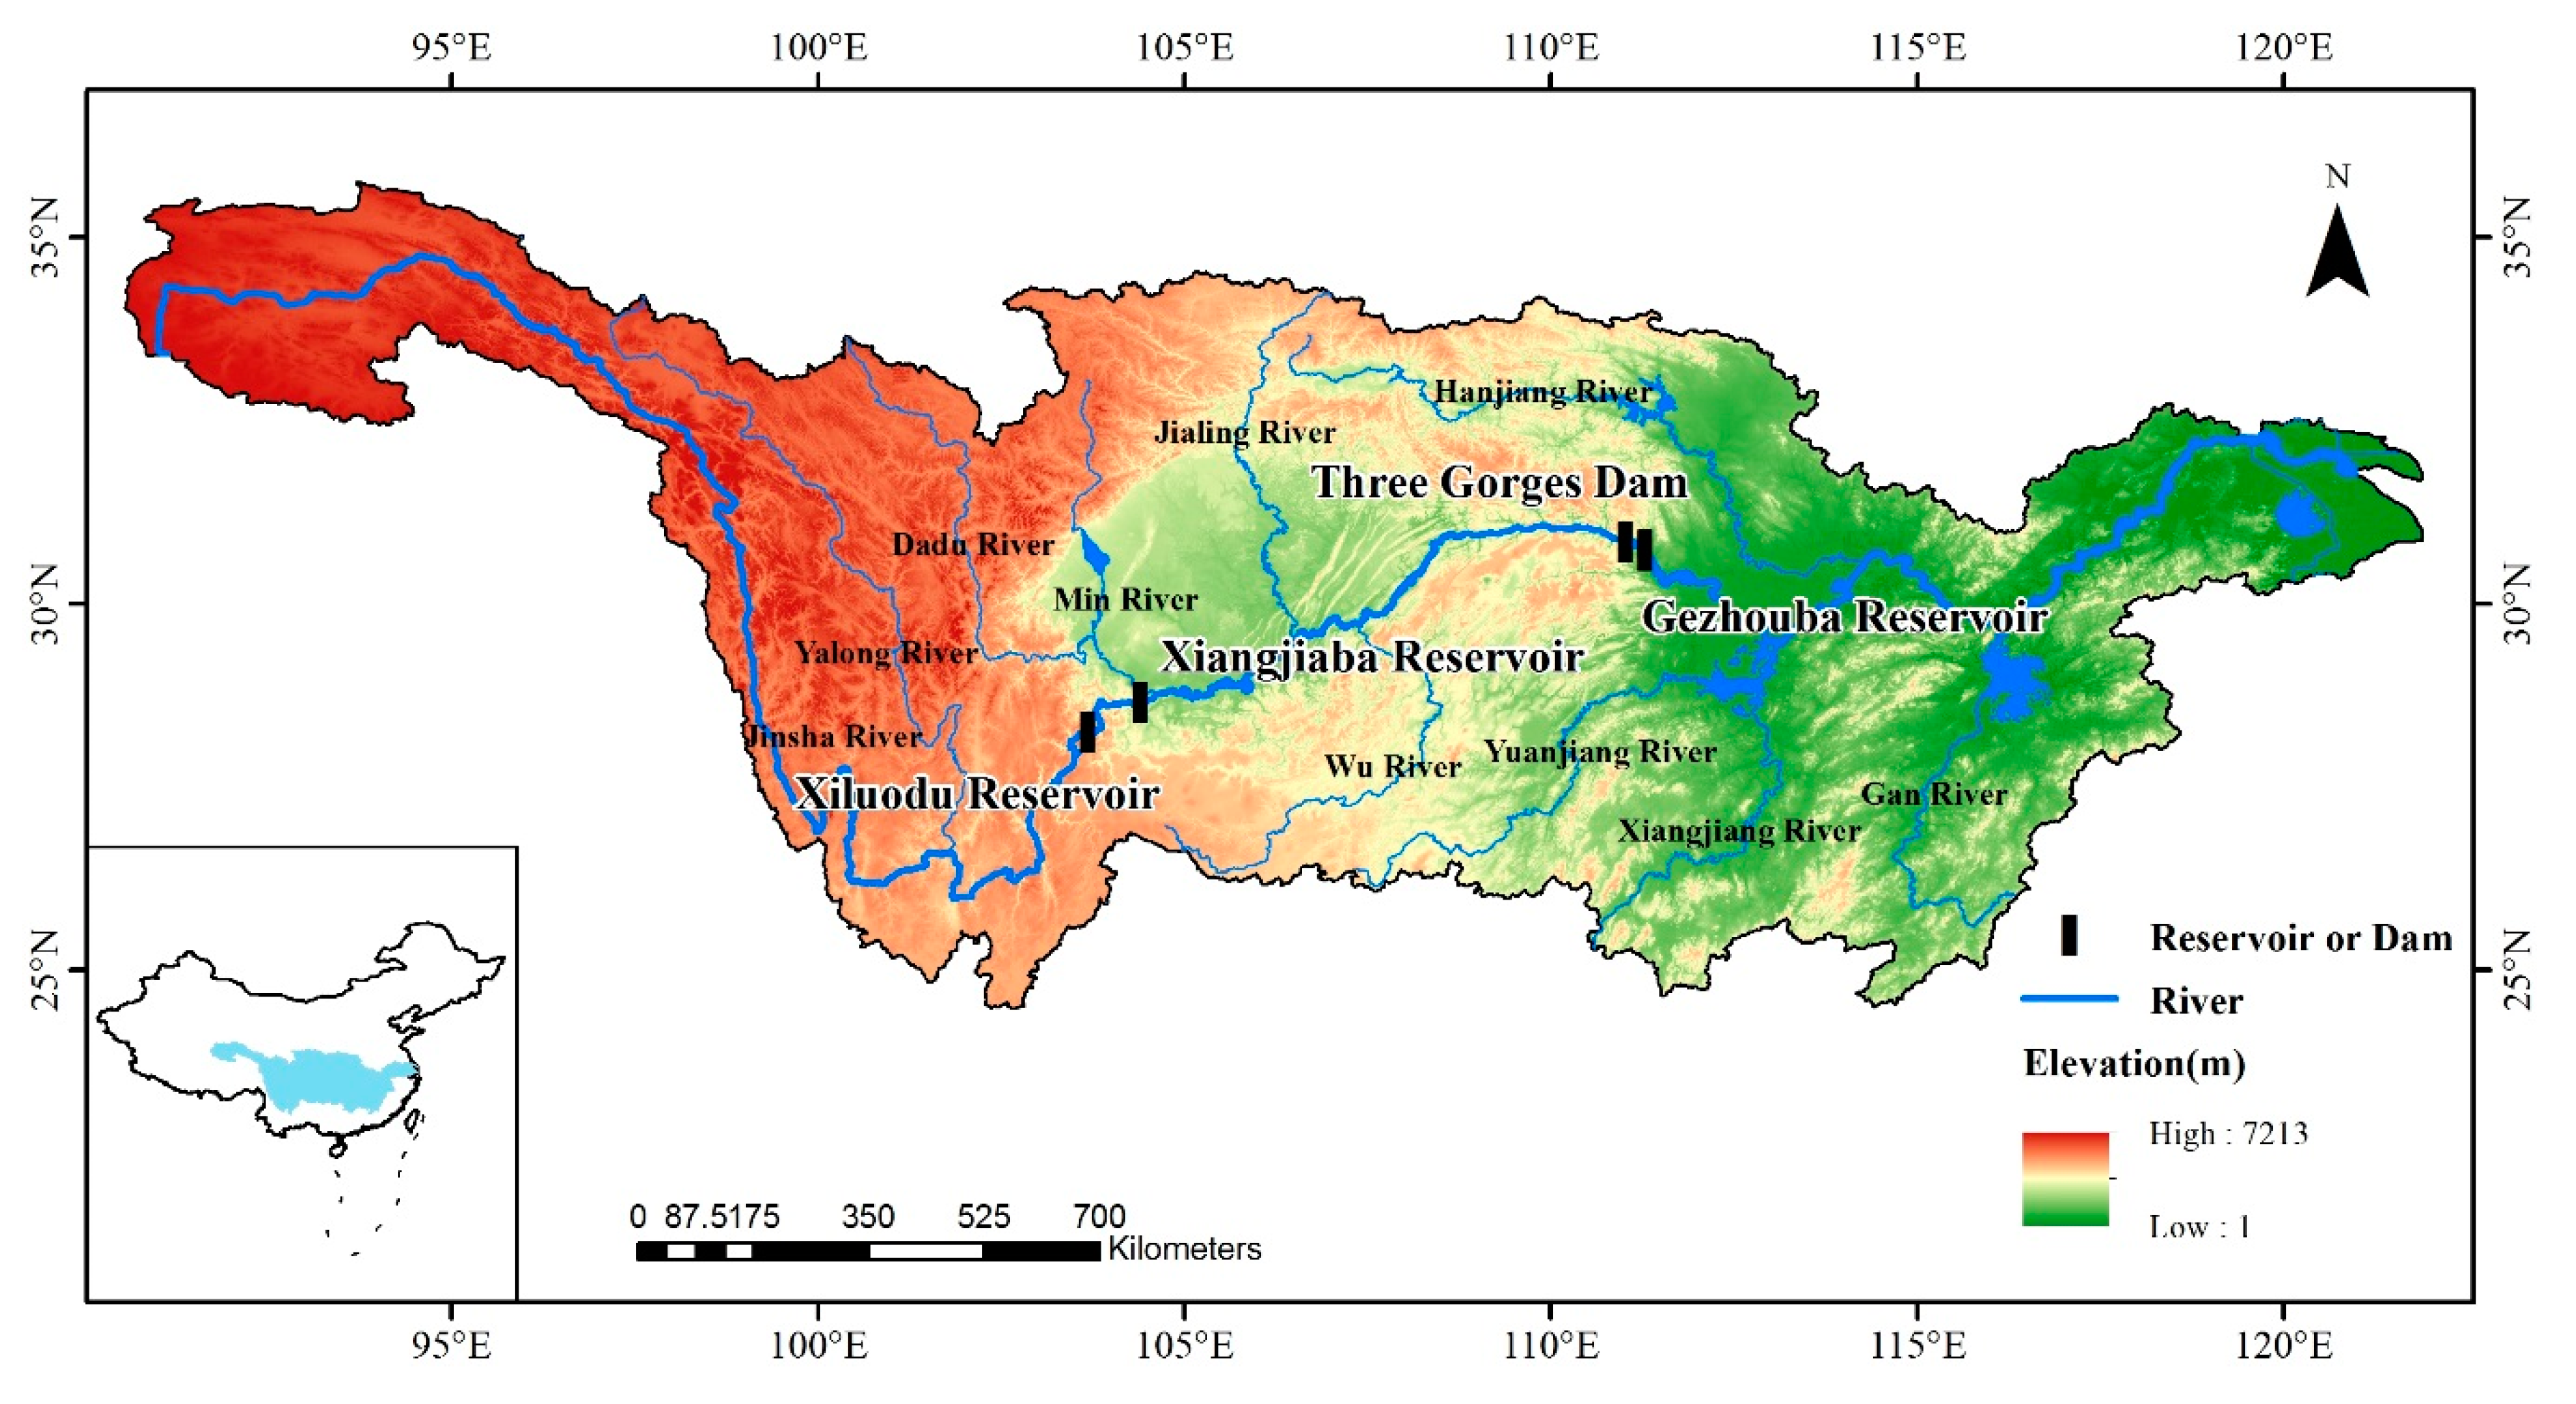
The study area is the Yangtze River basin, which has a length of 6397 km and rich water resources of . As one of the tributaries of the Yangtze River, Jinsha River flows from the east of the Tanggual Mountains to Yibin City of Sichuan Province. The Jinsha River has a length of approximately 3464 km and a natural water head of 5100 m; it can provide annual hydropower generation of , accounting for 49.9% of the Yangtze River basin [24]. In this study, the cascade-reservoir system consists of four reservoirs that exist in the Yangtze River basin in series. The upstream reservoirs, including the Xiluodu (XLD) reservoir and the Xiangjiaba (XJB) reservoir, are located on the Jinsha River, while the downstream reservoirs, including the Three Gorges Dam (TGD) and the Gezhouba (GZB) reservoir, are located on the main stream of the Yangtze River.
The XLD reservoir, with the highest altitude in the cascade-reservoir system, is prioritized for hydropower generation. The XJB reservoir, located 157 km downstream of the XLD reservoir, has the ability to provide reoperation to the XLD reservoir. The watershed area controlled by the XLD reservoir and the XJB reservoir is , accounting for approximately 97% of the catchment area of the Jinsha River [24]. The TGD is located 840 km downstream of the XJB reservoir. As the largest hydro-junction project in the world, the TGD encloses a catchment area of , accounting for approximately 55.5% of the area of the Yangtze River basin, and shows a strong capacity for hydropower generation. The GZB reservoir, located 38 km downstream from the TGD, has the ability to provide reoperation to the TGD. The GZB reservoir is regulated daily and can be regarded as a run-of-the-river hydropower plant in the long-term operation. The geographical location and detailed information of the cascade reservoirs are presented in Figure 1 and Table 1, respectively.
Although the Three Gorges Cascade Dispatch and Communication Center (TGDCC) is responsible for the operations of the four reservoirs, the upstream reservoirs (the XLD reservoir and XJB reservoir) and the downstream reservoirs (the TGD and GZB reservoir) are managed by different dispatch centers that are sub-organizations of TGDCC. Considering the geographical location, the XLD and XJB reservoirs are managed by the Chengdu dispatch center, while the TGD and GZB reservoirs are managed by the Yichang dispatch center. In the real-world operation, the XLD reservoir and XJB reservoir are usually regarded as a cascade-reservoir system for joint operation, as is the case for the TGD and GZB reservoir. Therefore, for this study, the upstream reservoirs (the XLD reservoir and XJB reservoir) can be categorized as an upstream coalition, and the downstream reservoirs (the TGD and GZB reservoir) can be categorized as a downstream coalition (shown in Figure 2). Due to the geographical advantage, the upstream coalition prioritizes maximizing its own benefits, while the downstream coalition has to maximize its own benefits based on decisions made by the upstream coalition. In this study, an integrated game-theoretical model has been developed to simulate the coordination behaviors between the upstream and downstream coalitions.
2.2. Date Collection
The observed daily streamflow data from 1981–2010 at Pingshan station is used as the inflow to the XLD reservoir. Because of the similar catchment area controlled by the XLD reservoir and the XJB reservoir, the local inflow between them can be ignored. The observed daily streamflow data from 1981–2010 at Yichang station is used as the inflow to the TGD. The analyses for the observed data in Pingshan and Yichang stations are shown in Table 2. The annual discharge from the TGD accounts for 99.8% of the annual water quantity between the TGD and GZB reservoir. Therefore, it is assumed that the inflow to the GZB reservoir is equal to the discharge from the TGD. In order to examine the practical effect of the proposed integrated game-theoretical model for the cascade-reservoir operation in the Yangtze River basin, the inflows of three typical hydrologic years, i.e., the 90% (low flow), 50% (medium flow), and 10% (high flow) dependable inflow year, are selected for a comparative study.
3. Methodology
3.1. Centralized Model (Model I)
The centralized model inherently assumes that all reservoirs with different (even conflicting) goals in the multi-reservoir system are subject to a ‘central mind’ to cooperate based on collective rationality, and they make decisions aimed at maximizing the total benefits of the whole system, resulting in an economically optimal operation, on the system scale. Model I is expressed by the following mathematical formula:
where E indicates the total hydropower generation for the multi-reservoir system; indicates the output of reservoir i at time t; M is the total number of reservoirs in the multi-reservoir system; indicates the time-step; and T indicates the number of operation periods.
Subject to
Water balance between reservoirs:
where denotes the storage of reservoir i at period t (m³); denotes the inflow to reservoir i at period t (m³/s); and denotes the average releases from reservoir i at period t (m³/s).
Reservoir storage constraint:
where and denote the minimum and maximum allowable storage of reservoir i at period t (m³), respectively.
Reservoir releases constraint:
where and denote the minimum and maximum allowable releases from reservoir i at period t (m³/s), respectively.
Output constraint:
where and denote the minimum and maximum allowable output of reservoir i at period t (kW), respectively.
Boundary constraint:
3.2. Non-Cooperative Model (Model II)
Following the non-cooperative model, the strategies autonomously taken by reservoirs target the optimal benefits for their own goals, without considering the requirements of the other reservoirs. For a multi-reservoir system, the upstream reservoirs have priority in making decisions to maximize their local benefits. Because of the lack of coordination, the downstream reservoirs only take actions based on decisions made by the upstream reservoirs. Therefore, the optimization of the multi-reservoir system is performed from upstream to downstream, one by one. Model II is expressed by the mathematical formula:
where indicates the hydropower generation of reservoir i.
In addition, the objective function subjects itself to the constraints: mass balance, storage constraint, releases constraint, output constraint, and boundary constraint, which are similar to the constraints (Equations (2)–(6)) of Model I.
3.3. Integrated Game-Theoretical Model
To simulate the coordination between the upstream and downstream reservoirs, an integrated game-theoretical model is proposed in this study. The proposed model consists of two sub-models: a coordination model and a benefits compensation model. The coordination model is built based on the Stackelberg theory, and the benefits compensation model is built based on the Nash-Harsanyi bargaining theory.
3.3.1. Coordination Model (Model III(a))
Stackelberg theory [25] is defined as a non-cooperative game theory. The sequence of actions taken by players is given great importance by this theory [26,27]. Following the Stackelberg theory, a dominant (or leader) player moves first, and then, a subordinate (or follower) player moves second. Before the game begins, the follower knows how the leader acts; at the same time, the leader also knows what the follower knows. The coordination is implemented via information exchange between the leader and the follower. Based on the Stackelberg theory, the coordination model for upstream and downstream reservoirs is developed as follows:
where: and denote the strategy spaces for upstream and downstream coalitions, respectively; and denote the decision strategies belonging to and , respectively; and denote the payoff functions of upstream and downstream coalitions, respectively; and denote the hydropower generation of upstream and downstream coalitions, respectively; denote the number of reservoirs of the upstream coalition; indicates that is the best response of the downstream coalition to the strategy specified for the upstream coalition; and indicates that is the best response of the upstream coalition to the strategy specified for the downstream coalition. Therefore, is the Nash equilibrium for the cascade-reservoir operation.
For the upstream and downstream coalitions, and , respectively, can be calculated as follows:
Given the coordination between the upstream and downstream coalitions, an interaction factor for the upstream coalition function for feedback on decisions made by the downstream coalition is proposed as follows:
where denotes the rational hydropower generation of the downstream coalition obtained through noncooperation (Model II).
Therefore, the decisions of the downstream coalition can be responded to by the actions taken by the upstream coalition as follows:
According to the interaction factor, the payoff benefits of the upstream coalition are influenced by its decisions whilst considering the requirements of the downstream coalition, as follows:
In addition, the objective function subjects itself to the constraints: mass balance, storage constraint, releases constraint, outputs constraint, and boundary constraint, which are similar to the constraints (Equations (2)–(6)) of Model I.
3.3.2. Benefits Compensation Model (Model III(b))
Through coordination, the hydropower generation of upstream coalition may be sacrificed to improve the hydropower generation of downstream coalition. Nevertheless, because of the decreased hydropower generation, the rational upstream reservoir operators have no incentive to participate in the coordination and prefer to act in a non-cooperative mode [20]. For maintaining a stable coordination, benefits compensation for upstream reservoir operators needs to be implemented to ensure the rational individual benefits.
Nash-Harsanyi bargaining theory [28,29] can be used to provide fair and efficient resources allocation for players with guaranteed rational individual benefits [30,31,32,33]. Due to the increased hydropower generation of the whole system through coordination, the individual hydropower generation can be reallocated by Nash-Harsanyi bargaining theory to ensure the rational individual benefits [15].
subject to:
where: denotes the solution of the Nash-Harsanyi bargaining model; denotes the hydropower generation of reservoir i allocated by the Nash-Harsanyi bargaining model; denotes the rational hydropower generation of reservoir i obtained through noncooperation; and denotes the totally available hydropower generation of the cascade-reservoir system.
3.4. Evaluation Criterion
To analyze the efficiency of the coordination model in improving the hydropower generation of downstream coalition, an improvement index is proposed. The index is calculated as:
where denotes the rational hydropower generation of the upstream coalition obtained through noncooperation.
3.5. Solving Method
For the game-theoretical model, the strategy space 1 for the upstream coalition (Coalition 1) and the strategy space 2 for the downstream coalition (Coalition 2) are first determined. The strategy of a coalition is defined as release decisions of reservoirs in time intervals. Because of multiple reservoirs and time intervals, the number of coalition’s strategies is considerable during the operation horizon. To simplify computational efforts, some discrete strategies of the coalition need to be selected. In this study, the genetic algorithm (GA) [34] is used to simplify and solve the integrated game-theoretical model. The parameters of GA are shown in Table 3.
In a GA, a population of candidate solutions to an optimization problem is evolved toward better solutions. The evolution is an iterative process. For each iteration, several strategies are generated using selection, crossover, and mutation operators of GA, and evaluated by the fitness function. The current best strategy in each iteration can then be determined according to the fitness value. By the iterative computation of GA, the optimal solution for high-dimensional problems can be explored.
In this study, to select the strategy for strategy space 1, the hydropower generation of the upstream coalition is optimized by GA. If the difference of the hydropower generation between the strategies in two neighboring iterations is larger than the threshold value, the two strategies are considered as the selected strategies of the strategy space 1. The selection of discrete strategies of the upstream coalition can be described as follows:
where: k denotes the index of iterations; denotes the release decisions in iteration k; n denotes the total number of release decisions in iteration k; denotes the best release strategy in iteration k; and denotes the minimum difference between two strategies in neighboring iterations in terms of the hydropower generation of upstream coalition.
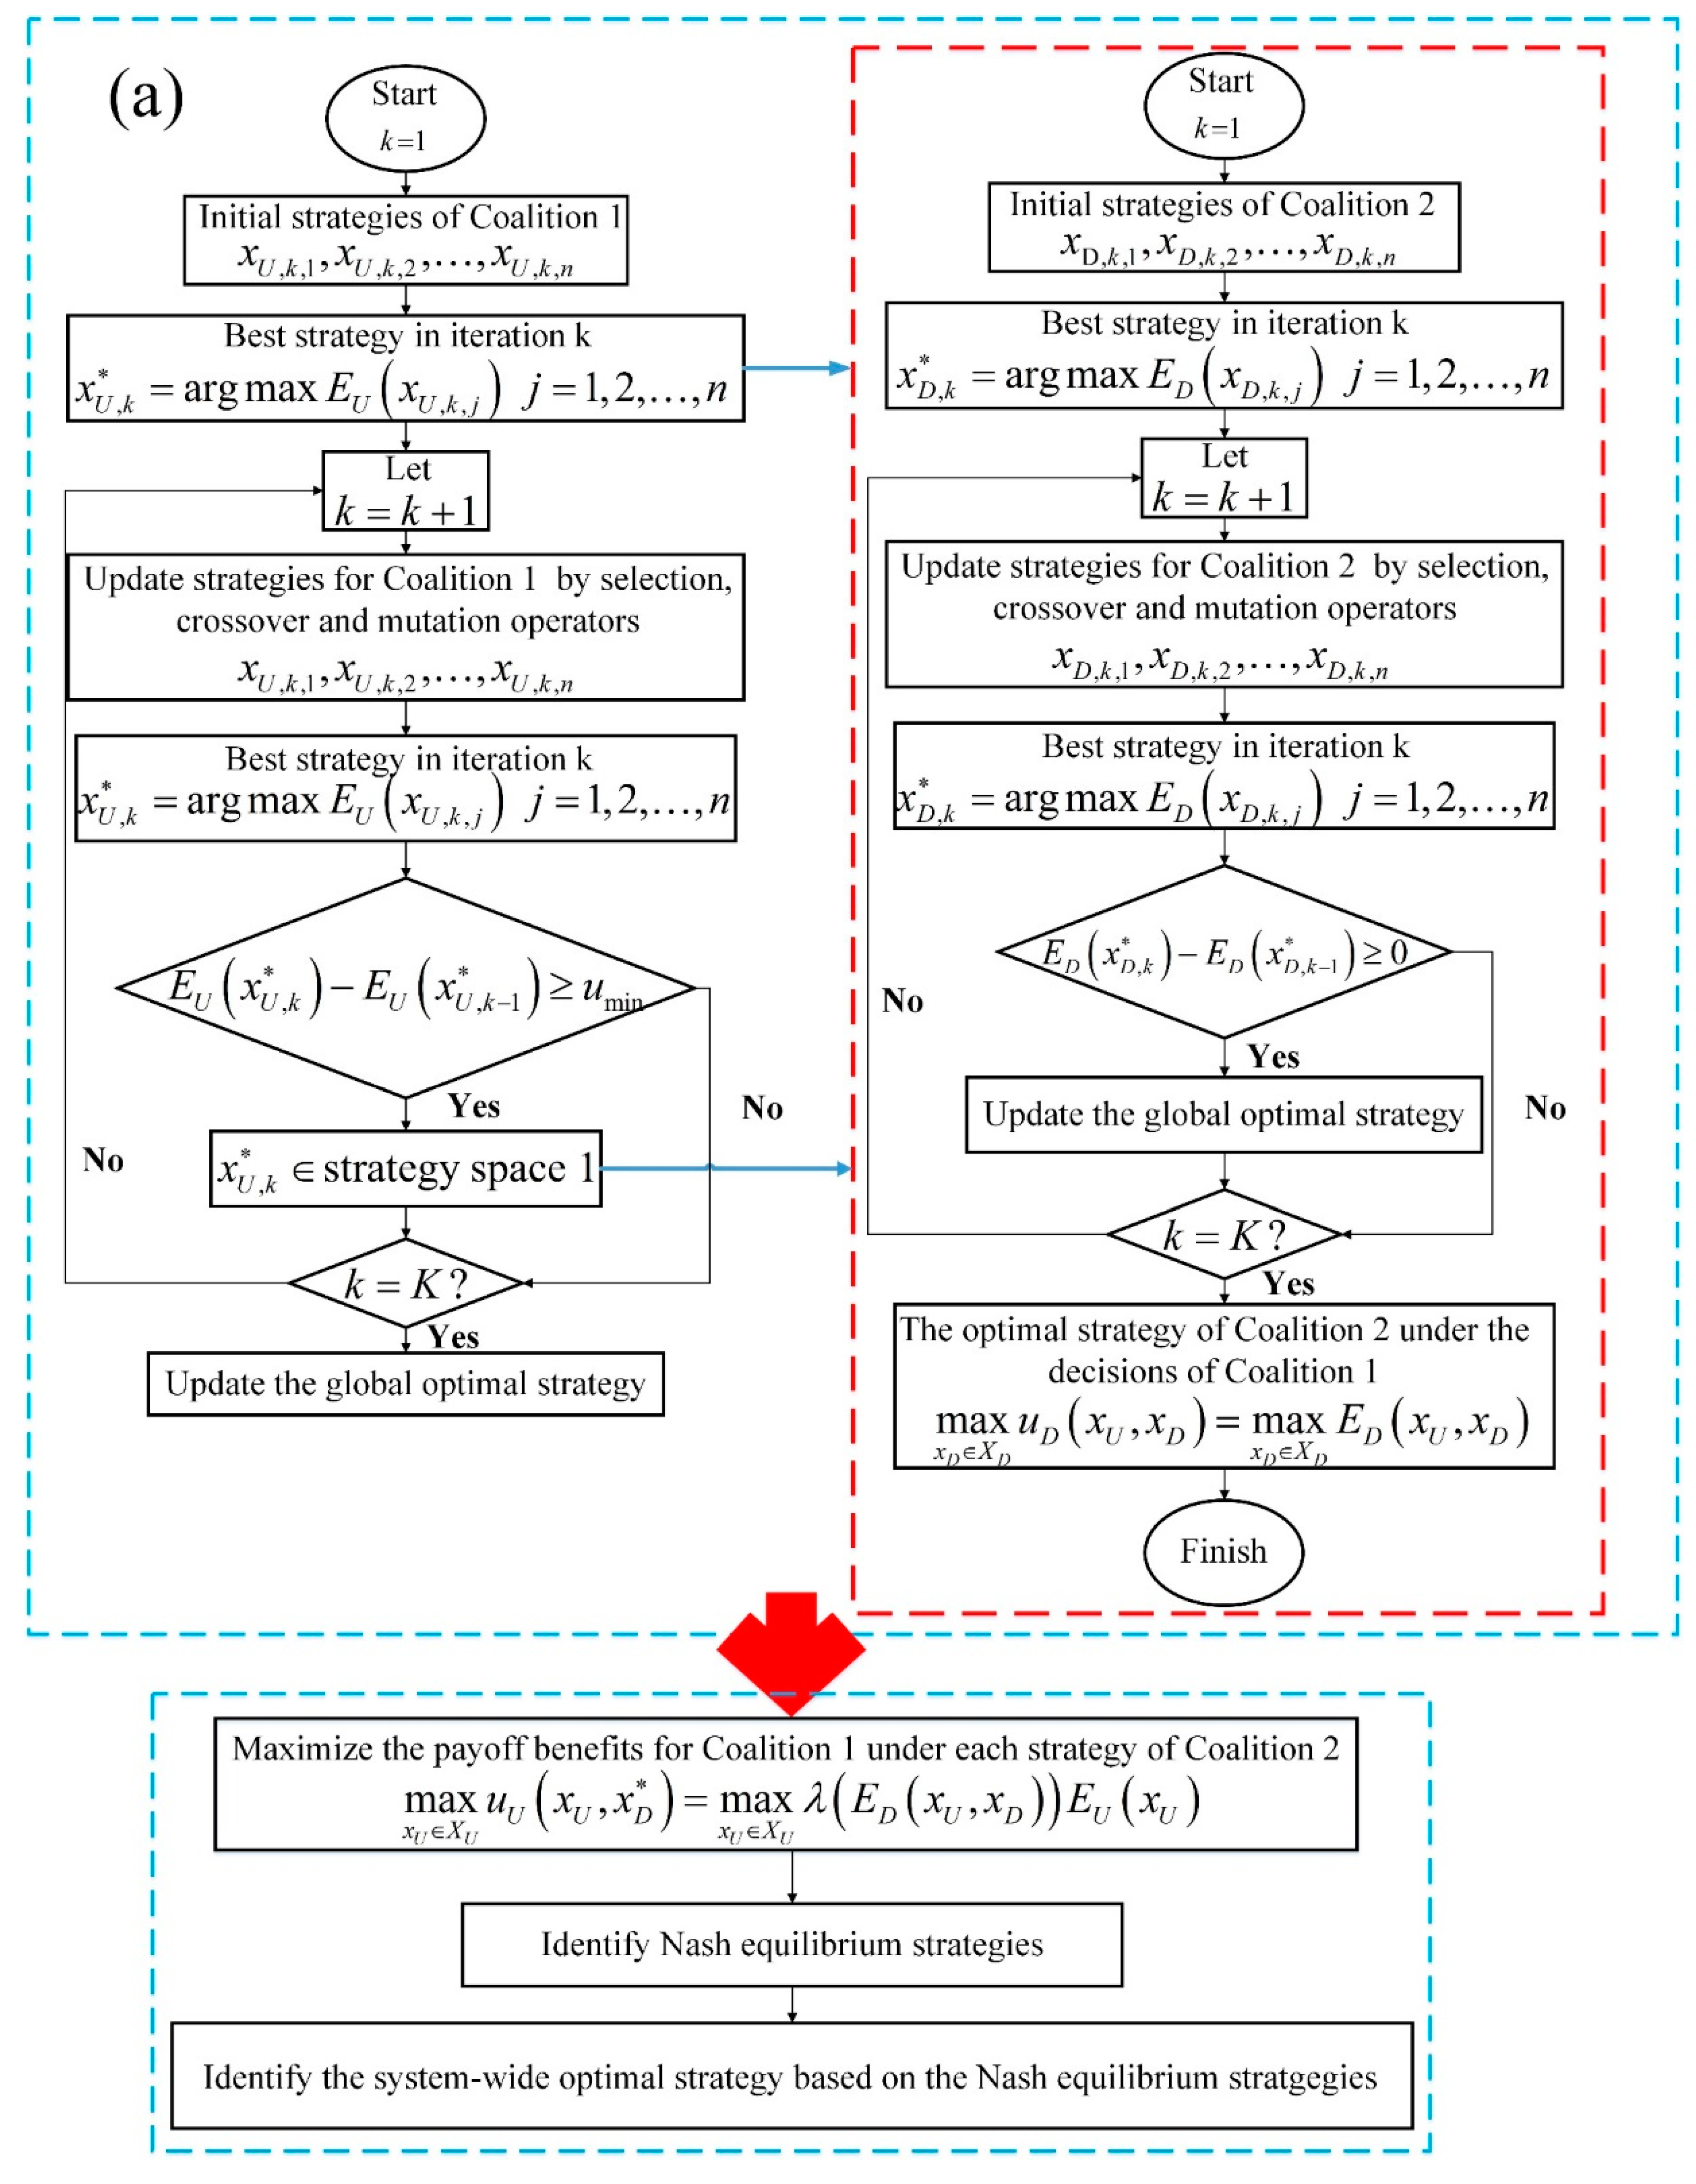
Different from strategy space 1 that includes several feasible release decisions, the strategies of strategy space 2 are assumed as all feasible release decisions. For each strategy of strategy space 1, the optimal strategy of strategy space 2 can be obtained using GA. When strategy spaces 1 and 2 have been determined, the coordination between upstream and downstream coalitions is implemented through Equations (8)–(19), and the Nash equilibrium strategies are reached. After identifying the Nash equilibrium strategies of the cascade-reservoir system, the hydropower generation of reservoirs is revised through Equations (20)–(22). The solving process of the game-theoretical model is shown in Figure 3.
4. Results and Discussion
4.1. Nash Equilibrium Strategies of Multi-Reservoir Operation
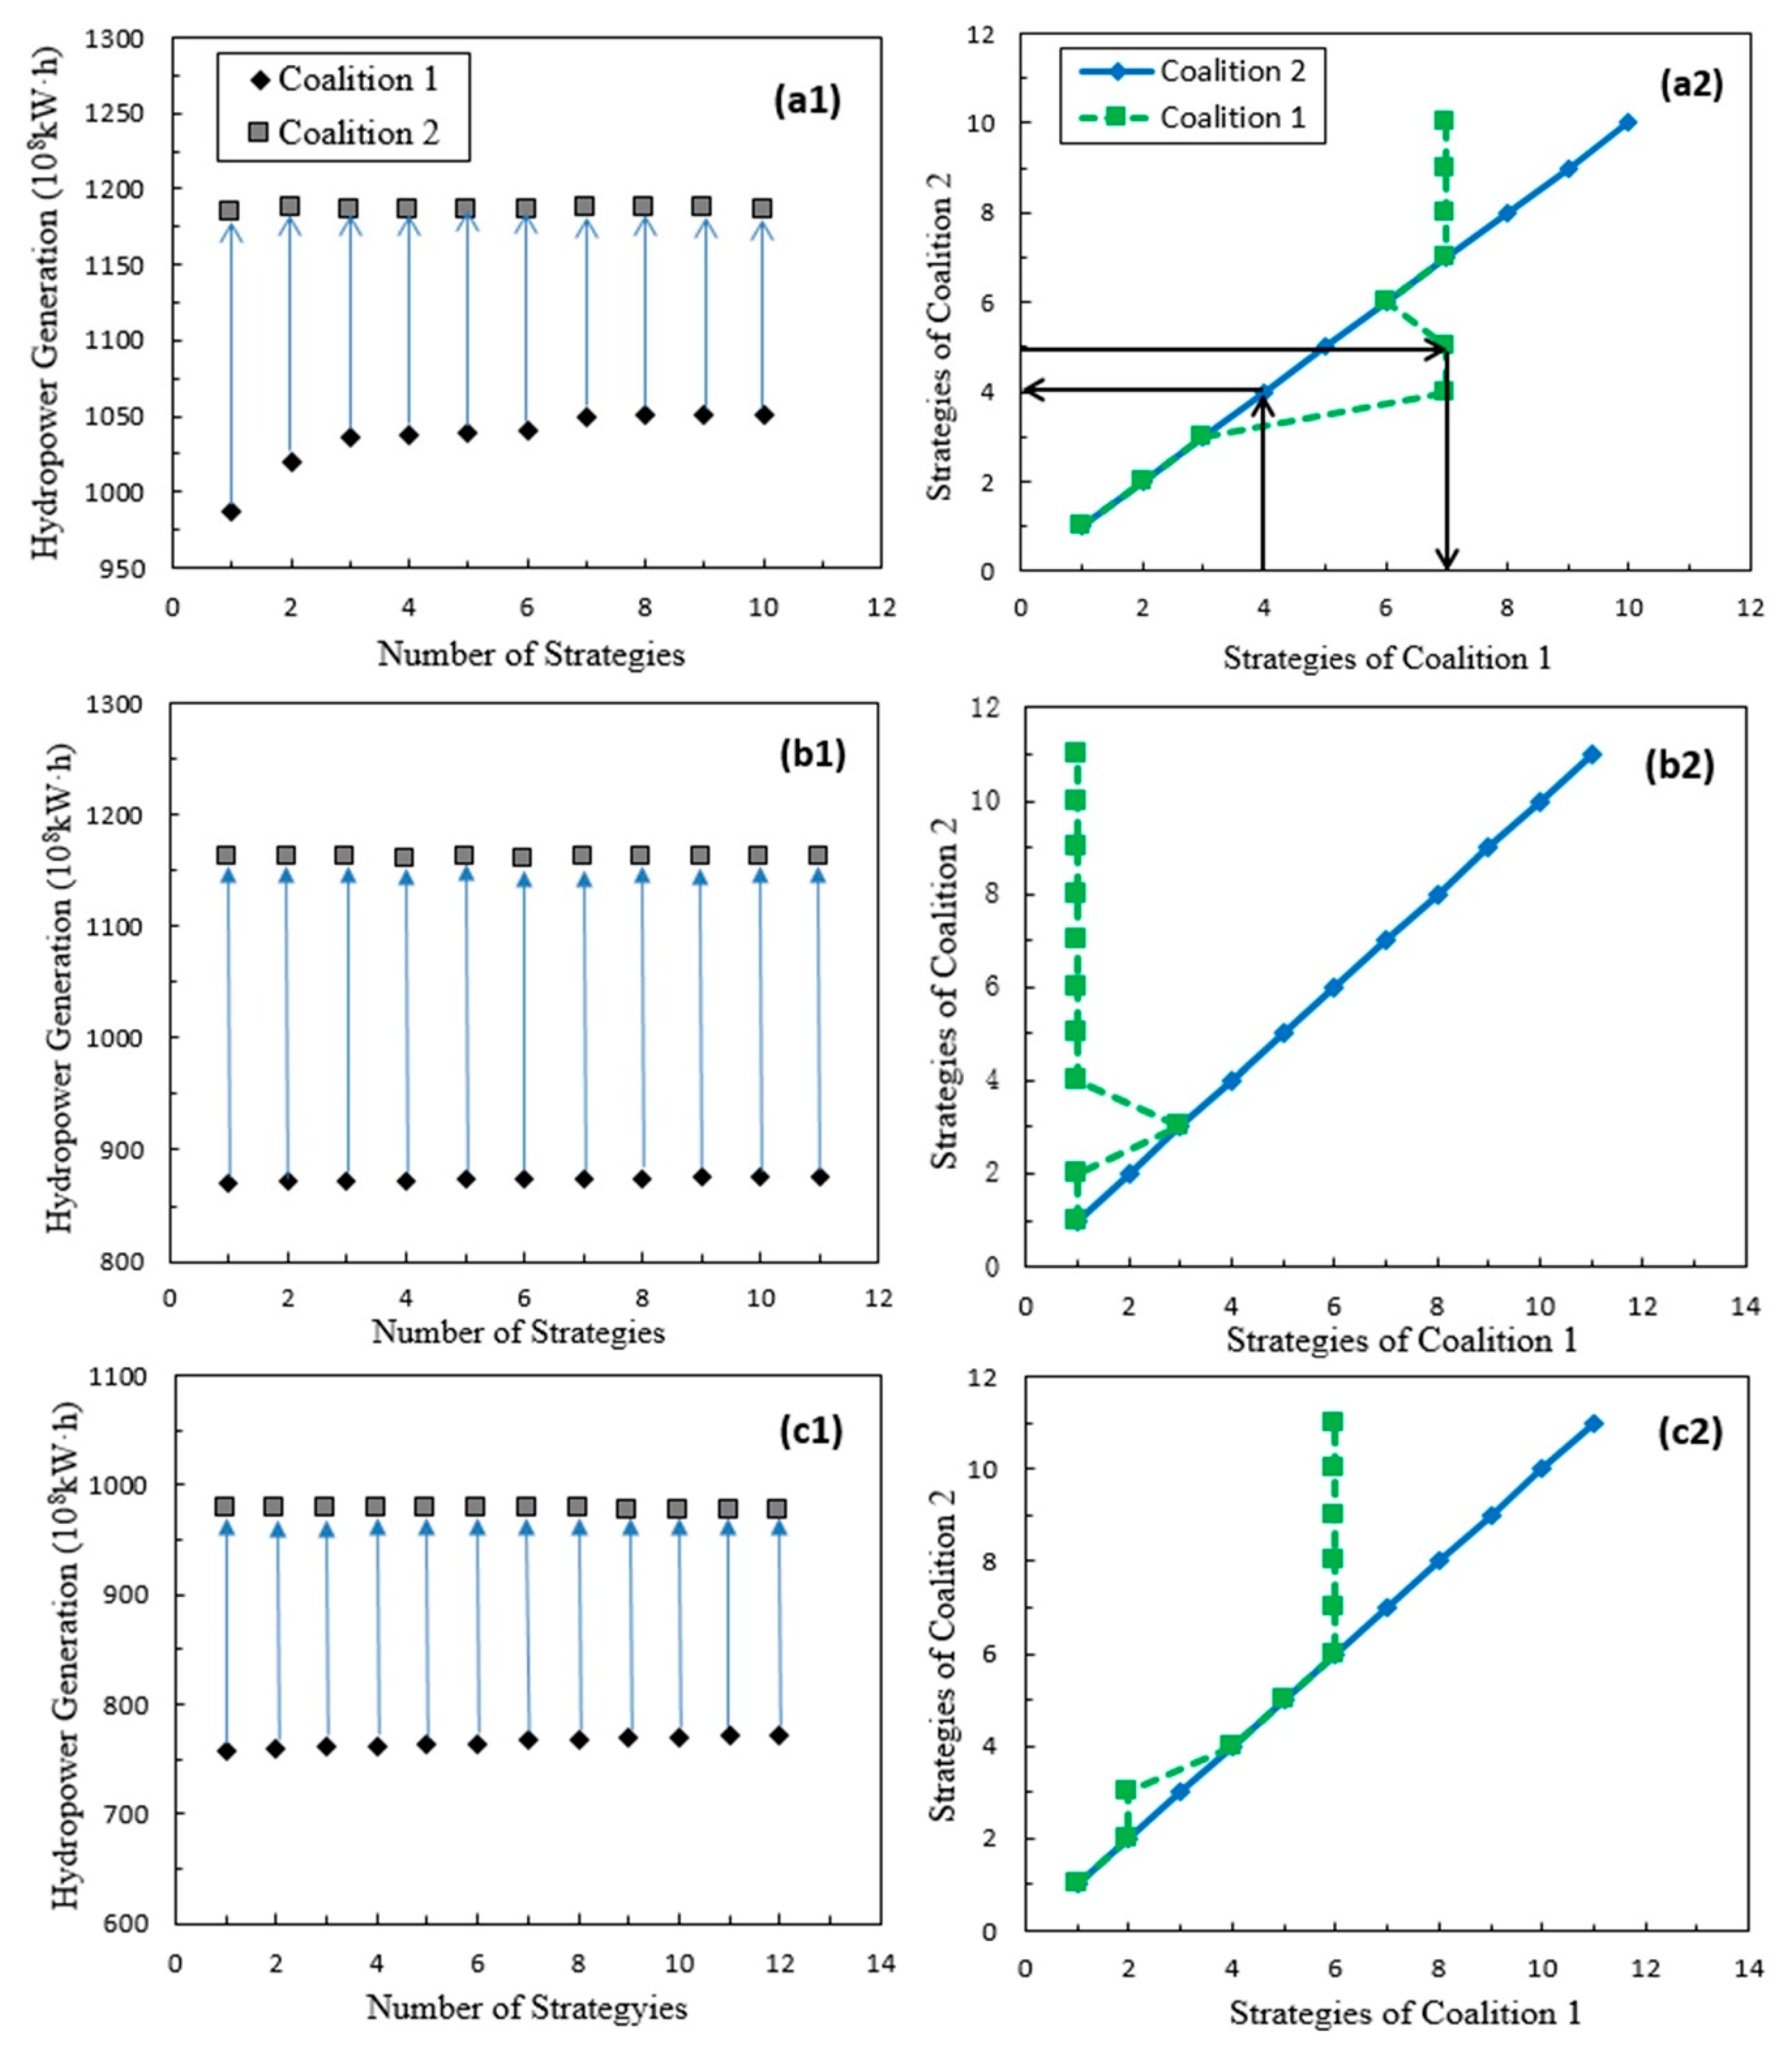
Through the solving methodology mentioned in Section 3.5, strategy space 1 includes 10, 11, and 11 strategies for the three flow scenarios. The corresponding optimal strategies in strategy space 2 under each flow scenario are shown by arrows in Figure 4(a1,b1,c1). The coalition’s best response strategy to the strategy specified for the other coalition is represented as each point in Figure 4(a2,b2,c2). For example, for the high flow scenario, when Coalition 1 selects strategy 4, the best response of Coalition 2 is strategy 4; when Coalition 2 selects strategy 5, the best response of Coalition 1 is strategy 7. The best response points for one coalition jointly create the coalition’s best response curve. Therefore, Nash equilibrium strategies (NESs) of Stackelberg theory are indicated by the overlapping points of two curves. For the set of Nash equilibrium strategies under each flow scenario, the system-wide optimality is defined as the Nash equilibrium strategy with maximum total hydropower generation for the following comparisons [22] (shown in Figure 5).
4.2. Assessment of Game-Theoretical Model
4.2.1. Coordination Assessment
Before analyzing coordination between two coalitions of the cascade-reservoir system under Model III, it is necessary to evaluate the total hydropower generation of the system based on Models I and II during the operation horizon. Table 4 summarizes the individual and system’s hydropower generation based on the three models under the three flow scenarios. It is shown that the system’s hydropower generation obtained by Model I is globally better than that obtained by the other two models under the three flow scenarios. The results indicate that the system’s hydropower generation can be maximized through full cooperation among all reservoirs in theory. For the three flow scenarios, the total hydropower generation of Model I is , , and higher than those of Model II. Therefore, the gap of hydropower generation between Models I and II increases as the available water decreases. Moreover, the total hydropower generation obtained by Model III(a) is close to that obtained by Model I, which is better than that obtained by Model II under the three flow scenarios.
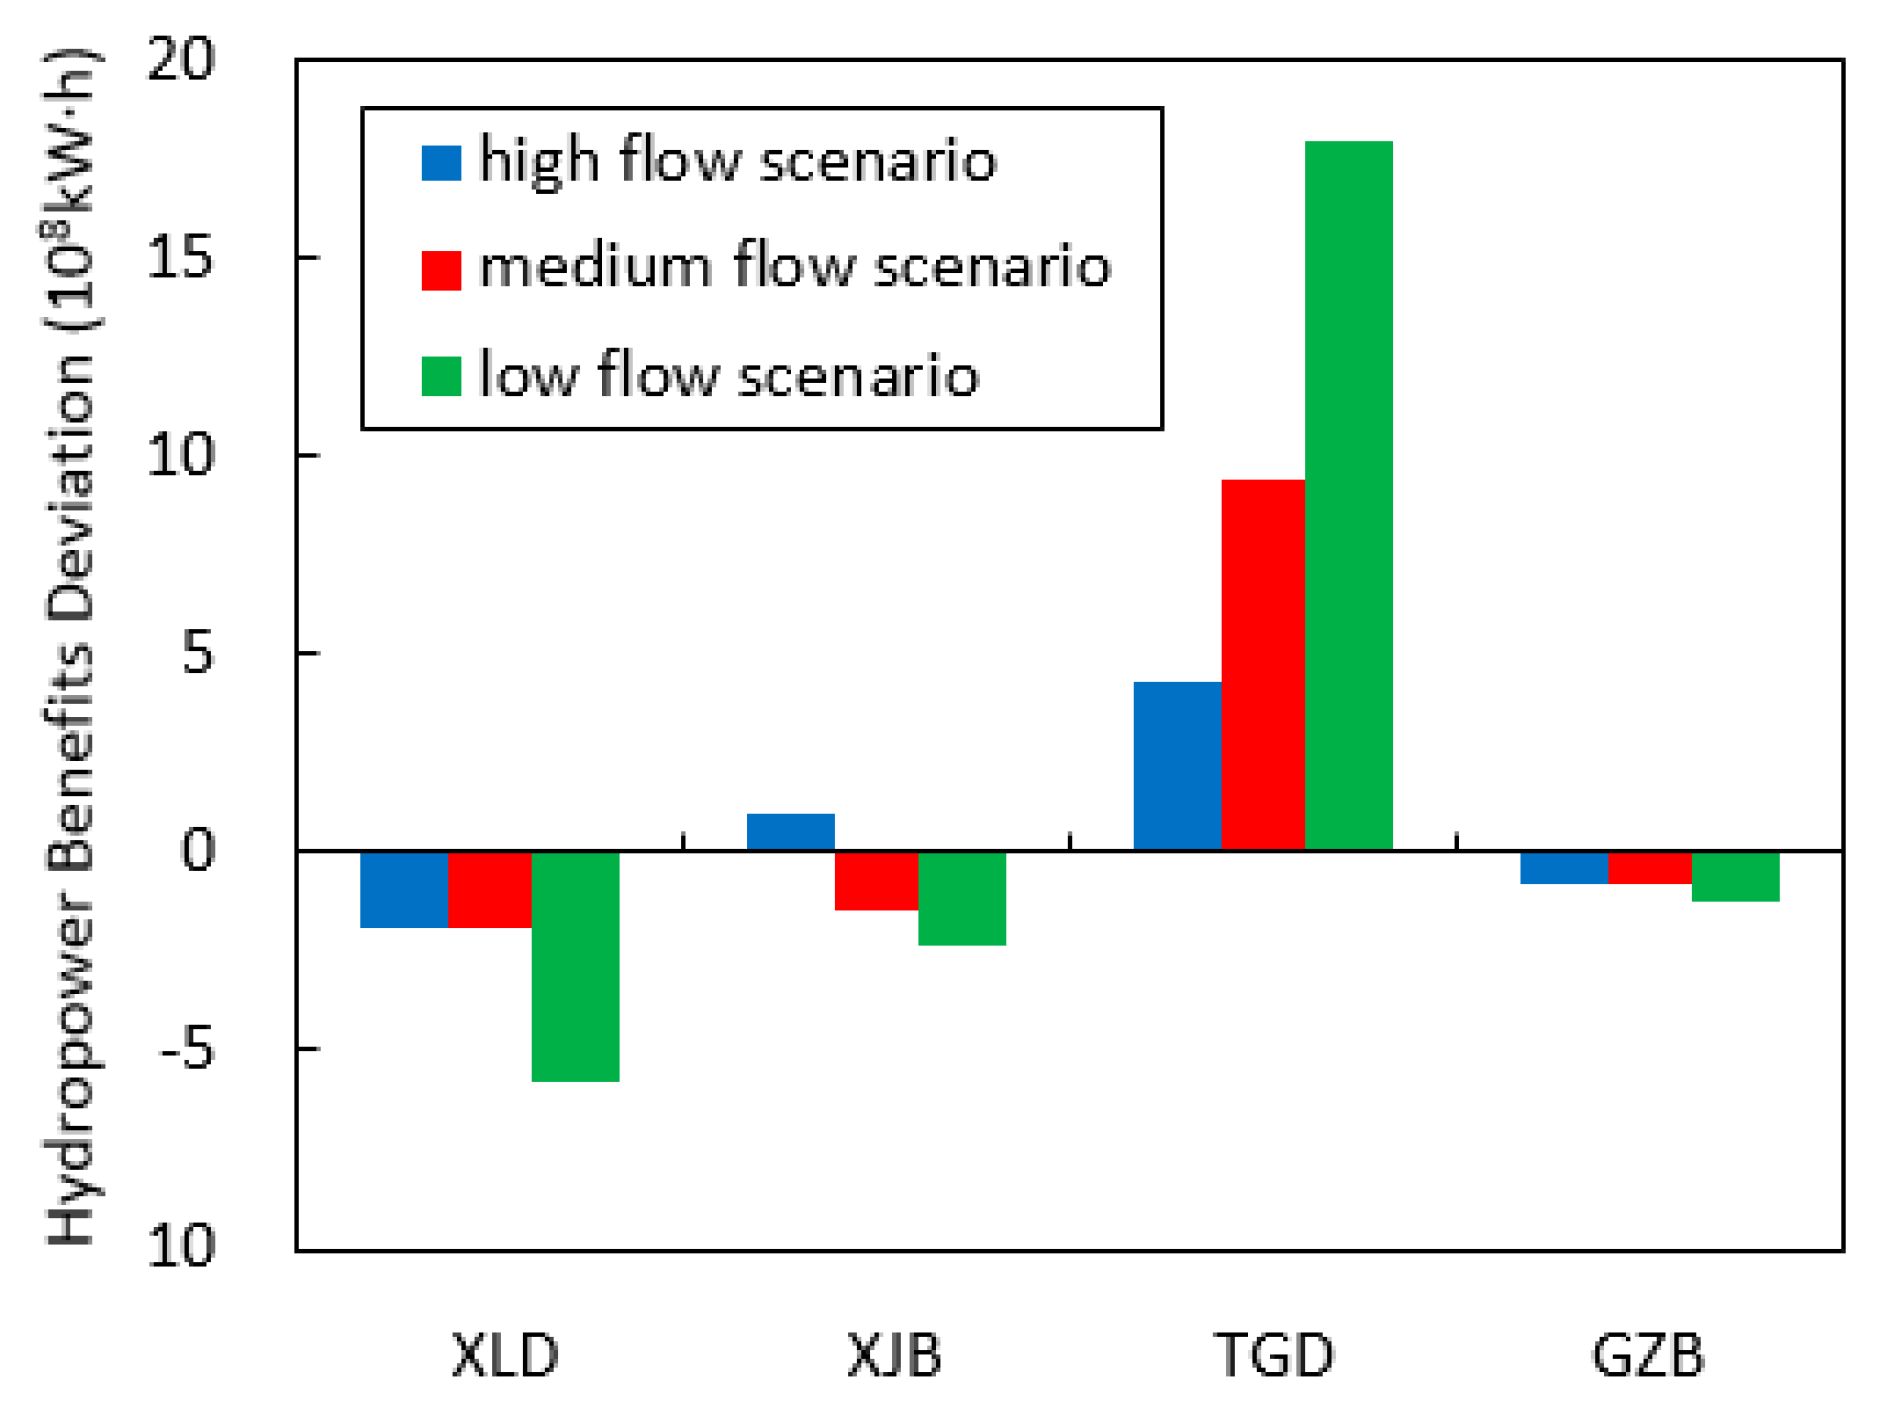
To assess the efficiency of coordination, the individual hydropower generation obtained by Model II is considered as the baseline. Figure 6 shows the hydropower generation deviation for cascade reservoirs obtained by Model III(a). It is observed that the hydropower generation of upstream reservoirs (Coalition 1) obtained by Model III(a) is lower than that obtained by Model II, whereas the hydropower generation of downstream reservoirs (Coalition 2) obtained by Model III(a) is significantly higher than that obtained by Model II under the three flow scenarios. Therefore, the trade-off between two coalitions can be described by comparing the value of objectives: the improvement in one’s objective is compensated for by the worsening of the other’s objective. For the downstream coalition, the install capacity of GZB (2940 MW) is much less than that of TGD (22,500 MW). To improve the hydropower generation of the downstream coalition through coordination, the strategy that can significantly improve the hydropower generation of TGD is more likely selected, which may result in a loss in the hydropower generation of GZB. Therefore, in Figure 6, the hydropower generation deviation for TGD is positive and larger, while the values for the XLD, XJB, and GZB are negative and smaller.
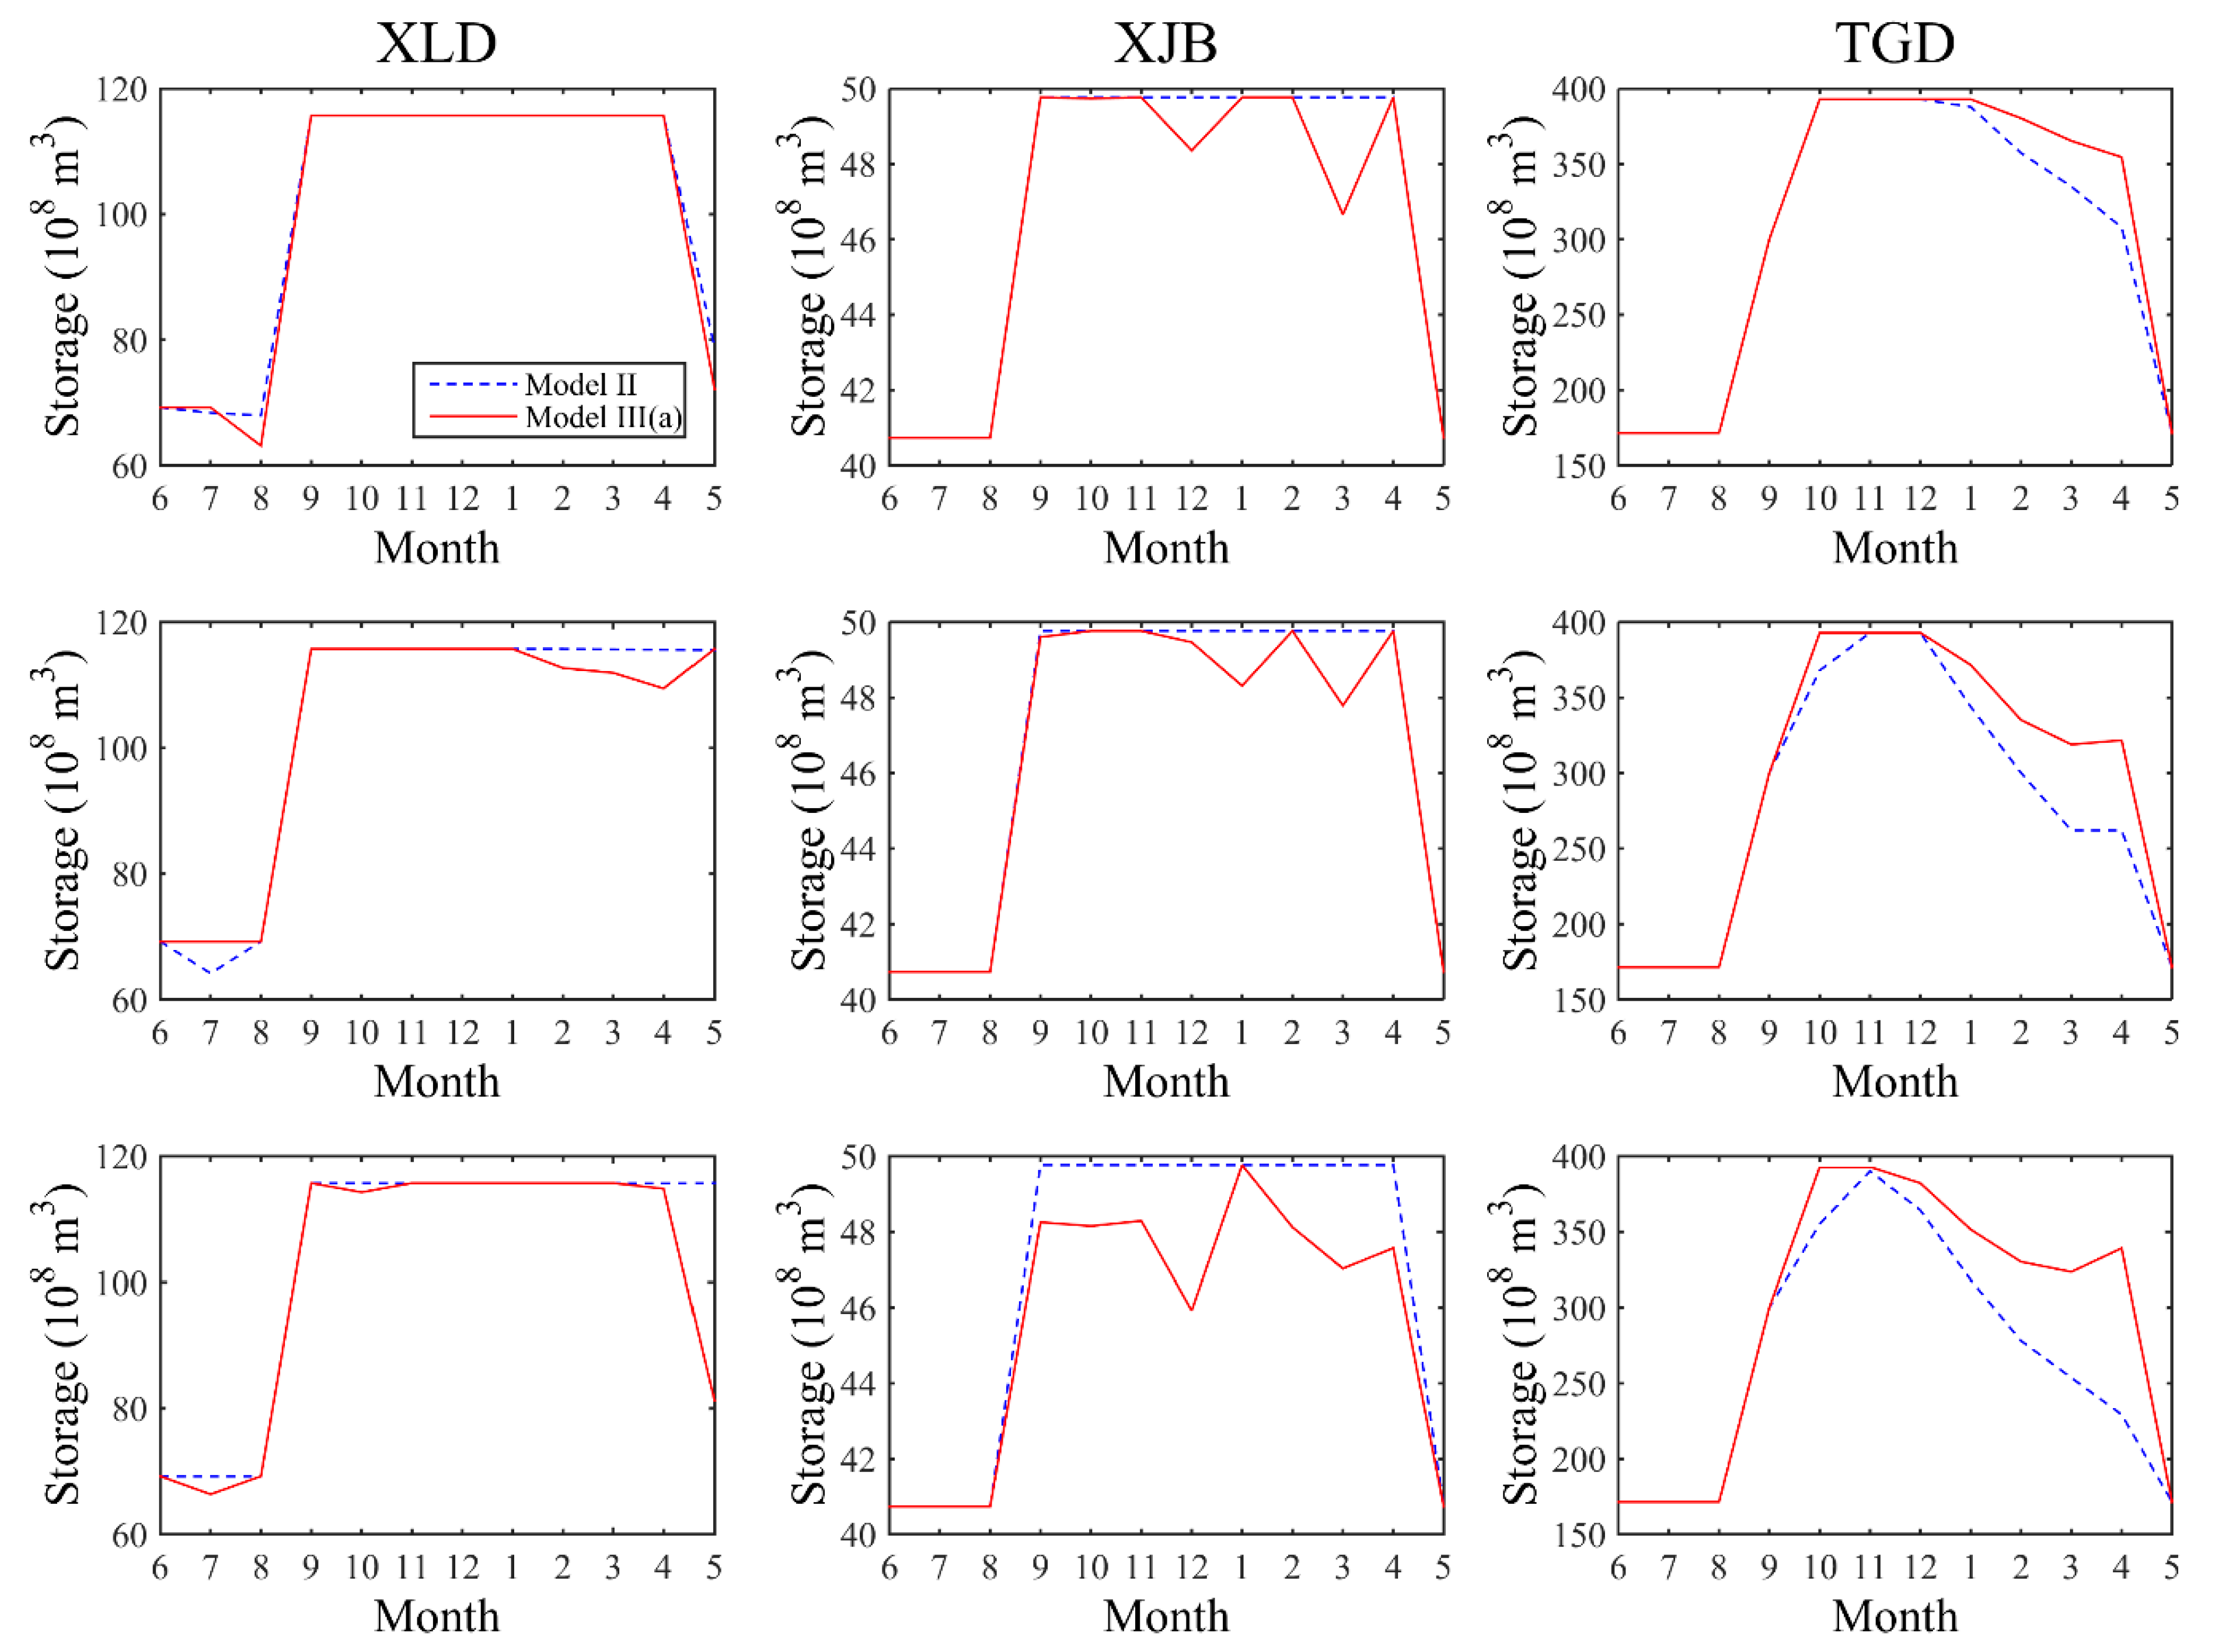
Figure 7 shows the storage of cascade reservoirs based on Models II and III(a) under the three flow scenarios. As shown in the figure, through coordination between upstream and downstream reservoirs, the storage levels of upstream reservoirs (the XLD and XJB reservoirs) are reduced and the storage levels of the downstream reservoir (the TGD) are increased. Because of available water withdrawn by upstream reservoirs based on Model III(a), the amount of water flowing into the downstream reservoirs is increased [35]. It is indicated that through coordination, the hydropower generation of the downstream reservoir is improved by scarifying the priority of the upstream reservoir in generating hydropower.
Figure 8 shows the percentage changes of individual hydropower generation obtained by Model III(a) with respect to Model II under the three flow scenarios. It is indicated that as the available water decreases, the hydropower generation of Coalition 2 is improved by sacrificing more hydropower generation of Coalition 1.
By calculating the improvement index, when the hydropower generation of Coalition 1 is decreased by one unit, the hydropower generation of Coalition 2 is increased by 4.07 unit, 2.63 unit, and 2.07 unit for the three flow scenarios, respectively. It is indicated that the incremental hydropower generation of downstream reservoirs, induced by the unit hydropower generation decrement of upstream reservoirs, is limited as the available water decreases. Therefore, the shortage of available water has a negative effect on the improvement index of the hydropower generation of Coalition 2 through coordination.
4.2.2. Benefits Compensation Assessment
As mentioned above, through coordination, the hydropower generation of upstream coalition is slightly sacrificed to significantly improve the hydropower generation of downstream coalition. Therefore, the total hydropower generation of the cascade-reservoir system is increased by Model III, compared to that obtained by Model II. To maintain continuous coordination, the loss in hydropower generation of upstream reservoirs is compensated by the incremental system’s hydropower generation based on Nash-Harsanyi bargaining theory.
The revised hydropower generation based on Nash-Harsanyi bargaining theory for participating reservoirs under the three flow scenarios is presented in Table 5. As shown in Table 5, for a specific flow scenario, the hydropower generation of each reservoir obtained by Model III(a) (taken from Table 4) is indicated by the first term in the parentheses, and the revised hydropower generation of each reservoir obtained by Model III(b) is indicated by the other term. It is noted that the total hydropower generation of all reservoirs is unchanged before and after the compensation process, which is higher than that obtained by Model II. In this section, the hydropower generation of TGD is not increased. Instead, the incremental hydropower generation of the TGD is reallocated to the other reservoirs that sacrifice hydropower generation through coordination. For example, for the low flow scenario, the TGD must pay to the XLD reservoir, to the XJB reservoir, and to the GZB reservoir. Therefore, the revised hydropower generation for each reservoir is higher than that obtained by its non-cooperative and centralized mode (taken from Table 4).
Through the proposed game-theoretical model, the total hydropower generation of the whole system is closer to the ideal solution obtained by the centralized model compared to that obtained by the non-cooperative model, and the rational individual hydropower generation of each reservoir is also guaranteed. These findings are consistent with the conclusions of Xiao et al. [36]. It is highlighted that a “win-win” situation for the individual and system’s hydropower generation of the cascade-reservoir system will be achieved by the integrated game-theoretical model.
4.3. Factors Affecting the Efficiency of Coordination
To explore the factors affecting the efficiency of coordination, the integrated game-theoretical model is applied in different coordination patterns of cascade reservoirs. For Pattern I, the coordination could occur between the XLD and XJB reservoirs, whereas the TGD and GZB reservoirs have to adapt to the decisions made by upstream reservoirs. For Pattern II, the decisions made by the XLD reservoir are aimed at maximizing its own benefits autonomously. Based on the decisions made by the XLD reservoir, the coordination could occur between the XJB reservoir and Coalition 2 (including the TGD and GZB reservoir). When there is coordination in Patterns I or II, the strategy spaces of participating reservoirs (or coalitions) and system-wide optimality of Nash equilibrium strategies are determined by the factors mentioned in Section 3.5 and Section 4.1.
Table 6 shows the hydropower generation of the XLD and XJB reservoirs in Pattern I based on Models II and III under the three flow scenarios. Compared to Model II, the hydropower generation of the XLD reservoir obtained by Model III(a) is reduced by , , and for the three flow scenarios, respectively; on the other hand, the hydropower generation of the XJB reservoir obtained by Model III(a) is increased by , , and for the three flow scenarios, respectively. The decreased hydropower generation of the XLD reservoir cannot be compensated by the increased hydropower generation of the XJB reservoir. Therefore, for the three flow scenarios, the total hydropower generation of the XLD and XJB reservoirs obtained by Model III(a) is (0.50%), (0.93%), and (1.09%) lower than that obtained by Model II.
Different from the coordination between Coalition 1 (XLD-XJB reservoirs) and Coalition 2 (TGD-GZB reservoirs), for the coordination in Pattern I, the regulation capacity of the upstream reservoir (the XLD reservoir) is significantly higher than that of the downstream reservoir (the XJB reservoir) (shown in Table 1). Scarifying the benefits of the upstream reservoir with a high regulation capacity to improve the benefits of the downstream reservoir with a low regulation capacity may result in a loss in the system’s benefits.
Table 6 also shows the hydropower generation of the XJB reservoir and Coalition 2 in Pattern II based on Models II and III under the three flow scenarios. As shown in Table 6, based on Model III(a), the priority of the XJB reservoir in hydropower generation is scarified to improve the hydropower generation of Coalition 2, and the total hydropower generation is higher than that obtained by Model II. Due to the incremental system’s hydropower generation, the rational individual benefits can be guaranteed by Model III(b).
By calculating the improvement index for the coordination in Pattern II under the three flow scenarios, when the hydropower generation of the XJB reservoir is decreased by one unit, the hydropower generation of Coalition 2 is improved by 3.21 units, 2.07 units, and 1.98 units. Compared to the coordination between Coalitions 1 and 2, the incremental hydropower generation of Coalition 2, induced by the unit hydropower generation decrement of the XJB reservoir, is lower than that induced by the unit hydropower generation decrement of Coalition 1. It is indicated that a higher regulation capacity of the upstream reservoir facilitates more hydropower generation growth for the downstream reservoir.
5. Conclusions
This study proposed an integrated game-theoretical model to simulate the competition and cooperation behaviors among different reservoir operators for a cascade-reservoir system. The integrated game-theoretical model consisted of two sub-models: a coordination model based on the Stackelberg theory and a benefits compensation model based on the Nash-Harsanyi bargaining theory. The coordination model was used to interpret the coordination among reservoirs, while the benefits compensation model was applied for benefits compensation for participating reservoirs to ensure rational individual benefits. Additionally, potential factors affecting the efficiency of the integrated game-theoretical model were also explored in this study. A cascade-reservoir system located in the Yangtze River basin of China was used as a case study. The main conclusions of this study were as follows.
Through the proposed integrated game-theoretical model, the cascade-reservoir operation will result in a “win-win” situation for the individual and system’s hydropower generation. In terms of the system’s hydropower generation, the total hydropower generation of the cascade-reservoir system obtained by the integrated game-theoretical model is better than that obtained by the non-cooperative model, and comparable to that obtained by the centralized model. In terms of the rational individual benefits, the integrated game-theoretical model clearly outperforms the other two models.
The operation of the integrated game-theoretical model is influenced by water availability variation. For the integrated game-theoretical model, as the available water decreases, more hydropower generation of upstream reservoirs is sacrificed to improve the hydropower generation of downstream reservoirs; whereas, the incremental hydropower generation of downstream reservoirs, induced by the unit hydropower generation decrement of upstream reservoirs, is reduced. If there is no increment in the system’s hydropower generation, the benefits compensation is not implemented.
The regulation capacities of cascade reservoirs have an impact on the operation efficiency of the integrated game-theoretical model. For the integrated game-theoretical model, a high regulation capacity of the upstream reservoir facilities the growth of hydropower generation of the downstream reservoir; however, if the regulation capacity of the upstream reservoir is significantly higher than the regulation capacity of the downstream reservoir, the coordination between them may result in a loss in the total hydropower generation of the cascade-reservoir system.
The study reveals that the integrated game-theoretical model strikes an excellent balance between individual and overall hydropower generation for a cascade-reservoir system. Although the system’s hydropower generation is not maximized by the integrated game-theoretical model, the balanced individual and system’s hydropower generation are practical and stable when reservoir operators are not in full cooperation in the real-world operation. Moreover, compared to the system’s strategies, the computation needed to obtain strategies for individual reservoirs (or reservoir coalition) is less. Therefore, the coordination can be practically quantified for a complex cascade-reservoir operation with information exchange between upstream and downstream reservoirs. The main uncertainty source of the proposed model originates from the strategy selection of the upstream coalition. To control the uncertainty source, the diversity of strategies of the upstream coalition should be enriched. For future studies, the integrated game-theoretical model can be extended to deal with the coordination among reservoir operators when the run-off is uncertainty.
Author Contributions
Conceptualization, Y.X. and X.F.; Methodology, Y.X. and X.F.; Software, Y.X.; Validation, Y.X. and X.F.; Formal Analysis, Y.X.; Investigation, J.Q.; Resources, Y.X. and X.F.; Data Curation, Y.X. and J.Q.; Writing-Original Draft Preparation, Y.X.; Writing-Review & Editing, X.F.; Visualization, Y.X.; Supervision, X.F.; Project Administration, X.F.; Funding Acquisition, X.F.
Funding
This study was supported by the National Key Research and Development Program (No. 2016YFC0401306) and National Natural Science Foundation of China (No. 91647204).
Conflicts of Interest
The authors declare no conflict of interest.
References
- Shen, Y.; Chen, Y. Global perspective on hydrology, water balance, and water resources management in arid basins. Hydrol. Process. 2010, 24, 129–135. [Google Scholar] [CrossRef]
- Zhang, R.; Duan, Z.; Tan, M.; Chen, X. The assessment of water stress with the water poverty index in the Shiyang River basin in China. Environ. Earth Sci. 2012, 67, 2155–2160. [Google Scholar] [CrossRef]
- Giuliani, M.; Castelletti, A. Assessing the value of cooperation and information exchange in large water resources systems by agent-based optimization. Water Resour. Res. 2013, 49, 3912–3926. [Google Scholar] [CrossRef] [Green Version]
- Cai, W.; Zhang, L.; Zhu, X.; Zhang, A.; Yin, J.; Wang, H. Optimized reservoir operation to balance human and environmental requirements: A case study for the Three Gorges and Gezhouba Dams, Yangtze River basin, China. Ecol. Inform. 2013, 18, 40–48. [Google Scholar] [CrossRef]
- Zhou, Y.; Guo, S. Incorporating ecological requirement into multipurpose reservoir operating rule curves for adaptation to climate change. J. Hydrol. 2013, 498, 153–164. [Google Scholar] [CrossRef]
- Fallah-Mehdipour, E.; Haddad, O.B.; Mariño, M.A. Evaluation of stakeholder utility risk caused by the objective functions in multipurpose multireservoir systems. J. Irrig. Drain. Eng. 2014, 141, 04014047. [Google Scholar] [CrossRef]
- Xu, Y.; Mei, Y. A modified water cycle algorithm for long-term multi-reservoir optimization. Appl. Soft Comput. 2018, 71, 317–332. [Google Scholar] [CrossRef]
- Madani, K. Game theory and water resources. J. Hydrol. 2010, 381, 225–238. [Google Scholar] [CrossRef]
- Yang, Y.C.; Cai, X.; Stipanović, D.M. A decentralized optimization algorithm for multiagent system–based watershed management. Water Resour. Res. 2009, 45, W08430. [Google Scholar] [CrossRef]
- Yang, Y.C.E.; Zhao, J.; Cai, X. Decentralized optimization method for water allocation management in the Yellow River basin. J. Water Res. Plan. Man. 2012, 138, 313–325. [Google Scholar] [CrossRef]
- Akhbari, M.; Grigg, N.S. A framework for an agent-based model to manage water resources conflicts. Water Resour. Manag. 2013, 27, 4039–4052. [Google Scholar] [CrossRef]
- Giuliani, M.; Castelletti, A.; Amigoni, F.; Cai, X. Multiagent systems and distributed constraint reasoning for regulatory mechanism design in water management. J. Water Res. Plan. Man. 2015, 141, 04014068. [Google Scholar] [CrossRef]
- Madani, K. Hydropower licensing and climate change: Insights from cooperative game theory. Adv. Water Resour. 2011, 34, 174–183. [Google Scholar] [CrossRef]
- Salazar, R.; Szidarovszky, F.; Coppola, E., Jr.; Rojano, A. Application of game theory for a groundwater conflict in Mexico. J. Environ. Manag. 2007, 84, 560–571. [Google Scholar] [CrossRef]
- Chew, I.M.L.; Tan, R.R.; Foo, D.C.Y.; Chiu, A.S.F. Game theory approach to the analysis of inter-plant water integration in an eco-industrial park. J. Clean. Prod. 2009, 17, 1611–1619. [Google Scholar] [CrossRef]
- Salazar, R.; Szidarovszky, F.; Rojano, A. Water distribution scenarios in the Mexican valley. Water Resour. Manag. 2010, 24, 2959–2970. [Google Scholar] [CrossRef]
- Hipel, K.W.; Walker, S.B. Conflict analysis in environmental management. Environmetrics 2011, 22, 279–293. [Google Scholar] [CrossRef]
- Huang, X.; Chen, X.; Huang, P. Research on fuzzy cooperative game model of allocation of pollution discharge rights. Water 2018, 10, 662. [Google Scholar] [CrossRef]
- Madani, K.; Lund, J.R. A monte-carlo game theoretic approach for multi-criteria decision making under uncertainty. Adv. Water Resour. 2011, 34, 607–616. [Google Scholar] [CrossRef]
- Madani, K.; Hooshyar, M. A game theory–reinforcement learning (GT–RL) method to develop optimal operation policies for multi-operator reservoir systems. J. Hydrol. 2014, 519, 732–742. [Google Scholar] [CrossRef]
- Kicsiny, R.; Piscopo, V.; Scarelli, A.; Varga, Z. Dynamic stackelberg game model for water rationalization in drought emergency. J. Hydrol. 2014, 517, 557–565. [Google Scholar] [CrossRef]
- Wang, X.; Wang, G.; Wu, Y.; Xu, Y.; Gao, H. Comprehensive assessment of regional water usage efficiency control based on game theory weight and a matter-element model. Water 2017, 9, 113. [Google Scholar] [CrossRef]
- Yang, B.; Lai, C.; Chen, X.; Wu, X.; He, Y. Surface water quality evaluation based on a game theory-based cloud model. Water 2018, 10, 510. [Google Scholar] [CrossRef]
- Zhang, R.; Zhou, J.Z.; Yuan, L.; Zhang, Y.C. Study on dry season operation of cascade reservoir in Jinsha River. J. Hydraul. Eng. 2013, 44, 1399–1408. [Google Scholar] [CrossRef]
- Stackelberg, H.V. Marktform und Gleichgewicht; Springer: Vienna, Austria, 1934. [Google Scholar]
- Szidarovszky, F.; Molnár, S.; Okuguchi, K. An n-person stackelberg leader-leader model. Appl. Math. Comput. 1991, 46, 221–232. [Google Scholar] [CrossRef]
- Nie, P.Y.; Chen, L.H.; Fukushima, M. Dynamic programming approach to discrete time dynamic feedback Stackelberg games with independent and dependent followers. Eur. J. Oper. Res. 2006, 169, 310–328. [Google Scholar] [CrossRef]
- Nash, J. Two person cooperative games. Econometrica 1953, 21, 128–140. [Google Scholar] [CrossRef]
- Harsanyi, J.C. A Bargaining Model for Cooperative n-Person Games; Citeseer: State College, PA, USA, 1958. [Google Scholar]
- Madani, K.; Dinar, A. Cooperative institutions for sustainable common pool resource management: Application to groundwater. Water Resour. Res. 2012, 48, 57–76. [Google Scholar] [CrossRef]
- Fu, J.; Zhong, P.A.; Zhu, F.; Chen, J.; Wu, Y.; Xu, B. Water resources allocation in transboundary river based on asymmetric Nash-Harsanyi Leader-Follower game model. Water 2018, 10, 270. [Google Scholar] [CrossRef]
- Girard, C.; Rinaudo, J.; Pulido-Velazquez, M. Sharing the cost of a river basin adaptation portfolios to climate change: Insights from social justice and cooperative game theory. Water Resour. Res. 2016, 52, 7945–7962. [Google Scholar] [CrossRef]
- Han, Q.; Tan, G.; Fu, X.; Mei, Y.; Yang, Z. Water resource optimal allocation based on multi-agent game theory of HanJiang river basin. Water 2018, 10, 1184. [Google Scholar] [CrossRef]
- Holland, J.H. Adaptation in Natural and Artificial Systems; MIT Press: Cambridge, MA, USA, 1992; Volume 6, pp. 126–137. [Google Scholar]
- Schlüter, M.; Leslie, H.; Levin, S. Managing water-use trade-offs in a semi-arid river delta to sustain multiple ecosystem services: A modeling approach. Ecol. Res. 2009, 24, 491–503. [Google Scholar] [CrossRef]
- Xiao, Y.; Fang, L.; Hipel, K.W. Centralized and decentralized approaches to water demand management. Water 2018, 10, 3466. [Google Scholar] [CrossRef]
Figure 1.
Geographical location of the cascade-reservoir system.

Figure 2.
A diagrammatic sketch of the game-theoretical model for cascade-reservoir system.

Figure 3.
Flowchart of the solving process of the game-theoretical model: (a) coordination model; (b) benefits compensation model.
Figure 3.
Flowchart of the solving process of the game-theoretical model: (a) coordination model; (b) benefits compensation model.


Figure 4.
Solutions of the cascade-reservoir operation through the coordination model: (a1) strategies of two coalitions under the high flow scenario; (b1) strategies of two coalitions under the medium flow scenario; (c1) strategies of two coalitions under the low flow scenario; (a2) best response curves of coalitions under the high flow scenario; (b2) best response curves of coalitions under the medium flow scenario; and (c2) best response curves of coalitions under the low flow scenario.

Figure 5.
Total hydropower generation of cascade-reservoir system based on Nash equilibrium strategies: (a) high flow scenario; (b) medium flow scenario; (c) low flow scenario.
Figure 5.
Total hydropower generation of cascade-reservoir system based on Nash equilibrium strategies: (a) high flow scenario; (b) medium flow scenario; (c) low flow scenario.

Figure 6.
Hydropower generation deviations of four reservoirs obtained based on Model III(a) compared to Model II.
Figure 6.
Hydropower generation deviations of four reservoirs obtained based on Model III(a) compared to Model II.

Figure 7.
Storage of cascade reservoirs based on Models II and III(a) under the three flow scenarios.
Figure 7.
Storage of cascade reservoirs based on Models II and III(a) under the three flow scenarios.

Figure 8.
Percentage changes of the hydropower generation of two coalitions obtained by Model III(a) under the three flow scenarios, compared to Model II.
Figure 8.
Percentage changes of the hydropower generation of two coalitions obtained by Model III(a) under the three flow scenarios, compared to Model II.


Table 1.
Primary characteristic parameters of the cascade-reservoir system.
| Reservoir | XLD | XJB | TGD | GZB |
|---|---|---|---|---|
| Normal water level (m) | 600 | 380 | 175 | 66 |
| Flood limit water level (m) | 560 | 370 | 145 | 64.5 |
| Dead water level (m) | 540 | 370 | 145 | 62 |
| Firm power (MW) | 3790 | 2009 | 4990 | 1130.5 |
| Install capacity (MW) | 12,600 | 6000 | 22,500 | 2940 |
| Output coefficient | 8.7 | 8.7 | 8.8 | 8.5 |
Table 2.
The statistics of observed data in Pingshan station and Yichang station.
| Statistics | Hydrological Station | |
|---|---|---|
| Pinshan Station | Yichang Station | |
| maximum daily flow (m3/s) | 16,964.52 | 50,312.90 |
| coefficient of variation | 0.15 | 0.10 |
| z test | 0.85 | −2.35 |
Note: the trend in annual flow is investigated by the Mann-Kendall test. When the absolute value of z is less than 1.64 (), the series of observed data changes slightly; otherwise, the series of observed data changes significantly. indicates the upward trend, and indicates the downward trend.
Table 3.
List of parameter values of GA.
| Parameters | Value |
|---|---|
| Iteration | 500 |
| Population | 100 |
| Crossover rate | 0.8 |
| Mutation rate | 0.1 |
Table 4.
The individual and overall hydropower generation of cascade-reservoir system based on the three models under the three flow scenarios.
Table 4.
The individual and overall hydropower generation of cascade-reservoir system based on the three models under the three flow scenarios.
| Reservoirs | |||||||||
|---|---|---|---|---|---|---|---|---|---|
| Model I | Model II | Model III(a) | Model I | Model II | Model III(a) | Model I | Model II | Model III(a) | |
| XLD | 702.96 | 705.19 | 703.33 | 581.93 | 582.74 | 580.87 | 512.01 | 513.77 | 508.00 |
| XJB | 346.23 | 344.99 | 345.98 | 292.50 | 292.42 | 291.00 | 258.38 | 258.28 | 255.97 |
| TGD | 1003.23 | 997.96 | 1002.26 | 981.93 | 973.39 | 982.81 | 810.17 | 795.36 | 813.28 |
| GZB | 184.71 | 185.68 | 184.92 | 179.04 | 179.37 | 178.61 | 164.61 | 165.45 | 164.22 |
| Total | 2237.13 | 2233.82 | 2236.49 | 2035.40 | 2027.92 | 2033.29 | 1745.17 | 1732.86 | 1741.47 |
Note: Models I and II indicate the centralized model and non-cooperative model; Model III(a) indicates the coordination model.
Table 5.
Hydropower generation of each reservoir based on Nash-Harsanyi bargaining theory under the three flow scenarios.
Table 5.
Hydropower generation of each reservoir based on Nash-Harsanyi bargaining theory under the three flow scenarios.
| Reservoirs | ||||||
|---|---|---|---|---|---|---|
| Model III(a) | Model III(b) | Model III(a) | Model III(b) | Model III(a) | Model III(b) | |
| XLD | 703.33 | 705.86 (703.33 + 2.53) | 580.87 | 584.08 (580.87 + 3.21) | 508.00 | 515.92 (508.00 + 7.92) |
| XJB | 345.98 | 345.65 (345.98 − 0.33) | 291.00 | 293.76 (291.00 + 2.76) | 255.97 | 260.43 (255.97 + 4.46) |
| TGD | 1002.26 | 998.63 (1002.26 − 3.63) | 982.81 | 974.73 (982.81 − 8.08) | 813.28 | 797.52 (813.28 − 15.76) |
| GZB | 184.92 | 186.35 (184.92 + 1.43) | 178.61 | 180.72 (178.61 + 2.11) | 164.22 | 167.60 (164.22 + 3.38) |
Note: Model III(b) indicates the benefits compensation model.
Table 6.
Hydropower generation of the participating reservoirs based on Models II and III under the three flow scenarios.
Table 6.
Hydropower generation of the participating reservoirs based on Models II and III under the three flow scenarios.
| Patterns | Reservoir | High Flow (108 kW·h) | Medium Flow (108 kW·h) | Low Flow (108 kW·h) | ||||||
|---|---|---|---|---|---|---|---|---|---|---|
| Model II | Model III(a) | Model III(b) | Model II | Model III(a) | Model III(b) | Model II | Model III(a) | Model III(b) | ||
| Pattern I | XLD | 705.19 | 696.98 | - | 582.74 | 573.42 | - | 513.77 | 504.14 | - |
| XJB | 344.99 | 347.92 | - | 292.42 | 293.56 | - | 258.28 | 259.51 | - | |
| Total | 1050.19 | 1044.90 | - | 875.16 | 866.98 | - | 772.05 | 763.65 | - | |
| Pattern II | XJB | 344.99 | 343.98 | 346.11 | 292.42 | 288.33 | 294.60 | 258.28 | 251.04 | 261.81 |
| Coalition 2 | 1183.64 | 1186.89 | 1184.76 | 1152.77 | 1161.23 | 1154.96 | 960.82 | 975.12 | 964.35 | |
| Total | 1528.63 | 1530.87 | 1530.87 | 1445.19 | 1449.56 | 1449.56 | 1219.10 | 1226.16 | 1226.16 | |
Note: Pattern I indicates the operation of the XLD reservoir and XJB reservoir based on Models II or III; Pattern II indicates the operation of the XJB reservoir and Coalition 2 based on Models II or III.
© 2018 by the authors. Licensee MDPI, Basel, Switzerland. This article is an open access article distributed under the terms and conditions of the Creative Commons Attribution (CC BY) license (http://creativecommons.org/licenses/by/4.0/).
Share and Cite
MDPI and ACS Style
Xu, Y.; Fu, X.; Qin, J. Qualifying Coordination Mechanism for Cascade-Reservoir Operation with a New Game-Theoretical Methodology. Water 2018, 10, 1857. https://doi.org/10.3390/w10121857
AMA Style
Xu Y, Fu X, Qin J. Qualifying Coordination Mechanism for Cascade-Reservoir Operation with a New Game-Theoretical Methodology. Water. 2018; 10(12):1857. https://doi.org/10.3390/w10121857
Chicago/Turabian StyleXu, Yuni, Xiang Fu, and Jianan Qin. 2018. "Qualifying Coordination Mechanism for Cascade-Reservoir Operation with a New Game-Theoretical Methodology" Water 10, no. 12: 1857. https://doi.org/10.3390/w10121857
Note that from the first issue of 2016, this journal uses article numbers instead of page numbers. See further details here.