Addressing Gaps in Environmental Water Policy Issues across Five Mediterranean Freshwater Protected Areas


Department of Civil Engineering, Democritus University of Thrace, Xanthi 67100, Greece
*
Author to whom correspondence should be addressed.
Water 2018, 10(12), 1853; https://doi.org/10.3390/w10121853
Submission received: 12 November 2018
/
Revised: 11 December 2018
/
Accepted: 12 December 2018
/
Published: 14 December 2018
(This article belongs to the Special Issue Insights on the Water–Energy–Food Nexus)
Abstract
:The increasing pressure on water resources in Europe’s broader area led member states to take measures and adopt a common legislative “umbrella” of directives to protect them. The aim of this research is to investigate practicing deficiencies, information lacks and distances from optimal status as set by the Water Framework Directive and supporting water uses. This contributes to the improvement of the efficiency and harmonization of all environmental goals especially when management of Protected Areas is addressed. Gap analysis, an approach that reveals the distance between current and desired level, was carried out, targeting five Mediterranean hydro-ecosystems, covering three major water policy pillars “Monitoring Practices”, “Management Practices” and “Water Quality and Pressures”. Data for such analyses was collected by literature research supported by a query matrix. The findings revealed a lack in compliance with the Water Framework Directive regarding the “Monitoring Practices” and several deficiencies in sites burdened by eutrophication and human pressures on “Water Quality and Pressures” field. As for “Management Practices”, extra effort should be applied in all hydro-ecosystems to reach the desirable state. We suggest that gap analysis, as a harmonization tool, can unify apparently different areas under the same goals to reveal the extra necessary “investment”.
1. Introduction
Europe encloses water landscapes which are often dominated by various phenomena depending on regional characteristics and pressures. Such may be water scarcity, flood events, resource overexploitation for agriculture, forestry or aquaculture, pollution, seawater intrusion, severe hydromorphological changes and large-scale infrastructure. At the European Union (EU) level, freshwater policy derives mainly from two major Directives: the Water Framework Directive—WFD (2000/60/European Commission (EC)) that calls for “good ecological status” and the Habitats Directive (92/43/European Economic Community), targeting the network of the Natura 2000 protected areas (PAs) that calls for “favorable conservation status”. Directives bound the member states with results to be achieved, but each state can choose the methods for their implementation. Yet, water policy is also influenced by the Groundwater (2006/118/EC) and the Floods (2007/60/EC) Directives.
The water policy literature emphasizes the need for wide participation across institutions, at multiple levels (European, national, regional and local), in order to guarantee effective implementation and harmonization across EU countries [1,2,3]. The task becomes more difficult when it comes to managing water bodies in freshwater PAs, which are also designated as nature reserves (i.e., enlisted in the Natura 2000 network). That is because such areas have to respect the “umbrella” of EU directives, national legislations for PAs management and statutory limits for each resource usage. Under these circumstances, knowledge on various aspects and concerted effort of the involved decision-makers that can determine the outcomes of a local management plan is very valuable. Protected freshwater areas, ecologically healthy and well managed, are essential ecosystems for securing the provision of freshwater services [4,5], while, very often they consist an important component of the whole river basin district [6], requiring wider management policies. Since the conservation goals of a Natura 2000 site and the environmental objectives of a water body, under the WFD, are often overlapping, the establishment of a tailor-designed, integrated monitoring programme, able to provide all the necessary information to build a body of knowledge, becomes of prime importance. Moreover, dealing with more than one legislative tool requires harmonization and constant re-evaluation to improve personnel, money and time efficiency. Evaluating the human pressures and implementing policy measures through the improvement of monitoring and management practices is a major challenge all over the world [7].
Focusing on the Mediterranean region, the acknowledgement of: (a) the additional stress due to water scarcity along with the high human pressure and (b) the structural and functional diversity of protected freshwater ecosystems, have been recently reflected in various research activities [8,9]. This may have profound practical consequences on water bodies’ management and policy strategies, identifying the best management practices under multiple stressors’ conditions, thus providing potentially useful information applicable to freshwater ecosystems.
Despite all the efforts and sound objectives in the European water policy legislation, progress in implementing the existing directives is slower than expected in many Mediterranean cases [10,11,12,13,14]. At the same time, the gaps between science and policy highlight the scarce development of efficient tools and models to be transferred towards policy implementation. This could be attributed to the lack of synthesis of a broad range of observations across water policy institutions or to the absence of common qualitative objectives which must be translated to quantitative targets. Socio-economic factors and political constraints also play a crucial role both at the Mediterranean and at a national level concerning the design and implementation of water policy. Stakeholder involvement is not only regarded as an essential element in environmental management and decision making [15], but it is also considered as critical in the context of ecosystem services [16,17,18]. Nowadays, it is a widely shared opinion that under conditions of complexity, uncertainty and difficulty of evaluation, common to many environmental problems, public participation has an important role in decision-making.
The overall objective of this research, included in the Interreg-MED 2014–2020 funded project entitled “Ecological sustainable Governance of Mediterranean protected areas via improved scientific, technical and managerial knowledge base” (EcoSUSTAIN), is to improve monitoring, management and networking, with the assistance of Information and Communication Technologies (ICT), of five freshwater ecosystems which are enlisted in the catalogue of the European PAs and National Parks (NP), thus the need for effective management and conservation is highly demanded. In order to achieve the main objective, the gap between current and desired level of several water governance factors were assessed. The paper presents the monitoring and the management strategy along with the mapping of pressures across these five areas.
A prerequisite in addressing this issue is the estimation of the existing knowledge that the Management Bodies (MB) of each PA obtain on monitoring and water-quality status, in comparison to each ecosystem’s needs. In undertaking a gap analysis, as used in business and management planning processes literature, clearly, the addressed question is “where we are and where we want to be”. Gap analysis is a powerful and efficient step towards setting management priorities especially concerning protected areas. It provides focus, direction and accountability for improving management efforts as a diagnostic tool. It is a tool of broad use adopted by several organizations (i.e., the World Health Organization (WHO, the United Nations International Children’s Emergency Fund (Unicef), the International Union for Conservation of Nature (IUCN)) [19,20,21] for various reasons with biodiversity and natural resources protection among them. Biodiversity or qualitative elements identified as “missing” through a gap analysis can then be examined more closely for their improvement and to support stakeholders’ work with biodiversity related data [22,23]. Gap analysis, as a method for identifying ‘gaps’ in land and water conservation practices has been applied in many studies [24,25,26]. The USA has applied a vast gap analysis project attempting to assess the status of the nation’s biodiversity [27]. Gap analysis has been performed during the environmental planning processes in Victoria-Australia [28], in Ohio nature reserve design [29] as well as in many other cases [22,30] dealing mostly with PA and PA networks management and used also as a mean to improve the overall level of water services [31].
In our research, gap analysis was selected for use since it is considered as an appropriate method to assess the conservation status (of protected areas, reserves, habitats, species) and to identify and evaluate priorities, thus providing information to decision makers. It is a novel, broadly accepted approach based on Burley’s [32] and Scott’s [33] concepts for the “identification of conservation gaps as a process to identify and classify the various elements of biodiversity and examine the existing system of protected areas”. Conservation and management prioritization methods usually perform gap analyses when a need to review or expand management plans exits.
Gap analysis is carried out as a comparison of actual performance with potential or desired performance [34,35,36] and not as a massive geographic information system (GIS)-based analysis for terrestrial areas like ecotopes [33]. In our case we adopt gap analysis as a “bottom-up” approach, described as one step procedure towards a comprehensive natural resource management planning effort. This approach transcends political boundaries [37,38,39] and allows creativity and collaboration at state and local level, where most land management decisions are made [40]. It is used, firstly, as a simple tool to assist the quantification of the gap between present and desired level of knowledge on fundamental aspects of WFD- and PA-related directives and, secondly, to periodically review and monitor the level of compliance [41].
Also, beside the deep insight on these three major water governance pillars in five PAs, a base is provided on which we can develop optimization scenarios for better PA operation accounting also for socioeconomic parameters. As a next step, the gap analysis could be integrated in a regional/national planning process beyond the boundaries of the protected areas. Working on gap analysis, freshwater ecologists, planners and environmentalists are cooperating towards effective conservation and management practices.
2. Materials and Methods
2.1. Description of the Study Areas
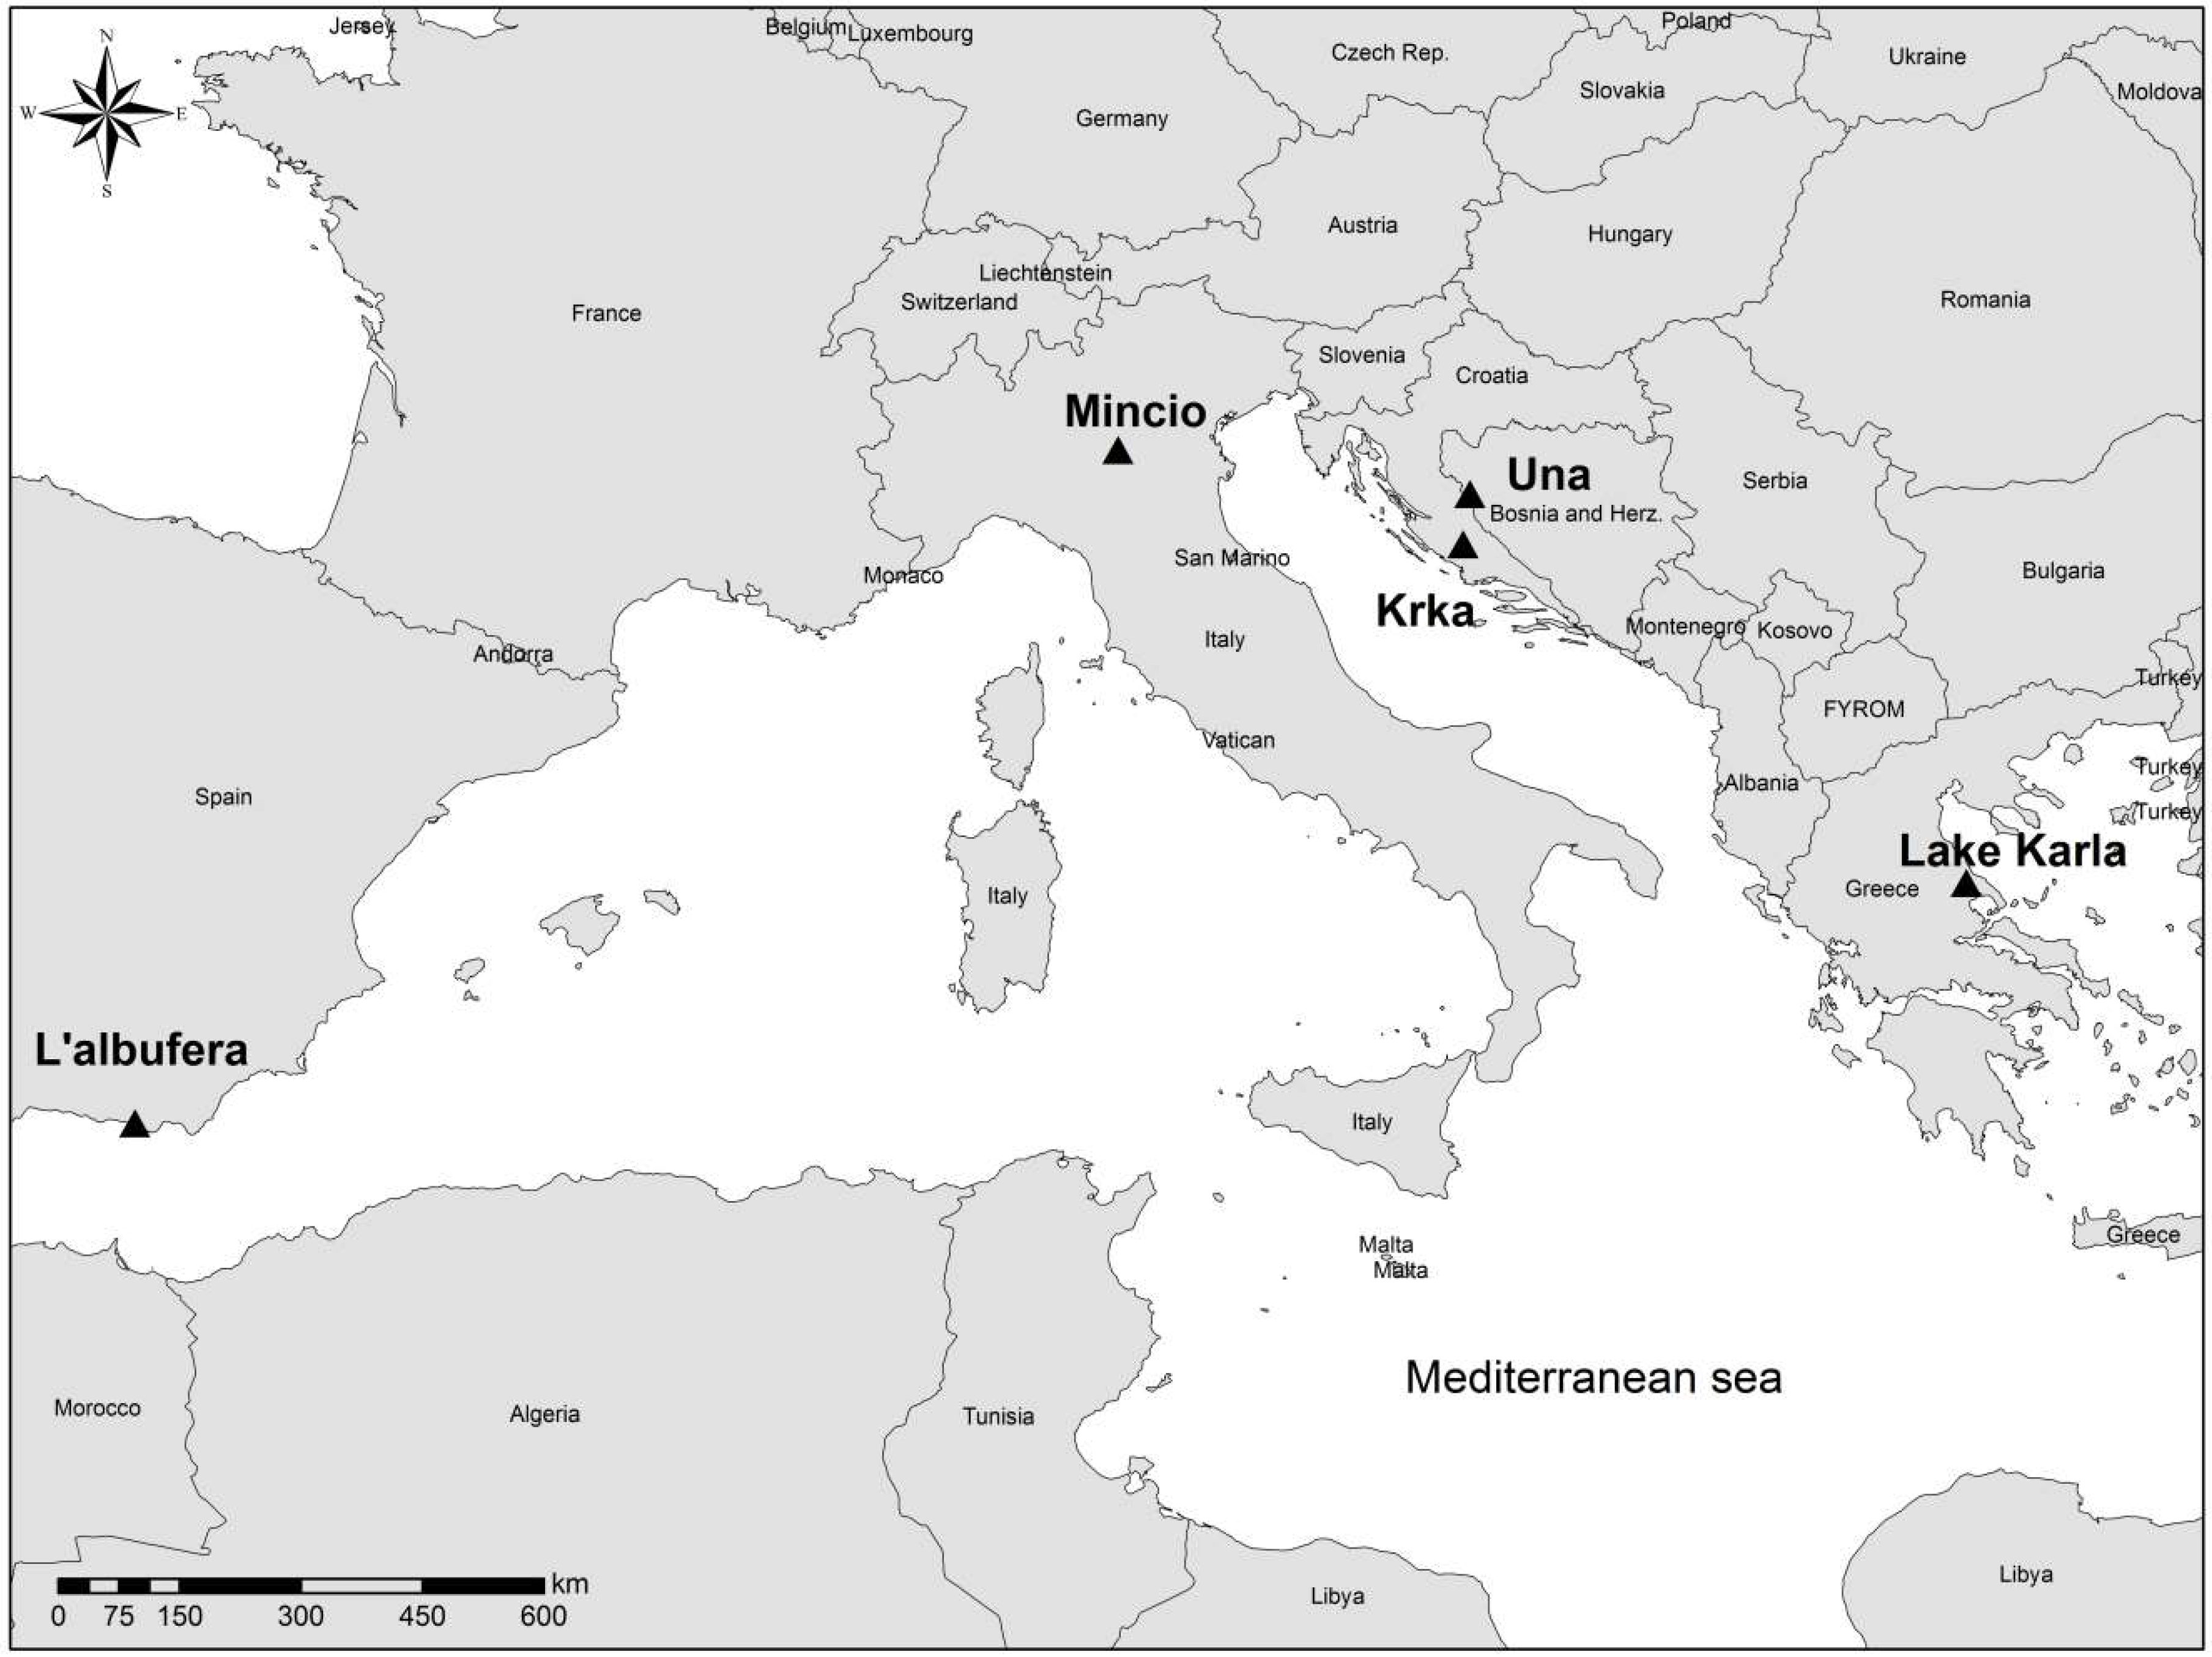
Five freshwater ecosystems (Figure 1) that are enlisted under the network of Natura 2000 and located in European NPs of the Mediterranean region are set as study sites:
- Lake Albufera in L’ Albufera Natural Park—Valencia, Spain
- Lake Visovac in Krka National Park—Šibenik, Croatia
- Mantua Lakes in Mincio Regional Park—Mantova, Italy
- River Una in Una National Park—Bihać, Bosnia and Herzegovina
- Lake Karla in the Protected Area of Karla—Magnesia, Greece
L’ Albufera wetland, declared as Natural Park, Ramsar wetland, Important Bird and Biodiversity Area and site of Natura 2000 Network, occupies 211.2 km2. The natural park is defined by a freshwater lagoon (23.2 km2), separated from the Mediterranean Sea by a sand barrier (33.2 km2). The climate is characterized as semiarid. Rice is the main crop and controls the water management. The lake is a very shallow polymictic one, hypertrophic since 1970 with potentially toxic cyanobacteria existence, high pH, co-occurrence of both freshwater and oligohaline waters [39,40] intense temperature variation due to its low depth, reaching a bad ecological status. Moreover, it is highly regulated, as the 70% of its inflows pass through a historic irrigation system.
Krka National Park lies within Šibenik-Knin County and covers a total area of 109 km2 of the Krka River routine. It is a natural park and a Natura Network 2000 site. Visovac Lake is located at southwest of the Dinarid Mountains, formed by Krka River. It is a travertine barrage lake of 7.9 km2 with a maximum depth of 30 m [41]. The climate is continental influenced by the mid-Mediterranean climate. Visovac Lake is monomictic system characterized by relatively high freshwater intake. Although it is located in a sparsely populated and almost intact environment, upstream some significant anthropogenic sources of pressure can be found, making it a sensitive ecosystem. Recent measurements of nutrient salts and organic pollution, on behalf of the PA management authority (unpublished), pose the matter of accumulation, endangering biota and water quality [42].
Mincio Park is a 19.47 km2 PA. It is declared a Ramsar wetland and a natural reserve. Part of it is a Natura Network 2000 site. The climate is warm and temperate. This National Park hosts a heterogenous natural environment formed by several water bodies with different hydrological characters [43]. Mantua Lakes are a group of three eutrophic urban lakes situated in a valley-lacustrine system, with reduced hydrodynamism and many hydromorphological alterations. Based on previous monitoring results of the PA, the lakes, created by dammed meanders, are usually CO2 supersaturated, with anoxia impacting on biological communities [44].
Una National Park lies in the northwestern part of Bosnia and Herzegovina and has an area of 198 km2. The park encompasses the Una river valley, the canyon and orographic slopes of neighboring massifs. The Una River is 212 km long and emerges as a karst spring, at the foot of the Pljesevica and Strazbenica mountains. A moderately continental climate characterizes the area [45]. No visible effects of pollution or morphological alteration can be found in the area. The terrain assists to the self-purification ability of the system. It is neutral to alkaline pH and there are observations of relatively high calcium concentration and metal traces, while manganese is disturbing (Una PA MB unpublished data).
The Protected Area of Lake Karla, situated in the Eastern Thessaly has an area of 1.280 km2 and is characterized by great land use heterogeneity. Parts of it are characterized as important bird and biodiversity areas and Natura Network 2000 sites. The newly recreated artificial Lake Karla, located at the lowest altitude, covers an area of 38 km2. It is a very shallow, heavily modified water body and it is governed by a continental climate [46]. Lake Karla is exposed to point and diffuse pollution sources, which come from the intensive agricultural and livestock activities, leading already to a progressive eutrophication. It is characterized as eutrophic to hypereutrophic with frequent occurrence of algal blooms [47].
2.2. The Conceptual Framework
The gap analysis is undertaken with contributions from all EcoSUSTAIN partners and carried out on the sum of five Mediterranean PAs in three fields, covering: (a) “Management Practices”, (b) “Monitoring Practices”, (c) “Water Quality and Pressures”, to investigate sectoral or practicing deficiencies as well as information lack and distance from desirable status. More specifically, analyses take place inside the following three conceptual frames:
- Management Practices: the set of queries selected in this field is such that can produce a clear image regarding PA management structure and actions regarding to its effectiveness, the PA accessibility and relations with visitors along with other goods and comforts provided (Table A1).
- Monitoring Practices: Parameters indicative of biological, hydromorphological and physical-chemical quality elements are required to be monitored within certain frequencies. Similar to the WFD, other EU directives (bathing, nitrates, habitats), comprising Europe’s water policy legislation, set the frame of requirements for monitoring on which regional and national institutions are supposed to base their monitoring programmes. In this field, several quality elements, their monitoring frequencies and special assessments are included (Table A2).
- Water Quality and Pressures: This criterion is addressed mostly as the knowledge availability, for the ability of comparing biological, physicochemical, ecological and other abiotic parameters with the limits of guidances and directives, and synthesizing the information required by broadly accepted indexes. Along with the aforementioned parameters, descriptive assessment of probable amelioration/deterioration on certain ecosystem values and services is evaluated (Table A3).
2.3. Gap Analysis Methodology
The gap analysis applied methodology can be described by four steps, presented below:
- First the identification of the objectives is set, meaning the desirable level (the 100% of the target value) which is different for each field. A final selection of 15 queries was considered as enough to reflect the preferable status in all three fields. An equal number of queries is selected for the comparability of the results.
- Second comes the analysis of the current situation. The current situation is quantified based on: PA’s responsible MB on the three-set query matrix along with a dataset of recently (2016, 2017) monitored elements for the waterbodies provided by each PA Management Authority enriched with a database formed by raw data, gathered during an extended literature review.
- The third step is gap assessment. The gap stems from the difference between current and desired level; namely the percentage of indices measured, along with their values of the ideal situation. These percentages come from the replies of the queries as follows: when the reply is yes or no, the percentage results in only two options, 0% or 100%, but when the reply has more options, a classification of percentages is raised, according to the number of classes. When descriptive assessment is applicable in queries, replies stating amelioration are graded positively, those stating deterioration are graded negatively and those stating stability with half the full grade. More details on the grading of each query is presented in Appendix.
- In order to visualize the gap, simple mathematics are applied. The cumulative average statistics are used to assess the final results of every PA for the examined fields. A comprehensive presentation is performed regarding the derived percentage value for each query of the three thematic categories. Each one of these queries is equally important for the analysis, so, no weight coefficients are used. The same mathematic formula applies for the final value that characterizes each MB of PA and each category. This final value is the average of the gap of all three categories.
3. Results
For the needs of a comprehensive presentation of the results, three tables were created (Table 1, Table 2 and Table 3), showing the graded percentages of the queries’ answers for the five PAs, regarding the fields of Management Practices, Monitoring Practices and Water Quality and Pressures.
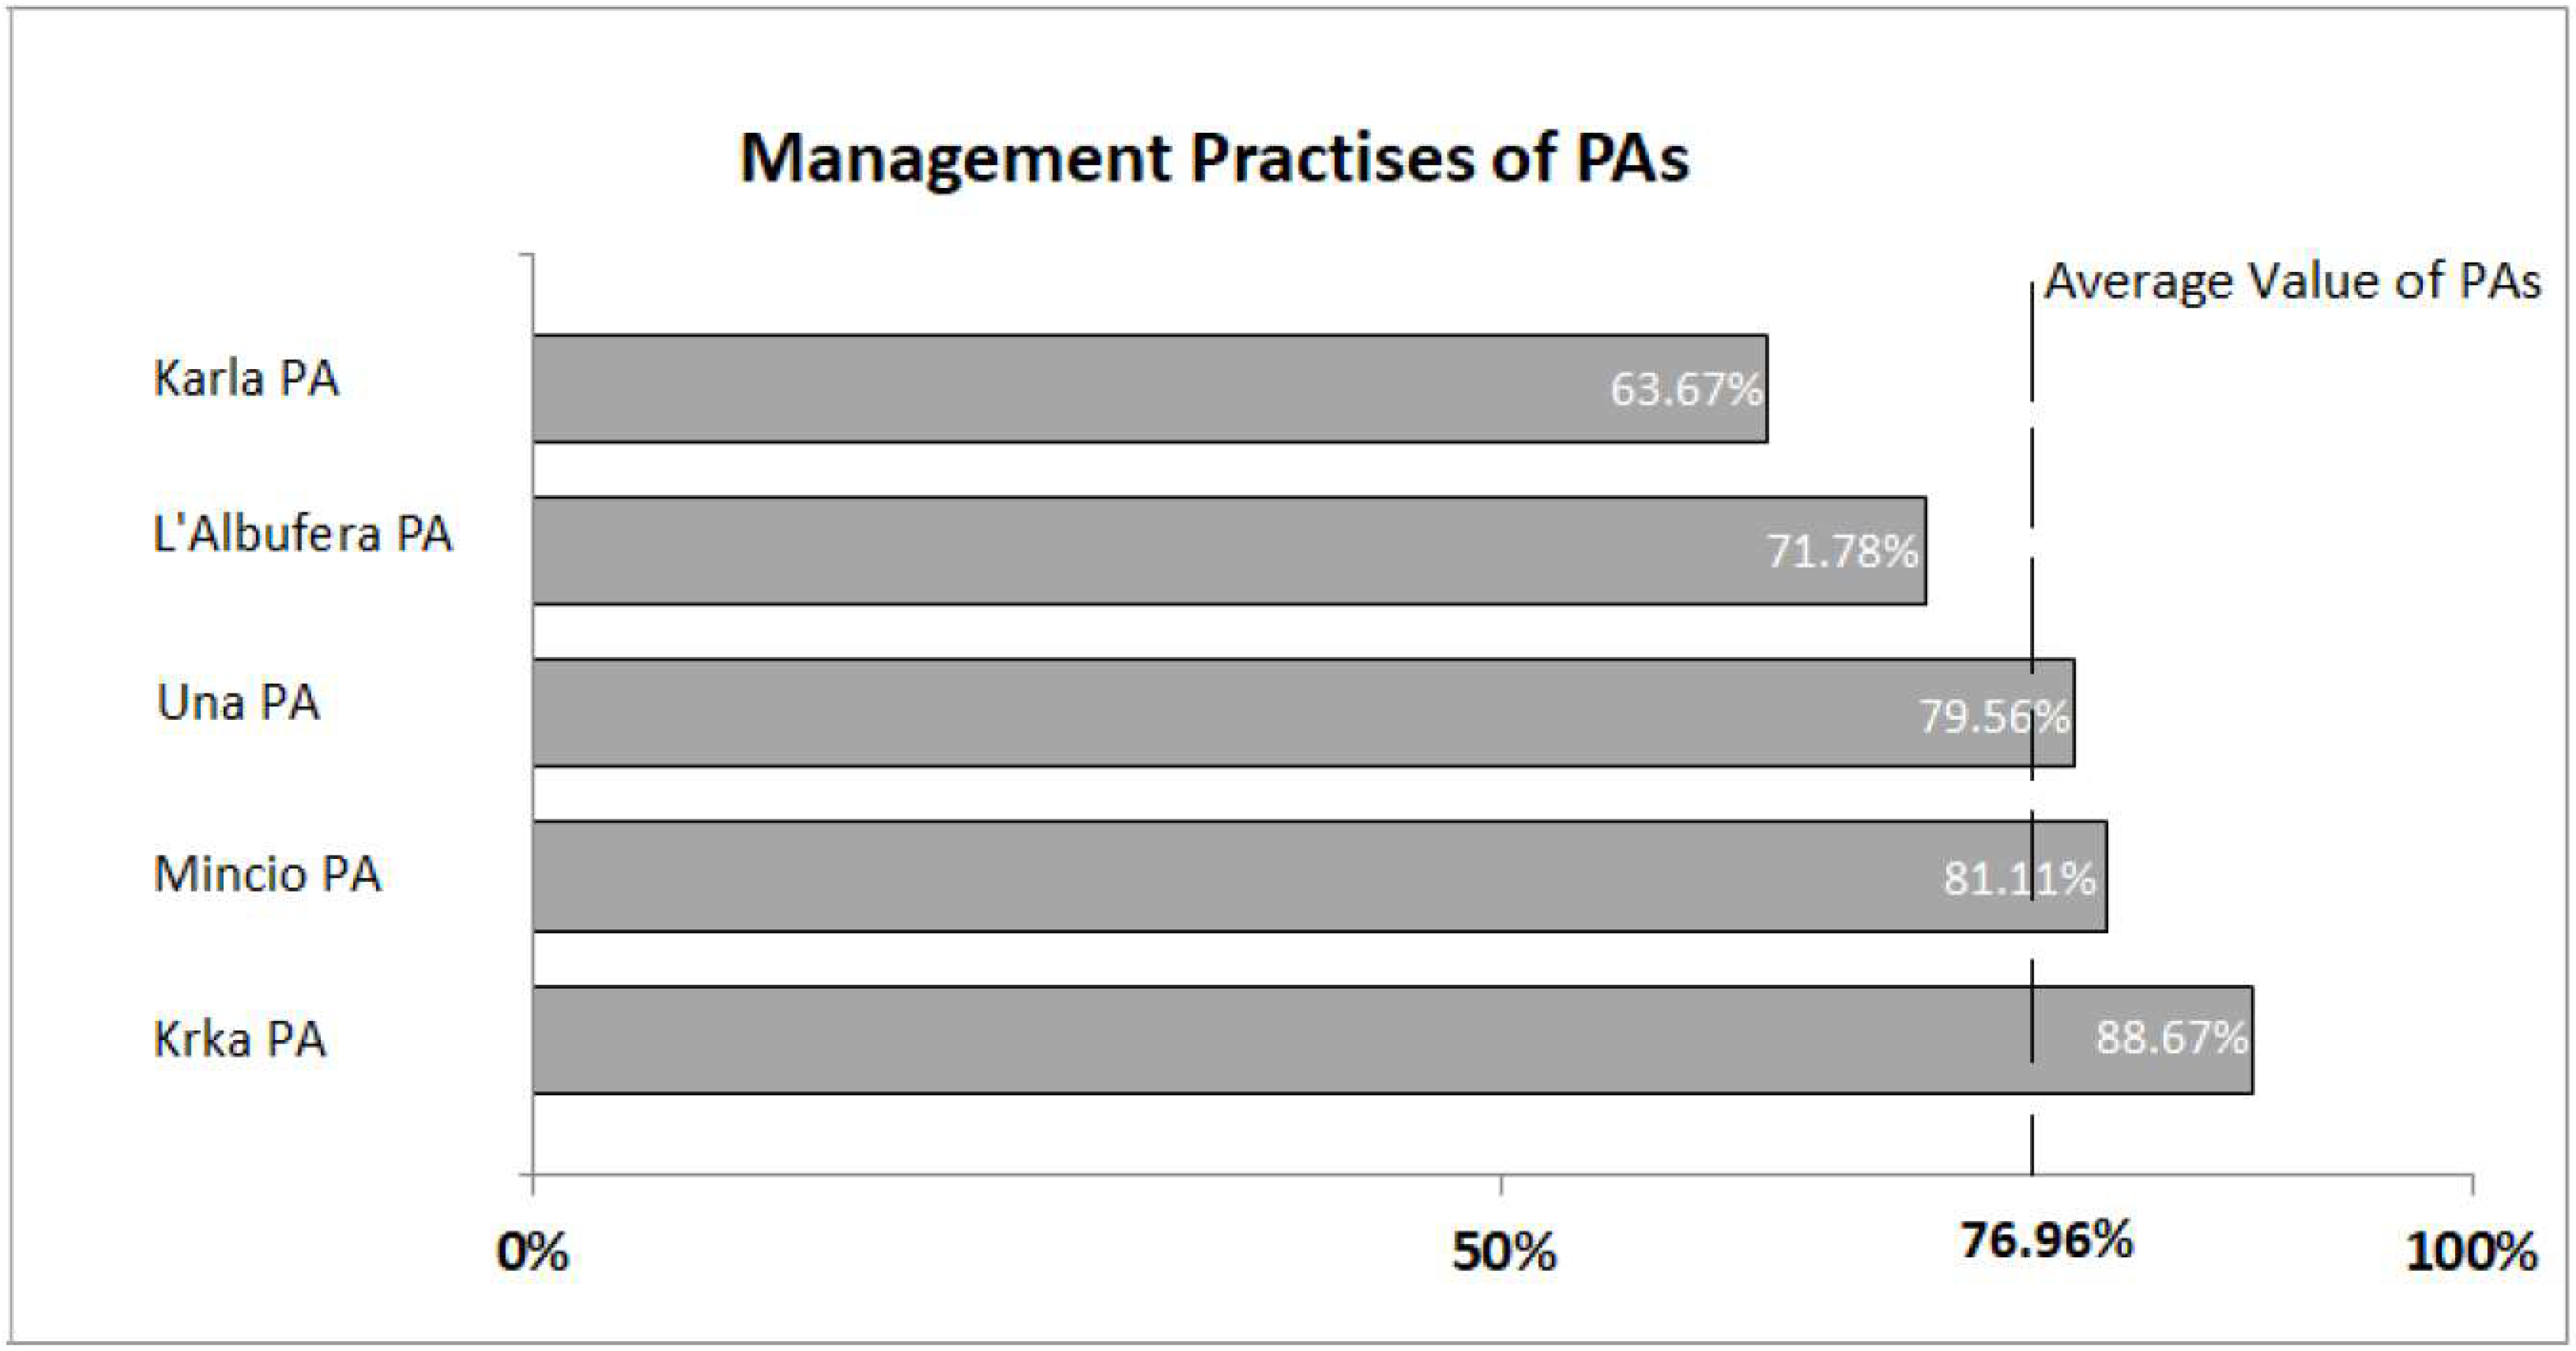
A mean value, for each PA, was calculated for the percentage values of all the queries. This application returned a percentage value per field for each PA, as shown by the graphs of Figure 2, Figure 3 and Figure 4.
Regarding the “Management Practices”, the analysis highlighted that the “weakest” area of the framework in which Management Bodies function is represented by their actions and ability of exploiting different sources of income for their benefit, possibly affecting the number of employees in each management Body (Figure 2, Table 1). Most of the NPs’ gathered higher percentages on specific queries revealing an efficient organization scheme, fidelity to the management plan prerequisites, active management and proper infrastructure.
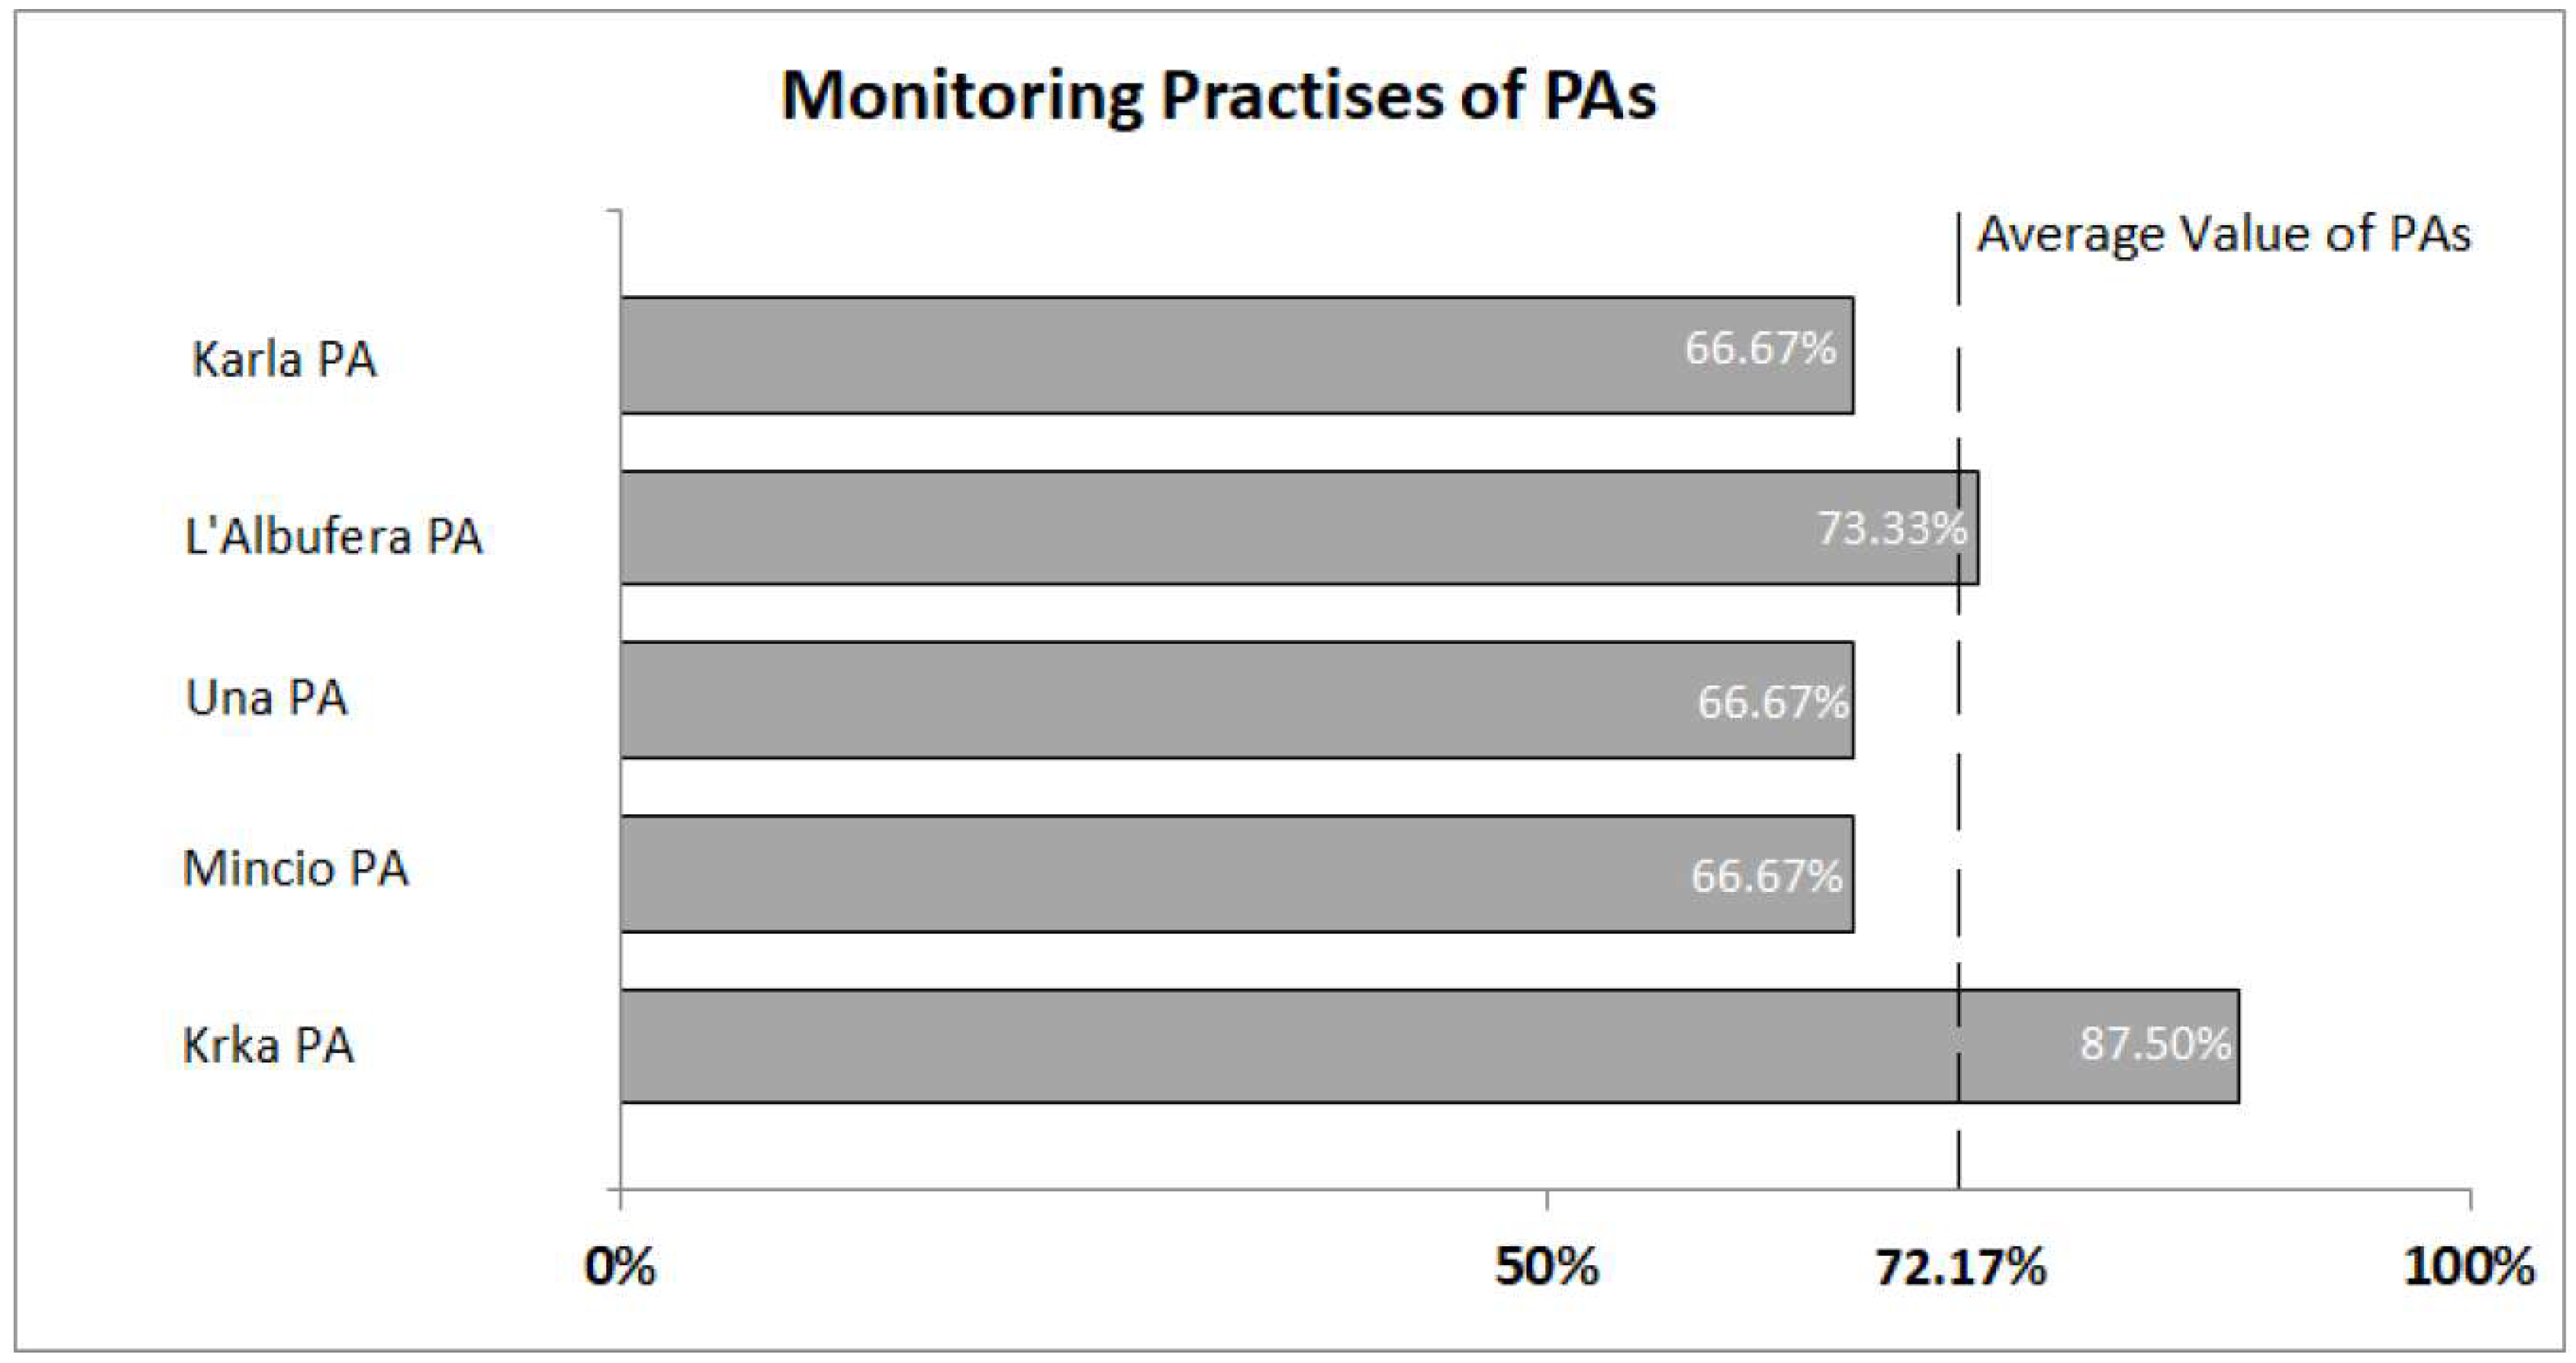
The findings of gap analysis on “Monitoring Practices”, revealed as main problematic areas the compliance with the Water Framework Directive in the matter of sampling frequencies and the designation of the water-body limits/type. It can be seen that almost all the quality elements set by the WFD are monitored according to plan, but without the proper frequency trend (Figure 3, Table 2). Another issue is that three of the national parks have not quantified the ecosystem services their areas are capable of providing, and four out of five have not evaluated hydromorphological modifications. Overall, the analysis showed a relatively good state in monitoring practices, providing adequate knowledge on water quality and the pressures upon it.
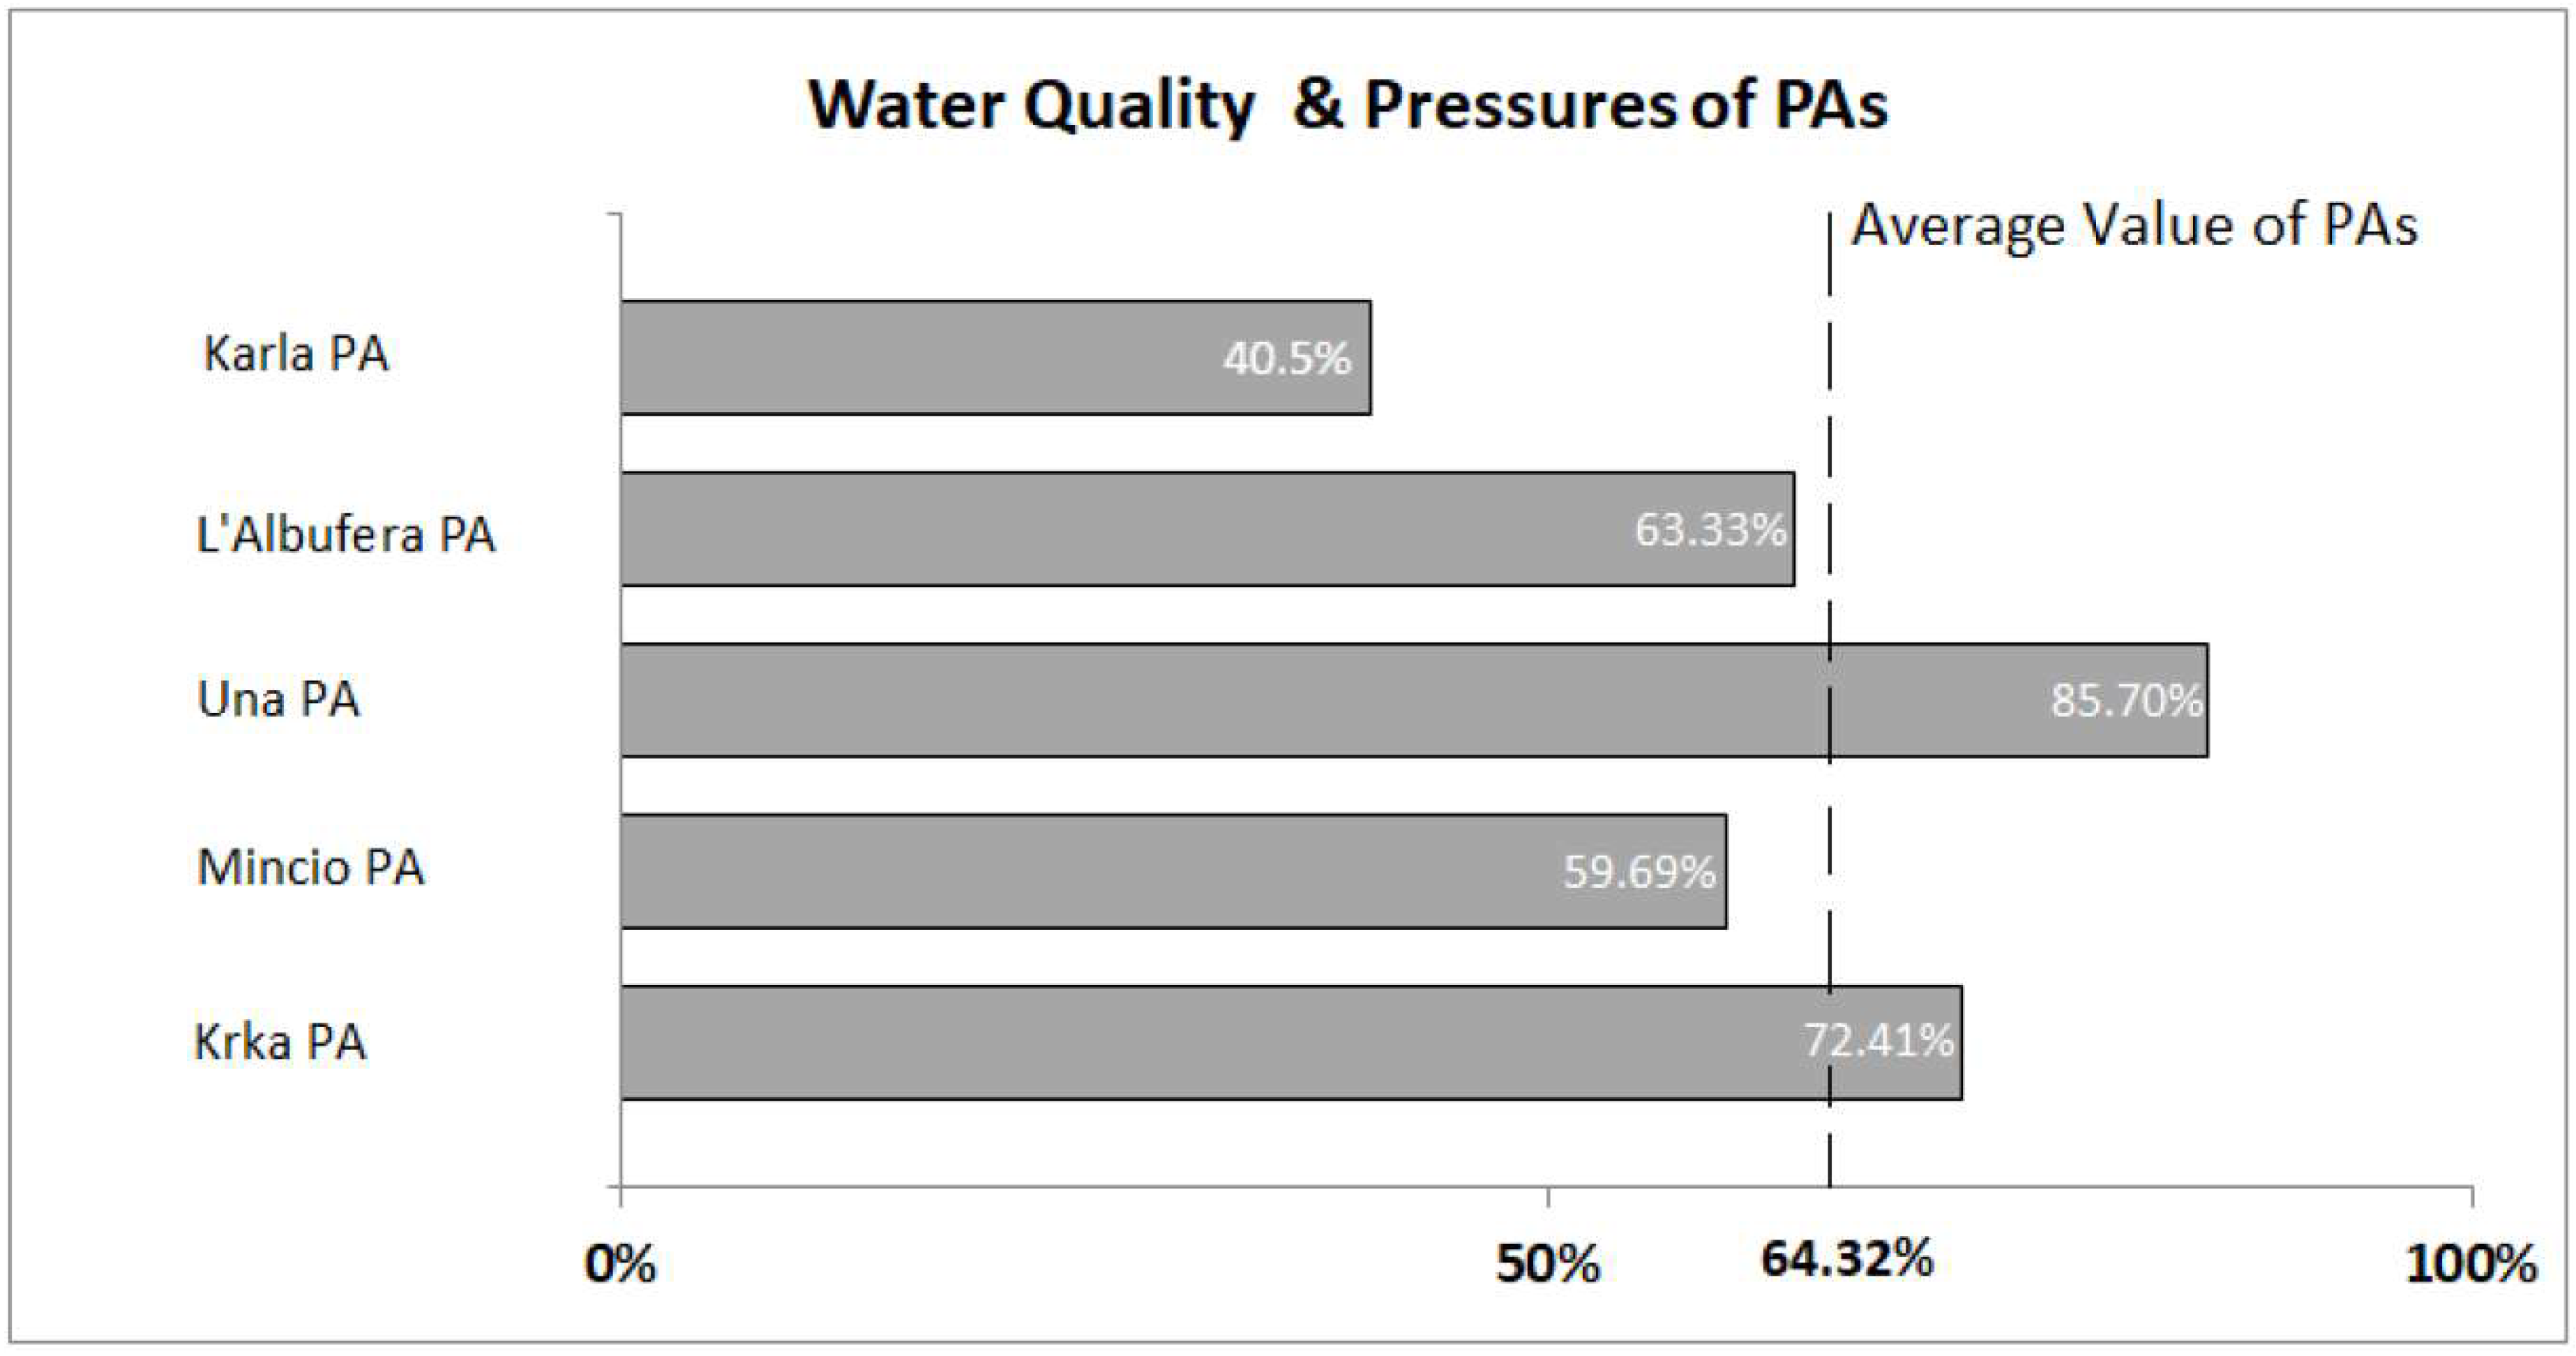
In the field of “Water Quality and Pressures”, gap analysis revealed several deficiencies, mostly dealing with the series of pressures each PA faces and the lack of improvement of quality criteria relevant to biodiversity and habitats (Figure 4, Table 3). Discharges and residues accumulation pull the average down in a negative manner and this could possibly be connected to the lack of awareness of hydromorphological modifications. Major distance found in “Water Quality and Pressures” field (Figure 4) is attributed mostly to Karla, Mincio and L’ Albufera Parks, which host the more eutrophicated water-bodies, suffering from various and multiple human-induced pressures.
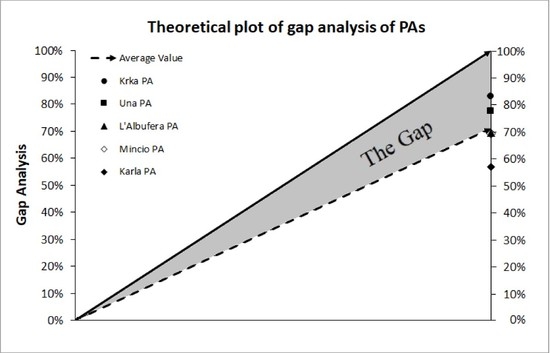
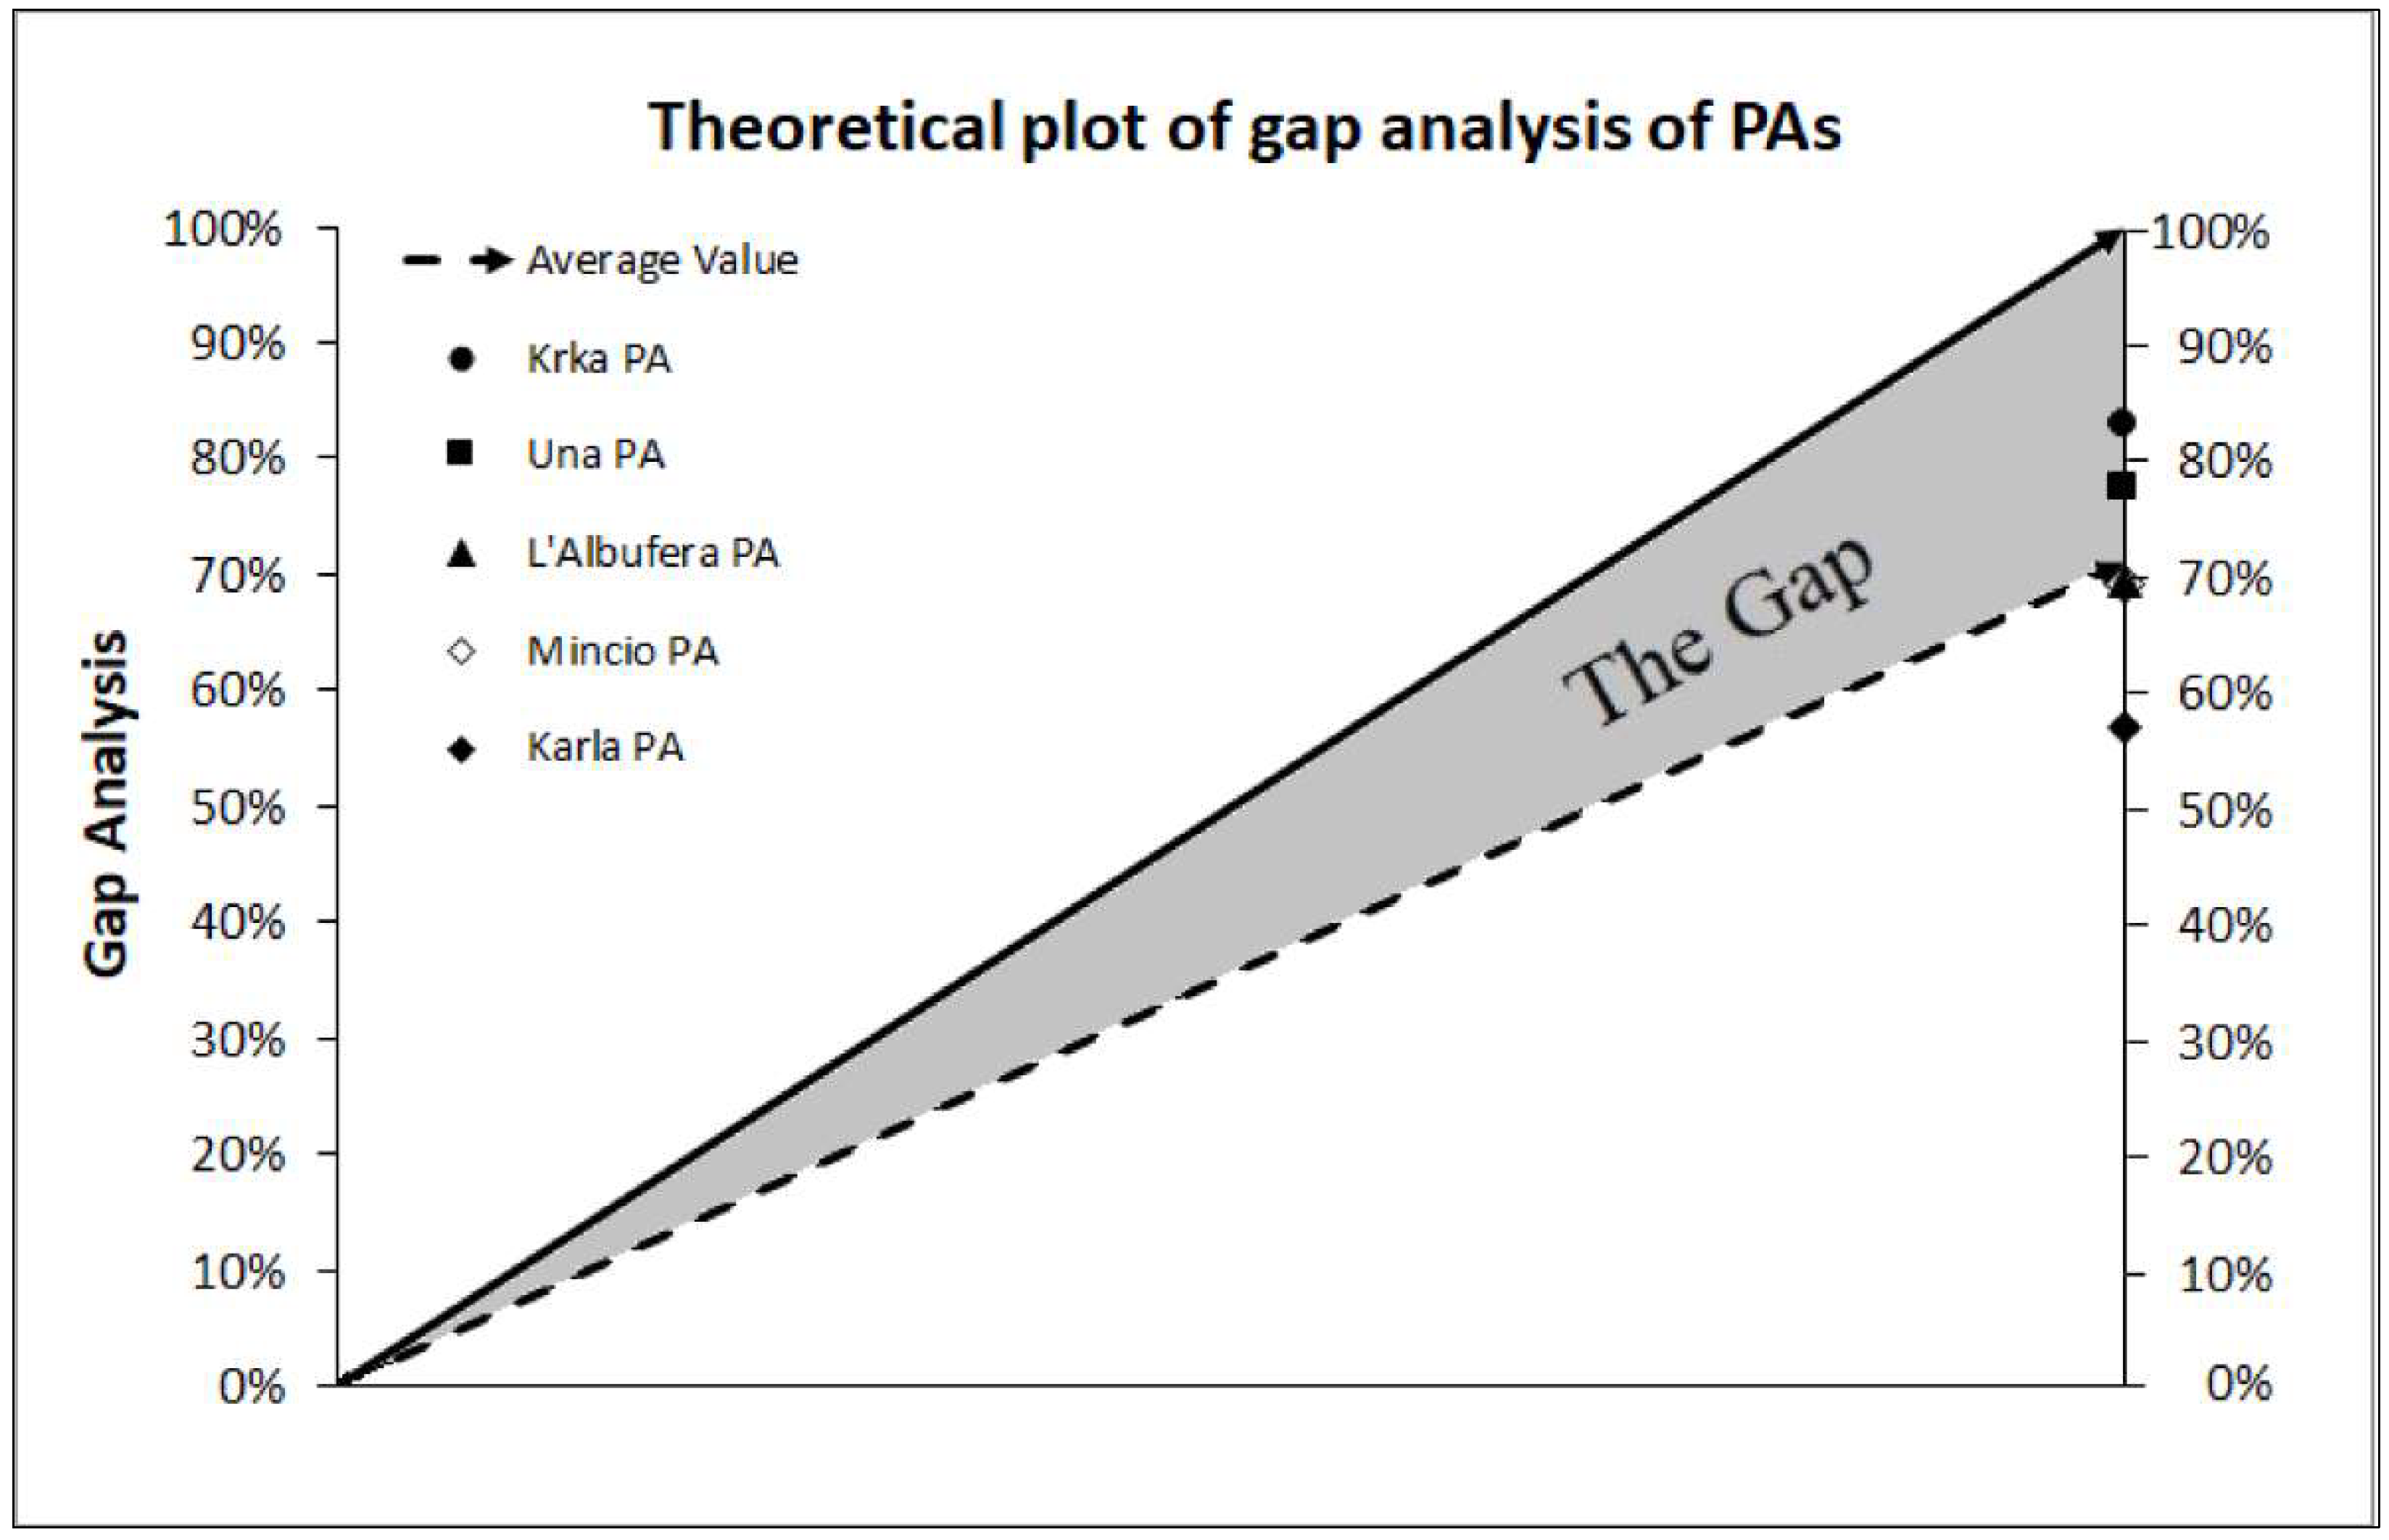
The average gap was calculated in order to visualize the results (Figure 5). In general, the part of “Management Practices” received better rating, followed by knowledge availability in order to produce indices related to “Water Quality and Pressures”. Furthermore, the results showed a possible vulnerability of surface water bodies of the PAs in connection with the human activities-pressures found in these areas.
4. Discussion
Given that environmental sustainability and ensuring human well-being in the Mediterranean area strongly depend on sustainable water resources management and valuable NPs preservation [48], the elaboration of coherent cost-effective measures across all Mediterranean water bodies is required. This should be based on comprehensive monitoring analysis, on the assessment of the anthropogenic pressures, and on the ability to make reliable prognosis. In this context, effective management actions can derive from proper monitoring practices and pressure assessment methods. One example could be gap analysis, used as a tool to assist the quantification between present and desired level in important PAs’ governance major topics.
In our research, the most problematic issues for the viability of the PA MBs seem to be funding, the low level of communication level and the cooperation between institutions, along with lack of clear management goals. Water bodies are supposed to be governed by institutional structures at river basin level following the WFD and Habitat Directives, while the participatory management process is also required shifting to a multi-level governance approach [1,14,49]. Countries with pre-existing participatory mechanisms and established regional institutions are more familiar with water management tools [10,50] and are expected to implement the European water governance agenda easier than member states with more centralized and hierarchical administrative structures [51,52]. For example, Greece faces significant difficulties in implementing the EU environmental legislation [10,53,54] since there are complicated administrative procedures between public authorities.
Special attention should also be paid to the broader thematic of hydromorphological modifications and ecological services and impact assessments. These elements are not monitored according to the directives’ suggestions, thus augmenting the gap values. It used to be an area of less concern along the management and scientific communities, as depicted also by the gap analysis, since the majority of the studied areas have not yet included these in a standardized protocol. Hydromorphological modifications can exert a strong, if not a dominant, influence on the water chemistry and ecology. In order for the studied ecosystems to maintain their functionality, implementation actions must focus on the protection and conservation of the natural water regimes and catchment topography according to the ecohydrological principles [55,56]. One other basic outcome is that it would be favorable if Management Bodies of all PAs could focus on the “Water Quality and Pressures” field. This field is interconnected with monitoring practices for generating the proper amount of information, tailored thresholds and forewarning systems. This data generation is extremely valuable for the design of measures towards pressure alleviation and water quality improvement. As for the more degraded areas, namely, L’ Albufera, Mantua Lakes and Karla lake, their overall image in this field is mediated by the almost complete knowledge on the water quality-related parameters and the extended research [44,47,57,58]. Another important issue raised by the gap analysis is the stakeholders’ engagement as an essential element for the environmental management and decision making. This issue has also been highlighted by [50] strongly suggesting the actual involvement of stakeholders in the decision-making process. The latter require goals clarity, capacity, adaptiveness and effectiveness of stakeholder engagement [59,60]. More steps should be done towards citizen engagement in Mincio, Krka and Karla PAs.
Having applied a gap analysis, targeting WFD monitoring and pressure mapping in so many different PAs appears to be adequate to group fundamental goals and incorporate harmonization with other directives, indexes and Guidances. Such harmonization is valuable for the better understanding of monitoring needs and of water quality issues, as for knowledge base building. At the same time, gap analysis reveals the need to apply an extra (monitoring and management) effort for waterbodies to reach the desirable status, to reinforce the existing monitoring systems in the region, and to make the existing datasets accessible by policy makers, so as to meet the requirements of the relevant initiatives. This contradicts the traditional monitoring programmes undertaken by individual agencies that relate to specific objectives (i.e., meeting water quality criteria) in cases where other factors as habitats, protected species and services should also be considered. Yet, our analysis on monitoring and water quality could be seen as a second level information for the operational managers (people responsible for policy implementation), capitalizing data developed through research projects, thus a common understanding might be achieved.
The limitations of the study have to do with the data which are used in the gap analysis. Time series of spatial data regarding water quality and species/habitat records would give a more precise assessment of MB actual performance. Without explicit data and extended databases on water quality monitoring-related parameters and on species/habitats conservation actions it is unlikely that such a gap analysis could provide an effective tool for management practices, for new infrastructure development as well as for ecosystem services mapping. Gap analysis, as performed in this research, is a multipurpose analysis rather than a strict conservation or protection program. It is a tool for effort estimation and pinpointing the areas were further investment/actions to be taken are needed. When used also as a harmonization tool then the variety of the selected parameters in the analysis are limited by the common transnational (EU and national) legislation. Another limitation could be the timing since it takes a “snapshot” of the situation. This could be overcome by doing regular follow-ups and assessing progress, given that more measures are taken, and results are collected. Gap analysis has been applied widely in terrestrial ecosystems as a GIS-based tool and the financial management as an operational tool. More scientific knowledge should be achieved for its successful application in aquatic ecosystems.
Although it is difficult to make a comparison between countries, since the organization of public institutes dedicated to environmental issues varies greatly from one national model to another, the Management Bodies of these PAs could act as intermediate or meso-institutions [61] since they represent the level where the general rules and ministerial decisions should be “translated” into practices, implemented, monitored and managed. To what extent they could facilitate the Protected Area Management Effectiveness (PAME) as described by IUCN [62,63], depends on their capacity building and their funding. After all, PAs and river basin districts MB owe to meet the needs for conservation, touristic attraction and water quality policies. Many times, gaps in the knowledge on the policy instruments within the governing institutions hinder their effectiveness [64]. It is thought that if these gaps can be identified, steps can be taken to fill them, achieving more effective management, thus leading to an increase in sustainable water use, water quality and economic output [65].
5. Conclusions
Summarizing, the goal of this paper is to account the gaps in the applied environmental policy in five NPs aiming at the improvement of their management planning process. This research revealed that all national parks have been altered by human pressures. Hereby we enumerate our major findings: (A). In the Management Practices field (average gap 20.04% of the target goal) most problems are associated with the staff use (6th query, 35% gap) which is entirely connected with the ability to exploit different sources of income (4th query, 50% gap), meaning submitting proposals, running projects and “lobbying”. A budget augmentation can lead to employing more people and distributing them in different departments (7th query, 24% gap) and thus expand their main actions (2nd query, 26.6% gap). More staff can even undergo the difficult procedure of obeying ecological norms, and adopting and following ISO standards (13th query, 100% gap). In the Monitoring Practices field (average gap 27.83% of the target goal), some actions should be taken towards performing simple, but basic, analyses in order for most NPs to asses hydromorphological modifications (7th query, 80% gap), impacts (8th query, 40% gap) and ecological services (9th query, 60% gap) once and then to monitor the equivalent changes (11th query, 50% gap) in a frequency proposed by the WFD. For the Water Quality and Pressures field (average gap 35.68% of the target goal), things are not easy to change rapidly. If measures are taken in the Management and Monitoring Practices fields, a general amelioration can be achieved long-term. In the time being all NPs are involved in scientific projects focusing the best preservation of their natural resources, so, in a prepetition of a gap analysis in a reasonable timestep (i.e., 2 years), the values in all fields would be higher. (B) The protected areas that have to put more effort in reaching the favorable status are Karla, Mincio and L’ Albufera, and this can possibly be explained by the water body types and the human induced pressures during the last centuries. (C) We suggest that harmonization among EU directives is valuable for the better understanding of biodiversity and of water quality issues. (D) The Management Bodies of the examined PAs could upgrade their role acting as “facilitators” of the EU and national environmental policies. (E) We recommend the close cooperation between the institutions, along with the clear management goals for the PAs. (F) The lessons learned from this EcoSUSTAIN action will help to design future monitoring plans leading to proper management actions by highlighting the gaps in each field and revealing shading effects of improper measures taken so far.
Author Contributions
D.L., P.S. and I.K. conceived and designed the experiment; D.L. gathered the literature and performed the review; D.L., P.S. and I.K. designed the questionnaires; D.L. and P.S. processed questionnaires; P.S. performed the analyses and created the graphs; I.K. had the overview of the entire research and provided expert opinion; D.L. and P.S. wrote the paper.
Funding
This research was funded by the Direction Générale Adjointe des Relations Internationales et des Affaires Européennes (European Regional Development Fund) under Interreg-MED programme (Ref number 1011 1MED15_3.2_M2_318).
Acknowledgments
Special thanks to Charilaos Latinopoulos and Chiara Cervigni for the English language proofreading of the manuscript and RGO and FGN whose work in EcoSUSTAIN, describing status quo, facilitated the completion of the query matrix dealing with the Water Quality and Pressures. Acknowledgments should be given to our 9 partners, from 5 countries, namely University of Rijeka—Faculty of Maritime studies, RGO Communications Ltd, ALOT S.r.l., REGIONAL PARK OF MINCIO, Development Agency of the Una—Sana Canton, GLOBAL NATURE FOUNDATION, ARATOS TECHNOLOGIES S.A, Public Company Una National Park Ltd. Bihac and Public Institution “National park Krka”. For more information: https://ecosustain.interreg-med.eu.
Conflicts of Interest
The authors declare no conflict of interest. The founding sponsors had no role in the design of the study; in the collection, analyses, or interpretation of data; in the writing of the manuscript, and in the decision to publish the results.
Appendix A
Gap analysis was performed with the answers on the following query matrixes by the MBs of the five PAs, dataset of recently (2016, 2017) monitored elements for the waterbodies provided by each PA and the sum of the available scientific literature focused on these areas. There were three topics under examination, regarding management practices, water quality monitoring and pressures on water resources. In this section all questions were posed to the PAs’ MBs

Table A1.
Gap analysis queries on Management Practices are presented in the same sequence as presented in Table 1 along with the grading of each query in percentage (%) depending on possible answers. The final grading is the sum of the grades of all available answer options.
Table A1.
Gap analysis queries on Management Practices are presented in the same sequence as presented in Table 1 along with the grading of each query in percentage (%) depending on possible answers. The final grading is the sum of the grades of all available answer options.
| Query No | Possible Responses and Grading (in%) of the Target Value | ||||
|---|---|---|---|---|---|
| 1 | Environment (25%) | Biodiversity (25%) | Tourism (25%) | Research (25%) | |
| 2 | Surveillance (33.3%) | Environmental Awareness (33.3%) | Monitoring (33.3%) | ||
| 3 | Yes (100%) | No (0%) | |||
| 4 | National/Municipal (25%) | Own/Private (25%) | LIFE (25%) | Interreg 2014–2020/European Regional Development Fund (ERDF) /Horizon 2020 (25%) | |
| 5 | Yes (100%) | No (0%) | |||
| 6 | The value 100% refers to the MB with the maximum number of staff of this fraction per area. 25% for the MB with less staff | ||||
| 7 | Environment (20%) | Biodiversity (20%) | Surveillance (20%) | Tourism (20%) | Οthers (20%) |
| 8 | Yes (100%) | No (0%) | |||
| 9 | Yes (100%) | No (0%) | |||
| 10 | Yes (50%) | Yes with Contract (100%) | No (0%) | ||
| 11 | Yes open (50%) | Yes with Kiosks (100%) | No (0%) | ||
| 12 | Yes (100%) | No (0%) | |||
| 13 | Yes (100%) | No (0%) | |||
| 14 | Yes (100%) | No (0%) | |||
| 15 | Yes (100%) | No (0%) | |||
Table A2.
Gap analysis queries on Monitoring Practices are presented in the same sequence as presented in Table 2 along with the grading of each query in percentage (%) depending on possible answers. The final grading is the sum of the grades of all available answer options.
Table A2.
Gap analysis queries on Monitoring Practices are presented in the same sequence as presented in Table 2 along with the grading of each query in percentage (%) depending on possible answers. The final grading is the sum of the grades of all available answer options.
| Query No | Possible Responses and Grading (in%) of the Target Value | |||||
|---|---|---|---|---|---|---|
| 1 | Yes (100%) | No (0%) | ||||
| 2 | Yes (100%) | No (0%) | ||||
| 3 | Yes (100%) | No (0%) | ||||
| 4 | Yes (100%) | No (0%) | ||||
| 5 | Yes (100%) | No (0%) | ||||
| 6 | Yes (100%) | No (0%) | ||||
| 7 | Yes (100%) | No (0%) | ||||
| 8 | Yes (100%) | No (0%) | ||||
| 9 | Yes (100%) | No (0%) | ||||
| Every month | Every 3 months | Every 6 months | Every year | More than 1 year | Never | |
| 10 | 100 | 100 | 100 | 100 | 50 | 0 |
| 11 | 100 | 100 | 100 | 100 | 50 | 0 |
| 12 | 100 | 100 | 50 | 0 | 0 | 0 |
| 13 | 100 | 50 | 0 | 0 | 0 | 0 |
| 14 | 100 | 50 | 0 | 0 | 0 | 0 |
| 15 | 100 | 100 | 50 | 0 | 0 | 0 |
Table A3.
Gap analysis queries on Water Quality and Pressures are presented in the same sequence as presented in Table 2 along with the grading of each query in percentages (%) depending on possible answers. The final grading is the sum of the grades of all available answer options.
Table A3.
Gap analysis queries on Water Quality and Pressures are presented in the same sequence as presented in Table 2 along with the grading of each query in percentages (%) depending on possible answers. The final grading is the sum of the grades of all available answer options.
| Query No | Possible Responses and Grading (in %) of the Target Value | ||||
|---|---|---|---|---|---|
| Don’t know | Negative | Positive | None | ||
| 1 | 0 | 0 | 100 | 50 | |
| 2 | 0 | 0 | 100 | 50 | |
| 3 | 0 | 0 | 100 | 50 | |
| 4 | 0 | 0 | 100 | 50 | |
| 5 | 0 | 0 | 100 | 50 | |
| Affect little | Affect | Main source of contamination | Don’t know | ||
| 6 | 75 | 25 | 0 | 0 | |
| 7 | 75 | 25 | 0 | 0 | |
| 8 | 75 | 25 | 0 | 0 | |
| 9 | 75 | 25 | 0 | 0 | |
| 10 | 75 | 25 | 0 | 0 | |
| 11 | Total N (20%) | Total P (20%) | Chl-a (20%) | Turbidity (20%) | Secchi depth-Transparency (20%) |
| 12 | Metals (25%) | Agrochemicals (25%) | Pesticides (25%) | Priority Subsances (25%) | |
| 13 | Zn and Cu, CaCO3 (hardness), Total Suspended Solids (TSS), Biochemical Oxygen Demand (BOD), pH, NH4, NH3, NO2, Temperature, Dissolved Oxygen (DO), Phenols, HOCl and Total P all take 8% if there are any recent recorded values | ||||
| 14 | Mycrocystin (MCYST) (25%) | Cyanoacterial biovolume (25%) | Chl-a (25%) | Leptospira/Amoeba/Feacal coliforms (25%) | |
| 15 | Conductivity, Alkalinity, Salinity, Total Dissolved Solids (TDS), Dissolved Organic Material (DOM), Oxidation/Reduction Potential or redox Potential (ORP), Phycocyanin and others photosynthetic pigments all take 13% if there are recent recorded values | ||||
References
- Paavola, J.; Gouldson, A.; Kluvánková-Oravská, T. Interplay of actors, scales, frameworks and regimes in the governance of biodiversity. Environ. Policy Gov. 2009, 19, 148–158. [Google Scholar] [CrossRef]
- Rauschmayer, F.; Berghöfer, A.; Omann, I.; Zikos, D. Examining processes or/and outcomes? Evaluation concepts in european governance of natural resources. Environ. Policy Gov. 2009, 19, 159–173. [Google Scholar] [CrossRef]
- Vikolainen, V.; De Bruijn, T.; Bressers, H. Improving environmental policy enforcement. Environ. Eng. Manag. J. 2013, 12, 1637–1643. [Google Scholar]
- Dudley, N.; Harrison, J.I.; Kettunen, M.; Madgwick, J.; Mauerhofer, V. Natural solutions for water management of the future: Freshwater protected areas at the 6th World Parks Congress. Aquat. Conserv. 2016, 26 (Suppl. 1), 121–132. [Google Scholar] [CrossRef]
- Juffe-Bignoli, D.; Burgess, N.D.; Bingham, H.; Belle, E.M.S.; De Lima, M.G.; Deguignet, M.; Bertzky, B.; Milam, A.N.; Martinez-Lopez, J.; Lewis, E.; et al. Protected Planet Report 2014; UNEP-WCMC: Cambridge, UK, 2014; pp. 1–80. ISBN 978-92-807-3416-4. [Google Scholar]
- Pittock, J.; Finlayson, M.; Arthington, A.H.; Roux, D.; Matthews, J.H.; Biggs, H.; Harrison, I.; Blom, E.; Flitcroft, R.; Froend, R.; et al. Chapter 19, Managing freshwater, river, wetland and estuarine protected areas. In Protected Area Governance and Management; Worboys, G.L., Lockwood, M., Kothari, A., Feary, S., Pulsford, I., Eds.; ANU Press: Canberra, Australia, 2015; pp. 569–608. [Google Scholar]
- Vollmer, D.; Shaad, K.; Souter, J.N.; Farrell, T.; Dudgeon, D.; Sullivan, A.C.; Fauconnier, I. Integrating the social, hydrological and ecological dimensions of freshwater health: The Freshwater Health Index. Sci. Total Environ. 2018, 627, 304–313. [Google Scholar] [CrossRef] [PubMed]
- Abellan, P.; Sanchez-Fernandez, D.; Velasco, J.; Millan, A. Effectiveness of protected area networks in representing freshwater biodiversity: The case of a Mediterranean river basin (south-eastern Spain). Aquat. Conserv. Mar. Freshw. Ecosyst. 2007, 17, 361–374. [Google Scholar] [CrossRef]
- Darwall, W.; Carrizo, S.; Numa, C.; Barrios, V.; Freyhof, J.; Smith, K. Freshwater Key Biodiversity Areas in the Mediterranean Basin Hotspot: Informing Species Conservation and Development Planning in Freshwater Ecosystems; IUCN: Cambridge, UK; Malaga, Spain, 2014; p. 86. ISBN 978-2-8317-1698-5. [Google Scholar]
- Kanakoudis, V.; Tsitsifli, S. On-Going evaluation of the WFD 2000/60/EC implementation process in the European Union, seven years after its launch: Are we behind schedule? Water Policy 2010, 12, 70–91. [Google Scholar] [CrossRef]
- Demetropoulou, L.; Nikolaidis, N.; Papadoulakis, V.; Tsakiris, K.; Koussouris, T.; Kalogerakis, N.; Koukaras, K.; Chatzinikolaou, A.; Theodoropoulos, K. Water framework directive implementation In Greece: Introducing participation in water governance—the Case of the Evrotas River Basin management plan. Environ. Policy Gov. 2010, 20, 336–349. [Google Scholar] [CrossRef]
- Kati, V.; Hovardas, T.; Dieterich, M.; Ibisch, L.P.; Mihok, B.; Selva, N. The challenge of implementing the European network of protected areas Natura 2000. Conserv. Biol. 2014, 29, 260–270. [Google Scholar] [CrossRef] [Green Version]
- Voulvoulis, N.; Arpon, D.K.; Giakoumis, T. The EU Water Framework Directive: From Great Expectations to Problems with Implementation. Sci. Total Environ. 2017, 575, 358–366. [Google Scholar] [CrossRef]
- Maia, R. The WFD Implementation in the European Member States. Water Resour. Manag. 2017, 31, 3043–3060. [Google Scholar] [CrossRef]
- Young, C.J.; Butler, R.A.J.; Jordan, A.; Watt, D.A. Less government intervention in biodiversity management: Risks and opportunities. Biodivers. Conserv. 2012, 21, 1095–1100. [Google Scholar] [CrossRef]
- Hauck, J.; Schweppe-Kraft, B.; Albert, C.; Görg, C.; Jax, K.; Jensen, R.; Fürst, C.; Maes, J.; Ring, I.; Hönigová, I.; et al. The promise of the ecosystem services concept for planning and decision-making. GAIA 2013, 22, 232–236. [Google Scholar] [CrossRef]
- Hauck, J.; Albert, C.; Fürst, C.; Geneletti, G.; La Rosa, D.; Lorz, C.; Spyra, M. Developing and applying ecosystem service indicators in decision-support at various scales. Ecol. Indic. 2016, 61, 1–5. [Google Scholar] [CrossRef] [Green Version]
- Harrington, R.; Anton, C.; Dawson, P.T.; De Bello, F.; Feld, K.C.; Haslett, R.J.; Kluvánkova-Oravská, T.; Kontogianni, A.; Lavorel, S.; Luck, W.G.; et al. Ecosystem services and biodiversity conservation: Concepts and a glossary. Biodivers. Conserv. 2010, 19, 2773–2790. [Google Scholar] [CrossRef]
- World Health Organization. Available online: www.who.int/influenza/pip/pip_pc_ga.pdf (accessed on 1 June 2017).
- Unicef. Available online: https://www.unicef.org/jamaica/gapanalysis_finalreport_sep2016.pdf (accessed on 15 June 2017).
- IUCN—International Union for Conservation of Nature. Available online: https://cmsdata.iucn.org/downloads/pag_015.pdf (accessed on 12 May 2017).
- Rodrigues, S.L.A.; Akçakaya, R.H.; Andelman, J.S.; Bakarr, I.M.; Boitani, L.; Brooks, M.T.; Chanson, S.J.; Fishpool, D.C.L.; Da Fonseca, A.B.G.; Gaston, J.K.; et al. Global Gap Analysis: Priority Regions for Expanding the Global Protected-Area Network. BIOSENCE 2004, 54, 1092–1100. [Google Scholar] [CrossRef] [Green Version]
- Arino, H.R.; Chavan, V.; Otegui, J. Best Practice Guide for Data Gap Analysis for Biodiversity Stakeholders; GBIF Secretariat: Copenhagen, Denmark, 2016; pp. 1–41. [Google Scholar]
- Hunter, M.L.; Yonzon, P. Altitudinal Distributions of Birds, Mammals, People, Forests, and Parks in Nepal. Conserv. Biol. 1993, 7, 420–423. [Google Scholar] [CrossRef]
- Fearnside, P.M.; Ferraz, J. A Conservation Gap Analysis of Brazil’s Amazonian Vegetation. Conserv. Biol. 1995, 9, 1134–1147. [Google Scholar] [CrossRef]
- Scott, J.M.; Davis, W.F.; McGhie, G.R.; Gerald Wright, R.; Groves, C.; Estes, J. Nature Reserves: Do they capture the full range of America’s biological diversity? Ecol. Appl. 2001, 11, 999–1007. [Google Scholar] [CrossRef]
- Jennings, D.M. Gap analysis: Concepts, methods, and recent results. Landsc. Ecol. 2000, 15, 5–20. [Google Scholar] [CrossRef]
- Sharafi, M.S.; Moilanen, A.; White, M.; Burgman, M. Integrating environmental gap analysis with spatial conservation prioritization: A case study from Victoria, Australia. J. Environ. Manag. 2012, 112, 240–251. [Google Scholar] [CrossRef] [PubMed]
- Strittholt, R.J.; Boerner, E.J.R. Applying Biodiversity Gap Analysis in a Regional Nature Reserve Design for the Edge of Appalachia, Ohio (U.S.A.). Conserv. Biol. 1995, 9, 1492–1505. [Google Scholar] [CrossRef]
- Fairbanks, D.H.K.; Benn, G.A. Identifying regional landscapes for conservation planning: A case study from KwaZulu-Natal, South Africa. Landsc. Urban Plan. 2000, 50, 1–19. [Google Scholar] [CrossRef]
- Han, S.; Koo, D.D.; Kim, Y.; Kim, S.; Park, J. Gap Analysis Based Decision Support Methodology to Improve Level of Service of Water Services. Sustainability 2017, 9, 1578. [Google Scholar] [CrossRef]
- Burley, F.W. Monitoring biological diversity for setting priorities in conservation. In Biodiversity; Wilson, E.O., Peter, F.M., Eds.; National Academy Press: Washington, DC, USA, 1988; pp. 227–230. [Google Scholar]
- Scott, J.M.; Davis, F.; Csuti, B.; Noss, R.; Butterfield, B.; Groves, C.; Anderson, H.; Caicco, S.; D’ Erchia, F.; Edwards, C.T.; et al. Gerald Weight R. Gap Analysis: A Geographic Approach to Protection of Biological Diversity. Wildl. Monogr. 1993, 123, 3–41. [Google Scholar]
- Channon, D.F.; Sammut-Bonnici, T. Gap analysis. In Wiley Encyclopedia of Management, 3rd ed.; Cooper, C.L., Ed.; John Wiley & Sons: Hoboken, NJ, USA, 2014; Volume 12, pp. 1–2. ISBN 9781118785317. [Google Scholar]
- Dimarchopoulou, D.; Stergiou, I.K.; Tsikliras, C.A. Gap analysis on the biology of Mediterranean marine fishes. PLoS ONE 2017, 12, e0175949. [Google Scholar] [CrossRef]
- Latinopoulos, D.; Sidiropoulos, P.; Kagalou, I. Gap Analysis targeting WFD monitoring and pressure mapping: Lessons learned from “EcoSUSTAIN”, Interreg-MED Project. In Proceedings of the 3rd EWaS International Conference on “Insights on the Water-Energy-Food Nexus, Lefkada, Greece, 27–30 June 2018. [Google Scholar]
- Field, A.S.; O’ Connor, J.P.; Tyre, J.A.; Possingham, P.G. Making monitoring meaningful. Austral. Ecol. 2007, 32, 485–491. [Google Scholar] [CrossRef] [Green Version]
- Hasan, M. The Gap Analysis—Methodology; Lesson Notes; Institute of Governance Studies, BRAC University: Dhaka, Bengal, 2010. [Google Scholar]
- Del Barrio Fernández, P.; García Gómez, A.; García Alba, J.; Álvarez Díaz, C.; Revilla Cortezón, A.J. A model for describing the eutrophication in a heavily regulated coastal lagoon. Application to the Albufera of Valencia (Spain). J. Environ. Manag. 2012, 112, 340–352. [Google Scholar] [CrossRef]
- Rodrigo, A.M.; García, A.; Chivas, A.R. Carbon stable isotope composition of charophyte organic matter in a small and shallow Spanish water body as a baseline for future trophic studies. J. Limnol. 2016, 75, 226–235. [Google Scholar] [CrossRef]
- Kralj, K.; Plenković-Moraj, A.; Gligora, M.; Primc-Habdija, B.; Šipoš, L. Structure of Periphytic Community on Artificial Substrata: Influence of Depth, Slide Orientation and Colonization Time in Karstic Lake Visovačko, Croatia. Hydrobiologia 2006, 560, 249–258. [Google Scholar] [CrossRef]
- Svensen, C.; Viličić, D.; Wassmann, P.; Arashkevich, E.; Ratkova, T. Plankton distribution and vertical flux of biogenic matter during high summer stratification in the Krka estuary (Eastern Adriatic). Estuar. Coast. Shelf Sci. 2007, 71, 381–390. [Google Scholar] [CrossRef]
- Ravazzi, C.; Marchetti, M.; Zanon, M.; Perego, R.; Quirino, T.; Deaddis, M.; De Amicis, M.; Margaritora, D. Lake evolution and landscape history in the lower Mincio River valley, unravelling drainage changes in the central Po Plain (N-Italy) since the Bronze Age. Quat. Int. 2013, 288, 195–205. [Google Scholar] [CrossRef]
- Pinardi, M.; Rossetto, M.; Viaroli, P.; Bartoli, M. Daily and seasonal variability of CO2 saturation and evasion in a free flowing and in a dammed river reach. J. Limnol. 2014, 73, 468–481. [Google Scholar] [CrossRef]
- Korjenić, A.; Misilo, M. Morphological characteristics of the Una-Sana Canton relief as spatial planning factor. Geogr. Rev. 2016, 37, 197–208. [Google Scholar]
- Sidiropoulos, P.; Papadimitriou, T.; Stabouli, Z.; Loukas, A.; Mylopoulos, N.; Kagalou, I. Past, present and future concepts for conservation of the re-constructed lake Karla (Thessaly-Greece). Fresen. Environ. Bull. 2012, 21. [Google Scholar] [CrossRef]
- Sidiropoulos, P.; Chamoglou, M.; Kagalou, I. Evaluating the ecological restoration of a Mediterranean reservoir. Eur. Water 2017, 58, 209–215. [Google Scholar]
- Hermoso, V.; Abell, R.; Linke, S.; Boon, P. The role of protected areas for freshwater biodiversity conservation: Challenges and opportunities in a rapidly changing world. Aquat. Conserv. 2016, 26, 3–11. [Google Scholar] [CrossRef]
- Meyer, C.; Thiel, A. Institutional change in water management collaboration: Implementing the European Water Framework Directive in the German Odra river basin. Water Policy 2012, 14, 625–646. [Google Scholar] [CrossRef]
- Kanakoudis, V.; Tsitsifli, S.; Azariadi, T. Overview of the River Basin Management Plans developed in Greece under the context of the Water Framework Directive 2000/60/EC focusing at the economic analysis. Water Resour. Manag. 2015, 29, 3149–3174. [Google Scholar] [CrossRef]
- Galbiati, L.; Zaldivar, J.M.; Somma, F.; Bouraoui, F.; Moren-Abat, M.C.; Bidoglio, G.; D’Eugenio, J. Pilot River Basin Outcome Report: Testing of the WFD Guidance Documents; Joint Research Centre and the Directorate General Environment of the European Commission: Luxembourg, 2005; pp. 1–104. ISBN 92-894-8980-4. [Google Scholar]
- Kanakoudis, V.; Tsitsifli, S. River basin management plans developed in Greece based on the WFD 2000/60/EC guidelines. Desalin. Water Treat. 2015, 56, 1231–1239. [Google Scholar] [CrossRef]
- Kampa, E.; Bressers, H. Evolution of the Greek national regime for water resources. Water Policy 2008, 10, 481. [Google Scholar] [CrossRef]
- Directorate-General for Environment. Staff Working Document: The EU Environmental Implementation Review, Country Report—GREECE. Accompanying the document: The EU Environmental Implementation Review: Common Challenges and How to Combine Efforts to Deliver Better Results; European Commission: Brussels, Belgium, 2008; pp. 1–25. [Google Scholar]
- Wagner, I.; Zalewski, M. Ecohydrology as a basis for the sustainable city strategic planning: Focus on Lodz, Poland. Rev. Environ. Sci. Biol. 2009, 8, 209–217. [Google Scholar] [CrossRef]
- McClain, M.E.; Chícharo, L.; Fohrer, N.; Gaviño Novillo, M.; Windhorst, W.; Zalewski, M. Training hydrologists to be ecohydrologists and play a leading role in environmental problem solving. Hydrol. Earth Syst. Sci. 2012, 16, 1685–1696. [Google Scholar] [CrossRef] [Green Version]
- Hernández-Crespo, C.; Martín, M. Determination of background levels and pollution assessment for seven metals (Cd, Cu, Ni, Pb, Zn, Fe, Mn) in sediments of a Mediterranean coastal lagoon. Catena 2015, 133, 206–214. [Google Scholar] [CrossRef] [Green Version]
- Romo, S.; Fernández, F.; Ouahid, Y.; Barón-Sola, Á. Assessment of microcystins in lake water and fish (Mugilidae, Liza sp.) in the largest Spanish coastal lake. Environ. Monit. Assess 2012, 184, 939–949. [Google Scholar] [CrossRef] [PubMed]
- Young, C.J.; Jordan, A.; Searle, R.K.; Butler, A.; Chapman, S.D.; Simmons, P.; Watt, D.A. Does stakeholder involvement really benefit biodiversity conservation? Biol. Conserv. 2013, 158, 359–370. [Google Scholar] [CrossRef] [Green Version]
- Ramin, M.; Cheng, Y.S.V.; Kim, D.K.; Ni, J.F.; Javed, A.; Kelly, E.N.; Yang, C.; Midlane-Jones, S.; Mugalingam, S.; Arhonditsis, B.G. An Integrative Methodological Framework for Setting Environmental Criteria: Evaluation of Public Preferences. Ecol. Econ. 2018, 147, 298–311. [Google Scholar] [CrossRef]
- Ménard, C.; Jimenez, A.; Tropp, H. Addressing the policy-implementation gaps in water services: The key role of meso-institutions. Water Int. 2017, 43, 13–33. [Google Scholar] [CrossRef]
- Courrau, J.; Dudley, N.; Hockings, M.; Leverinhton, F.; Stolton, S. Evaluating Effectiveness: A framework for Assessing Management Effectiveness of Protected Areas, 2nd ed.; IUCN: Gland, Switzerland, 2006; pp. 1–121. ISBN 2-8317-0939-3. [Google Scholar]
- Borrini, G.; Dudley, N.; Jaeger, T.; Lassen, B.; Pathak, N.; Phillips, A.; Sandwith, T. Governance of Protected Areas : From Understanding to Action; IUCN: Gland, Switzerland, 2013; pp. 1–144. ISBN 978-2-8317-1608-4. [Google Scholar]
- Oldfield, E.E.T.; Smith, J.R.; Harrop, R.S.; Leader-Williams, N. A gap analysis of terrestrial protected areas in England and its implications for conservation policy. Biol. Conserv. 2004, 120, 303–309. [Google Scholar] [CrossRef]
- White, P.A. Economic drivers of land use and groundwater use by irrigators, Waimea Plains Nelson, New Zealand. New Zeal. J. Mar. Fresh 2011, 45, 513–524. [Google Scholar] [CrossRef] [Green Version]
Figure 1.
The five study-area national parks’ locations.

Figure 2.
Gap rating on “Management Practices” for each of the five PAs.

Figure 3.
Gap rating on “Monitoring Practices” for each of the five PAs.

Figure 4.
Gap rating on “Water Quality and Pressures” for each of the five PAs.

Figure 5.
Theoretical plot of average gap for the three fields, for five PAs and their individual grading.
Figure 5.
Theoretical plot of average gap for the three fields, for five PAs and their individual grading.

Table 1.
Percentages of gap analysis of the five protected areas (PΑs) regarding the management practices. 1: L’ Albufera, 2: Krka, 3: Mincio, 4: Una, 5: Karla.
Table 1.
Percentages of gap analysis of the five protected areas (PΑs) regarding the management practices. 1: L’ Albufera, 2: Krka, 3: Mincio, 4: Una, 5: Karla.
| Management Practices Queries | 1 | 2 | 3 | 4 | 5 |
|---|---|---|---|---|---|
| Operation under Legal and administrative frameworks (Environment, Biodiversity, Tourism, Research) | 75% | 100% | 75% | 100% | 50% |
| Main actions (Surveillance, Environmental Awareness, Monitoring) | 67% | 100% | 67% | 33% | 100% |
| Public involvement actions and stakeholder meetings | 100% | 100% | 100% | 100% | 100% |
| Different Sources of income | 50% | 50% | 25% | 75% | 50% |
| Volunteer Involvement | 100% | 100% | 100% | 100% | 100% |
| No of employees per ha of PA’s Management Body (MB) 1 | 25% | 100% | 100% | 75% | 25% |
| Departments (Environment, Biodiversity, Surveillance, Tourism, Other) | 60% | 80% | 100% | 60% | 80% |
| Employees training & education | 100% | 100% | 100% | 100% | 100% |
| Application of best practices in Management plan | 100% | 100% | 100% | 100% | 0% |
| Involvement of other Bodies/Stakeholders for management plan application | 100% | 100% | 50% | 50% | 50% |
| PA open to visitors and existence of information points | 100% | 100% | 100% | 100% | 100% |
| Organized fieldtrips or rides | 100% | 100% | 100% | 100% | 100% |
| Ecological norms or ISO standards | 0% | 0% | 0% | 0% | 0% |
| Posters stating basic behavioral standards for tourists | 100% | 100% | 100% | 100% | 100% |
| Waste and recycling disposal places within PAs | 0% | 100% | 100% | 100% | 0% |
1 The value 100% refers to the MB with the maximum number of staff of this fraction. It is not indicative of each MB performance.
Table 2.
Percentages of gap analysis of the five PAs regarding the monitoring practices. 1: L’ Albufera, 2: Krka, 3: Mincio, 4: Una, 5: Karla.
Table 2.
Percentages of gap analysis of the five PAs regarding the monitoring practices. 1: L’ Albufera, 2: Krka, 3: Mincio, 4: Una, 5: Karla.
| Monitoring Practices Queries | 1 | 2 | 3 | 4 | 5 |
|---|---|---|---|---|---|
| Water Monitoring | 0% | 100% | 100% | 100% | 100% |
| Biodiversity Monitoring | 100% | 100% | 100% | 100% | 100% |
| Water body identified according to Common Implementation Strategy Guidance (CIS) for Water Framework Directive (WFD) | 0% | 100% | 100% | 0% | 100% |
| Water body subject to a monitoring protocol | 100% | 100% | 100% | 100% | 100% |
| Monitoring involves chemical water quality | 100% | 100% | 100% | 100% | 100% |
| Monitoring involves biological water quality | 100% | 100% | 100% | 100% | 100% |
| Monitoring involves hydromorphological modification assessment | 0% | 100% | 0% | 0% | 0% |
| Impact assessment | 100% | 100% | 0% | 100% | 0% |
| Ecological services assessment | 0% | 100% | 0% | 100% | 0% |
| Frequency for hydromorphological modification monitoring | 100% | 50% | 0% | 100% | 0% |
| Frequency for hydrological parameters monitoring | 100% | 100% | 100% | 100% | 100% |
| Frequency for nutrient parameters monitoring | 100% | 100% | 100% | 50% | 100% |
| Frequency for chemical and abiotic parameters monitoring | 100% | 100% | 50% | 0% | 100% |
| Frequency for indirect algal biomass monitoring | 100% | 100% | 50% | 50% | 50% |
| Frequency for biological parameters | 100% | 50% | 100% | 0% | 50% |
Table 3.
Percentages of gap analysis of the five PΑs regarding the water quality and pressures. 1: L’ Albufera, 2: Krka, 3: Mincio, 4: Una, 5: Karla.
Table 3.
Percentages of gap analysis of the five PΑs regarding the water quality and pressures. 1: L’ Albufera, 2: Krka, 3: Mincio, 4: Una, 5: Karla.
| Water Quality and Pressures Queries | 1 | 2 | 3 | 4 | 5 |
|---|---|---|---|---|---|
| Observed changes in water quality | 100% | 50% | 50% | 100% | 0% |
| Observed changes in lake habitats | 100% | 50% | 50% | - | 0% |
| Observed changes in river habitats | - | 50% | 50% | 100% | 50% |
| Observed changes in conservation activities | 100% | 100% | 0% | 100% | 50% |
| Observed changes in birds’ presence | 100% | 50% | 50% | 100% | 100% |
| Sewage treatment plants influence in area | 0% | 100% | 50% | 100% | 100% |
| Agrochemicals influence in area | 0% | 100% | 50% | 100% | 0% |
| Organic waste influence in area | 0% | 100% | 50% | 100% | 0% |
| Discharges influence in area | 0% | 0% | 50% | 100% | 0% |
| Uncontrolled residues accumulation influence in area | 50% | 50% | 50% | 100% | 0% |
| Carlson Trophic State Index | 100% | 100% | 100% | 80% | 100% |
| 2008/105/EC—Priority Substances Directive | 100% | 75% | 75% | 50% | 25% |
| 2006/44/EC—Fish-Life Directive | 100% | 92.3% | 84.4% | 76.9% | 100% |
| WHO Standards on recreational waters | 100% | 75% | 100% | 50% | 25% |
| Other basic optional physicochemical parameters | 100% | 71.4% | 85.7% | 42.9% | 57.1% |
© 2018 by the authors. Licensee MDPI, Basel, Switzerland. This article is an open access article distributed under the terms and conditions of the Creative Commons Attribution (CC BY) license (http://creativecommons.org/licenses/by/4.0/).
Share and Cite
MDPI and ACS Style
Latinopoulos, D.; Sidiropoulos, P.; Kagalou, I. Addressing Gaps in Environmental Water Policy Issues across Five Mediterranean Freshwater Protected Areas. Water 2018, 10, 1853. https://doi.org/10.3390/w10121853
AMA Style
Latinopoulos D, Sidiropoulos P, Kagalou I. Addressing Gaps in Environmental Water Policy Issues across Five Mediterranean Freshwater Protected Areas. Water. 2018; 10(12):1853. https://doi.org/10.3390/w10121853
Chicago/Turabian StyleLatinopoulos, Dionissis, Pantelis Sidiropoulos, and Ifigenia Kagalou. 2018. "Addressing Gaps in Environmental Water Policy Issues across Five Mediterranean Freshwater Protected Areas" Water 10, no. 12: 1853. https://doi.org/10.3390/w10121853
Note that from the first issue of 2016, this journal uses article numbers instead of page numbers. See further details here.