Glacier Changes between 1976 and 2015 in the Source Area of the Ayeyarwady (Irrawaddy) River, Myanmar


Department of Geography, University of Bonn, Meckenheimer Allee 166, 53115 Bonn, Germany
*
Author to whom correspondence should be addressed.
Water 2018, 10(12), 1850; https://doi.org/10.3390/w10121850
Submission received: 4 September 2018
/
Revised: 7 December 2018
/
Accepted: 11 December 2018
/
Published: 13 December 2018
(This article belongs to the Special Issue Impacts of Climate Change on Water Resources in Glacierized Regions)
Abstract
:The Ayeyarwady River in Myanmar is one of the largest rivers in Southeast Asia. It is predominantly fed by monsoonal precipitation and, to a lower extent, by meltwater from glaciers located in the Himalaya mountains. Information about the glaciers in its headwater region and glacier changes is scarce. Glaciers, in general, are highly important for the hydrological system and are contributing to river flow, therefore playing a key role in water availability, especially in catchments with (semi-) arid downstream areas as is in parts of Myanmar. This study investigated 130 glaciers in the Ayeyarwady headwaters by analyzing satellite images from Landsat missions between 1976 and 2015. The results of the glacier area and volume change analyses indicate that the glaciers are experiencing unprecedented losses. Over the 39 years, the glaciers lost up to 54.3 ± 7.64% of their area and 60.09 ± 1.56% of their mass and volume. The highest losses occurred in the period 2002–2015, which corresponds to increasing global and local warming. This development will probably have a strong influence on the glaciers’ storage function and will affect the local river runoff in the headwater region.
1. Introduction
Over half of the world’s water is extracted from rivers, which are often fed by glaciers [1]. Therefore, the world’s glaciers are considered to be of high importance to ensure water supply for millions of people [1]. Because of their sensitivity to changes in temperature and precipitation, they are often referred to as “natural thermometers” [2]. Worldwide, the glaciers have lost 275 Gt per year in the period between 1993 and 2009, whereas this trend has been accelerating since 2005 [2]. These changes are particularly relevant for hydrological systems, as glaciers are a major reservoir of freshwater. Due to their capacity to store vast amounts of water, which is released in the summer months, glaciers are crucial for water supply in downstream areas, particularly in (semi-)arid regions [3,4]. In river basins, where large areas are irrigated and rainfall is little, agriculture strongly depends on the glaciers’ contribution to river runoff [5,6,7]. Due to the major importance of glaciers for fresh water availability in combination with global climate change and increasing population growth in large parts of the world, it is essential to measure and monitor possible changes. Only when the dimension of changes and the implications for the downstream areas are known can people and governments take measures to adapt to and manage possible consequences. However, monitoring data for river discharge are not available or even not existing for many remote regions, as is the case for the upper Ayeyarwady River in Northern Myanmar.
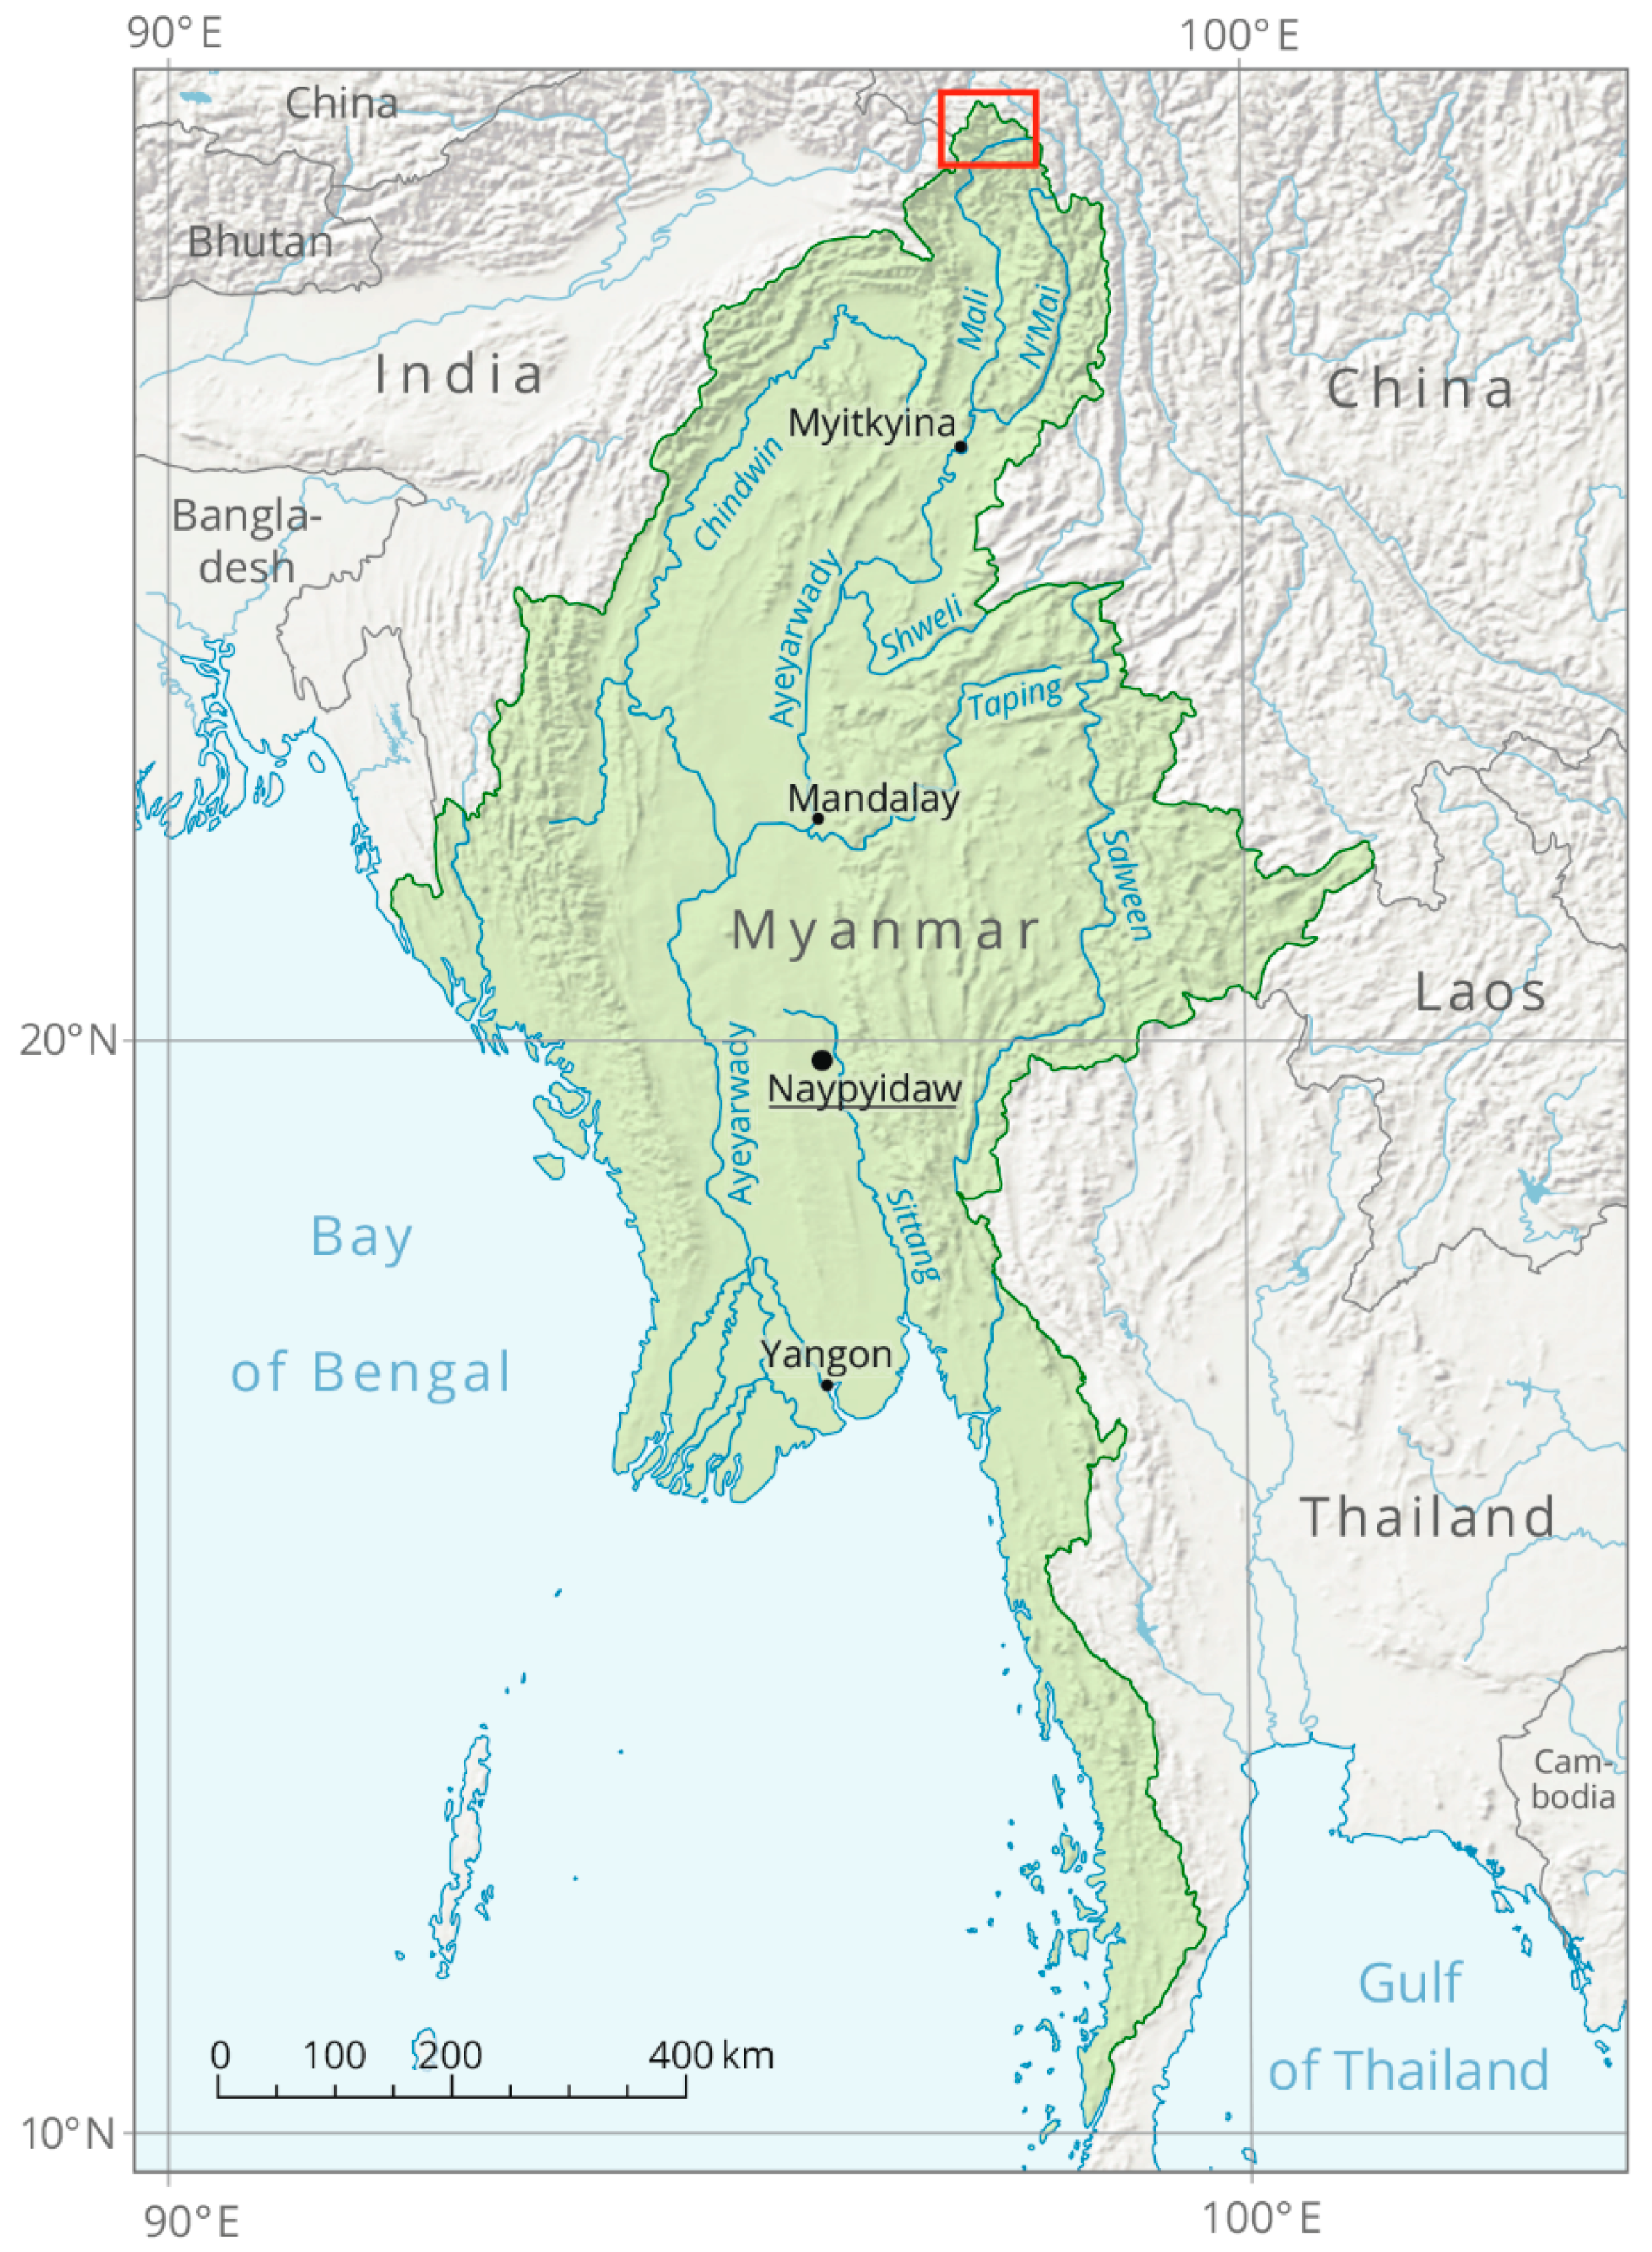
The headwaters of the Ayeyarwady River (also referred to as Ayeyarwaddy or Irrawaddy River) are located in the northern parts of Myanmar and the adjacent Tibet Autonomous Region of China in the syntaxis of the Eastern Himalayas and the Tibetan Plateau. The glaciers located in the headwater region are of a summer accumulation type and are predominantly fed by summer monsoon precipitation. Thus, this is a region where precipitation and river discharge peak in the summer, and one can hypothesize that the glaciers do not play a crucial role in water supply [6]. However, about 1.7 million people live in the Myanmar river source area [8], without counting the people living in the Chinese part of the headwaters, depending on river discharge also during weak monsoon years when precipitation amounts are low and meltwater input might be more relevant. The Ayeyarwady River emerges in Northern Myanmar from the rivers Mali and N’Mai near the city of Myitkyina (Figure 1). It is of high significance for the country, as it is considered as the lifeline of Myanmar [9], and it functions as the main transport system and the central water supply system for people and agriculture [9,10]. Despite its importance for Myanmar, the Ayeyarwady is the least known river among the largest rivers in Asia, such as the Indus, Ganges, Brahmaputra, or Yangtze Rivers [10]. For a long time, Myanmar was governed by a military regime that kept the influence of other countries and international organizations at a low level. Due to the long isolation of the country, there is little to no information and international scientific research on human–water issues [9].
The glaciers in the Ayeyarwady headwaters have already been studied by Bajracharya and Shrestha [11]. However, the study only assesses the situation in 2009, focuses on the entire Hindu-Kush Himalaya region, and does not examine whether the glaciers have changed over the past decades. The present paper helps to fill a gap that has been shown, amongst others, by Bajracharya and Shrestha [11]. As the glaciers are located in a rugged and hardly accessible terrain in the Himalaya mountains, we applied satellite imagery to map and analyze glacier changes in the last four decades. Based on the results, implications for possible future changes in river runoff are discussed.
2. Materials and Methods
2.1. Remote Sensing Data and Glacier Delineation
The glaciated area in the headwater region of the Ayeyarwady River is covered by two Landsat images (Row/Path: 133/40 & 133/41 for Landsat 5–8 and 143/40 & 143/411 for Landsat 2). Eight images from four different years (1976, 1990, 2005, and 2015) and four different Landsat sensors were chosen in total to identify possible glacier changes over the last decades (Table 1). Additionally, an ASTER GDEM (pixel size 30 m) was downloaded from the USGS EarthExplorer website [12] in order to analyze the glacier volumes because other studies have shown that SRTM elevation data accuracy may decrease in high altitude areas like the Himalayas [13,14]. We applied a well-established semi-automated approach using the TM3/TM5 band ratio to delineate the glacier outlines [14,15]. Misclassified areas, such as snow patches and water bodies, were corrected manually using false color composite (TM bands 5, 4, and 3) on the Landsat imagery.
The glaciers were firstly identified on the Landsat 8 images from 2015. Thereafter, the glacier areas for 2002, 1990, and 1976 were delineated based on the glaciers’ location in 2015. The glacier areas for the years 2015, 2002, and 1990 were delineated by calculating the TM3/TM5 ratio image using ArcGIS’s Raster Calculator. To discriminate glacier area against snow area, a threshold had to be applied to the binary TM3/TM5 ratio image. Although a threshold of 2 is suggested by Bolch [16], the exact threshold had to be identified by an iterative process and comparison with a false-color-composite (FCC) image. The thresholds that fitted best for the studied images are presented in Table 2. The delineation of the glacier area in 1976 was conducted manually because the Landsat MSS sensor lacks a shortwave-infrared band.
In order to determine the accuracy of the calculations and to estimate the uncertainty and errors of all values mentioned below, σ is given for all parameters. σ is based here on the repetition of the calculations and describes the variance of the scatter values.
2.2. Glacier Terminus Position and Glacier Length
The glacier’s terminus position and the glacier length had been identified by the difference between minimum and maximum elevation. The size of a glacier can be calculated based on several different parameters such as length, width, area, volume, elevation range, or thickness, which are generally correlated with each other [17]. Consequential, a scaling relationship between area and volume could be established. In the volume-area scaling approach by Bahr et al. [18], the statistical-theoretical relationship between surface area (in km2) and volume (in km3) was used to estimate glacier volume:
where V = volume, A = area, c = 0.03, and γ = 1.36. c and γ were initially considered empirical constants that were generated from 144 valley glaciers [18,19,20]. As γ is considered a constant, it had to be chosen between γ = 1.375 for mountain and valley glaciers or γ = 1.25 for ice caps [19]. Since the glaciers in the study area are rather defined as valley glaciers, γ = 1.375 was chosen for parameter γ. Due to the lack of further information on width and thickness, the scaling parameter c also had to be determined from the literature; the global mean value for valley glaciers was chosen as c = 0.034 [19,20]. Thus, the volume-area scaling was calculated as follows:
The glacier volume was calculated on the basis of two-dimensional information. To calculate the total glacier volume of all glaciers in the study region, Equation (2) was applied to every single glacier. The total glacier volume was calculated by the addition of every single glacier volume value:
After the determination of glacier volume, the values were used to calculate the glacier mass because it results from the product of volume and density. To convert volume into mass balance, a certain specific density had to be assumed because no density information was available for the study region [21,22]. In the accumulation area, density can range from 900 kg/m3 for ice to 550–600 kg/m3 for firn. The ablation area shows a density of 900 kg/m3. Due to the fact that the distinction between ablation and accumulation area is sometimes difficult, it is common to use the density of 900 kg/m3 for the whole glacier area [21]. The glacier mass M was calculated as follows:
2.3. Glacier Change Analyses
Changes in glacier parameters were generally calculated by the difference between two images captured at two different points in time. Glacier area changes were determined from every single sensor band by subtracting an earlier image from a later one, captured at a similar time of day and similar solar geometry. Thus, the thresholding of a TM3/TM5 band ratio image, the manual delineation and the application of GIS mathematics gave estimates for the glacier area for every single time step. The glacier area change was identified by the subtraction of two different area values.
2.4. Conversion into Water Equivalent
The water equivalent (WE) is the amount of water that is stored in a glacier or snowpack. It is described as the depth of water that would result if the entire ice or snow of a glacier/snowpack would melt immediately [23,24]. The water equivalent was calculated as follows:
To calculate the water equivalent of the glacier ice loss between 1976 and 2015, the change in mean glacier thickness had to be calculated initially. The previous calculations did not include the mean glacier thickness for the Ayeyarwady glaciers. However, it is possible to calculate the change in thickness (ΔT) using the previously calculated change in glacier area (ΔA) and glacier volume (ΔV):
Afterwards, the annual mean change of glacier thickness (ΔT) was calculated by dividing the determined glacier thickness by the total number of years, in which the glacier changes were analyzed. For the period between 1976 and 2015, annual mean change in thickness was calculated by the following equation:
For the other considered periods 1976–1990, 1990–2002, and 2002–2015, the glacier thickness was divided by 14, 12, and 13, respectively. The actual WE was then calculated by the annual change in glacier thickness and the ratio between the assumed density of glacier ice, 900 kg/m3, and the density of water, 1000 kg/m3. Therefore, the calculation of the WE of the annual glacier changes was conducted as follows:
3. Results
3.1. Current Situation of the Glaciers
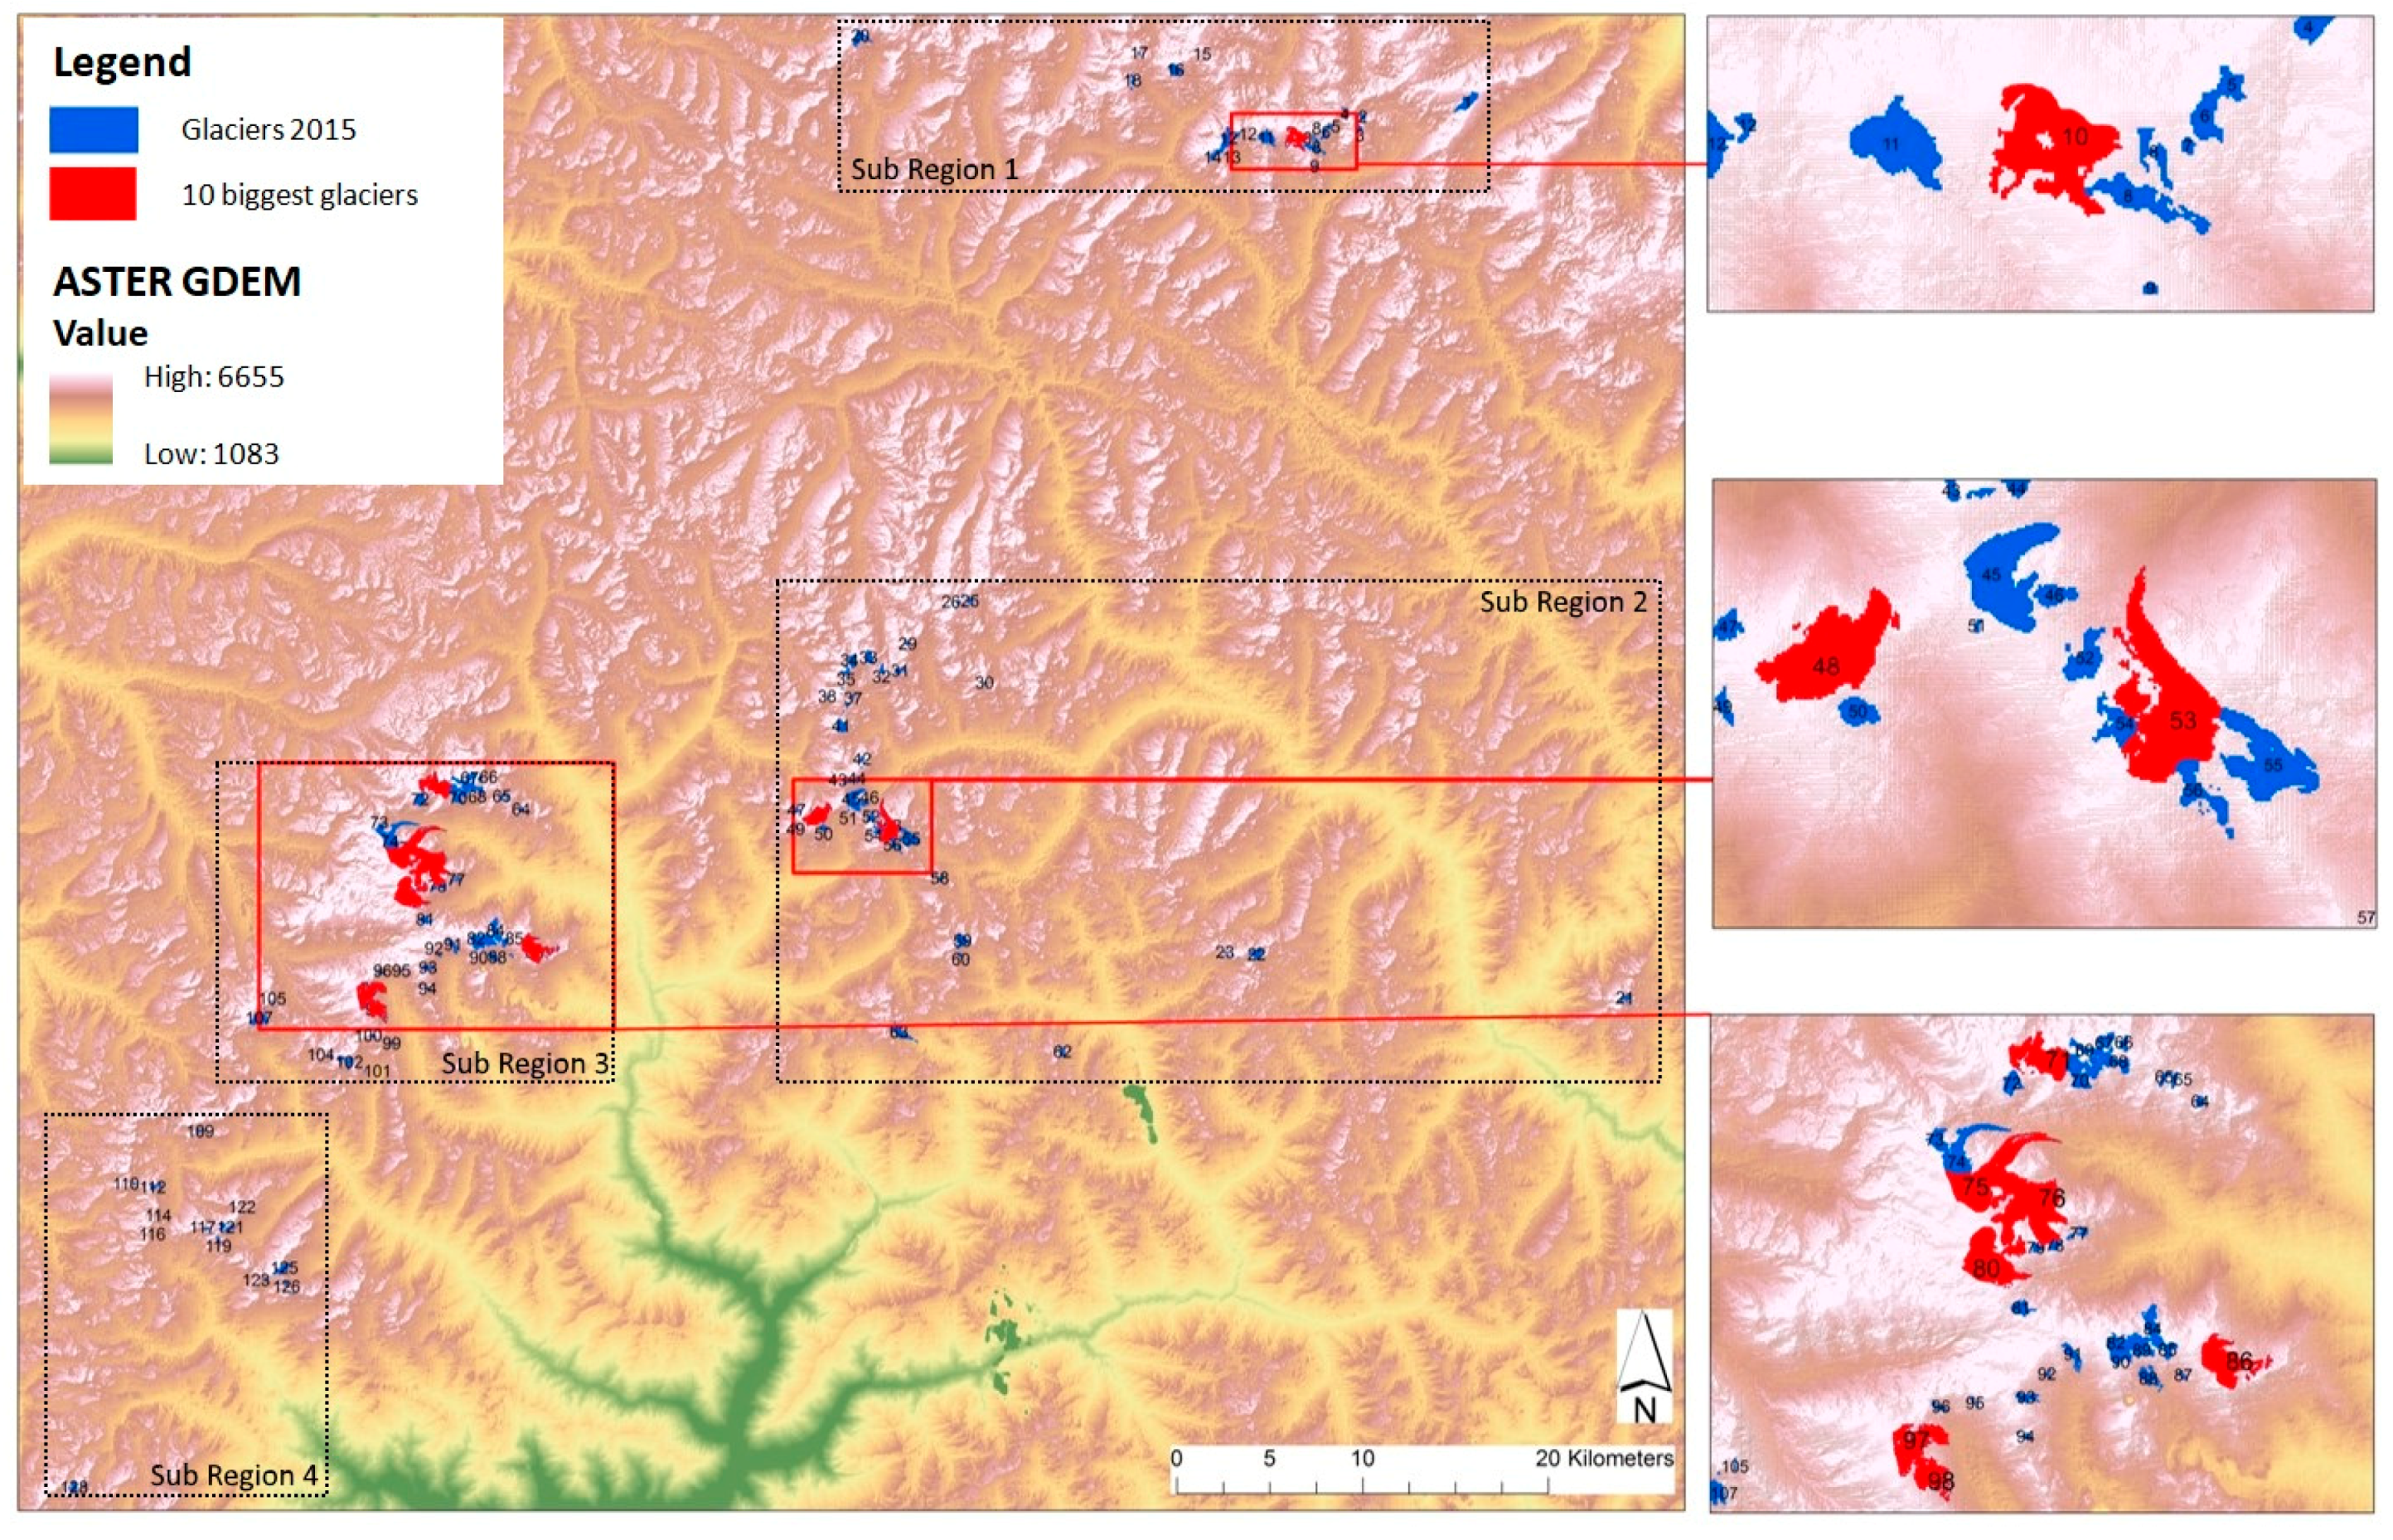
We identified 129 glaciers in the study region in 2015. Using the glacier outlines derived from the TM3/TM5 band ratio images from Landsat 8 for the year 2015, the area calculation method determined a total glacier area of 33.00 ± 2.55 km2, which is lower compared to 35.46 km2 in 2009 published by Bajracharya and Shrestha [11]. The glaciers are not evenly distributed in the whole study area, so the glaciers were grouped into four different sub-regions (Figure 2), which makes it possible to identify glacier changes and possible consequences more locally. The glacier area was allocated to four glacier sub-regions (1–4), see Table 3.
All glaciers are located in altitudes between 3937 and 5758 m a.s.l. The highest number of glaciers with a combined area of 19.08 ± 1.54 km2 is located in Sub-Region 3 (Table 3). In Sub-Region 4, the total glacier area is only 1.19 ± 0.07 km2.
For 2015, the volume-area-scaling shows a total glacier volume of 1.02 ± 0.10 km3. Converted into mass, this volume estimation results in 0.92 Gt (Table 4). Like the glacier area, volume and mass values are highest in Sub-Region 3, as Sub-Region 3 also shows the largest glacier area of the four sub-regions. The WE of the total ice reserves for all regions was around 27,953 ± 652 mm in the year 2015.
3.2. Glacier Changes between 1976 and 2015
It was possible to identify 130 glaciers in 1976, 1990, and 2002, so one more glacier compared to 2015. Furthermore, it could be noticed that some of the glaciers disintegrated over time and became two or more single glaciers. For comparison and analysis reasons, the disintegrated glaciers were combined and were treated as one glacier.
3.2.1. Changes in Glacier Area
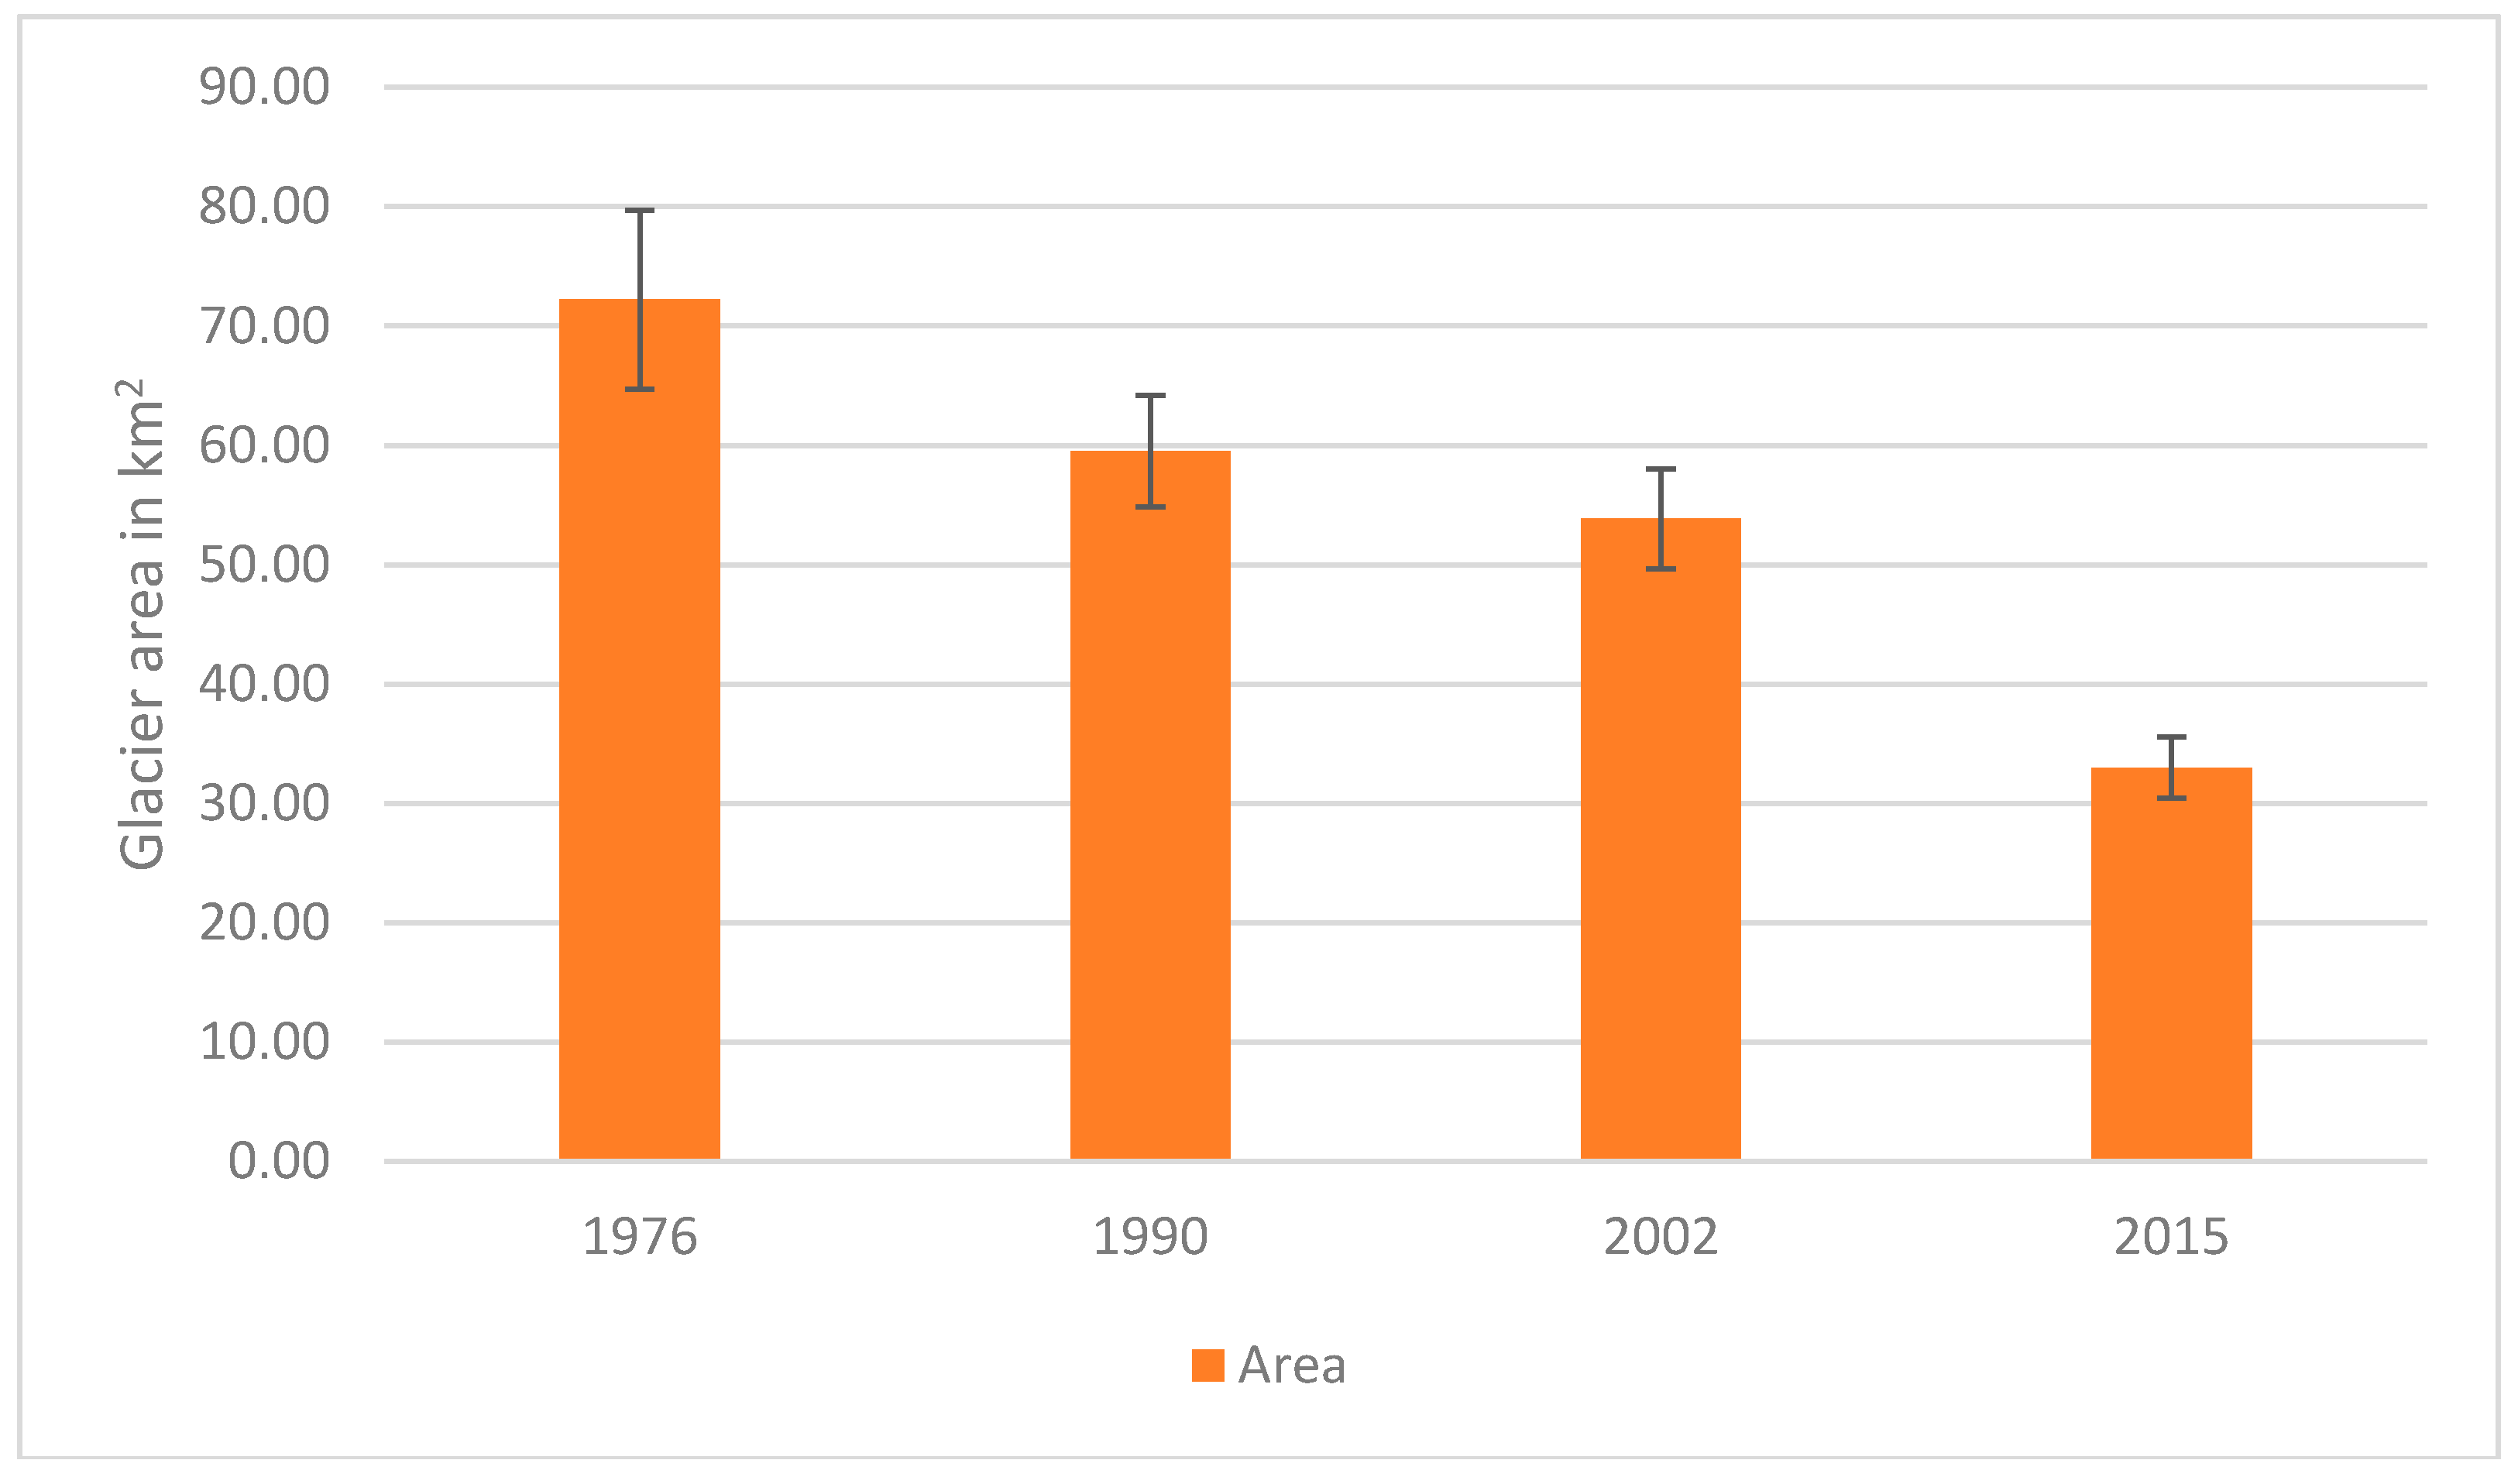
Between 1976 and 2015, total glacier area changes of −39.21 ± 4.94 km2 could be determined (Figure 3). The manual digitization of glacier area outlines for 1976 results in a glacier area of 72.21 ± 7.5 km2, whereas the semi-automatic glacier delineation approach results in a glacier area extent of 33.00 ± 2.55 km2 for the year 2015 (Table 5).
Furthermore, it is clearly visible that the largest retreat of glacier area occurred in the period between 2002 and 2015: −20.85 ± 1.62 km2 or −38.71 ± 3.27% (a mean annual change rate of −1.6 km2 or −2.98%). A remarkable retreat of glacier area also occurred between 1976 and 1990, when approximately 17.56 ± 4.37% (a mean annual change rate of −0.91 km2 or −1.24) of the total glacier area had melted. The changes in the glacier area between 1990 and 2002 are relatively small when they are compared to the other time periods, as glacier area only changed by about −5.69 ± 0.49 km2 or −9.55 ± 0.89% (a mean annual change rate of −0.47 km2 or −0.8%; Table 5).
The glacier area was classified into five different classes from <0.1 km2 to >2 km2. Most glaciers in the years 1976, 1990, and 2002 are in the class 0.1–0.5 km2, whereas the majority of the glaciers in 2015 were smaller than 0.1 km2. The glacier area change was also classified by size to determine the differences between smaller and larger glaciers. The smaller glaciers (<1 km2) show negative relative changes in the area of −63.51 ±19.97%, whereas the glaciers >1 km2 are shrinking at a rate of 33.17 ± 0.02%. The relative changes in glacier area between 1976 and 2015 in Sub-Regions 1, 2, and 4 exceed the overall change in glacier. The glaciers in these sub-regions have lost up to 75% of their total glacier area over a period of 39 years, whereas the glaciers in Sub-Region 3 lost about 38.56 ± 0.98% (Figure 4).
3.2.2. Changes in Terminus Position and Length
The mean minimal elevation for the glaciers was located at 4699 m a.s.l. in 1976. Over time, it moved upward and was located at 4724 m a.s.l. in 1990 and at 4751 m a.s.l. in 2002. In 2015, the mean minimal elevation was 4821 m a.s.l; at a 122 m higher altitude compared to 1976. The mean minimum elevation changed the most in the period 2002–2015, as was observed also for the area changes.
Glacier length changes have been investigated for the 10 largest glaciers in 2015 (Figure 2). The analysis shows a very diverse picture as the length changes range from around 13 to −675 m between 1976 and 2015. Considering the whole investigation period, the 10 largest glaciers retreated in length, but 8 of the largest glaciers advanced between 1990 and 2002.
3.2.3. Changes in Volume and Mass
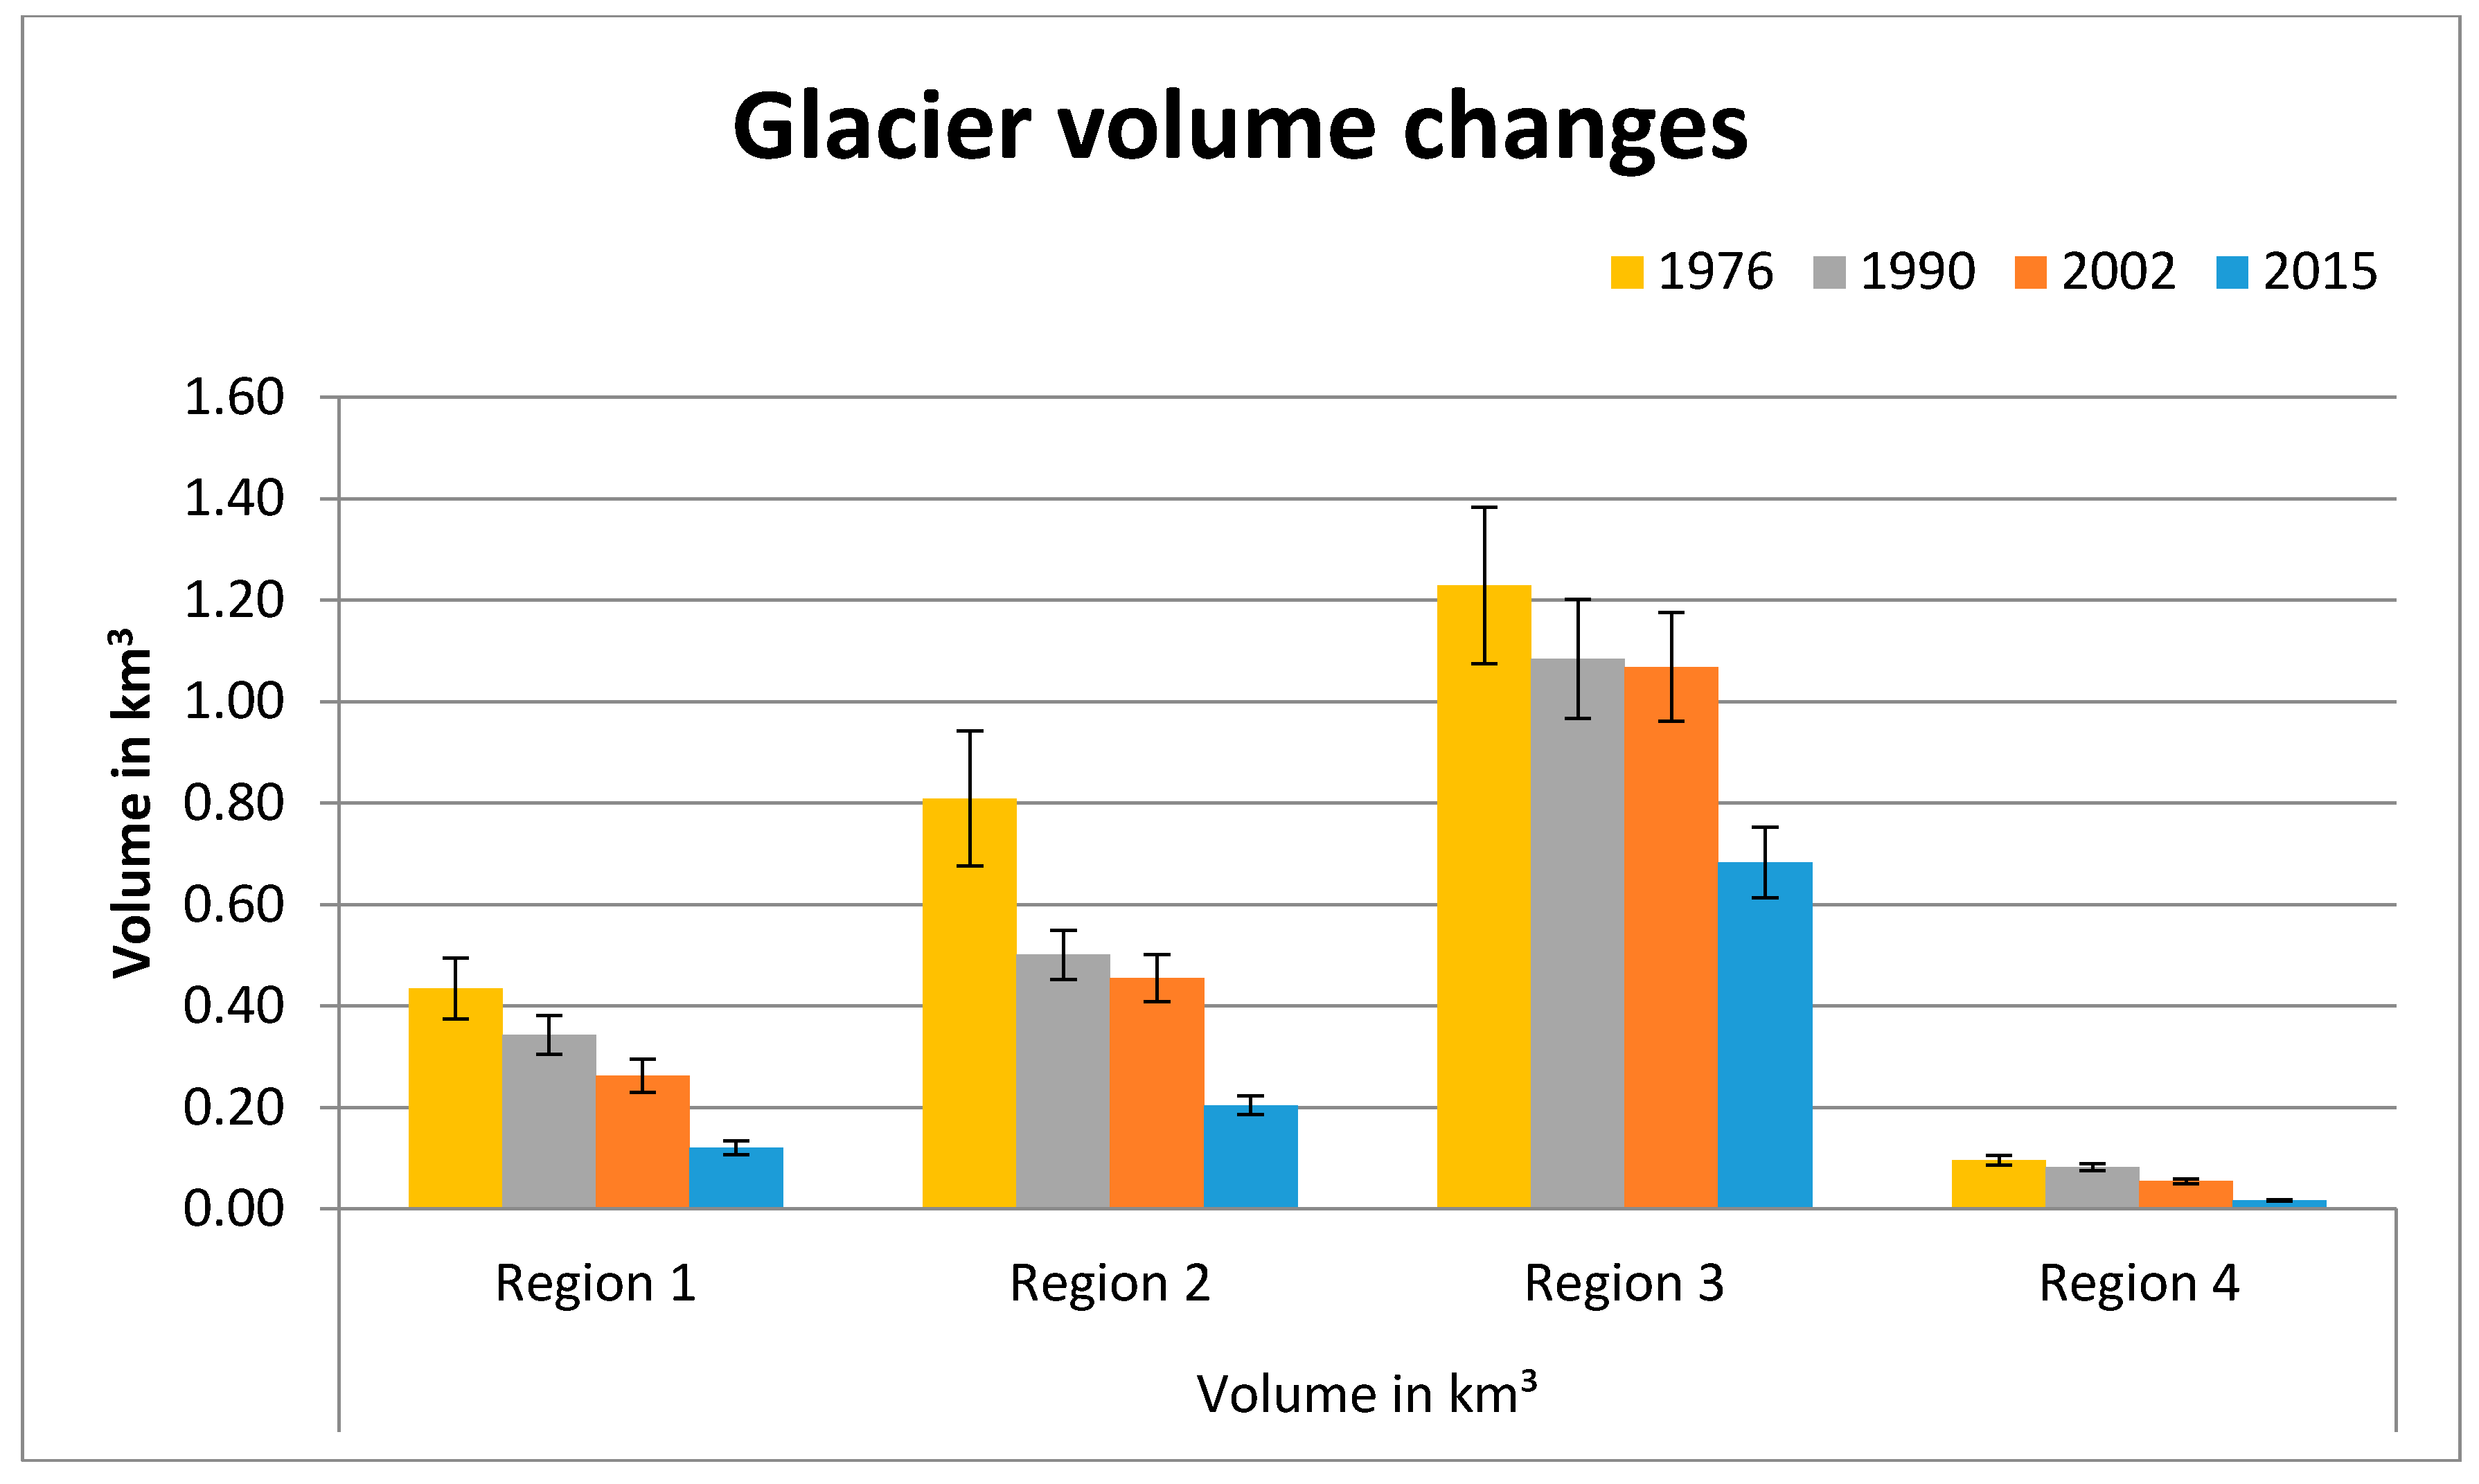
For 1976, a total glacier volume of 2.57 ± 0.36 km3 was calculated, which can be converted to 2.31 ± 0.32 Gt of glacier mass, while in 2015 only about 1.02 ± 0.1 km3 ± 0.92 ± 0.09 Gt could be determined. Between 1976 and 2015, the glaciers lost 58.31% of their volume and mass. Considering the periods 1976–1990, 1990–2002, and 2002–2015, it can be observed that the volume and mass loss increased over time and the greatest losses occurred between 2002 and 2015. Glaciers in Sub-Region 1 decreased from about 0.43 ± 0.06 km3 in 1976 to 0.12 ± 0.01 km3 in 2015, glaciers in Sub-Region 2 from about 0.81 ± 0.13 to 0.20 ± 0.02 km3, glaciers in Sub-Region 3 from about 1.23 ± 0.15 to 0.68 ± 0.07 km3, and glaciers in Sub-Region 4 from about 0.1 ± 0.01 to almost 0.02 ± 0.001 km3 (Figure 5). The glaciers in Sub-Region 4 lost nearly 82.67 ± 0.31% of their volume and mass between 1976 and 2015, and the majority of these losses (~69.53 ± 0.17%) occurred in the period 2002–2015. In Sub-Regions 1 to 3, the greatest changes can also be observed in the period 2002–2015. In general, the mass and volume in Sub-Region 3 changed the least in percentage terms for all time periods compared to the other regions. Absolute losses were greatest in Sub-Regions 2 and 3, and lowest in Sub-Region 4.
4. Discussion
We identified 129 glaciers in total, compared to 133 glaciers delineated by Bajracharya and Shrestha [11]. Therefore, four glaciers could already had disappeared by 2015 or it was not possible to map the glaciers, due to possible misinterpretations.
In general, the studied glaciers in the Ayeyarwady headwaters show a retreating trend in all analyzed glacier parameters between 1976 and 2015. Regarding the glacier changes in the four sub-regions, it is obvious that the glacier parameters such as area, volume, mass, length, and terminus position show the same behavior in the sub-regions as in the glacierized area as a whole. The highest losses in all regions occurred between 2002 and 2015 (Table 5). In general, the changes in glacier area, volume, and mass in Sub-Region 4 increased over time, which means that the total and annual loss rates in every glacier parameter are lowest in the period 1976–1990 and highest between 2002 and 2015. Area and volume changes of the glaciers in Sub-Regions 1, 2, and 3 are following a different trend, as they show the smallest losses, both totally and annually, in the period 1990–2002 and not at the beginning of the investigation period (Figure 5 and Table 5).
The importance of the meltwater contribution to the runoff of the Ayeyarwady River relative to other inputs such as monsoon rainfall and snow is unknown and unstudied. The relevance of the net melt input to gauging stations downstream is also still not known and should be investigated in future studies. In general, the river is predominantly fed by monsoon rains, but meltwater could play a crucial role at least in the upper basin, where the two source rivers originate. Bookhagen and Burbank [25] showed that the Eastern Himalaya river basins receive less than 20% from meltwater and ~80% from monsoon rains during the summer months. They stated that meltwater contribution plays a significant role during pre- and early monsoon season [25]. For our study region, we argue that meltwater contribution is likely to be important also during weak monsoon years. In another study from the Tamor River basin in Nepal, Panday et al. [26] came to the finding that ~30% of annual discharge is generated by meltwater, which may entail societal consequences. In our study, Sub-Region 3 lost the highest amount of water annually (~1 m) compared to the other sub-regions. We conclude that particularly the glaciers in Sub-Region 3 and their contribution to river runoff should be investigated in greater detail.
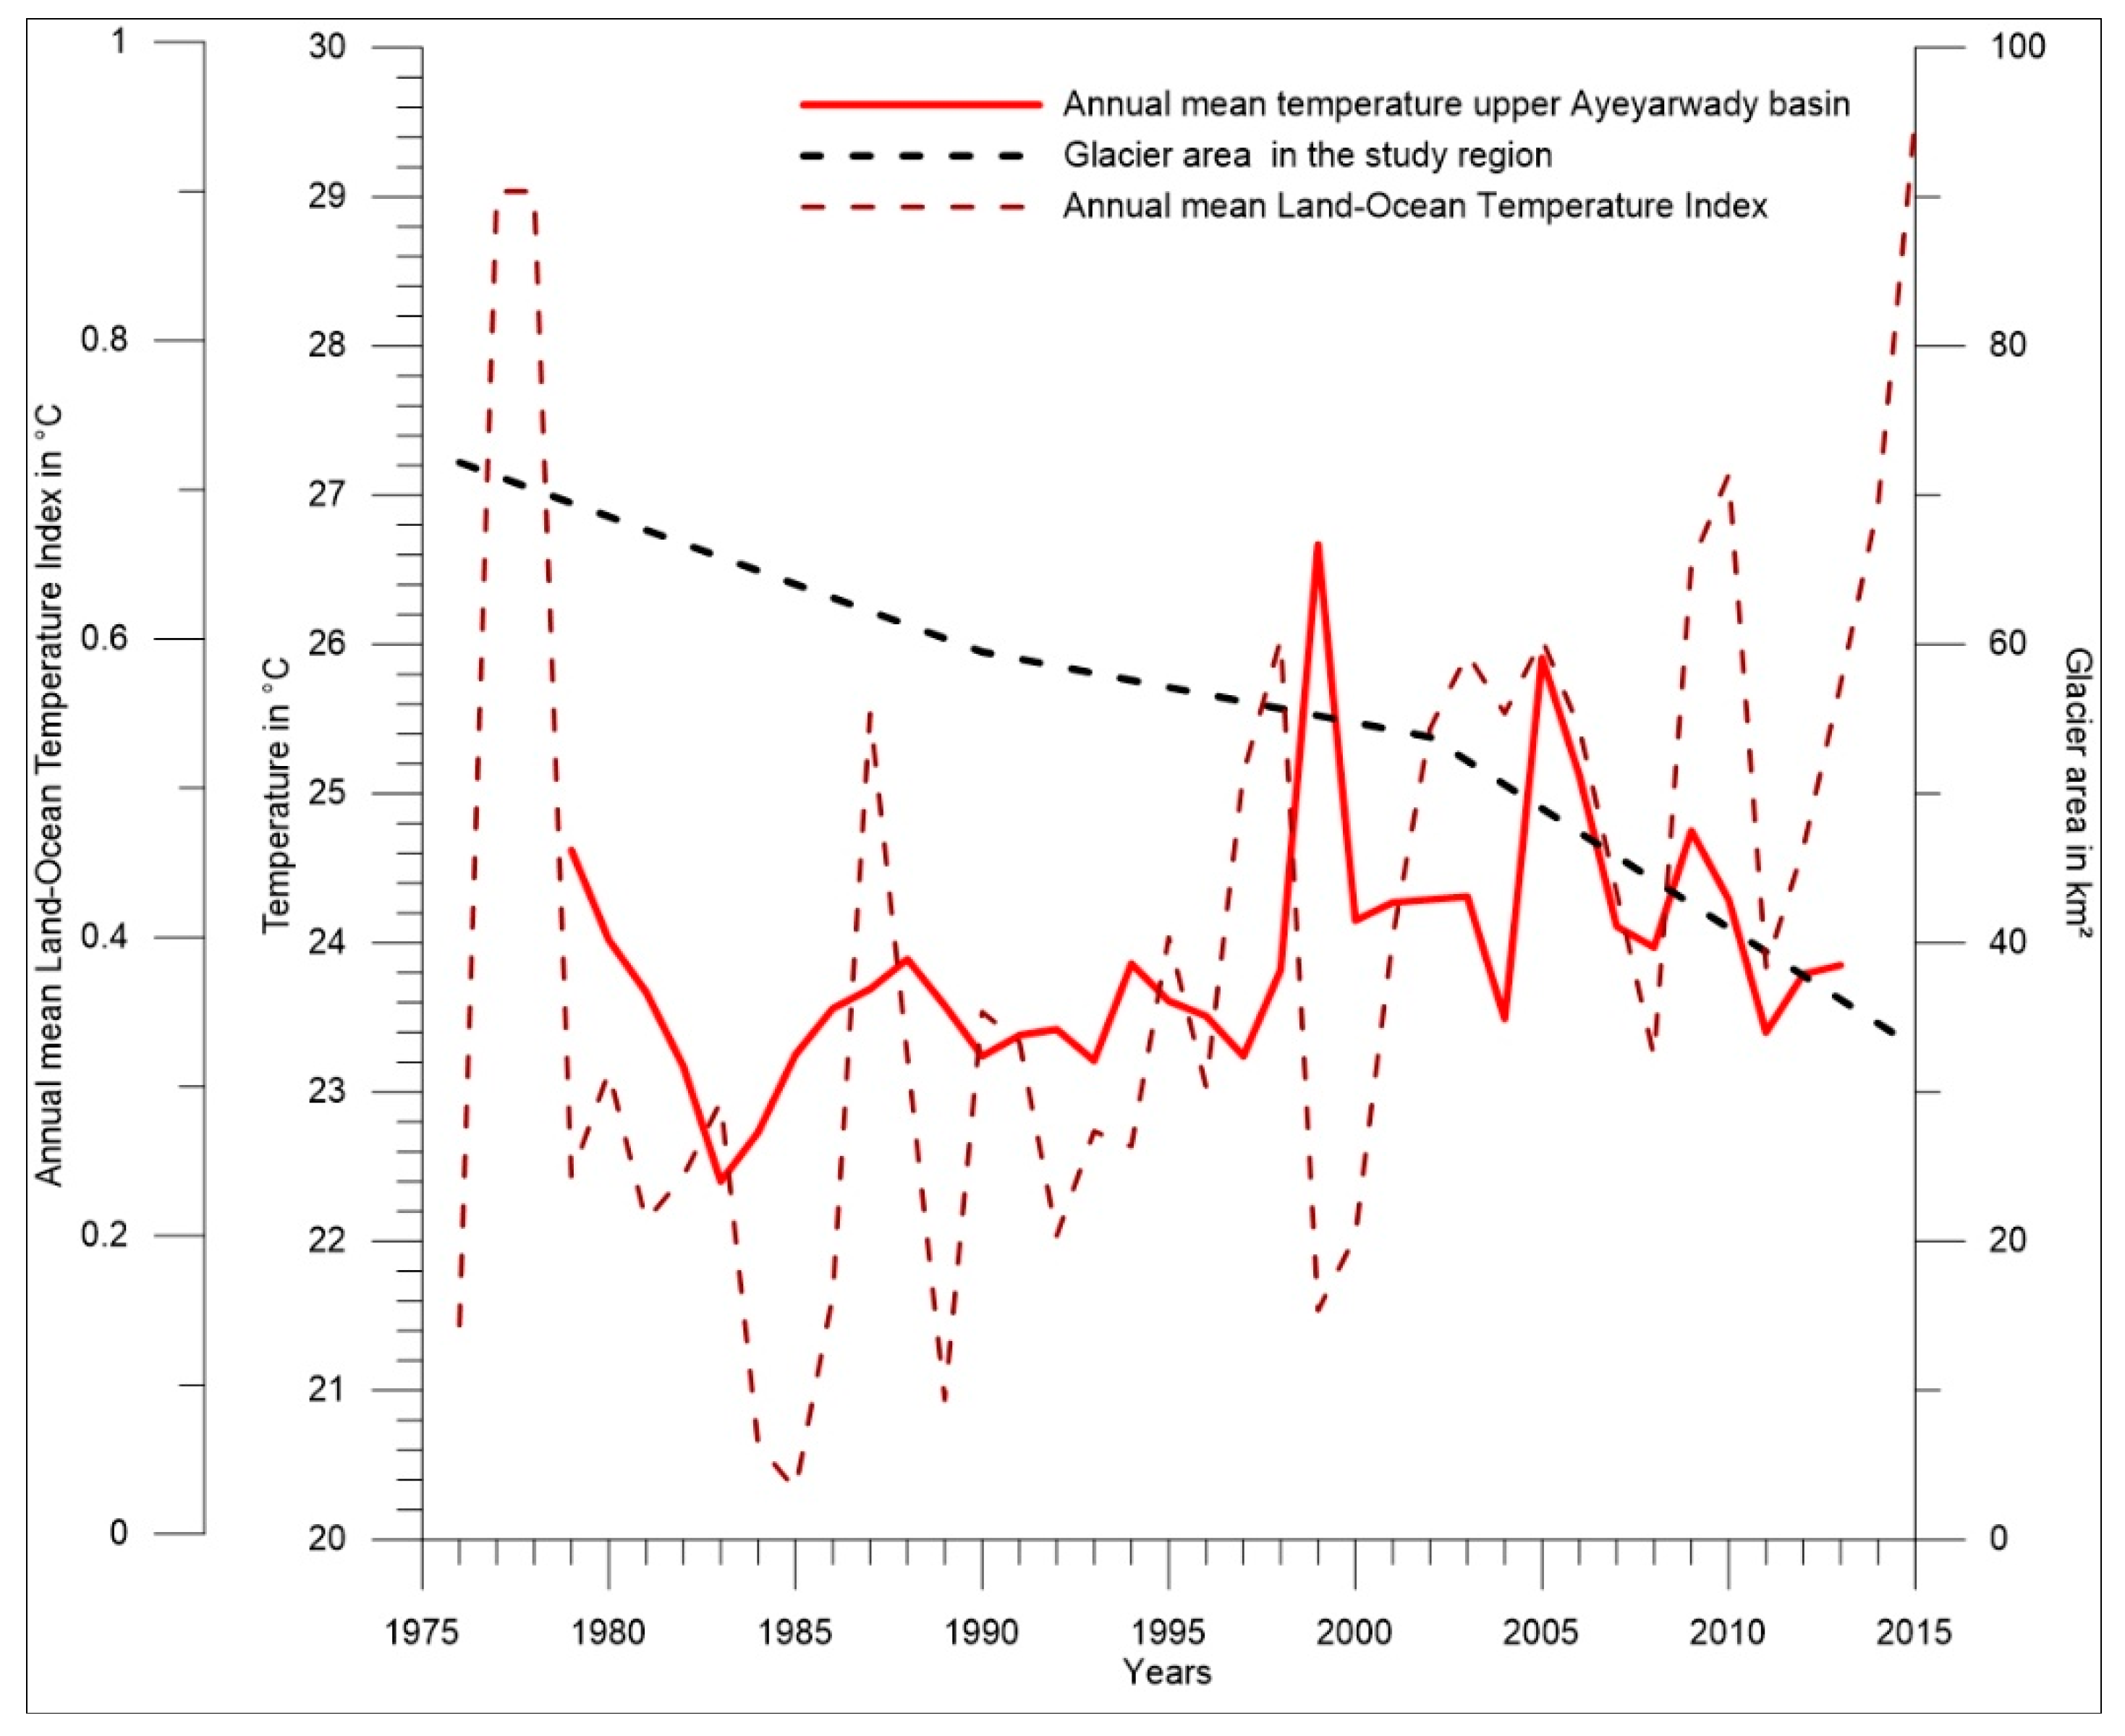
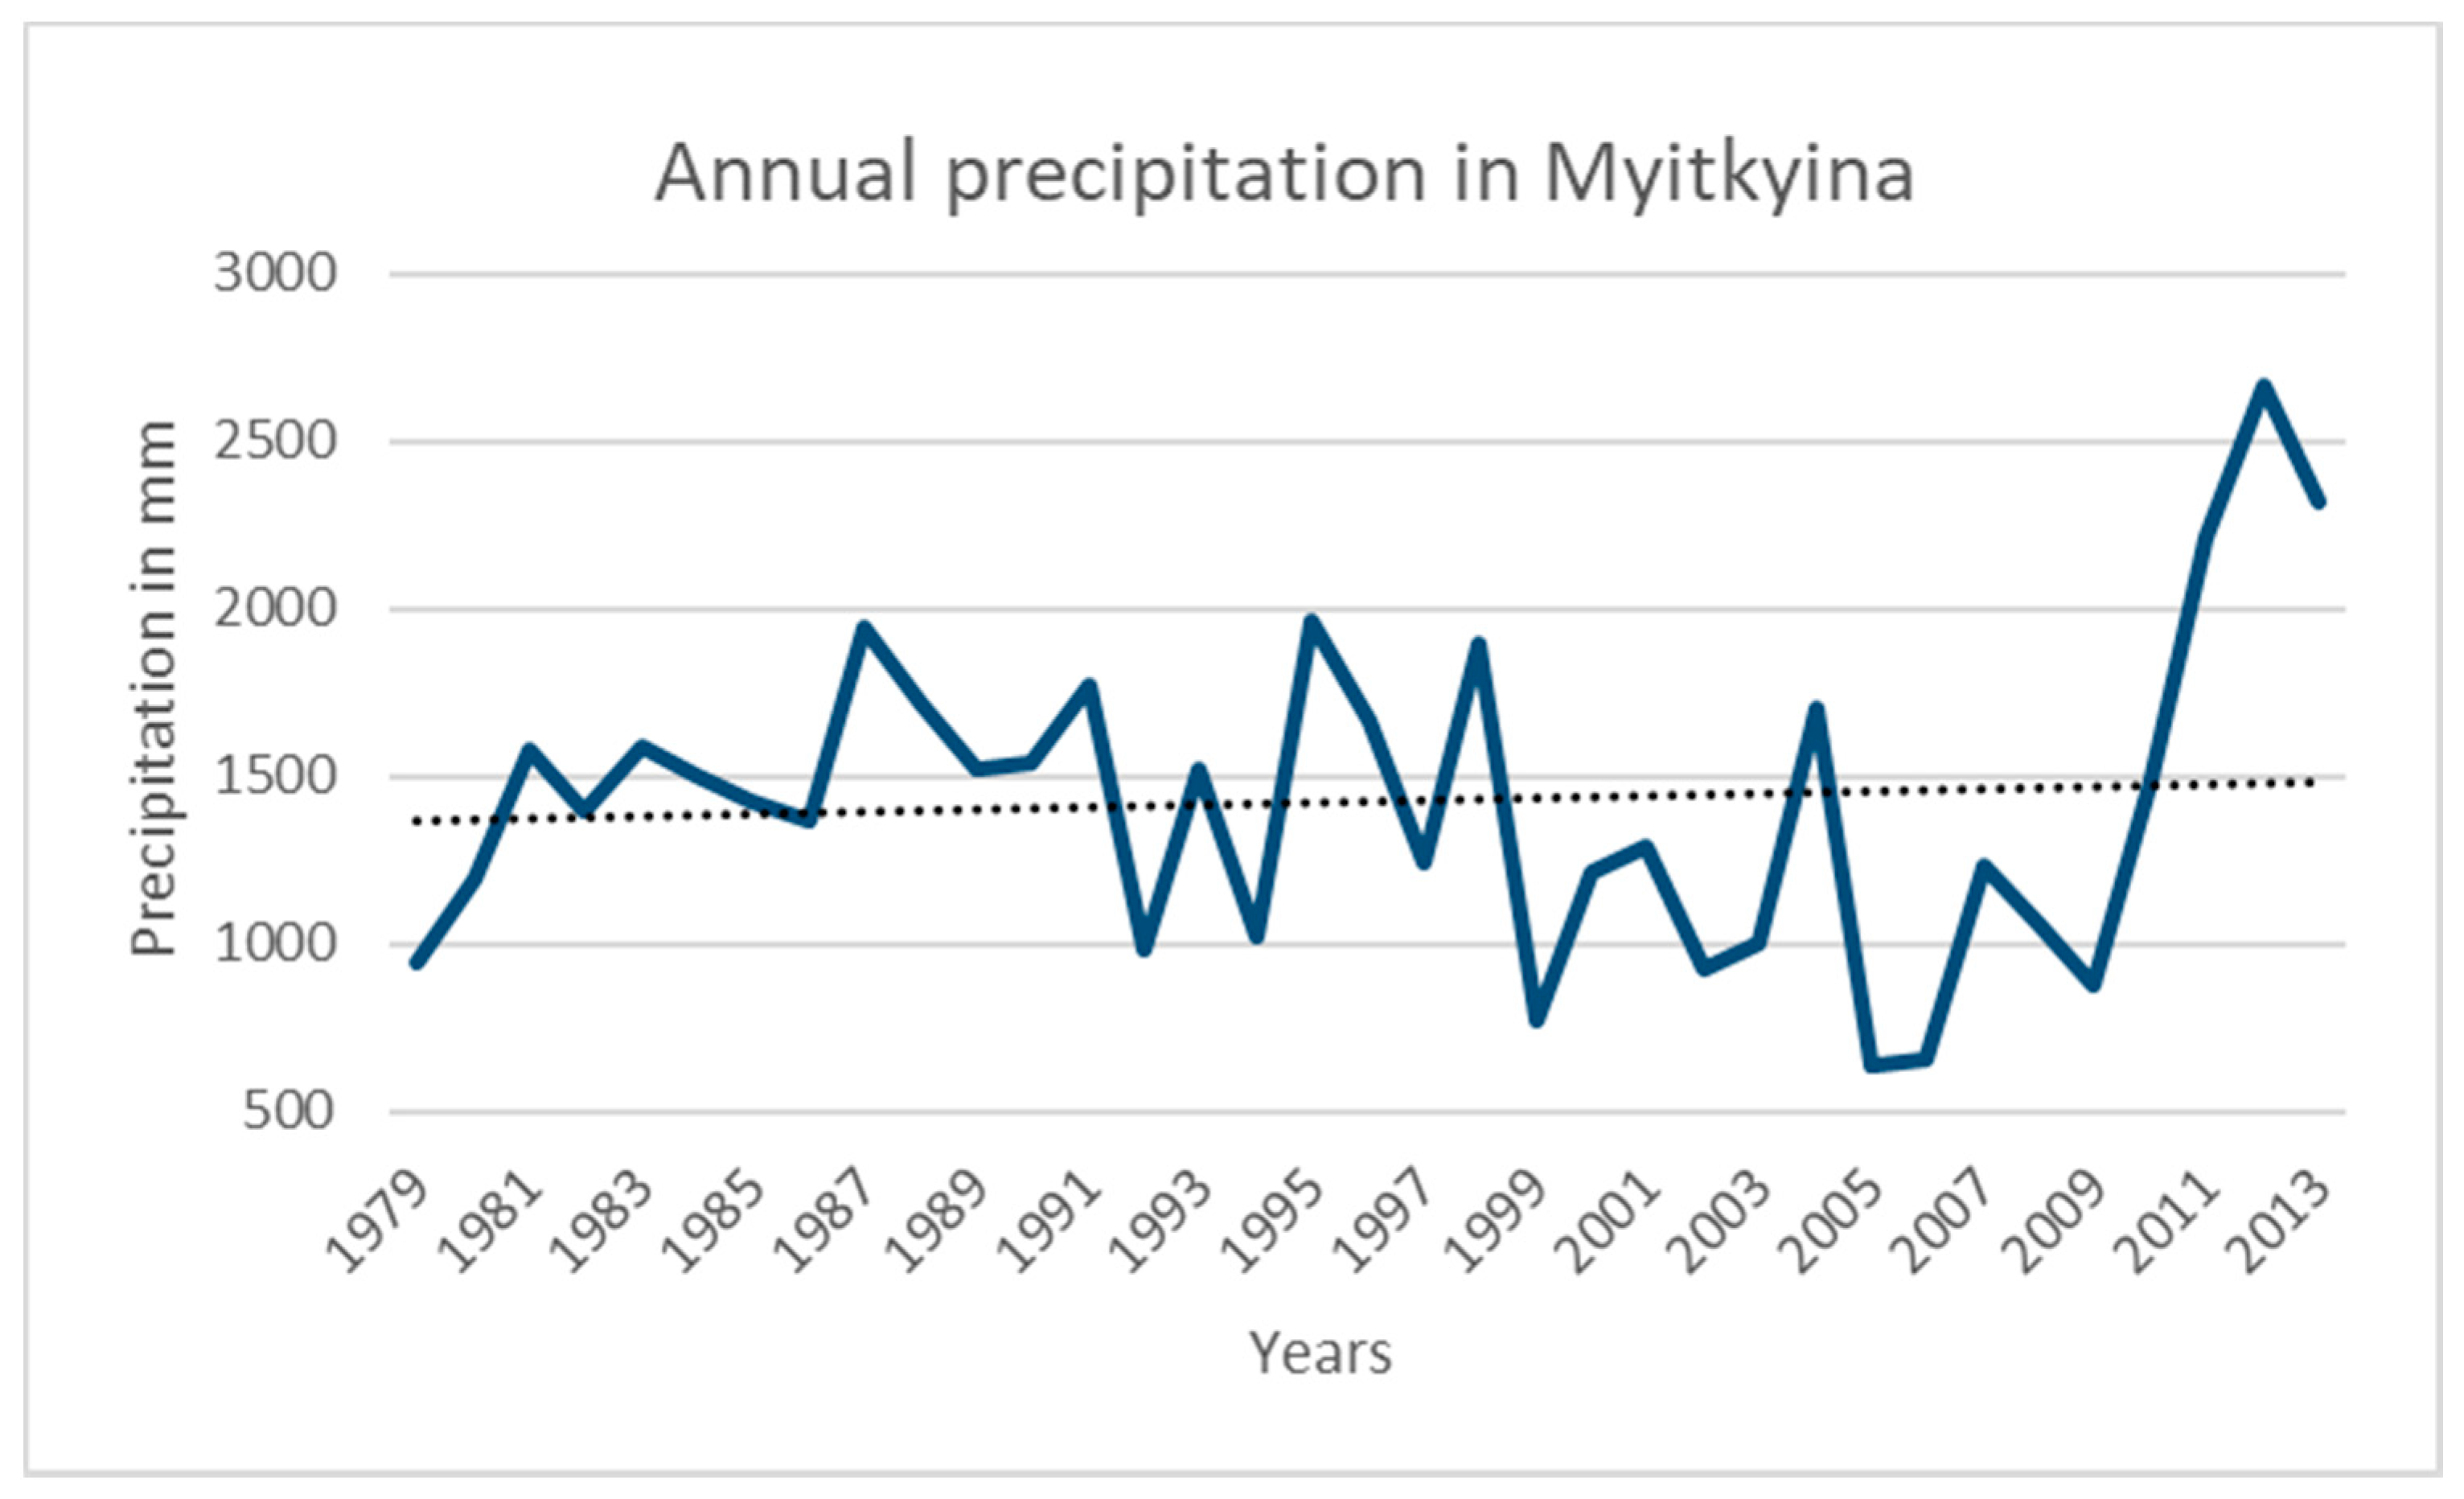
Glacier changes are considered to be one of the first signs of a changing climate, and glaciers in the study region exhibit a clear retreating trend. It is well known that the reaction of the glacier tongue is a delayed reaction to the climate signal, and it is possible that the glaciers right now are reacting to climatic changes that already happened in the past and that they continue to retreat even if current trends can be reversed [27]. Increased ablation due to higher temperature can immediately result in negative mass balance, and it is the persistently negative mass balance that leads to glacier retreat. Temperature in the HKH region has risen faster than the global average [28,29]. The Ayeyarwady catchment is strongly influenced by the Indian summer monsoon and precipitation patterns here change due to the global warming [30]. The regional glaciers belong to the summer accumulation type and gain mass from the summer monsoon snowfall [31]. This specific glacier type is especially sensitive to temperature change because increasing temperatures lead not only to the extension of the melting period but also to the increase in the share of rainfall and the reduction in the share of snow and, consequently, mass gain by the glaciers [31], enhancing glacier melt [29]. Figure 6 illustrates the past change of air temperature in the upper Ayeyarwady River basin at the Myitkyina station [31]. The glacier area changes in our study region and the global annual land–ocean temperature index for the latitudes equator to 24° N [32]. The local annual mean temperature follows the global trend of warming during the last decades, and it can be seen that the glaciers lost more than a half of their area. The warming was highest from the beginning of the 1980s when glacier retreating rates were comparatively low. The glacier lost has intensified around 2000, when the temperature showed a high variability, but no clear trend. The observed glacier changes in our study region could also be a response to a negative anomaly in monsoon precipitation (Figure 7). Pan et al. [33] studied changes in the glacier area of the monsoonal influenced Gongga Mountains, located on the southeastern margin of the Tibetan Plateau, about 400 km east of our study region. They found out that the glaciers shrank by 11.3% since 1966 and that they showed the highest loss rates during the period 2005–2009, which corresponds to our results. The majority of the glaciers of the Gongga Mountains are small (<1 km2), and Pan et al. [33] concluded that the observed retreat is mainly due to rising temperatures because the monsoon precipitation even shows a slight positive trend, similar to the observed rainfall amounts at the Myitkyina station located in the upper Ayeyarwady River Basin (Figure 7). Studies by Liu et al. [34] indicate that temperature changes are the main controlling factor of glacier changes of the Gongga Mountains.
The highest rates of warming occur between an altitude of 4800 and 6200 m a.s.l. in the study region [30]; therefore, glaciers within this range are experiencing higher recession rates, but the most vulnerable glaciers are the ones below an altitude of 5700 m a.s.l., as they react exceptionally fast to climatic changes [3]. As all glaciers in the Ayeyarwady headwaters are located below that altitude, they are especially prone to changes in area, volume, and length. Glacier changes in the study region can further be influenced by glacier size and aspect. It is very well documented that small glaciers are retreating faster than larger glaciers [3,35]. This behavior can also be observed in the study area; glaciers <1 km2 have retreated between 1976 and 2015 more than twice as much as glaciers >1 km2. The differences in glacier recession rates in the four sub-regions are probably also caused by different glacier sizes. Particularly, the overall smaller recession rates in Sub-Region 3 are probably caused by the different glacier sizes as the glaciers in Sub-Region 3 are larger compared to other sub-regions. This result can also be supported by findings from Sub-Regions 1 and 4. These sub-regions show the smallest total glacier area, but they are experiencing the highest losses in individual glacier area and volume/mass.
In the time period from 1971 to 2009, the glaciers all over the world lost around 226 Gt of their ice mass per year. The mass losses of the Ayeyarwady glaciers are a tiny fraction of global losses, but it shows that the volume and mass losses are in accordance with global trends. Furthermore, the examination of global glacier changes shows that the losses in all three considered glacier parameters have increased toward the end of the 20th and the beginning of the 21st century. The exact same behavior can be observed in the glaciers of the Ayeyarwady headwaters. One example for the regional variability of glacier changes is the HKH region. Glaciers in the northern and western parts of the HKH region behave differently compared to the southern and eastern glaciers. For example, the glaciers in the Himalaya mountain range lost 5–55% of their area over the past 30 years, which happened much faster than in the Hindu Kush and Karakoram at the western side of the HKH region [3]. Moreover, the area changes of the Ayeyarwady glaciers have lost more than the average glaciers in the Himalaya mountain range. In Southeast Asia, however, annual glacier area losses around 0.55% between 1975 and 2005 could be observed [2]. Over the period between 1970 and 2009, annual glacier area changes in Central Asia of approximately −0.8%a−1 could be detected [2]. With an annual relative glacier area change of −1.39 ± 0.03%a−1 for the glaciers in the Ayeyarwady headwaters, it seems that the area losses in the study area are exceeding the mean annual glacier changes in Southeast and Central Asia. This compares with annual glacier area loss rates in the Indian Himalayas (0.2–0.7% year−1 for 1960s—2004), the Garhwal Himalayas (0.12% year−1 for 1968–2007), and in Bhutan (0.3–0.6% year−1 for 1963–1993) [27,29]. The retreat rates for the Indian Himalayas and the rates of the Garhwal Himalayas, however, should be considered carefully, as they are located in the western part of the HKH region, which is less dominated by monsoonal precipitation and experiences advances at some glaciers. Glaciers that might show a similar climate are located at the southeastern Tibetan Plateau. Studied by Yao et al. [30], the glaciers in the Parlung valley show mean annual area losses of 0.57% year−1, which is higher than other retreat rates observed in India but still half of the annual area retreat rates calculated for the Ayeyarwady glaciers. Therefore, it can be concluded that the glacier area changes in our study region are occurring at a faster and more extreme rate compared to High Mountain Asia, which could be explained by the generally small glacier sizes of the Ayeyarwady glaciers and changes in temperature and precipitation. The comparison between the glacier losses in the Ayeyarwady headwaters with other regions should be considered carefully because the glaciers differ widely in size and volume. Nevertheless, the study provides information about the general dimension of glacier loss in our study region.
In the Himalayan region, the annual mass balance values typically range between −0.32 m year−1 (1992–2000) and −1.60 m year−1 (2001–2006) WE for individual glaciers [35]. Comparing these values with the glacier changes of the Ayeyarwady headwaters for the period of 1976–2015 (−0.87 ± 0.035 m WE), they fit into the regional trends. Admittedly, the glacier changes in the Ayeyarwady catchment for shorter time periods show a different behavior. For the three selected time periods, the annual changes are higher (up to >3 m WE, Table 6) than the typical range presented above. This indicates that some glaciers in the study region are losing volume/mass faster than the regional trends would imply. The glaciers in our study region are part of the GAMDAM (Glacier Area Mapping for Discharge in Asian Mountains) Inventory and Sakai and Fujita [36] found out that the mass losses in that Himalaya region are predominantly due to warming temperatures and/or decreasing summer precipitation and they stated that the mass balances of the glaciers are highly sensitive to temperature changes. The retreat rates of the glaciers in the upper Ayeyarwady region are highest in the period 2002–2015, when the regional temperature does not increase, but is sustained at a higher level than 1976–1995 (Figure 6). This glacier retreat is likely a response to both the regional temperature increase in the late 1990s and to low precipitation amounts in the beginning of the 21st century (Figure 7). Glaciers in the Indian Himalayas, for example, vary in their response times between 4 and 60 years depending on glacier size and mass [37]. Since smaller glaciers are more sensitive to climate change, the response time of the glaciers in the study region is assumed to be rather short.
It must be taken into account that studying glacier changes using remote sensing includes uncertainties depending on the application of different possible analyzing methods [38]. Area-related scaling approaches as applied here overestimate glacier volumes in some regions [39]. However, the aim of our study is to give first insights into glacier changes in the headwater region of the Ayeyarwady River during the last several decades rather than presenting absolute values. Therefore, our results show that the studied glaciers are retreating, independent from the method applied.
4.1. Possible Future Development
Losing more than half of their area and about 60% of their volume and mass leaves the glaciers in the Ayeyarwady headwaters in a critical condition in 2015, left with a total ice reserve of 1.02 ± 0.103 km3. As presented before, the Ayeyarwady glaciers, as well as glaciers all over the world, have been experiencing an increase in recession rates since the beginning of the 21st century. The overall increase in temperature and changes in precipitation are not about to stop or even turn back in the foreseeable future. For the Kachin state in Northern Myanmar, even an increase in mean temperature of up to 2.5 °C is projected until 2100. Therefore, it is possible that the glaciers disappear. On the contrary, Su and Shi [40] came to the conclusion that the maritime temperate glaciers in China, close to Northern Myanmar and the southeastern part of the Tibetan Plateau, will lose 75% of their total area by the year 2100. It can be assumed that the glaciers in the Ayeyarwady catchment are strongly threatened by the ongoing climate change and that they will disappear due to their generally small glacier area and volume; particularly, the sub-regions with a very small glacier area (1 and 4) will be more vulnerable toward future climate change.
4.2. Implications for Downstream Areas
The high retreat rates and the possible total disappearance of the glaciers will influence the glaciers’ storage function and likely the general hydrological system in the Ayeyarwady headwaters. This study did not analyze runoff or discharge data of the upper Ayeyarwady River because there are no data available at the moment for this region; therefore, it is difficult to actually determine the glaciers’ contribution of glacial meltwater to the river flow and what implications the glacier changes might have on downstream areas. Compared to other glaciated river catchments originating from the Tibetan Plateau, it becomes clear that glacier contribution to river flow can vary substantially. The Indus and Brahmaputra Rivers, for example, are highly dependent on glacier melt to sustain water supply for the large population in the downstream area [41]. However, in the Ganges, Yangtze and Yellow Rivers, glacial meltwater is less important and only contributes <10% to river discharge. The small contribution to discharge in these catchments is caused by large downstream areas, limited upstream precipitation, a small glacier area, or a downstream area dominated by a wet monsoon [41]. As the Ayeyarwady River is also dominated by the monsoon climate in the downstream area and has only a small glaciated area in its headwaters, it can be assumed that the glaciers’ contribution to discharge is even lower due to the existence of only small glaciers in the headwaters. Kaser et al. [42] investigated the potential relevance of glaciers in the headwater region of the Ayeyarwady River, and they found almost no impact of the glaciers on the Myanmar population. However, their findings refer to the entire population in Myanmar, and they did not distinguish between single regions. Therefore, further studies are necessary in order to assess the impact of glacier loss on the people living in the upper part of the river basin. A continuing loss of glacier ice in the headwater regions is expected to increase the glacial meltwater contribution to river discharge in the short term. For the Hailuogou glacier in the Gongga Mountains on the eastern margin of the Tibetan Plateau, it could be shown that there is a significant increasing trend in annual and summer meltwater runoff [34], which highlights the potential crucial contribution of meltwater to river discharge in the headwater region of the Ayeyarwady and the issue of water availability for the ~1.7 million people living in the most northern part of Myanmar. In the long term, as glaciers start to completely disappear, the water supply from glaciers will decline completely [27,30]. However, this will probably only have consequences for the Ayeyarwady tributaries in the headwater region and the local population in Myanmar’s Kachin State and a small part of the Tibet Autonomous Region of China. The past glacier changes and those happening in the future are probably more severe for the local people in the headwater region and may not even be noticed in the downstream areas of the Ayeyarwady catchment. However, to make assumptions on the implications for glacier hydrology and impacts on the river flow, further research needs to be conducted. Future studies should investigate the contribution of the glacial meltwater to river runoff in the upper Ayeyarwady River by stable isotope analyses or other tracer methods.
5. Conclusions
This study aimed to provide an overview over the situation of the glaciers in the Ayeyarwady headwaters and to investigate past glacier changes (1976–2015). The analysis showed that the glaciers lost a high amount of their area, volume, and length, and it is further noticed that the changes follow the global trend of recession and temperature increase. The Ayeyarwady glaciers lost between 54.3 ± 7.64% of their area, with annual area retreat rates of around −1.39 ± 0.03%. In terms of volume and mass, the glaciers lost approximately 60%. Along with climatic changes, the relatively small size of individual glaciers also contributes to glacier ice loss. The loss of glacier mass will have an influence on the glaciers’ storage function. To assess the influence of glacier losses on the river discharge in the (semi-)arid downstream areas in Myanmar, a comparison with river runoff and discharge data is necessary to make assumptions on future water availability. However, the access to hydrological data from that region is still very limited. Glacier changes in the Ayeyarwady headwaters should be further monitored in order to provide the data to decision-makers and direct measurements of glacier and climate changes in this part of the world are absolutely needed.
Author Contributions
L.T. conceptualized the work and had the initial idea. The method and formal analysis was applied by L.K. Figure 2, Figure 3, Figure 4 and Figure 5 were created by L.K., Figure 6 by L.T. L.K. prepared the original draft, which was supervised by L.T. The edited and submitted version was prepared by L.T.
Funding
This research received no external funding.
Acknowledgments
The authors are grateful to two anonymous reviewers who contributed with their helpful comments and feedback on former versions of the manuscript. Furthermore, the first author thanks Tun Tun Thein for providing helpful information on the climate in Myanmar and Stephan Opitz for his comments on the text. We thank Irene Johannsen for her help creating the Myanmar map.
Conflicts of Interest
The authors declare no conflict of interest.
References
- Barnett, T.P.; Adam, J.C.; Lettenmaier, D.P. Potential impacts of a warming climate on water availability in snow-dominated regions. Nature 2005, 438, 303–309. [Google Scholar] [CrossRef] [PubMed]
- IPCC. Climate Change 2013: The Physical Basis; Contribution of Working Group I to the Fifth Assessment Report of the Intergovernmental Panel on Climate Change; IPCC: Cambridge, UK; New York, NY, USA, 2013. [Google Scholar]
- Bajracharya, S.R.; Maharjan, S.B.; Shrestha, F.; Guo, W.; Liu, S.; Immerzeel, W.; Shrestha, B. The glaciers of the Hindu Kush Himalayas: Current status and observed changes from the 1980s to 2010. Int. J. Water Resour. Dev. 2015, 31, 161–173. [Google Scholar] [CrossRef]
- Karpilo, R.D. Glacier monitoring techniques. In Geological Monitoring; Young, R., Norby, L., Eds.; Geological Society of America: Boulder, CO, USA, 2009; pp. 141–162. [Google Scholar] [CrossRef]
- Sorg, A.; Bolch, T.; Stoffel, M.; Solomina, O.; Beniston, M. Climate change impacts on glaciers and runoff in Tien Shan (Central Asia). Nat. Clim. Chang. 2012, 2, 725–731. [Google Scholar] [CrossRef]
- Thayyen, R.J.; Gergan, J.T. Role of glaciers in watershed hydrology: A preliminary study of a “Himalayan catchment”. Cryosphere 2010, 4, 115–128. [Google Scholar] [CrossRef]
- Lutz, A.F.; Immerzeel, W.W.; Shrestha, A.B.; Bierkens, M.F.P. Consistent increase in High Asia’s runoff due to increasing glacier melt and precipitation. Nat. Clim. Chang. 2014, 4, 587–592. [Google Scholar] [CrossRef]
- Department of Population, Ministry of Immigration and Population. The 2014 Myanmar Population and Housing Census, Kachin State, Census Report Volume 3-A. 2015. Available online: https://myanmar.unfpa.org/en/publications/union-report-volume-3a-kachin-state-report (accessed on 27 November 2018).
- Taft, L.; Evers, M. A review of current and possible future human–water dynamics in Myanmar’s river basins. Hydrol. Earth Syst. Sci. 2016, 20, 4913–4928. [Google Scholar] [CrossRef]
- Furuichi, T.; Win, Z.; Wasson, R.J. Discharge and suspended sediment transport in the Ayeyarwady River, Myanmar: Centennial and decadal changes. Hydrol. Process. 2009, 23, 1631–1641. [Google Scholar] [CrossRef]
- Bajracharya, S.R.; Shrestha, B. (Eds.) The Status of Glaciers in the Hindu Kush-Himalayan Region; ICIMOD: Kathmandu, Nepal, 2011; Available online: https://www.cabdirect.org/cabdirect/FullTextPDF/2012/20123056405.pdf (accessed on 17 January 2018).
- U.S. Geological Survey USGS. EarthExplorer. 2017. Available online: https://earthexplorer.usgs.gov/ (accessed on 26 January 2017).
- Mukul, M.; Srivastava, V.; Jade, S.; Mukul, M. Uncertainties in the Shuttle Radar Topography Mission (SRTM) Heights: Insights from the Indian Himalaya and Peninsula. Nat. Sci. Rep. 2017, 7, 41672. [Google Scholar] [CrossRef] [Green Version]
- Berthier, E.; Arnaud, Y.; Vincent, C.; Rémy, F. Biases of SRTM in high-mountain areas: Implications for the monitoring of glacier volume changes. Geophys. Res. Lett. 2006, 33, L08502. [Google Scholar] [CrossRef]
- Paul, F.; Kääb, A.; Maisch, M.; Kellenberger, T.; Haeberli, W. The new remote-sensing-derived Swiss glacier inventory: I. Methods. Ann. Glaciol. 2002, 34, 355–361. [Google Scholar] [CrossRef] [Green Version]
- Bolch, T. Climate change and glacier retreat in northern Tien Shan (Kazakhstan/Kyrgyzstan) using remote sensing data. Glob. Planet. Chang. 2007, 56, 1–12. [Google Scholar] [CrossRef]
- Grinsted, A. An estimate of global glacier volume. Cryosphere 2013, 7, 141–151. [Google Scholar] [CrossRef]
- Bahr, D.B.; Meier, M.F.; Peckham, S.D. The physical basis of glacier volume-area scaling. J. Geophys. Res. 1997, 102, 20355–20362. [Google Scholar] [CrossRef] [Green Version]
- Bahr, D.B.; Pfeffer, W.T.; Kaser, G. A review of volume-area scaling of glaciers: Volume-area scaling. Rev. Geophys. 2015, 53, 95–140. [Google Scholar] [CrossRef] [PubMed]
- Laumann, T.; Nesje, A. Volume-area scaling parameterization of Norwegian ice caps: A comparison of different approaches. Holocene 2016, 27, 164–171. [Google Scholar] [CrossRef]
- Racoviteanu, A.E.; Williams, M.W.; Barry, R.G. Optical remote sensing of glacier characteristics: A review with focus on the Himalaya. Sensors 2008, 8, 3355–3383. [Google Scholar] [CrossRef] [PubMed]
- Raup, B.H.; Andreassen, L.M.; Bolch, T.; Bevan, S. Remote sensing of glaciers. In Remote Sensing of the Cryosphere; Tedesco, M., Ed.; John Wiley & Sons, Ltd.: Chichester, UK, 2015. [Google Scholar]
- Dyck, S.; Peschke, G. Grundlagen der Hydrologie; Verlag für Bauwesen: Berlin, Germany, 1995. [Google Scholar]
- NRCS Natural Conservation Service Oregon. What Is Snow Water Equivalent. Available online: http://nrcs.usda.gov/wps/portal/nrcs/detail/or/snow/?cid=nrcs142p2046155 (accessed on 9 January 2017).
- Bookhagen, B.; Burbank, D.W. Toward a complete Himalayan hydrological budget: Spatiotemporal distribution of snowmelt and rainfall and their impact on river discharge. J. Geophys. Res. 2010, 115, FO3019. [Google Scholar] [CrossRef]
- Panday, P.K.; Williams, C.A.; Frey, K.E.; Brown, M.E. Application and evaluation of snowmelt runoff model in the Tamor River basin, Eastern Himalaya using a Markov Chain Monte Carlo (MCMC) data assimilation approach. Hydrol. Process. 2013, 28. [Google Scholar] [CrossRef]
- Ren, J.; Jing, Z.; Pu, J.; Qin, X. Glacier variations and climate change in the central Himalaya over the past few decades. Ann. Glaciol. 2006, 43, 218–222. [Google Scholar] [CrossRef]
- Jianchu, X.; Shrestha, A.; Eriksson, M. Climate change and its impacts on glaciers and water resource management in the Himalayan Region. In Assessment of Snow, Glaciers and Water Resources in Asia; International Hydrological Programme of UNESCO and Hydrology and Water Resources Programme of WMO: Koblenz, Germany, 2009; pp. 44–54. [Google Scholar]
- UNEP United Nations Environmental Program. The Glaciers of the Hindu-Kush Himalayan Region.: A Summary of the Science Regarding Glacier Melt/Retreat in the Himalayan, Hindu Kush, Karakoram, Pamir, and Tien Shan Mountain Ranges; Technical Paper; UNEP: Kathmandu, Nepal, 2010. [Google Scholar]
- Yao, T.; Thompson, L.; Yang, W.; Yu, W.; Gao, Y.; Guo, X.; Yang, X.; Duan, K.; Zhao, H.; Xu, B.; et al. Different glacier status with atmospheric circulations in Tibetan Plateau and surroundings. Nat. Clim. Chang. 2012, 2, 663–667. [Google Scholar] [CrossRef]
- NCEP National Centers for Environmental Prediction. Global Weather Data for SWAT. 2018. Available online: https://globalweather.tamu.edu/#pubs Access on (accessed on 16 August 2018).
- NASA. Annual mean Land-Ocean Temperature Index in Degrees Celsius. 2018. Available online: https://data.giss.nasa.gov/gistemp/graphs/graph_data/Hemispheric_Temperature_Change/graph.txt (accessed on 16 August 2018).
- Pan, B.T.; Zhang, G.L.; Wang, J.; Cao, B.; Geng, H.P.; Wang, J.; Zhang, C.; Ji, Y.P. Glacier changes from 1966-2009 in the Gongga Mountains, on the south-eastern margin of the Qinghai-Tibetan Plateau and their climatic forcing. Cryosphere 2012, 6, 1087–1101. [Google Scholar] [CrossRef]
- Liu, Q.; Liu, S.Y.; Zhang, Y.; Wang, X.; Zhang, Y.S.; Guo, W.Q.; Xu, J.L. Recent shrinkage and hydrological response of Hailuogou glacier, a monsoon temperate glacier on the eastern slope of Mount Gongga, China. J. Glaciol. 2010, 56, 215–224. [Google Scholar] [CrossRef]
- Bolch, T.; Kulkarni, A.; Kääb, A.; Huggel, C.; Paul, F.; Cogley, J.G.; Frey, H.; Kargel, J.S.; Fujita, K.; Scheel, M.; et al. The state and fate of Himalayan glaciers. Science 2012, 336, 310–314. [Google Scholar] [CrossRef] [PubMed]
- Nuimura, T.; Sakai, A.; Taniguchi, K.; Nagai, H.; Lamsal, D.; Tsutaki, S.; Kozawa, A.; Hoshina, Y.; Takenaka, S.; Omiya, S.; et al. The GAMDAM glacier inventory: a quality controlled inventory of Asian glaciers. Cryosphere 2015, 9, 849–864. [Google Scholar] [CrossRef]
- Kulkarni, A.V.; Bahuguna, I.M.; Rathore, B.P.; Singh, S.K.; Randhawa, S.S.; Sood, R.K.; Dhar, S. Glacial retreat in Himalaya using Indian Remote Sensing satellite data. Curr. Sci. 2007, 92, 69–74. [Google Scholar]
- Kaldybayev, A.; Chen, Y.; Issanova, G.; Wang, H.; Mahmudova, L. Runoff response to the glacier shrinkage in the Karatal river basin, Kazakhstan. Arab. J. Geosci. 2016, 9, 208. [Google Scholar] [CrossRef]
- Bhambri, R.; Bolch, T.; Chaujar, R.K.; Kulshreshtha, S.C. Glacier changes in the Garhwal Himalaya, India, from 1968 to 2006 based on remote sensing. J. Glaciol. 2011, 57, 543–556. [Google Scholar] [CrossRef] [Green Version]
- Su, Z.; Shi, Y. Response of monsoonal temperate glaciers to global warming since the Little Ice Age. Q. Int. 2002, 97, 123–131. [Google Scholar] [CrossRef]
- Frey, H.; Machguth, H.; Huss, M.; Huggel, C.; Bajrachyrya, S.; Bolch, T.; Kulkarni, A.; Linsbauer, A.; Salzmann, N.; Stoffel, M. Estimating the volume of glaciers in the Himalayan-Karakoram region using different methods. Cryosphere 2014, 8, 2313–2333. [Google Scholar] [CrossRef]
- Kaser, G.; Großhauser, M.; Marzeion, B. Contribution potential of glaciers to water availability in different climate regimes. Proc. Natl. Acad. Sci. USA 2010, 107, 20223–20227. [Google Scholar] [CrossRef]
Figure 1.
Overview map Myanmar with major rivers and indication of study region (red rectangle).

Figure 2.
Headwaters region of the Ayeyarwady River with all identified glaciers in 2015 including the location of the 10 largest glaciers, and sub-regions mentioned in the text.
Figure 2.
Headwaters region of the Ayeyarwady River with all identified glaciers in 2015 including the location of the 10 largest glaciers, and sub-regions mentioned in the text.

Figure 3.
Total glacier area changes in km2 for the four time steps 1976, 1990, 2002, and 2015 with standard deviation.
Figure 3.
Total glacier area changes in km2 for the four time steps 1976, 1990, 2002, and 2015 with standard deviation.

Figure 4.
Relative glacier area changes between 1976 and 2015 plotted against the individual glacier area in 1976.
Figure 4.
Relative glacier area changes between 1976 and 2015 plotted against the individual glacier area in 1976.

Figure 5.
Absolute average volume changes of the detected glaciers in Sub-Regions 1–4 between 1976 and 2015.
Figure 5.
Absolute average volume changes of the detected glaciers in Sub-Regions 1–4 between 1976 and 2015.

Figure 6.
Glacier and air temperature changes between 1976 and 2015 in the study region (dashed black and solid red line) compared with the annual mean land–ocean temperature index (dashed red line) for the northern hemisphere (equator—24° N). The base period is 1951–1980 [31,32].

Figure 7.
Annual precipitation at the Myitkyina meteorological station, located in the upper Ayeyarwady basin (see Figure 1), with a linear trend.
Figure 7.
Annual precipitation at the Myitkyina meteorological station, located in the upper Ayeyarwady basin (see Figure 1), with a linear trend.


Table 1.
Overview of selected Landsat images. Images with cloud cover >10% were suitable for this study because the clouds did not cover the studied glacier areas. The second Landsat image from 06.11.1976 was only used for correction purposes and was not included in the final analysis. Source of all Landsat images is USGS [12].
| Year | Satellite | ID | Recording Date | Cloud Cover (%) | Purpose |
|---|---|---|---|---|---|
| 1976 | LS MSS | LM2143040_1976293XXX01 | 19.10.1976 | 6 | Analysis |
| 1976 | LS MSS | LM2143040_1976311TGS02 | 06.11.1976 | 5 | Correction |
| 1976 | LS MSS | LM2143041_1976293XXX01 | 19.10.1976 | 12 | Analysis |
| 1990 | L5 TM | LT5133040_1990331BJC00 | 27.11.1990 | 23 | Analysis |
| 1990 | L5 TM | LT5133041_1990331BJC00 | 27.11.1990 | 5 | Analysis |
| 2002 | L7 ETM+ | LE7133040_2002004BKT00 | 04.01.2002 | 24 | Analysis |
| 2002 | L7 ETM+ | LE7133041_2002004BKT00 | 04.01.2002 | 9 | Analysis |
| 2015 | L8 OLI/TIRS | LC8133040_2015272LGN00 | 29.09.2015 | 4 | Analysis |
| 2015 | L8 OLI/TIRS | LC8133041_2015272LGN00 | 29.09.2015 | 17 | Analysis |
Table 2.
Overview of applied thresholds for the TM3/TM5 band ratio images to identify the glacier areas.
Table 2.
Overview of applied thresholds for the TM3/TM5 band ratio images to identify the glacier areas.
| Year | Satellite + Path/Row | TM3/TM5 Threshold |
|---|---|---|
| 1976 | MSS 133/40 | - |
| 1976 | MSS 133/41 | - |
| 1990 | TM 133/40 | 3 |
| 1990 | TM 133/41 | 3.2 |
| 2002 | ETM+ 133/40 | 3.4 |
| 2002 | ETM+ 133/41 | 3.2 |
| 2015 | OLI/TIRS 133/40 | 1.3 |
| 2015 | OLI/TIRS 133/41 | 1.1 |
Table 3.
Overview of the total number of glaciers in the sub-regions, and the total and mean glacier area in 2015.
Table 3.
Overview of the total number of glaciers in the sub-regions, and the total and mean glacier area in 2015.
| Sub-Region | No. of Glaciers | Area in km2 | Mean Area in km2 |
|---|---|---|---|
| 1 | 20 | 4.75 ± 0.35 | 0.24 ± 0.00 |
| 2 | 43 | 7.99 ± 0.54 | 0.18 ± 0.00 |
| 3 | 44 | 19.08 ± 1.54 | 0.42 ± 0.00 |
| 4 | 22 | 1.19 ± 0.1 | 0.06 ± 0.00 |
Table 4.
Glacier volume and mass in the sub-regions.
| Sub-Region | Volume in km3 | Mass in Gt |
|---|---|---|
| 1 | 0.12 ± 0.00 | 0.11 ± 0.00 |
| 2 | 0.20 ± 0.00 | 0.18 ± 0.00 |
| 3 | 0.68 ± 0.10 | 0.61 ± 0.1 |
| 4 | 0.02 ± 0.00 | 0.015 ± 0.00 |
Table 5.
Total glacier areas and changes and for the four sub-regions in the years 1976, 1990, 2002, and 2015 including standard deviation.
Table 5.
Total glacier areas and changes and for the four sub-regions in the years 1976, 1990, 2002, and 2015 including standard deviation.
| Total in km2 | Total Glacier Area | Sub-Region 1 | Sub-Region 2 | Sub-Region 3 | Sub-Region 4 |
|---|---|---|---|---|---|
| 1976 | 72.21 ± 7.50 | 12.81 ± 1.29 | 23.71 ± 2.87 | 31.05 ± 3.00 | 4.64 ± 0.33 |
| 1990 | 59.53 ± 4.66 | 10.66 ± 0.87 | 16.82 ± 1.20 | 27.94 ± 2.34 | 4.12 ± 0.25 |
| 2002 | 53.85 ± 4.18 | 8.63 ± 0.77 | 15.24 ± 1.12 | 26.90 ± 2.09 | 3.07 ± 0.19 |
| 2015 | 33.00 ± 2.55 | 4.75 ± 0.39 | 7.99 ± 0.55 | 19.08 ± 1.54 | 1.19 ± 0.10 |
| Changes in km2 | |||||
| 1976–1990 | −12.68 ± 2.83 | −2.15 ± 0.42 | −6.90 ± 1.67 | −3.11 ± 0.66 | −0.52 ± 0.10 |
| 1990–2002 | −5.69 ± 0.49 | −2.02 ± 0.10 | −1.57 ± 0.10 | −1.04 ± 0.25 | −1.05 ± 0.10 |
| 2002–2015 | −20.85 ± 1.62 | −3.89 ± 0.38 | −7.25 ± 0.57 | −7.83 ± 0.55 | −1.88 ± 0.12 |
| 1976–2015 | −39.21 ± 4.94 | −8.06 ± 0.90 | −15.72 ± 2.32 | −11.97 ± 1.46 | −3.46 ± 0.26 |
| Changes in % | |||||
| 1976–1990 | −17.56 ± 4.37 | −16.81 ± 1.57 | −29.08 ± 3.58 | −10.01 ± 1.17 | −11.28 ± 0.89 |
| 1990–2002 | −9.55 ± 0.89 | −18.99 ± 0.63 | −9.35 ± 0.19 | −3.71 ± 0.60 | −25.55 ± 0.13 |
| 2002–2015 | −38.71 ± 0.99 | −45.02 ± 0.37 | −47.57 ± 0.27 | −29.09 ± 0.23 | −61.31 ± 0.12 |
| 1976–2015 | −54.30 ± 3.73 | −62.95 ± 0.66 | −66.30 ± 1.81 | −38.56 ± 0.98 | −74.44 ± 0.29 |
Table 6.
Mean annual absolute losses in water equivalent (WE) for the sub-regions.
| Water Equivalent/a (m) | Sub-Region 1 | Sub-Region 2 | Sub-Region 3 | Sub-Region 4 |
|---|---|---|---|---|
| 1976–1990 | 2.58 | 2.74 | 2.81 | 1.71 |
| 1990–2002 | 2.94 | 2.16 | 0.57 | 1.89 |
| 2002–2015 | 2.44 | 2.32 | 3.30 | 1.37 |
| 1976–2015 | 0.86 | 0.84 | 1.01 | 0.52 |
© 2018 by the authors. Licensee MDPI, Basel, Switzerland. This article is an open access article distributed under the terms and conditions of the Creative Commons Attribution (CC BY) license (http://creativecommons.org/licenses/by/4.0/).
Share and Cite
MDPI and ACS Style
Taft, L.; Kühle, L. Glacier Changes between 1976 and 2015 in the Source Area of the Ayeyarwady (Irrawaddy) River, Myanmar. Water 2018, 10, 1850. https://doi.org/10.3390/w10121850
AMA Style
Taft L, Kühle L. Glacier Changes between 1976 and 2015 in the Source Area of the Ayeyarwady (Irrawaddy) River, Myanmar. Water. 2018; 10(12):1850. https://doi.org/10.3390/w10121850
Chicago/Turabian StyleTaft, Linda, and Laila Kühle. 2018. "Glacier Changes between 1976 and 2015 in the Source Area of the Ayeyarwady (Irrawaddy) River, Myanmar" Water 10, no. 12: 1850. https://doi.org/10.3390/w10121850
Note that from the first issue of 2016, this journal uses article numbers instead of page numbers. See further details here.