Variations of Fluvial Sediment Transport after Large Earthquakes: Field Study in Taiwan Catchments


Department of Earth Sciences, National Cheng Kung University, No. 1, University Road, Tainan City 701, Taiwan
Water 2018, 10(12), 1836; https://doi.org/10.3390/w10121836
Submission received: 19 November 2018
/
Revised: 2 December 2018
/
Accepted: 10 December 2018
/
Published: 12 December 2018
(This article belongs to the Section Hydrology)
Abstract
:By estimating long-term suspended sediment discharges around river catchments, recovery periods of fluvial sediment transport after a large earthquake can be assessed. This study proved that the recovery period in a given catchment is positively correlated with the peak ground motions triggered by an earthquake. The correlation indicates that a recovery period of more than four years is required if a catchment is affected by an earthquake with a ground acceleration greater than 400 gal (~0.4 g). A total of four factors (sediment transport, seismic frequency, rock strength, and joint density) in the multivariate analysis were carefully considered to assess their influence on the sediment yield. As expected, runoff and geomaterial properties were the most important factors affecting the amount of suspended sediment discharges. The analysis of the influence factors further revealed that earthquake frequency is another important factor for sediment yield, especially within a few years after a large earthquake.
1. Introduction
Frequent seismic activity in areas with active plate tectonics, such as the islands located around the Pacific Ocean (including the islands of western USA, Japan, Taiwan, and Philippines), lead to significant topographic relief. Intense earthquakes will not only cause sudden great damage in the region, but also trigger a consequent effect of mass wasting. Taiwan is located at the convergent boundary of the Eurasian Plate and Philippine Sea Plate, with crustal shortening of approximately 90 mm/year [1], and more than twenty earthquakes with magnitudes of 5.0 occur per year [2]. The specific geologic setting of Taiwan provides the opportunity to understand the duration of an earthquake’s influence on mass wasting. The amount of sediment transport in rivers is commonly used to represent mass wasting. The amount of material transported in the rivers around Taiwan has been reported in many studies. Li [3] reports that the average physical denudation rate in Taiwan is 1300 mg/cm2/year and the average chemical denudation rate is 65 mg/cm2/year. The results of Li [3] show that the average denudation rate in Taiwan is at least 1365 mg/cm2/year, corresponding to an erosion rate of 4 mm/year, which is one of the highest in the world. Hwang [4] found that the amount of sediment transported from the 49 catchments in Taiwan is related to the geological settings surrounding the catchments. Dadson et al. [5] estimated the suspended sediment discharge and inferred that 384 Mt/year of suspended sediments, which is equivalent to an erosion rate of 3–6 mm/year, is transported into the ocean from Taiwan. Dadson et al. [6] compared the variability of sediment discharges before and after the 1999 Chi-Chi earthquake and found that the central region of Taiwan was located near the epicenter, so the average sediment discharge after the earthquake increased by 4.4 times. Additionally, Lin et al. [7] and Chuang et al. [8] found that the amount of suspended sediment discharges from two major rivers in the central region of Taiwan increased more than four-fold after the 1999 earthquake.
Rapid surface erosion (e.g., landslide) is the main reason for the increase of sediment load after a large earthquake. Keefer [9] collected 40 coseismic landslides and points out that the minimum magnitude of earthquakes that triggered landslides was 5.0. Furthermore, there is a positive correlation between the magnitude of an earthquake and the induced landslide area, and earthquake-induced landslides often occur on slopes with poor-cemented material or dense discontinuities. In addition, Khazai and Sitar [10] found that more than 81% of the landslides were distributed in areas with a horizontal acceleration greater than 0.15 g.
Koi et al. [11] found that the impact of the 1923 Mw-7.9 Kanto earthquake on sediment yield in the catchments close to the epicenter could last for more than 80 years. However, Hovius et al. [12] report that the 1999 Mw-7.3 Chi-Chi earthquake had an impact period of approximately 6 years on the amount of sediment transport to the Choshui River in central Taiwan. However, the discussion on the variations of sediment discharges under different vibration levels is very limited. In this study, the focus is on the period required to restore the amount of suspended sediment transport to pre-earthquake levels in several river basins affected by earthquakes with different scales of vibration. By integrating the four factors of sediment transport, seismic frequency, rock strength, and joint density, multivariate analysis was used to assess the influence of earthquakes on sediment yield.
2. Study Methods
2.1. Calculation of Suspended Sediment Discharges
The sediment concentration data used in this study are mainly from the Taiwan Water Resources Agency (WRA). The WRA staff collected river water samples two to three times a month near river hydrometric stations using a DH-48 full-depth sampler and measured the sediment concentration [13]. As in most rivers, the suspended sediment concentration Cs (ppm) is related to water discharge Q (m3/s) through a power law, Cs = κQb, where the exponent b is determined by the availability and mobilization of sediment and κ is the suspended sediment concentration at the unit water discharge [12]. The rating-curve method based on the Cs–Q power law relation is one of the most common estimation methods for suspended sediment discharge [14,15], especially in the case of insufficient hydrometric data. Kao et al. [15] collected water samples from rivers in eastern Taiwan and found that the Cs–Q power law relation still exists even under very low water discharge (<10 m3/s). This indicates that even at low water discharge, there is still suspended sediment transport in the river and that the transport characteristics of Taiwan’s rivers have transport-dominated conditions. In general, the rating-curve method is suitable for the calculation of suspended sediment in a river in a transport-dominated environment [16]. However, the shortcomings of a simple rating-cure method lie in the fact that the calculated suspended sediment discharge are expected values and there will be residual differences between the calculated and observed values. A modified rating-curve method is developed to reduce the residual difference.
where TSS means annual suspended sediment discharge (SSD) (t), n means the amount of observed sediment concentration data, means the calculated daily SSD (t/day), ζ means the error correction parameter, and means the observed daily water discharge (m3/s) of the ith day. is the residual difference between the observed SSD at the ith day and estimated SSD at the ith day. By fitting the power laws to the data for selected time slices, while keeping the exponent, b, fixed at the pre-earthquake best-fit value to permit the direct comparison of sediment transport, the variation of the unit sediment concentration κ has been tracked to reveal the impact of the earthquake.
In addition, the SSD during a heavy rainfall event is the main source of annual sediment supply. During typhoon periods, the amount of suspended sediment discharge is the cumulative value of during a given typhoon. The Cs–Q rating curve for a selected event can be established if the measured water discharge and sediment concentration data are available during the typhoon period or within a few days of the rainstorm. A unique κstorm for each typhoon is then determined. Sediment settled on the channel would be re-disturbed during subsequent rainstorm events [17]. The study attempts to examine the impact of earthquakes on sediment supply; therefore, it is assumed that the effects of re-disturbed sediment occurred constantly, and the variation of sediment discharge was mainly induced by periodical events (e.g., heavy typhoons and earthquakes). Although it is hard to examine that part of re-disturbed sediment, the effect of not doing so may mean that the impact of an extreme event (earthquake or heavy rainstorm) on sediment supply may not be examined in short-term observation. By enlarging the observation period, the impact of a single earthquake event on sediment supply can still be observed from sediment data. Further, unit suspended concentration is obtained from regression of one-year data, and it implies the suspended concentration under unit water discharge. The effect of water discharge during different rainfall events (e.g., typhoons) can be reduced.
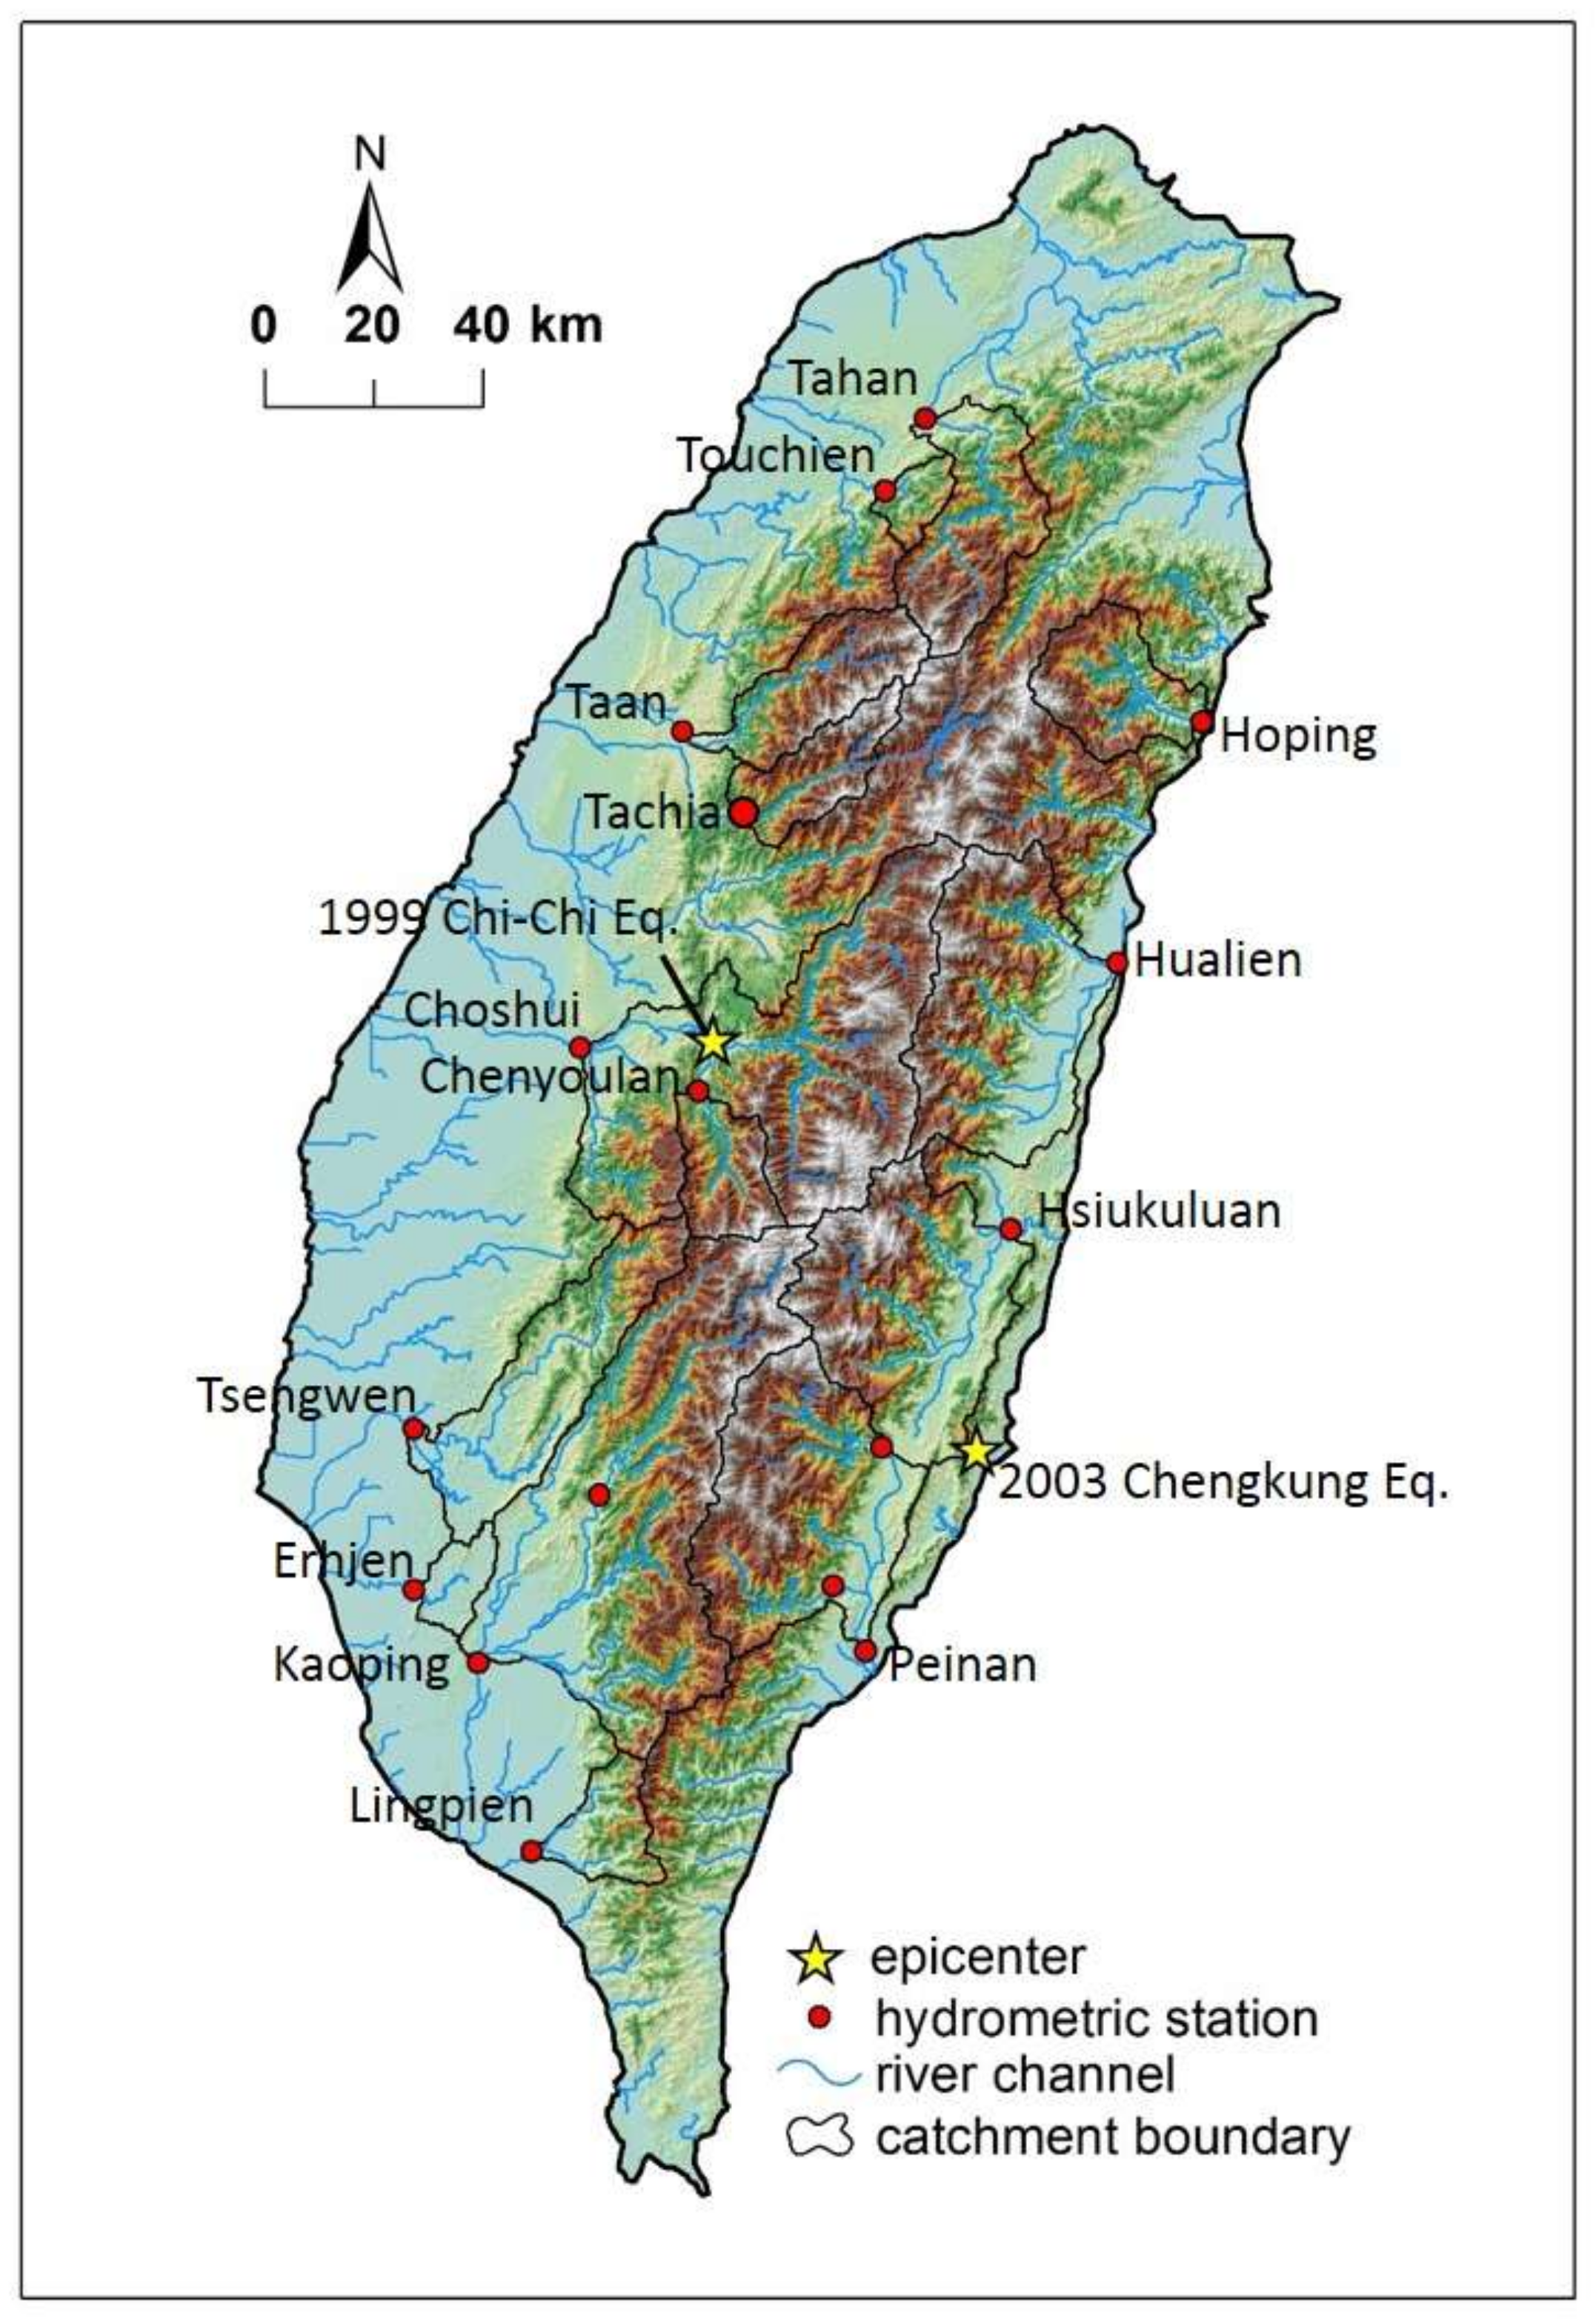
In this study, the observed hydrometric data were selected from 12 major rivers (17 hydrometric stations) around Taiwan (Figure 1). Due to the selected hydrometric stations in the study being mainly located at downstream channels, the fluvial materials had experienced long-distance abrasion. The largest portion of suspended sediment were materials with grain size smaller than 1/16 mm (slit and clay). Only a small portion of suspended sediment was sand particles with grain sizes ranging from 1/16 to 2 mm. The materials with grain sizes larger than 2 mm were quite rare in suspended materials. Finer particles would be easily driven by water flow. Therefore, it can expected that a close relationship will exist between suspended materials and water discharge. The modified rating-curve method was used to estimate the amount of suspended sediment discharge transported during the whole year and during typhoons.
2.2. Measurements of Rock Strength and Joint Density
The strength and fragmentation of geological materials are often important factors that determine the potentiality of mass movements on slopes and affect sediment yields. In this study, an NR-type Schmidt hammer was used to perform rock strength tests in an outcrop survey, and the conversion diagram suggested by International Society for Rock Mechanics (ISRM) [18] was referred to in order to obtain the relative compressive strength values of rocks. According to the suggestions of ISRM [18], each test site was subjected to at least 10 impact tests at a distance of no less than 20 mm between each impact point. To reduce test instrument errors, the upper and lower abnormal values of impact tests had to be removed.
To characterize the fragmentation of the main strata in each river catchment, the joint density, JV, was measured in the field. Based on the suggestions of ISRM [18], the joint density was calculated as follows:
where Ln is the investigated length of the nth set of joints along the direction perpendicular to the joint plane and Nn is the joint number of the nth set of joints in the investigated length Ln.
3. Earthquake Effects on Sediment Yields
3.1. Changes in Observation Sediment Data
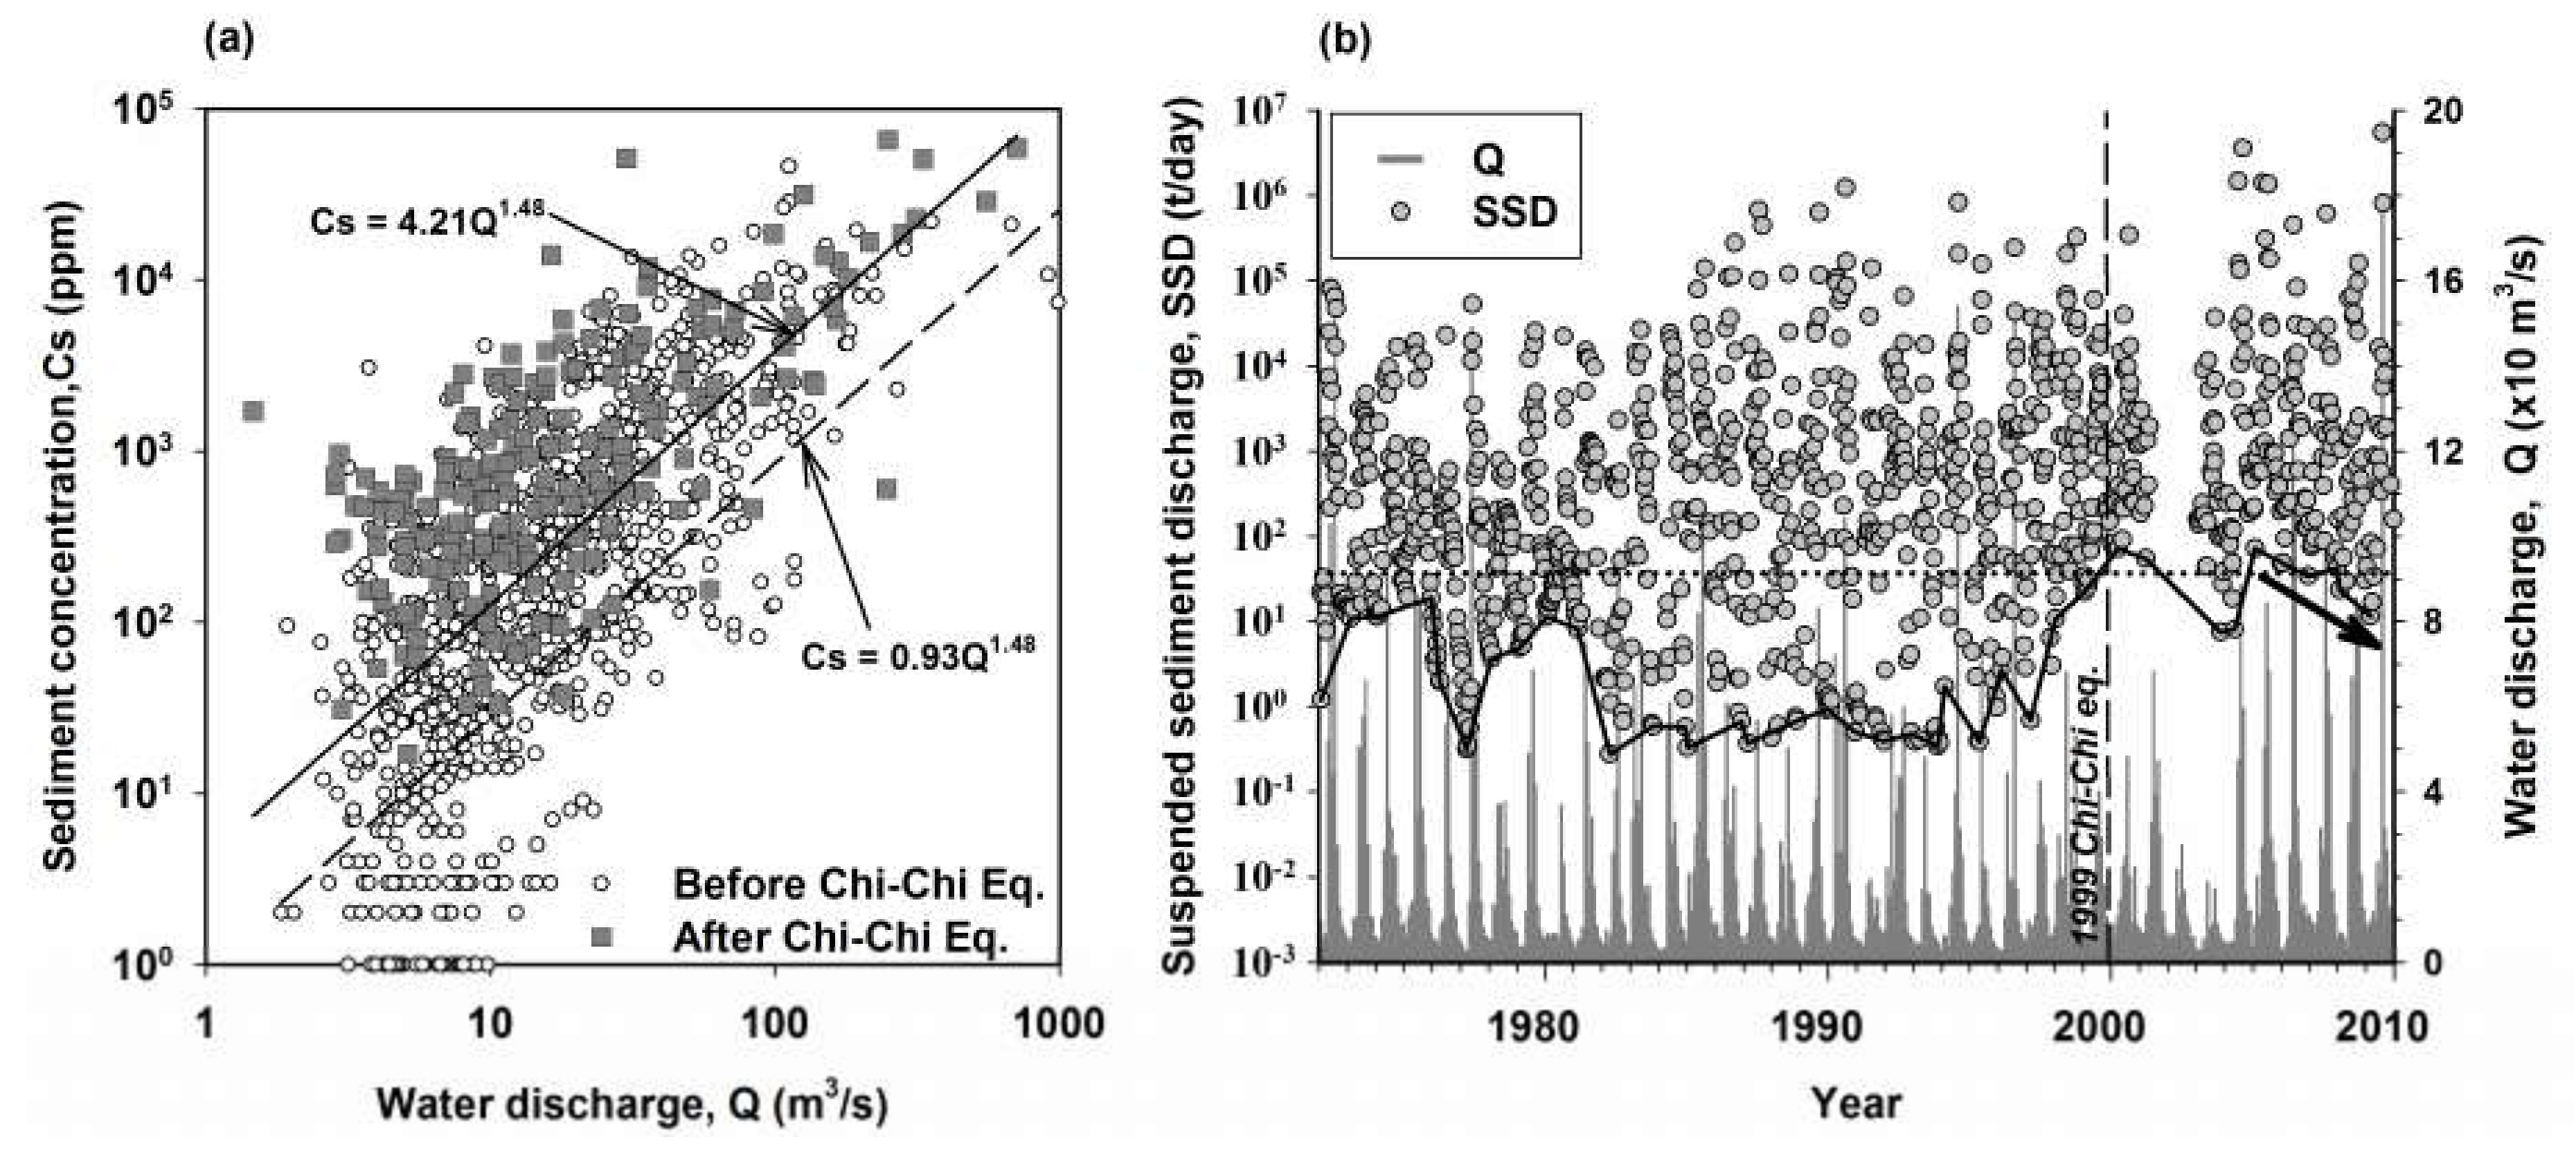
In this study, sediment concentration data from the Chenyoulan River and Tachia River in central Taiwan and the Peinan River in east Taiwan were used to establish the Cs–Q rating curves for each river pre- and post-earthquake, and compared the variation of suspended sediment discharges in the catchments before and after the earthquakes. The results showed that the unit sediment concentration after the 1999 Chi-Chi earthquake was higher than before the earthquake and the unit concentration increased from 0.93 ppm before the earthquake to 4.21 ppm after it (increased by approximately 4.5 times) (Figure 2a). Additionally, it was found that all of the measured suspended sediment discharges after the 1999 Chi-Chi earthquake were more than 10 t/day, which is obviously different from before the earthquake (less than 10 t/day) (Figure 2b). The increase in measured suspended sediment discharge reached a peak in 2005. In 2005, the minimum measured sediment discharge was 71.78 t/day. After 2005, the measured suspended sediment discharges decreased gradually. The average annual sediment discharges in the Chenyoulan River in the periods from 1972 to 1999 and from 2000 to 2009 were 4.75 and 20.93 Mt/year, respectively. The average annual sediment discharge increased by approximately 4.4 times. Moreover, the change of unit concentration before and after earthquakes can reflect the impact of an earthquake on sediment yields.
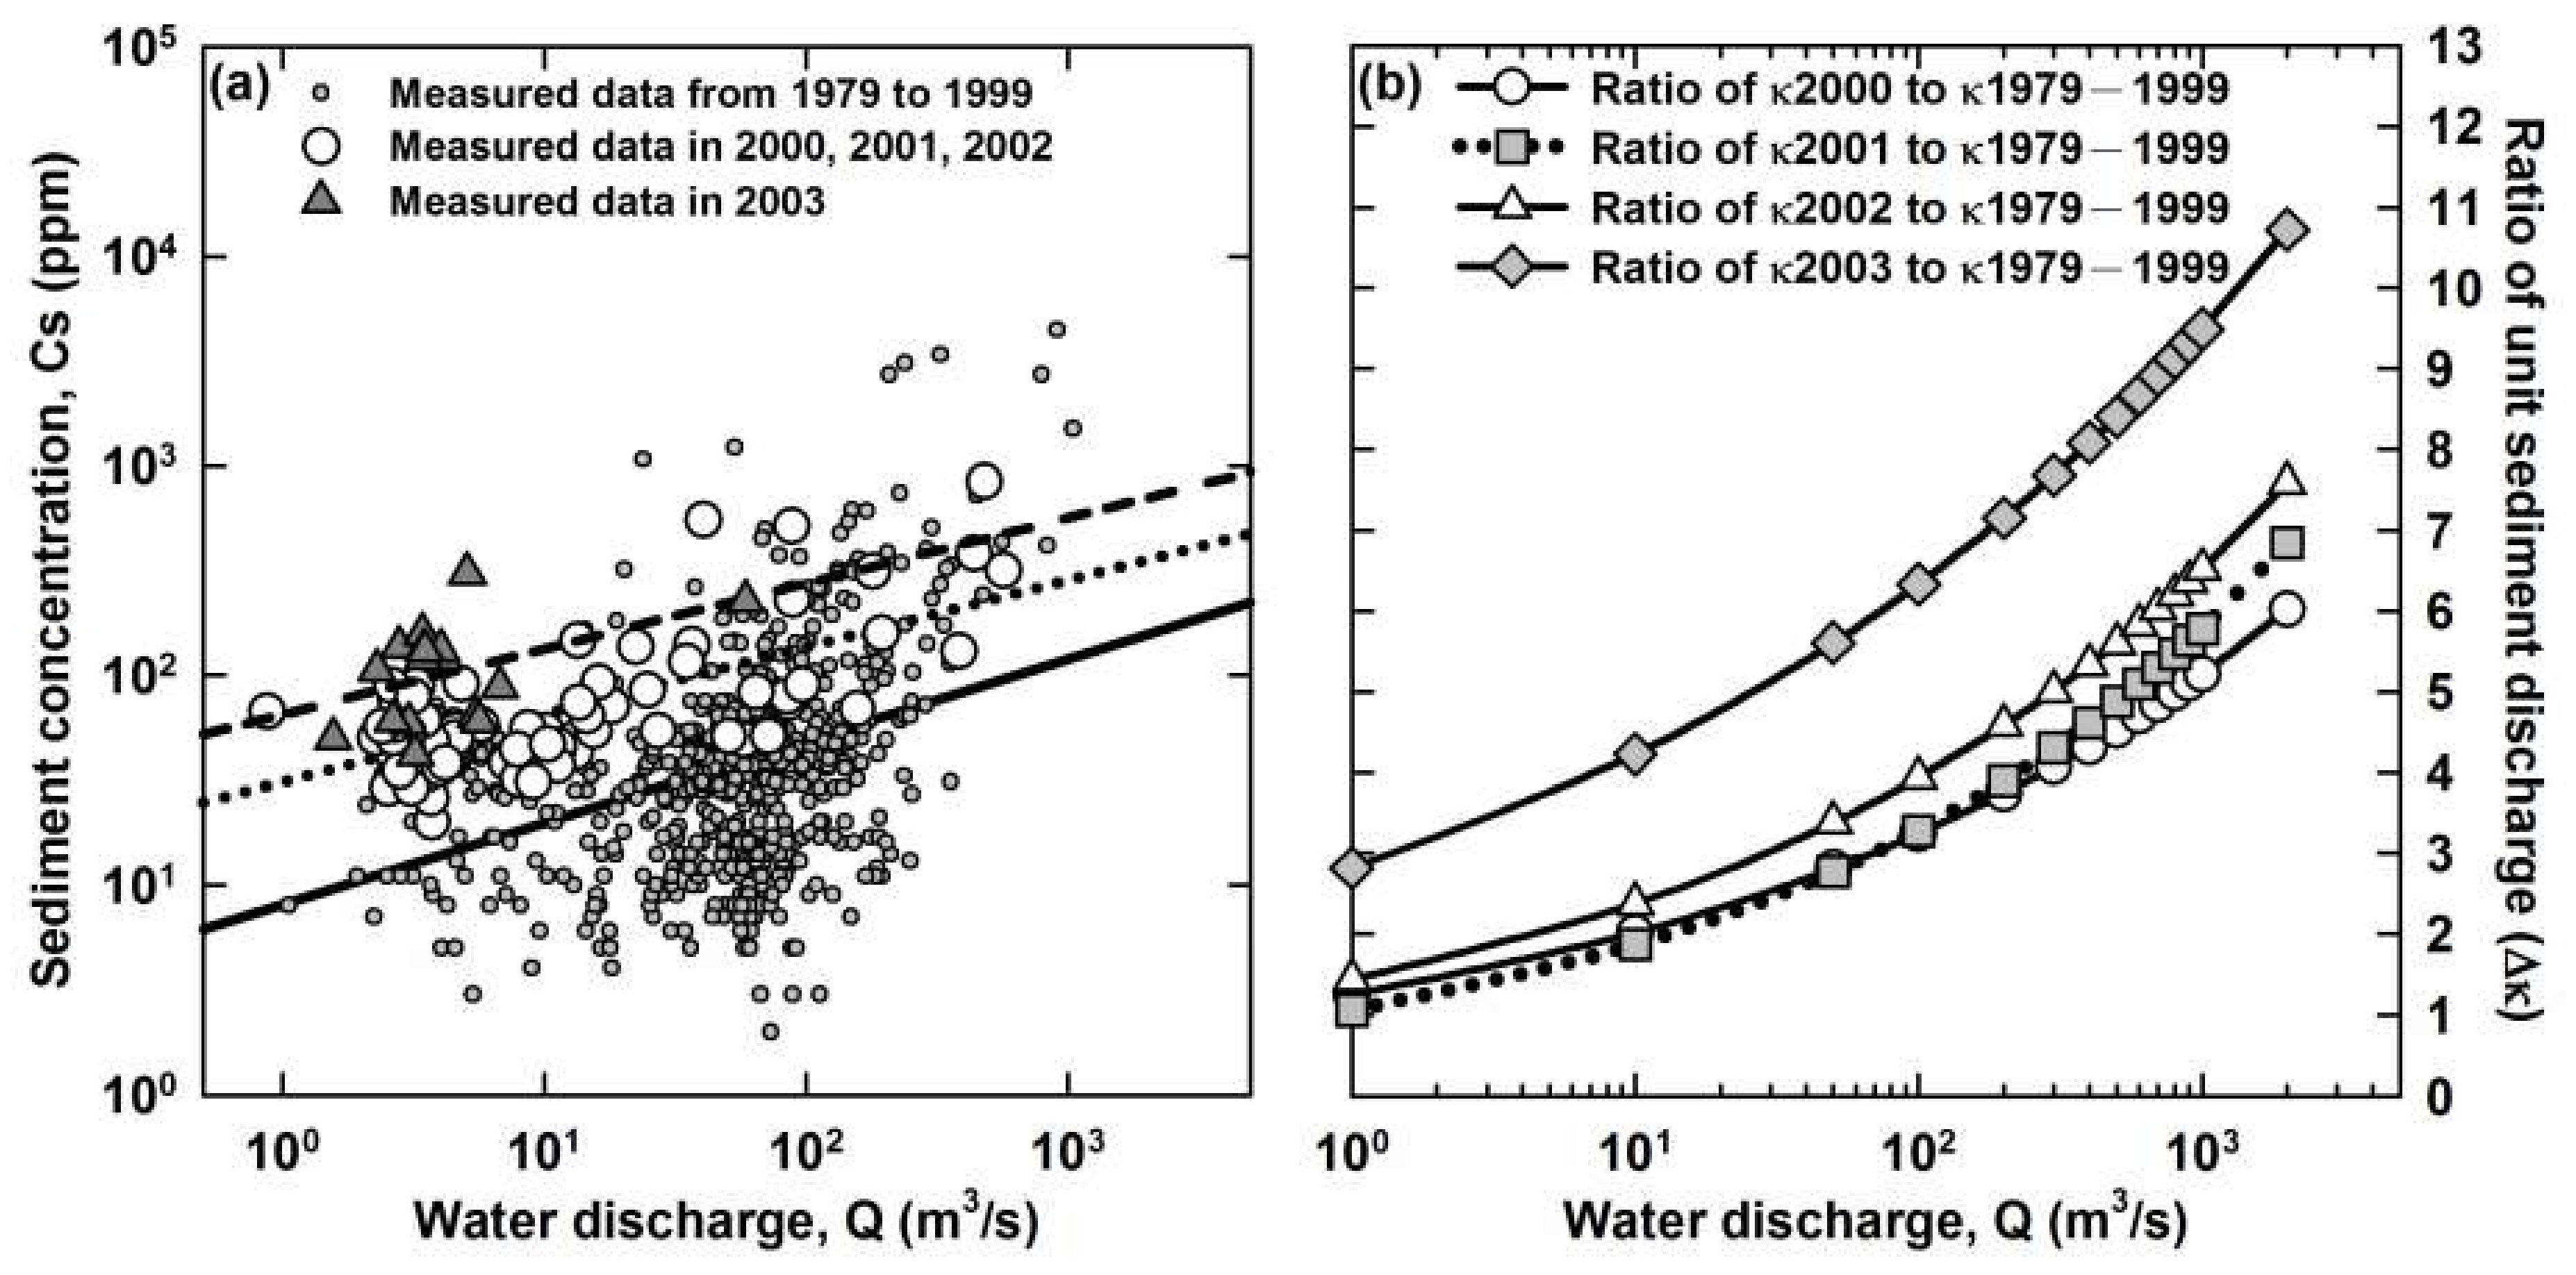
The observed data in the Tachia River revealed that the rating curves from 2000 to 2003 rose year by year and the sediment transport increased at the same water discharge. In addition, the relationship between the ratio of unit concentration before and after the 1999 earthquake and the water discharge showed that when the water discharge was less than 10 m3/s, the unit concentration after the earthquake was twice that before the earthquake. When the water discharge was more than 100 m3/s, the unit concentration after the earthquake was more than four times that before the earthquake (Figure 3). The results showed that the unit concentrations increased significantly as the water discharge increased.
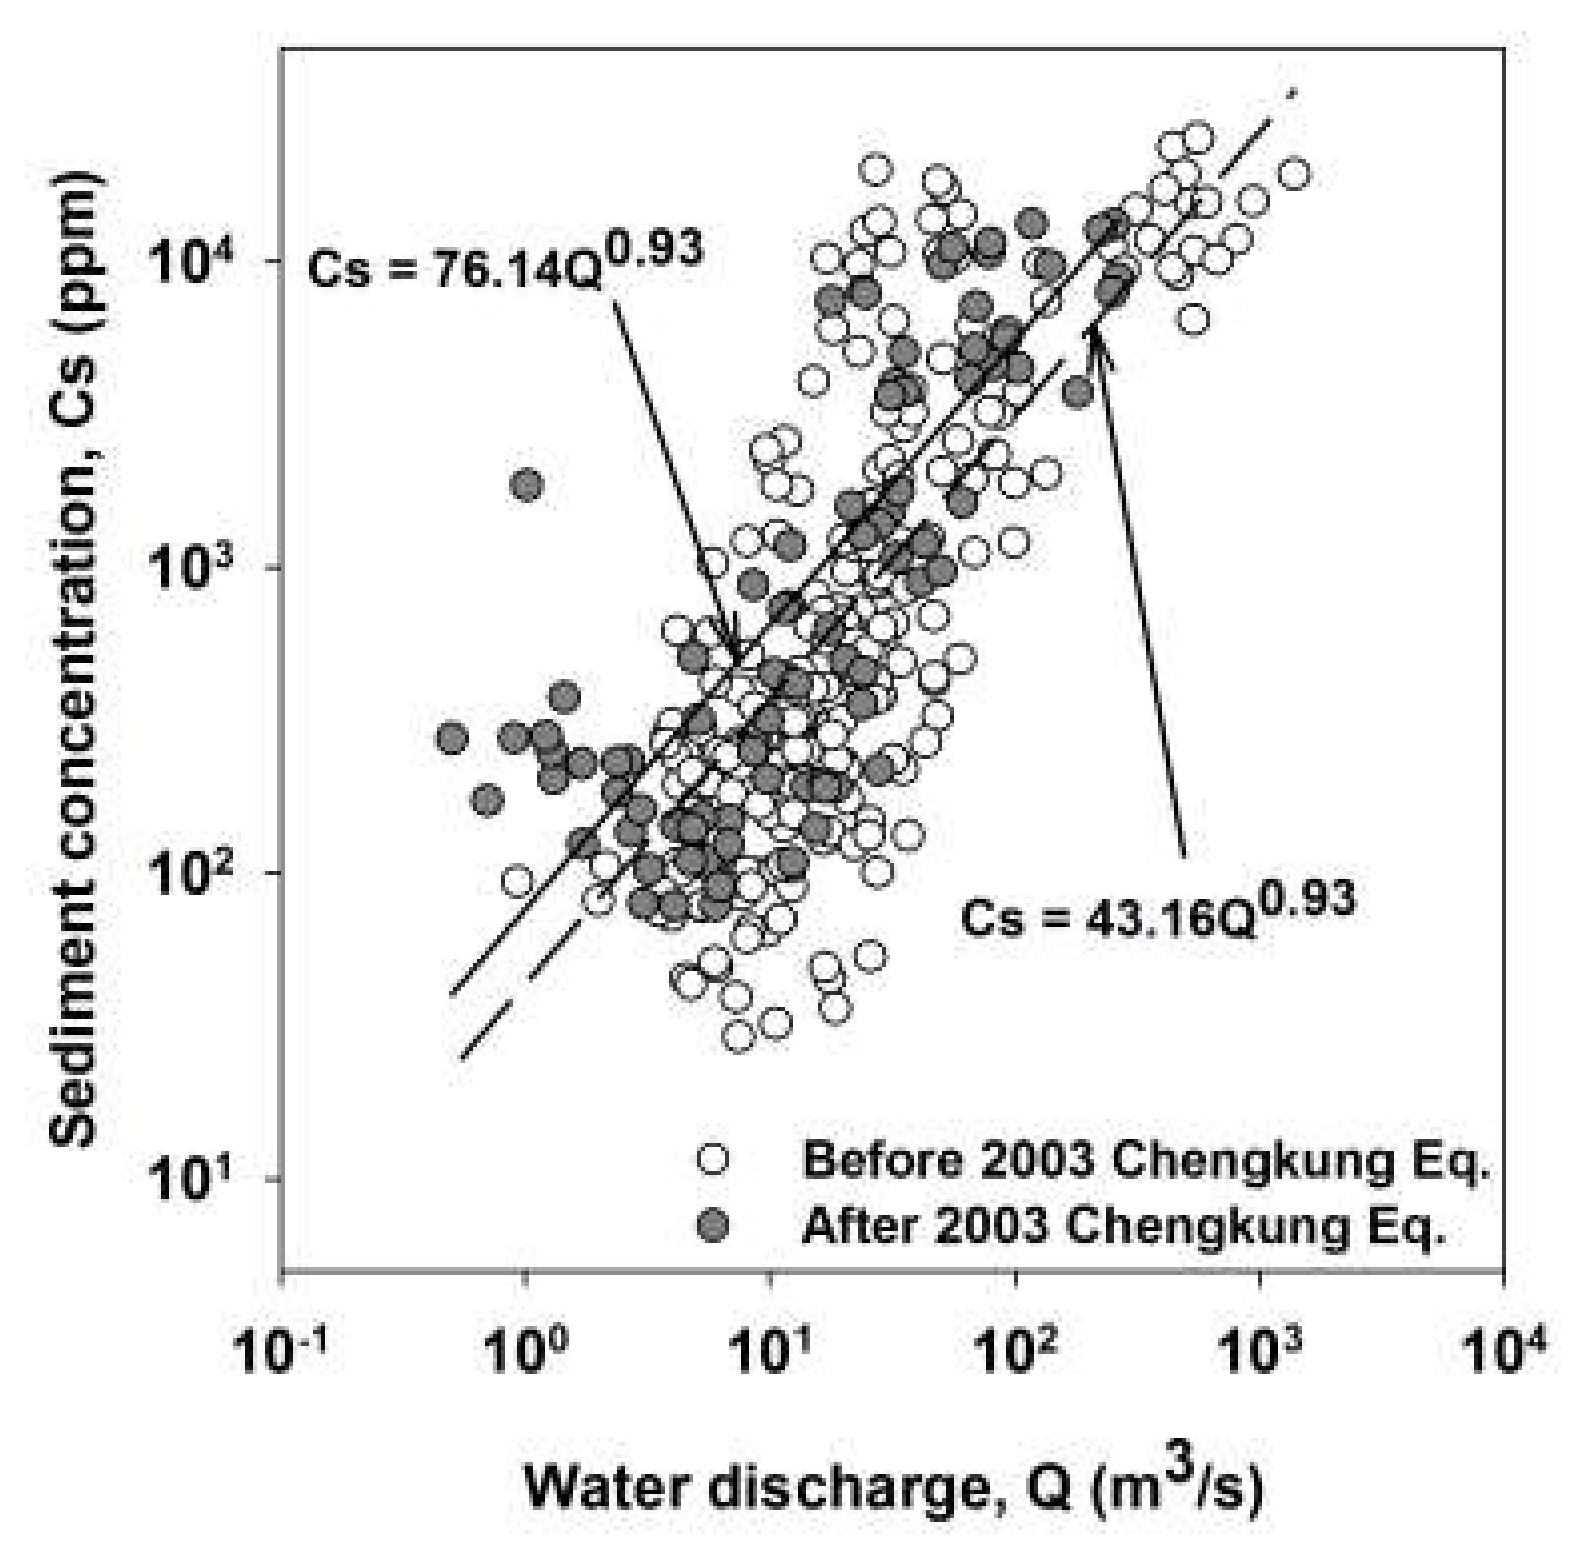
In the Peinan River, the unit concentration was 43.16 ppm before the 2003 Chengkung earthquake and increased to 76.14 ppm after the earthquake (Figure 4). This showed that sediment transport increased by 1.8 times after the earthquake. The average annual runoff from the Peinan River during the period from 1948 to 2003 was 3.0 km3/year, and the average annual sediment discharge was 57.77 Mt/year. During the period from 2004 to 2008, the average annual runoff was 2.92 km3/year and the average annual sediment discharge was 82.01 Mt/year. This exhibited that the annual sediment discharge increased by 1.4 times after the 2003 earthquake at a similar water discharge rate.
3.2. Influence of Earthquake Frequency on Sediment Discharge
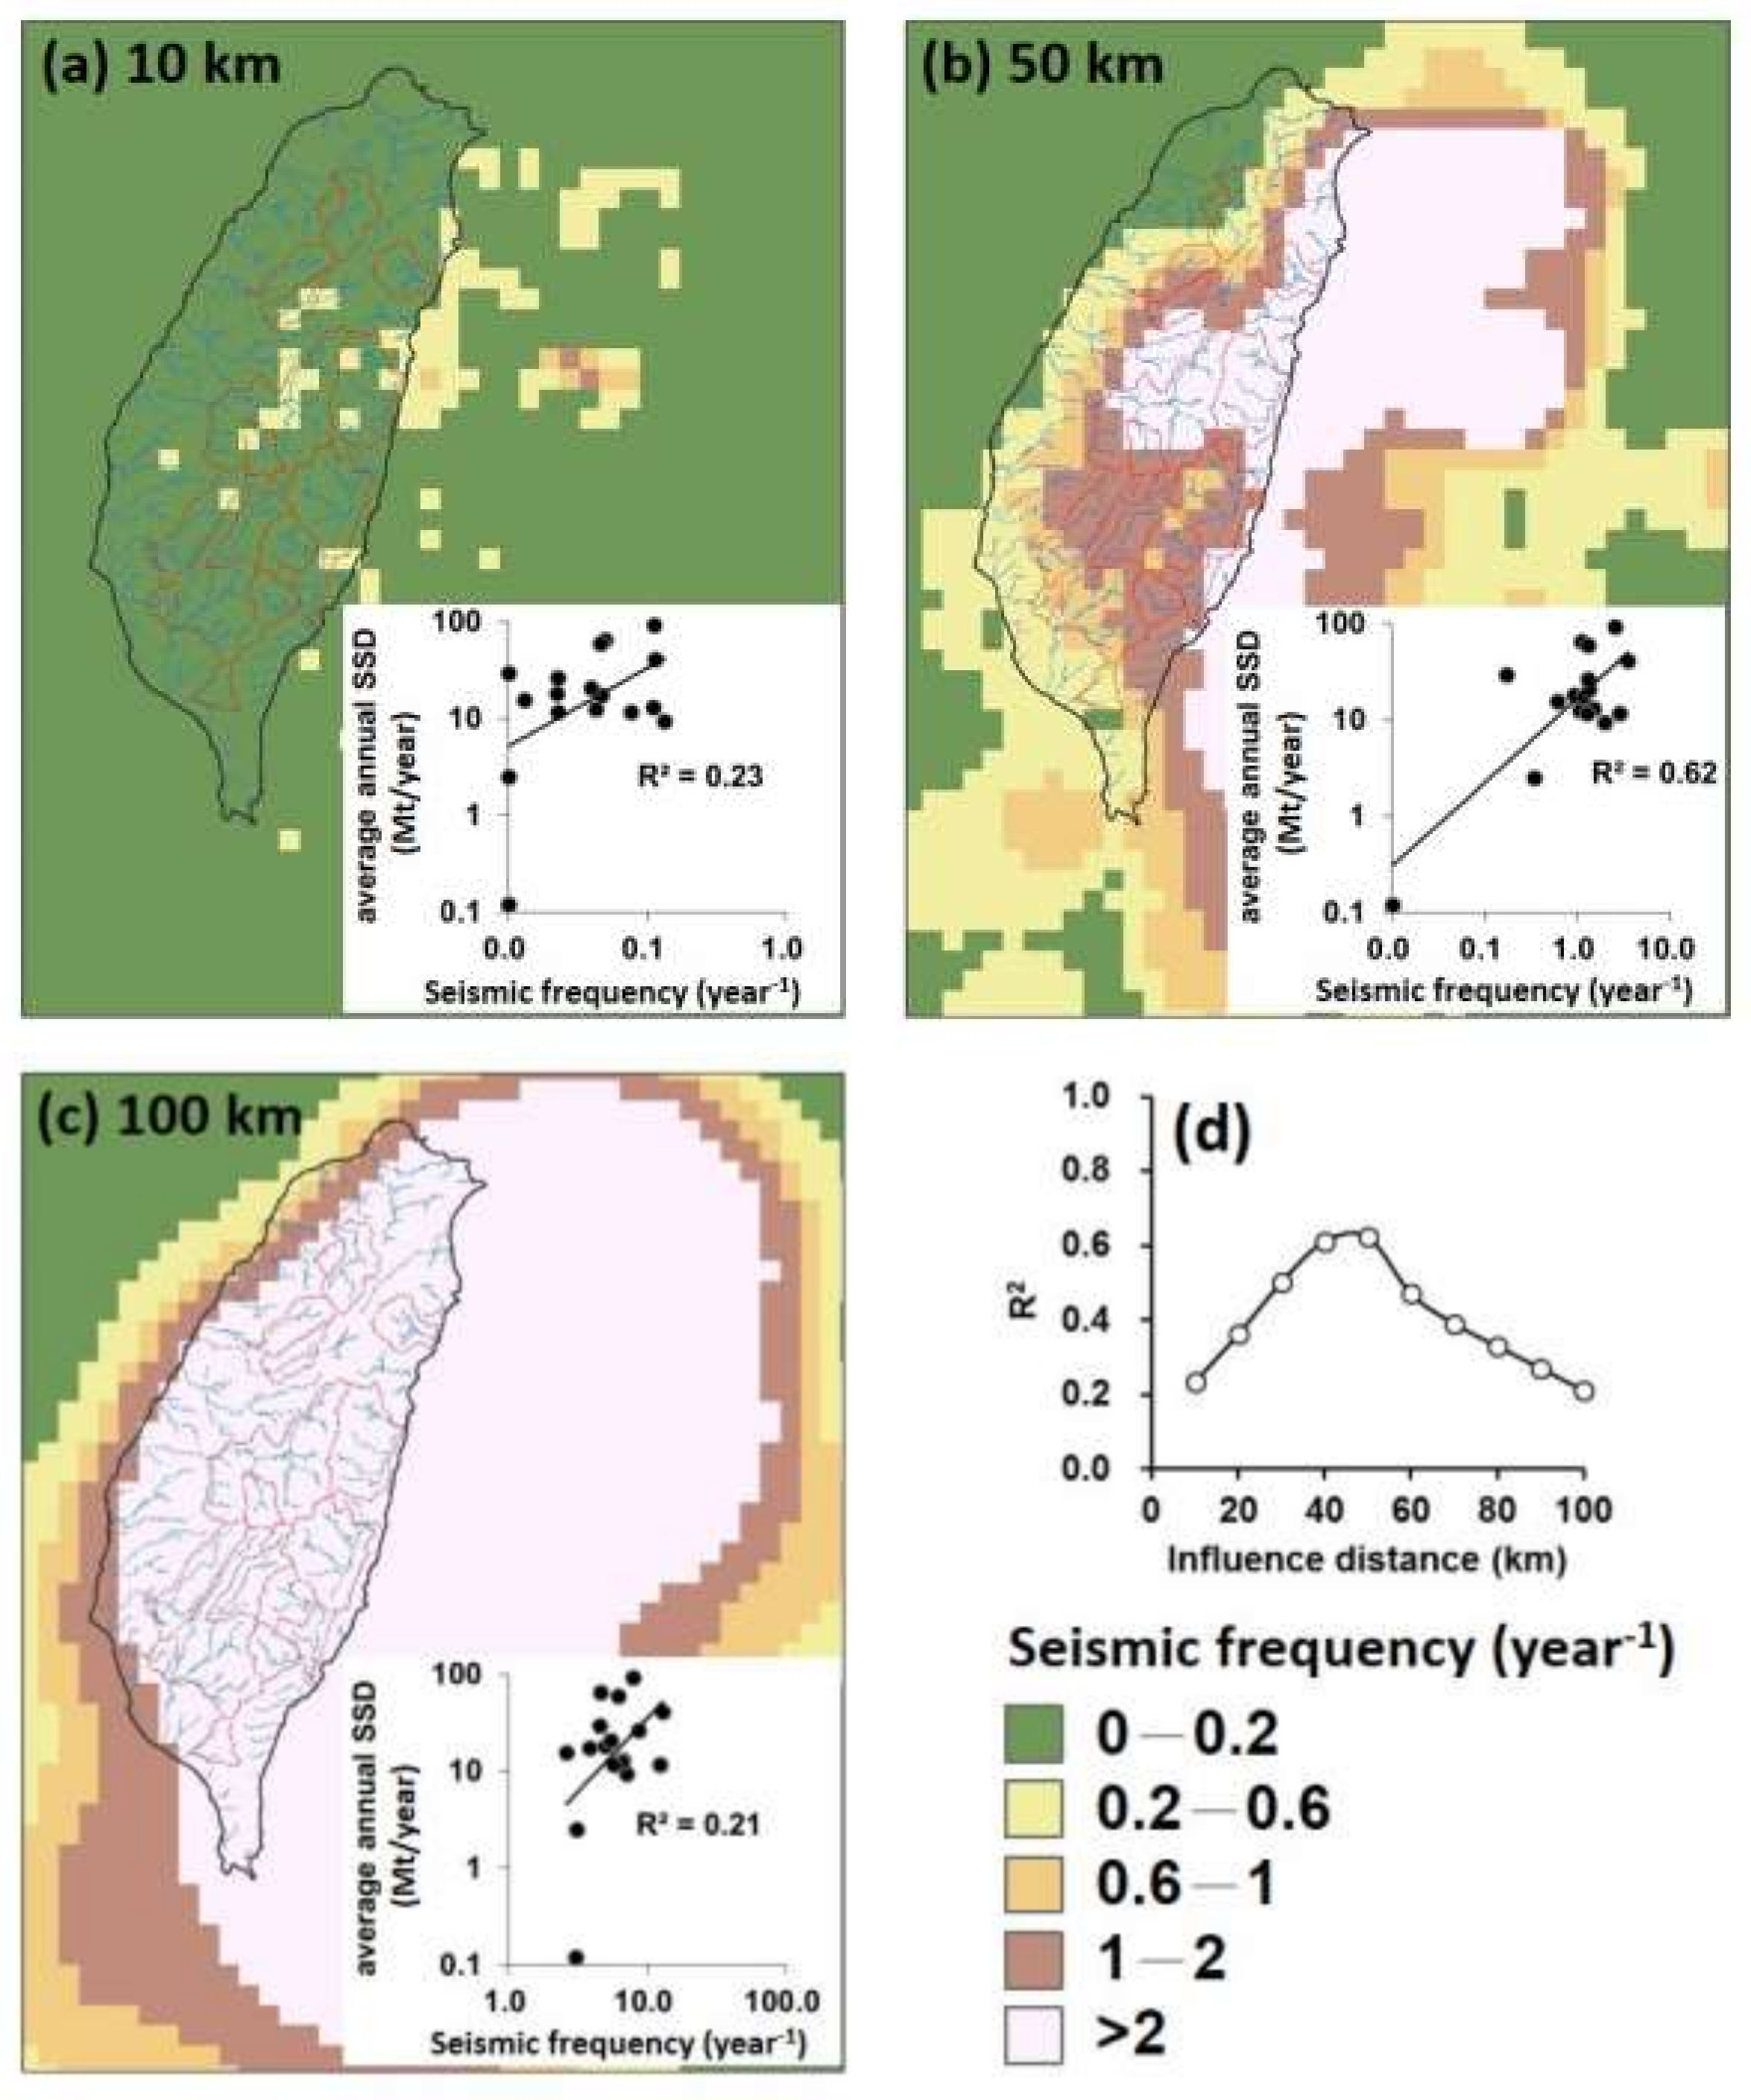
Keefer [9] found a correlation between landslide area and earthquake magnitude and points out that a larger earthquake magnitude could cause a greater total area of coseismic landslides. Furthermore, the earthquake magnitude of 5.0 seems to be the threshold for the occurrence of coseismic landslides. Therefore, 1084 earthquakes with magnitudes greater than 5.0 from 1970 to 2009 around Taiwan were used to analyze the relationship between frequency (year−1) of earthquakes and the annual sediment discharge in the selected basin. Seed and Idriss [19] analyzed the relationship between the peak ground accelerations (PGAs) of earthquakes and epicentral distances and found that the PGAs generated by earthquakes of magnitude 5.0 to 6.0 fell to 0 g when the distance was more than 161 km from the epicenter. The PGAs generated by earthquakes with magnitudes greater than 6.0 were smaller than 0.1 g when the distance was more than 161 km from the epicenter. Therefore, I assumed the largest distant influence of an earthquake was 100 km. Ten different earthquake influence distances were employed to correspond to the annual sediment discharge in different catchments. The 10 earthquake influence distances ranged from 10 to 100 km with an interval of 10 km. When a catchment was located within the influence distance of an earthquake, it meant the catchment had been affected by the earthquake. By summating the number of earthquakes whose influence distances reached the catchment, the seismic influence frequency could be calculated by dividing the earthquake number by the length of time period from 1970 to 2009 in the year (Figure 5). The results showed that the seismic frequency in the Hualien catchment was the highest, and the lowest was in the Touchien catchment. In addition, the distribution of seismic frequency shows that the seismic influence frequency of the eastern region of Taiwan is higher than that of the western region, and that of the central region is higher than that of the northern and southern regions. By comparing the average annual sediment discharges with the seismic frequency at different influence distances, it was found that the squared correlation coefficient (R2) ranged from 0.21 to 0.62 (Figure 5a–c). The best correlation between the earthquake frequency and the average annual sediment discharges, R2 of 0.62, was obtained when the earthquake influence distance was 50 km (Figure 5d). In accordance with the analysis of Seed and Idriss [19], the M-5.0 earthquake-induced horizontal ground acceleration was reduced from approximately 0.44 g to less than 0.05 g at a distance of 50 km from the epicenter, and even the M-7.6 earthquake-induced horizontal ground acceleration decreased to less than 0.2 g. The impact of these vibrations on geologic materials has been rather weak. The results are in agreement with the analyses of the landslide density induced by the 1999 Chi-Chi earthquake in the Chenyoulan and Tachia catchments [7,8]. When the PGA was less than 0.2 g, the coseismic landslide density begin to decrease rapidly, and the landslide density approached zero when the PGA was less than 0.1 g.
4. Recovery Periods of Fluvial Sediment Transport
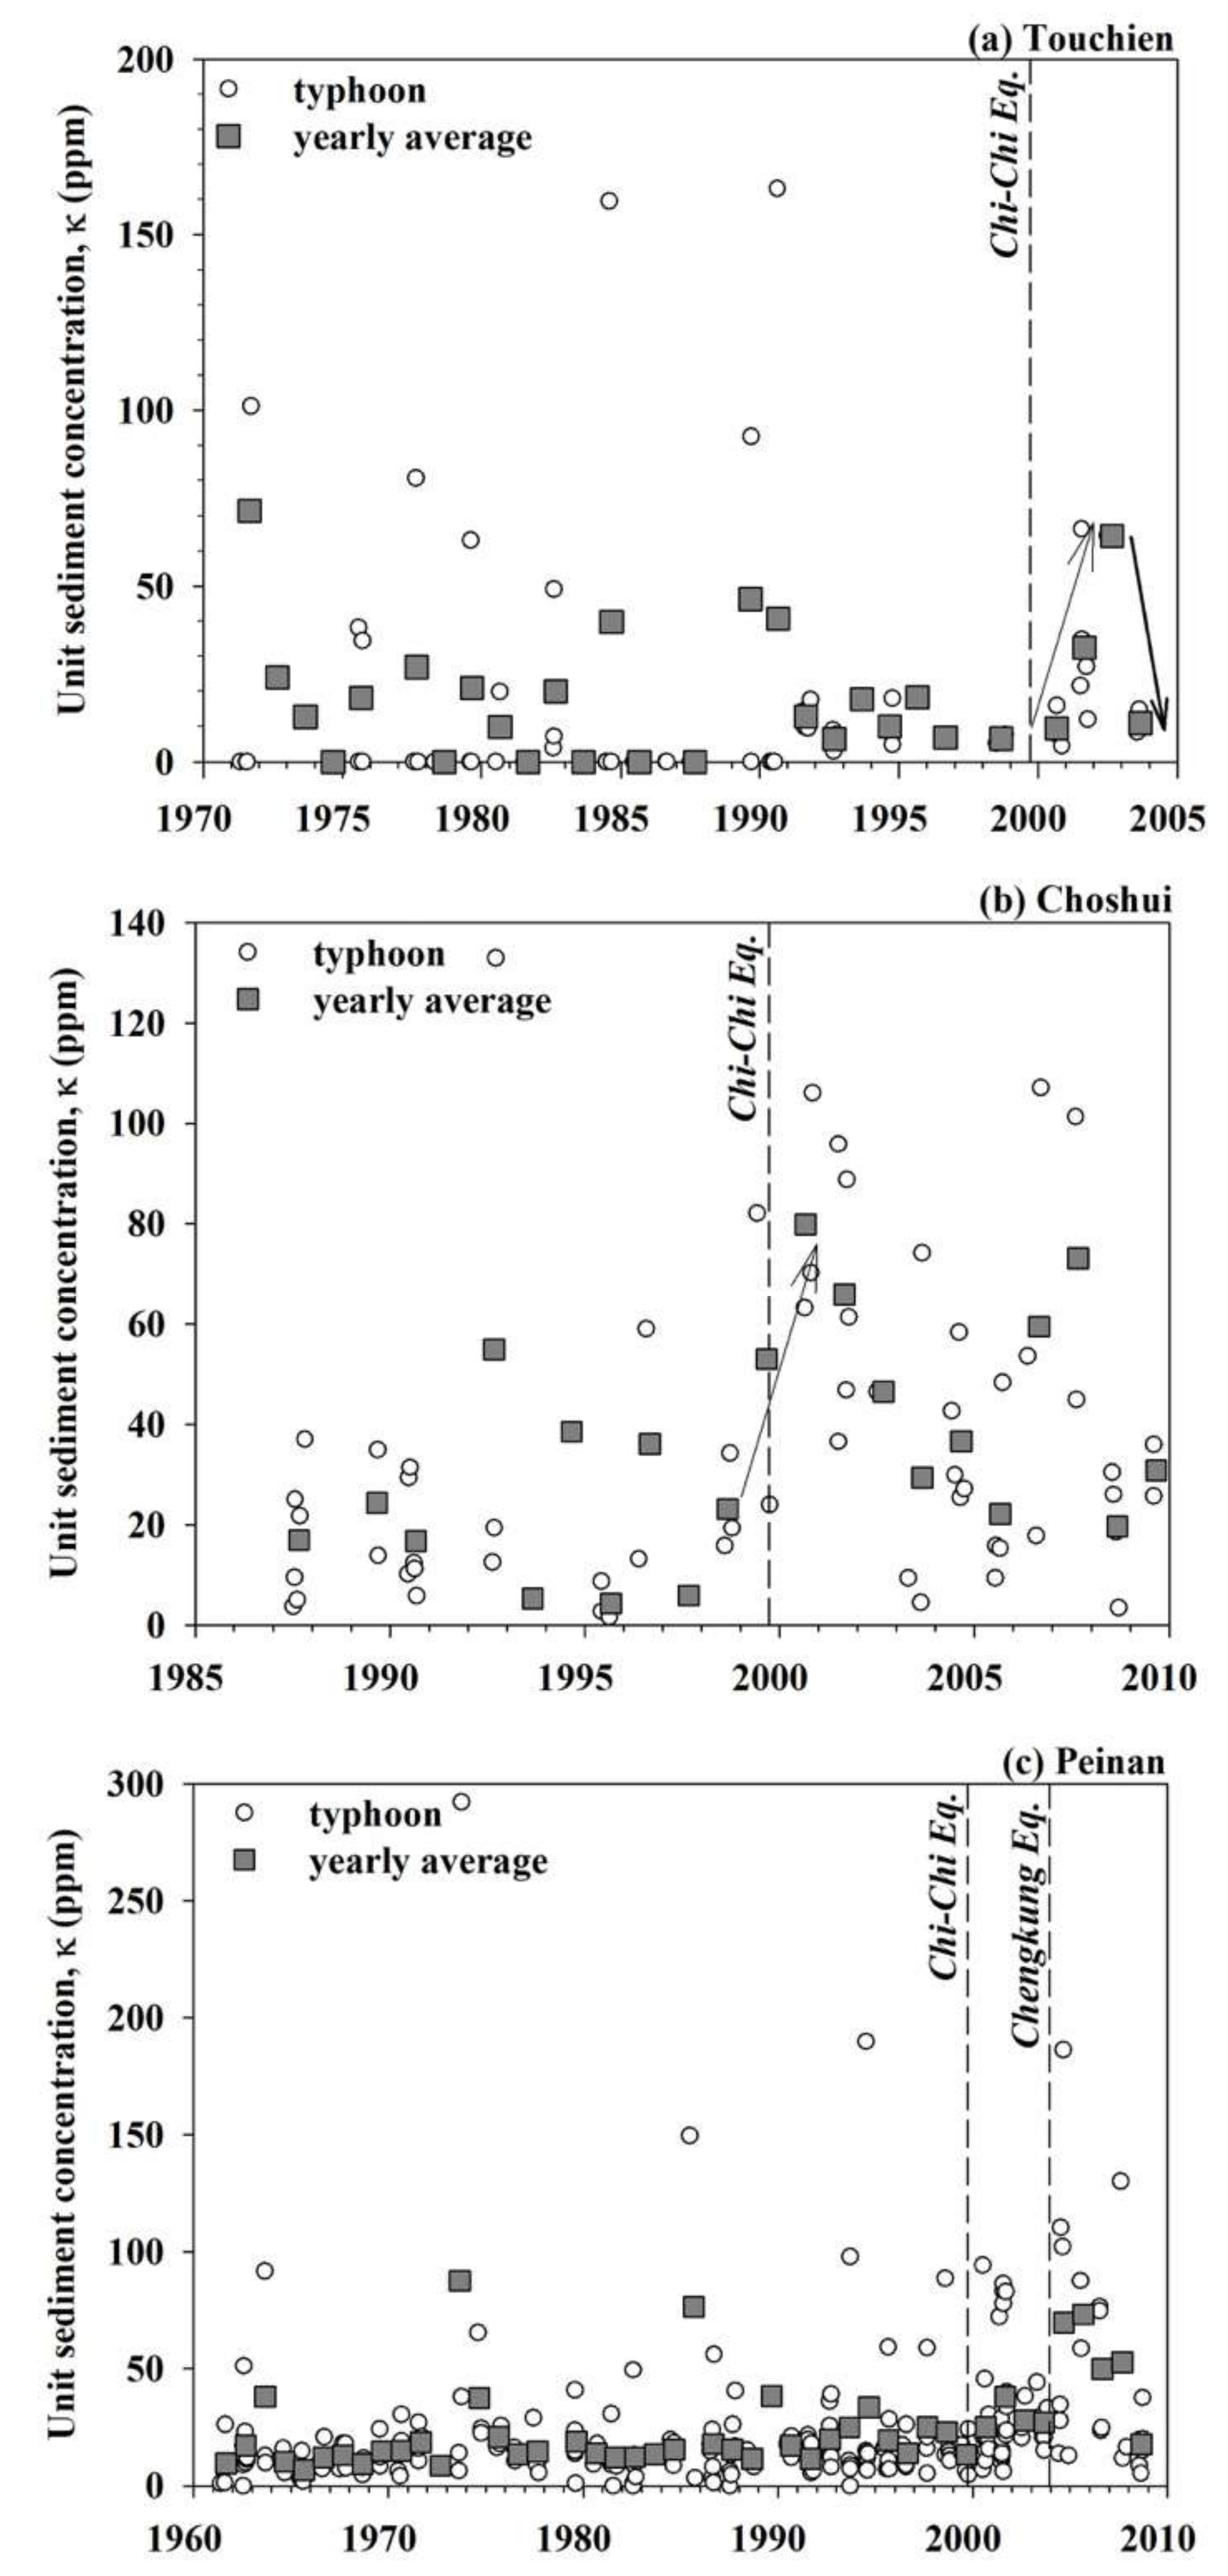
The impact of a large earthquake on the mass wasting in a basin will not terminate in a short period, as was the case in the 1923 Kanto earthquake in Japan, which affected the amount of sediment discharge in the Sakawa River for 80–100 years [11]. To understand the time needed to return to the average level of sediment discharge before an earthquake, I attempted to use the measured sediment concentration data during the typhoon period to obtain the unit concentration, κ, during typhoon seasons and the average annual unit concentration. After a large earthquake, most of the catchments showed a rise in unit concentration during a subsequent typhoon event. This indicated that the loosening of geomaterial and the increase of sediment supply in the basin resulted in the increase of sediment concentration in the river. Since the 1999 Chi-Chi earthquake, the unit concentrations in the main rivers around Taiwan have increased, and the extent of ground motions in different river basins were dissimilar, so the influence degrees were also different (Figure 6, Figure S1).
Furthermore, the ratio of unit concentration after the earthquake to the average value before the earthquake can be calculated. It was assumed that the unit concentration had returned to the level before an earthquake when the ratio was less than 1.0. In this way, the recovery period for the unit sediment concentration to return to the mean value before an earthquake could be obtained. From the examples of several rivers, it can be seen that the annual runoff of the Touchien River in 2000 was 0.26 km3 and the annual runoff of the Chenyoulan River in 2000 was 0.54 km3, which were lower than their average values of 0.31 and 0.73 km3, respectively. Therefore, after the 1999 earthquake, the unit concentration in the two rivers did not increase immediately. In contrast, the annual runoff of the Peinan River in 2000 was 3.32 km3, which was greater than the average of 3.01 km3. Therefore, the unit concentration in 2000 was higher than the average before the earthquake. The results showed that the unit concentration of sediment transport did not necessarily exhibit an immediate increase in the subsequent year after an earthquake.
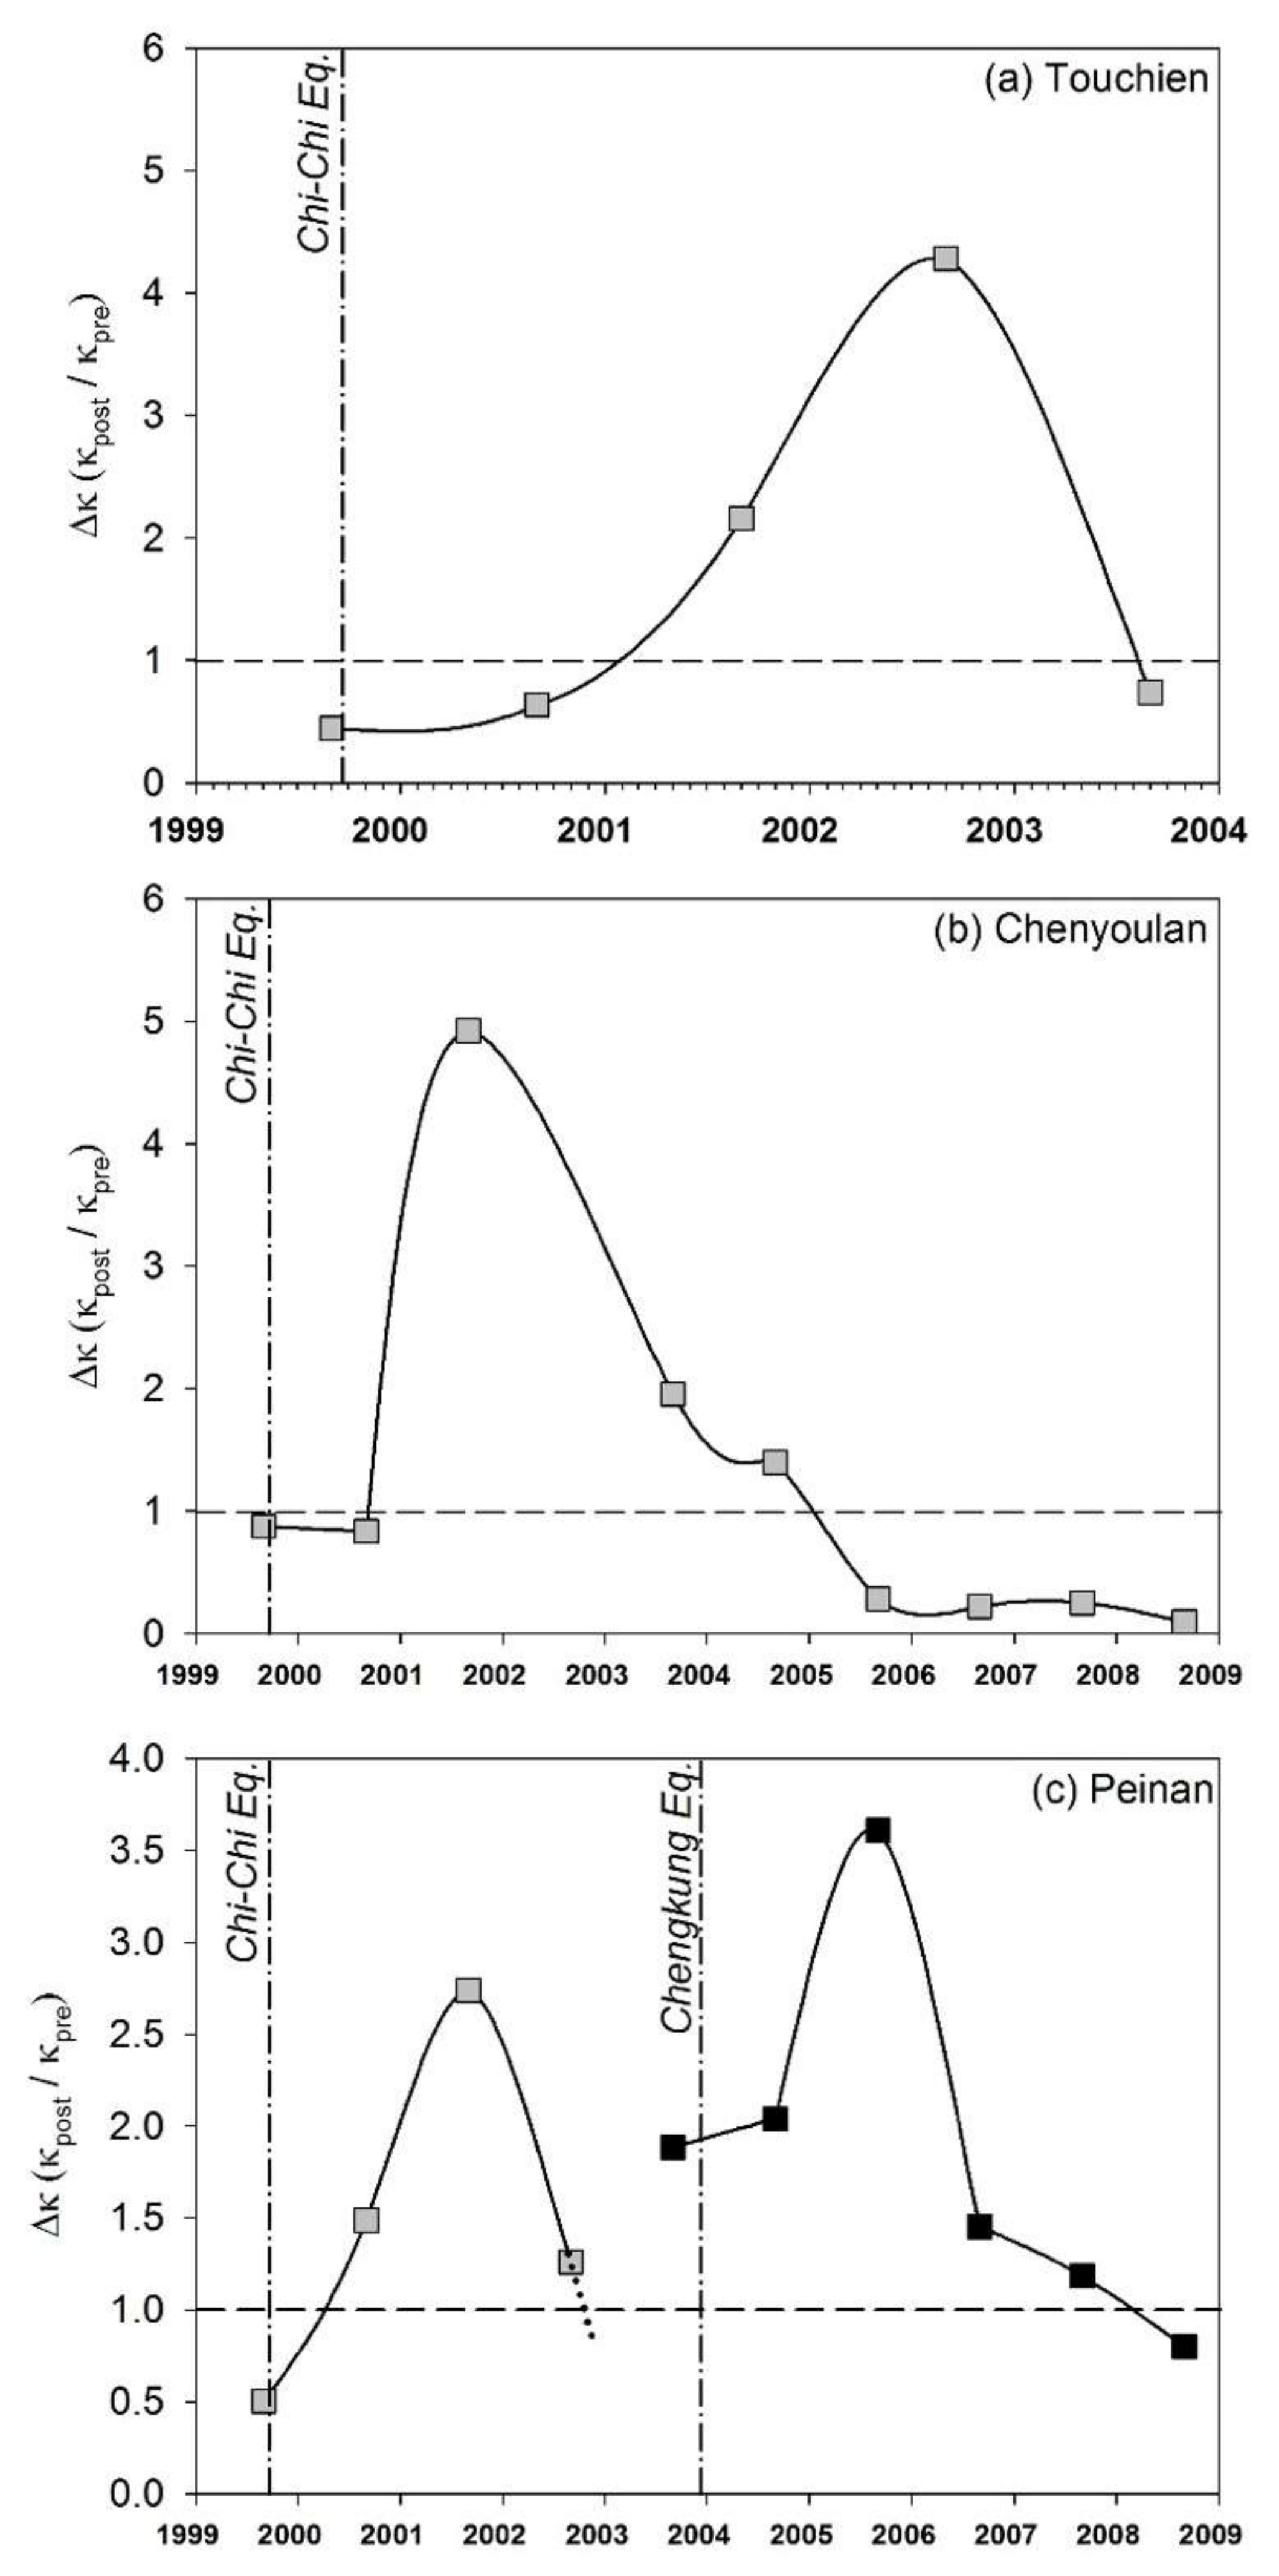
In addition, the ratio, ∆κ, of unit concentration after and before an earthquake revealed that the unit concentrations in the Touchien River returned to the average before the 1999 earthquake in 3.9 years, and the unit concentration in the Chenyoulan River returned to the average before the earthquake in 6.3 years (Figure 7). In 1999 and 2003, the Peinan River experienced two large earthquakes, the Chi-Chi and Chengkung earthquakes. The unit concentration returned to the average before the 1999 earthquake in 3.4 years and returned to the average before the 2003 earthquake in 4.1 years.
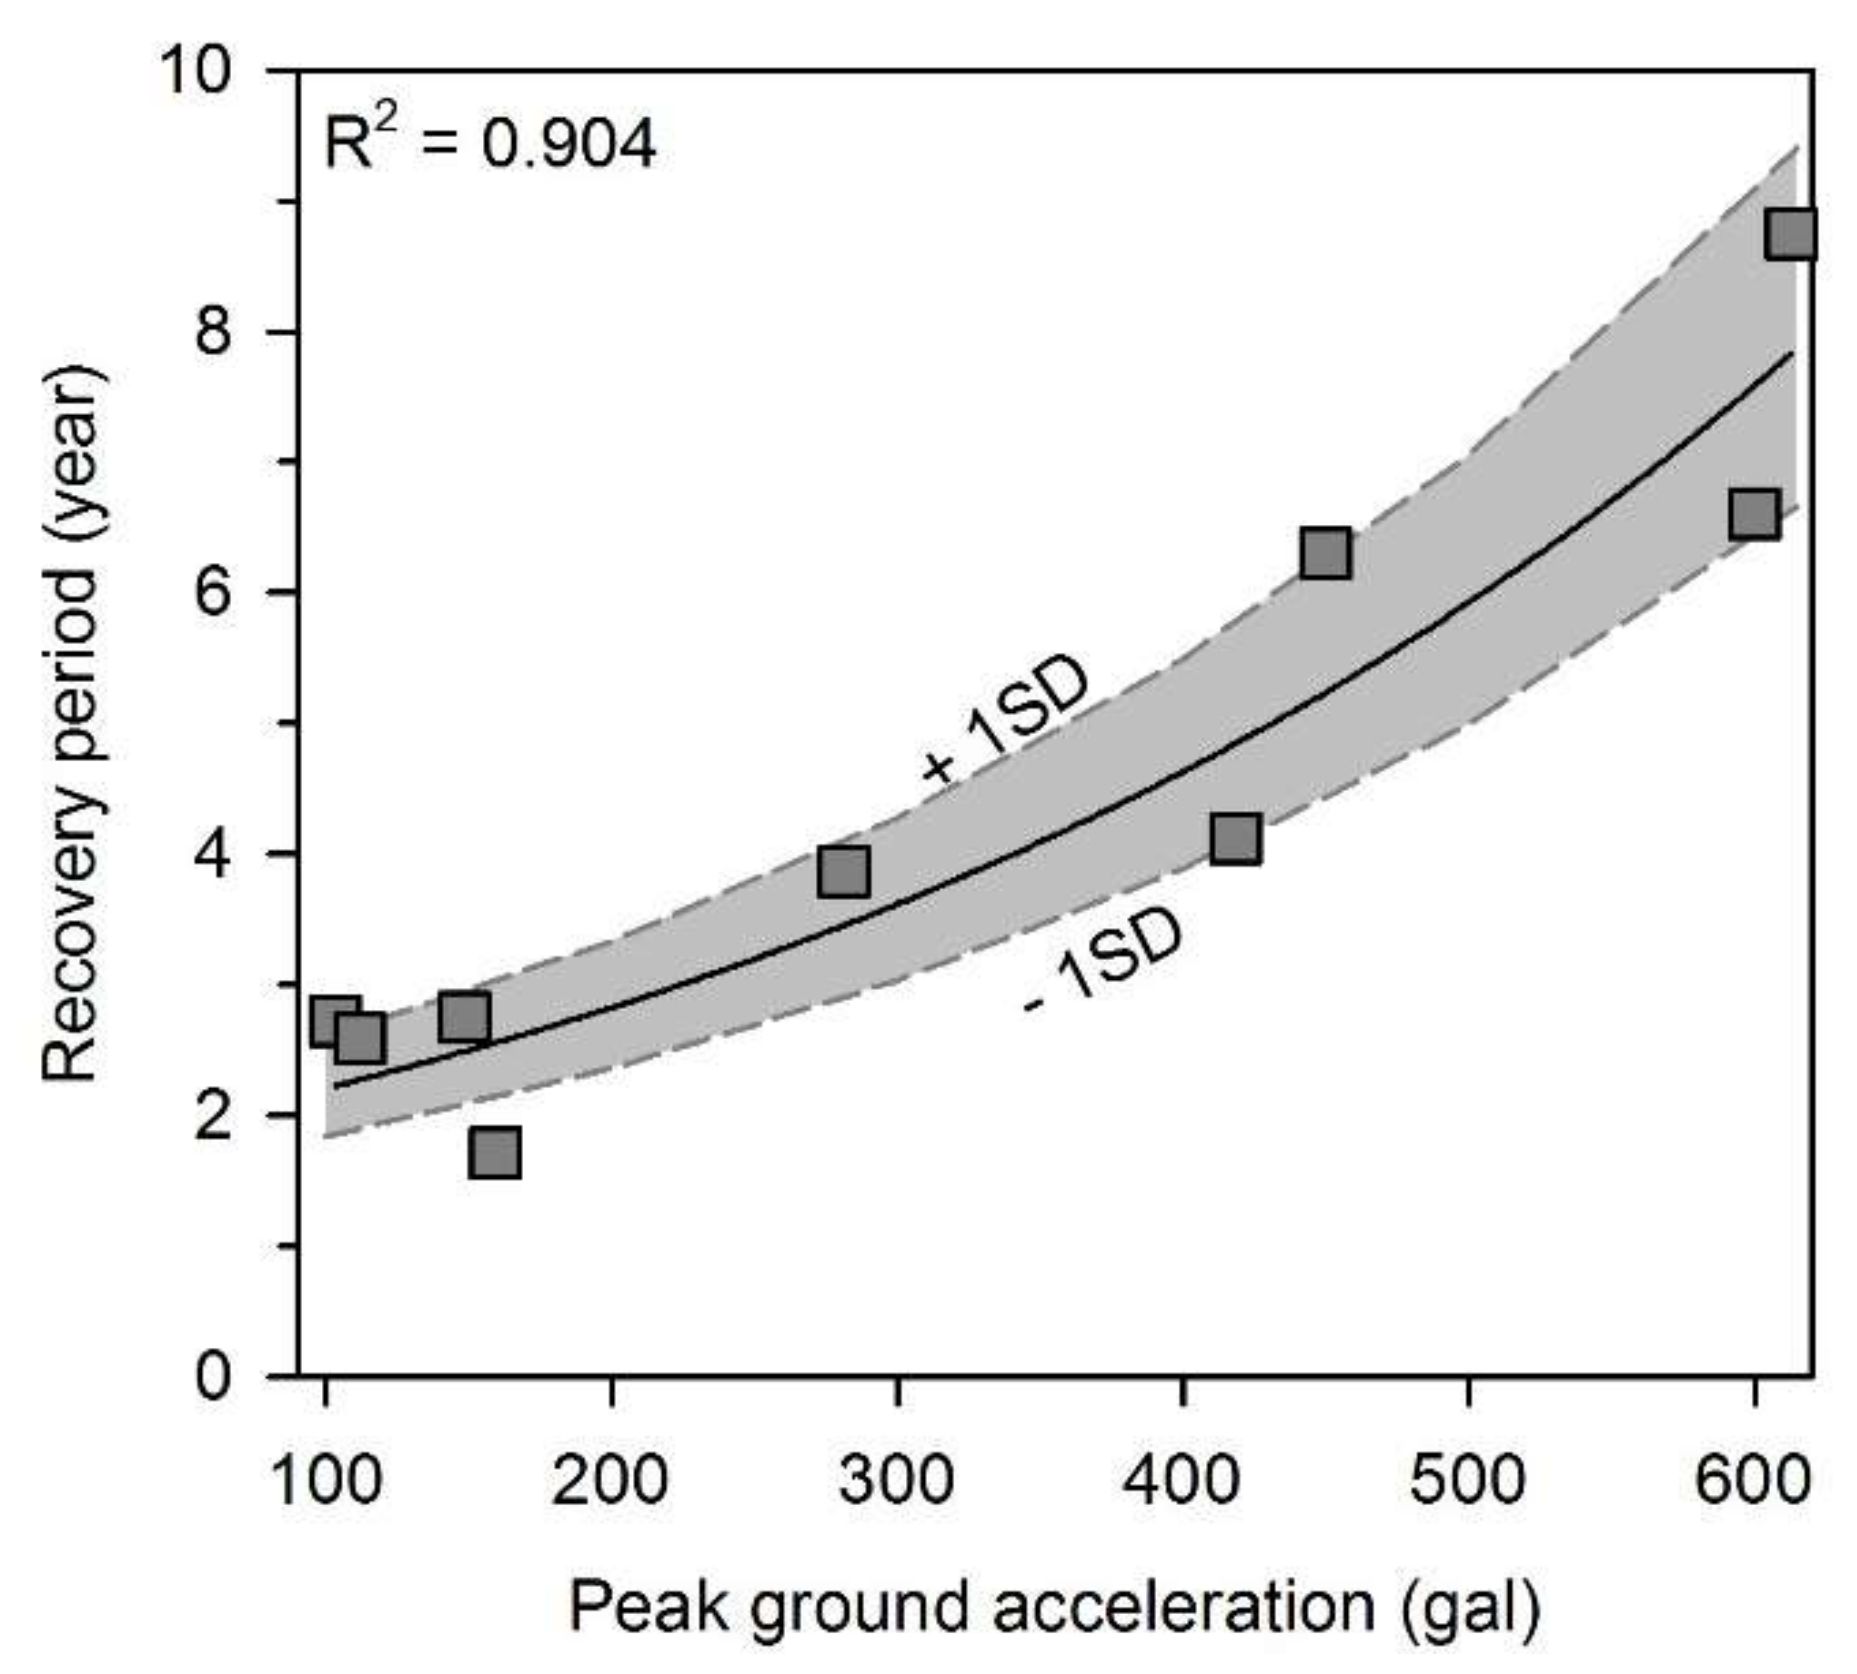
Data was collected on the peak ground acceleration (PGA) caused by the 1999 Chi-Chi earthquake, the 2003 Chengkung earthquake, and the 2006 Taitung earthquake, as well as the recovery period of the unit concentrations of several catchments. By comparing the peak ground acceleration and recovery period in each catchment, it was learned that when a catchment was affected by an earthquake with peak ground accelerations greater than 100 gal, the recovery period of sediment supply in the catchment was more than two years (Figure 8). Furthermore, a recovery period of more than four years was required if a catchment was affected by an earthquake with a peak ground acceleration greater than 400 gal. The time required to return to the level of sediment supply before the earthquake was longer due to greater ground acceleration. The results showed that the recovery period of the sediment transport after a large earthquake in Taiwan was significantly shorter than that of the Sakawa River in Japan. This can be attributed to the following reasons: the annual precipitation, >3000 mm, in Taiwanese mountain areas is more than that of the Sakawa River basin, 1662.5 mm, and the lengths of the main streams of Taiwanese rivers are shorter than the Sakawa River [11]. Therefore, the geomaterials affected by earthquakes were prone to transportation to downstream areas and even the ocean.
5. Influence Factors for Sediment Supply
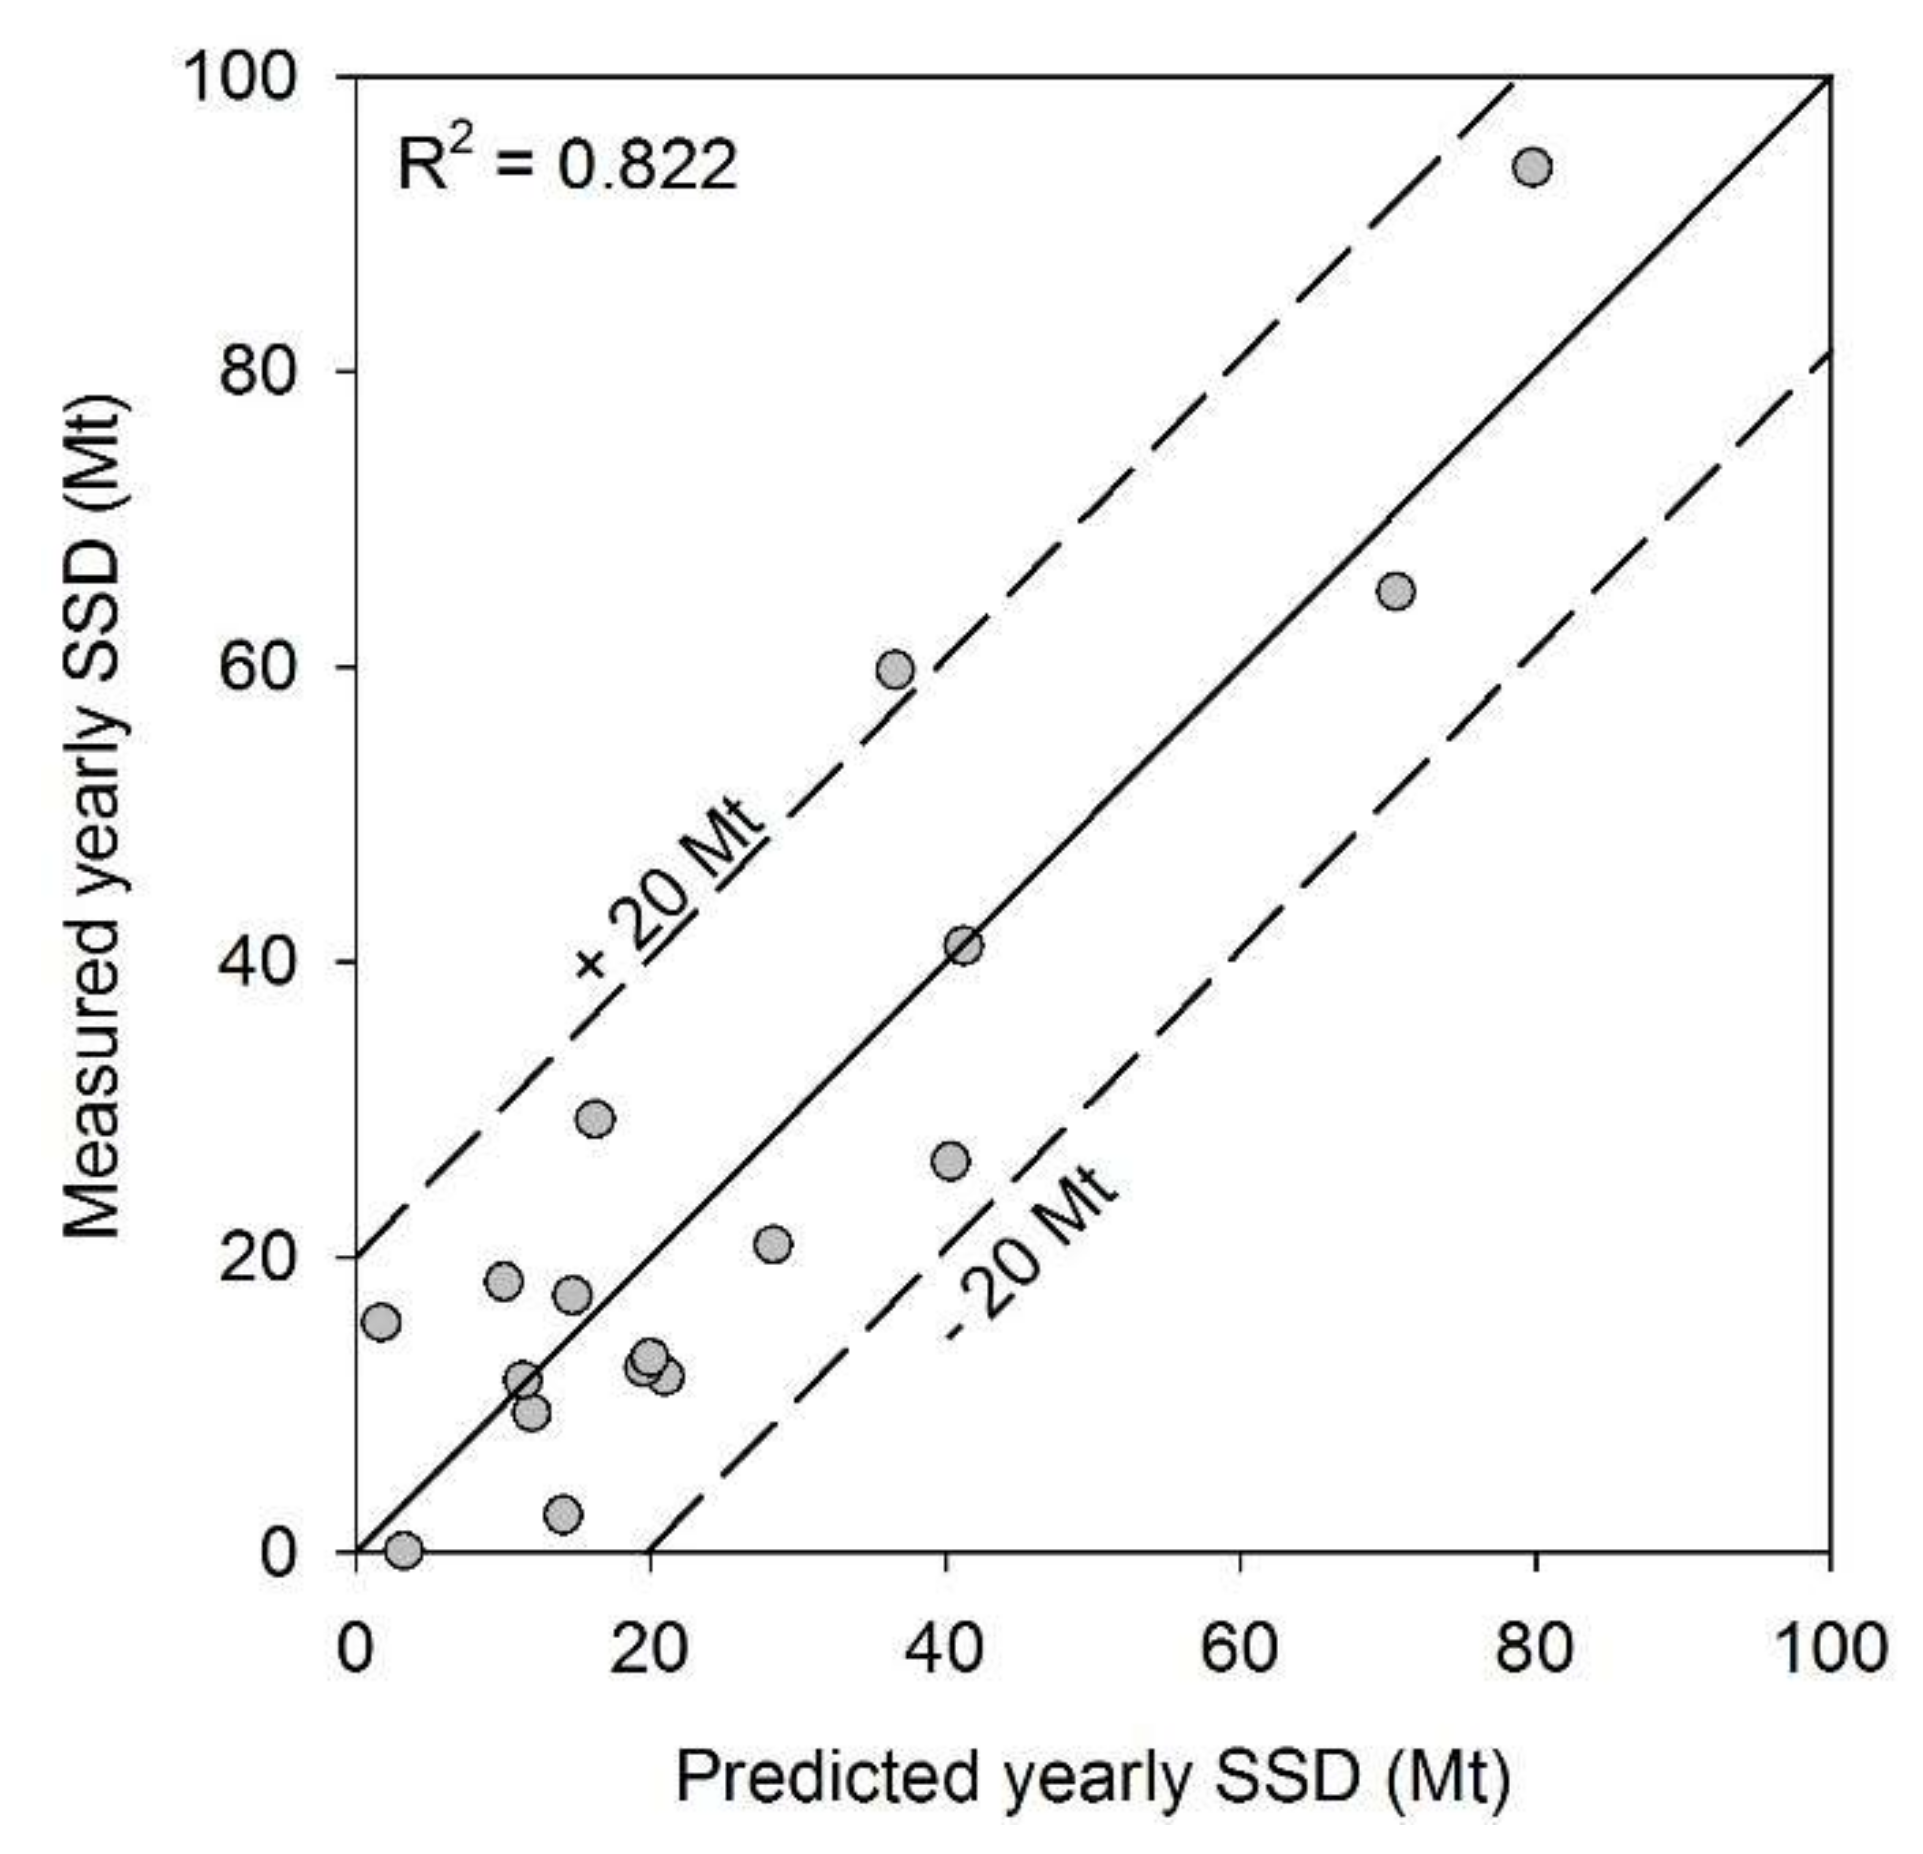
To interpret the influence factors for sediment supply, I used the statistical software SPSS to perform multiple regression analysis [20]. In the multiple regression analysis, the average annual sediment discharge from each catchment was a dependent variable, and four influence factors, average uniaxial compressive strength (UCS, MPa), average joint density (Jv, m−3), average annual runoff (Q, km3/year), and seismic frequency (Eq, year−1) were independent variables. The seismic frequency was the average annual number of earthquakes with a magnitude of more than 5 and influence distance of 50 km. Through the analysis, the best-fit relationship could be obtained (Figure 9):
where S is the average annual sediment discharge (Mt). The squared correlation coefficient R2 for the regression analysis was 0.838, which meant that the efficiency of the regression relation (Equation (5)) was 83.8%. In other words, the four influence factors contributed around 84% of influence on sediment yields. This equation implies a long-term relationship between sediment discharge and influence factors. Therefore, it cannot be used to predict annual sediment discharge. The equation also reveals a positive relationship between sediment discharge and runoff, joint density of rocks, and earthquake frequency, and a negative relationship between sediment discharge and rock strength. Furthermore, each influence factor was pulled out separately, and then the regression analysis was conducted. The value of R2 was obtained in the absence of one of the influence factors. Furthermore, the efficiency of the influence factor could be calculated as the difference between the R2 before and after the influence factor was pulled out.
S = 0.625∙Q1.359∙UCS−0.787∙Jv1.502∙Eq,
When the factor Q was pulled out, the R2 remained at 0.276 only (Table 1). This meant that the efficiency from annual runoff was 56.2%, which is the highest among the four influence factors. The efficiency of the UCS factor was the second highest at 18.5%. The efficiencies of the Jv and Eq factors regarding the annual sediment supply were 3.4% and 5.7%, respectively. It can be seen that the influence of geomaterial properties (including rock strength and fragmentation) on the sediment yield was 21.9%, and the influence of extrinsic factors (including runoff and earthquake) was 61.9%. The difference of long-term average annual sediment discharges between catchments was mainly determined by the extrinsic factors. The rest of the efficiency (16%), which was not contained in the multiple regression analysis, can be attributed to other factors, such as human activity, temperature, and experimental errors, which were not discussed in the study.
6. Conclusions
In this study, the sediment concentration data of the main rivers in Taiwan were used to calculate the sediment discharge over the past 30 years. Additionally, the influence factors for sediment yields in Taiwan were analyzed using an outcrop survey. The strength and joint density of rocks were taken as the basic properties of the geomaterials in each catchment. The change of unit sediment concentration before and after a large earthquake reflects the impact of the earthquake on sediment yields. The ground motions triggered by an earthquake in different catchments were dissimilar, so the influences on sediment yields could be significantly distinct. It was found that the recovery period of fluvial sediment after a large earthquake should be different due to the distinction in ground motions triggered by the earthquake in each catchment. The ratios of unit sediment concentrations prior to, and following, a large earthquake in a catchment can be used to assess the recovery period.
The relation between recovery periods of fluvial sediment transport and PGAs revealed that the time required to return to the average sediment concentration before an earthquake was longer due to the greater surface acceleration of the earthquake. When a catchment was affected by an earthquake with a PGA greater than 100 gal, the required recovery period was more than 2 years; furthermore, when the earthquake induced PGA greater than 400 gal (~0.4 g), the required recovery period was more than 4 years. Multiple regression analysis was adopted in the study to clarify the influence of different factors, including rock properties, runoff, and earthquakes. Thus, it is concluded that runoff was the most important factor in determining the sediment supply; rock properties were the secondary factor. Although the influence of earthquakes was smaller than runoff and rock properties, it can still induce a certain period of fluctuation in sediment discharge.
Supplementary Materials
The following are available online at https://www.mdpi.com/2073-4441/10/12/1836/s1, Figure S1: Time series of unit sediment concentrations in the twelve rivers.
Funding
This research received no external funding.
Acknowledgments
This work was supported by the Ministry of Science and Technology, Taiwan, and in part by the Headquarters of University Advancement at the National Cheng Kung University. I thank the officers and crews of Water Resources Agency and Ministry of Economic Affairs, for supplying the hydrometric data.
Conflicts of Interest
The authors declare no conflict of interest.
References
- Sella, G.F.; Dixon, T.H.; Mao, A. REVEL: A model for recent plate velocities from space geodesy. J. Geophys. Res. 2002, 107, 2081. [Google Scholar] [CrossRef]
- Wu, Y.H.; Chen, C.C.; Turcotte, D.L.; Rundle, J.B. Quantifying the seismicity on Taiwan. Geophys. J. Int. 2013, 194, 465–469. [Google Scholar] [CrossRef] [Green Version]
- Li, Y.H. Denudation of Taiwan Island since the Pliocene epoch. Geology 1976, 4, 105–107. [Google Scholar] [CrossRef]
- Hwang, C.E. Suspended sediment of Taiwan Rivers and their geomorphological significance. Bull. Nation Taiwan Normal Univ. 1982, 27, 649–677. [Google Scholar]
- Dadson, S.J.; Hovius, N.; Chen, H.; Dade, W.B.; Hsieh, M.L.; Willett, S.D.; Hu, J.C.; Horng, M.J.; Chen, M.C.; Stark, C.P.; et al. Links between erosion, runoff variability and seismicity in the Taiwan orogeny. Nature 2003, 426, 648–651. [Google Scholar] [CrossRef] [PubMed]
- Dadson, S.J.; Hovius, N.; Chen, H.; Dade, W.B.; Lin, J.C.; Hsu, M.L.; Lin, C.W.; Horng, M.J.; Chen, C.T.; Milliman, J.; et al. Earthquake-triggered increase in sediment delivery from an active mountain belt. Geology 2004, 32, 733–736. [Google Scholar] [CrossRef]
- Lin, G.W.; Chen, H.; Chen, Y.H.; Horng, M.J. Influence of typhoons and earthquakes on rainfall-induced landslides and suspended sediments discharge. Eng. Geol. 2008, 97, 32–41. [Google Scholar] [CrossRef]
- Chuang, S.C.; Chen, H.; Lin, G.W.; Lin, C.W.; Chang, C.P. Increase in basin sediment yield from landslides in storms following major seismic disturbance. Eng. Geol. 2009, 103, 59–65. [Google Scholar] [CrossRef]
- Keefer, D.K. Landslides caused by earthquakes. Geol. Soc. Am. Bull. 1984, 95, 406–421. [Google Scholar] [CrossRef]
- Khazai, B.; Sitar, N. Assessment of seismic slope stability using GIS modeling. Geogr. Inf. Sci. 2000, 6, 121–128. [Google Scholar] [CrossRef]
- Koi, T.; Hotta, N.; Ishigaki, I.; Matuzai, N.; Uchiyama, Y.; Suzuki, M. Prolonged impact of earthquake-induced landslides on sediment yield in a mountain watershed: The Tanzawa region, Japan. Geomorphology 2008, 101, 692–702. [Google Scholar] [CrossRef]
- Hovius, N.; Meunier, P.; Lin, C.W.; Chen, H.; Chen, Y.G.; Dadson, S.; Horng, M.J.; Lines, M. Prolonged seismically induced erosion and the mass balance of a large earthquake. Earth Planet. Sci. Lett. 2011, 304, 347–355. [Google Scholar] [CrossRef]
- Water Resources Agency (WRA). Hydrological Yearbook of Taiwan; Water Resources Agency, Ministry of Economic Affairs: Taichung, Taiwan, 1970–2015. (In Chinese) [Google Scholar]
- Cohn, T.A. Recent advances in statistical methods for the estimation of sediment and nutrient transport in rivers. Rev. Geophys. 1995, 33, 1117–1123. [Google Scholar] [CrossRef]
- Kao, S.J.; Chan, S.C.; Kuo, C.H.; Liu, K.K. Transport-dominated sediment loading in Taiwanese rivers: A case study from the Ma-an stream. J. Geol. 2005, 113, 217–225. [Google Scholar] [CrossRef]
- Hovius, N.; Stark, C.P.; Chu, H.T.; Lin, J.C. Supply and removal of sediment in a landslide-dominated mountain belt: Central Range, Taiwan. J. Geol. 2000, 108, 73–89. [Google Scholar] [CrossRef] [PubMed]
- Juez, C.; Hassan, M.A.; Franca, M.J. The origin of fine sediment determines the observations of suspended sediment fluxes under unsteady flow conditions. Water Resour. Res. 2018, 54, 5654–5669. [Google Scholar] [CrossRef]
- International Society for Rock Mechanics (ISRM). Rock Characterization Testing & Monitoring: ISRM Suggested Methods; Pergamon Press: Oxford, NY, USA, 1981; pp. 1–121. ISBN 0080273092. [Google Scholar]
- Seed, H.B.; Idriss, I.M. Ground Motions and Soil Liquefaction During Earthquakes; Earthquake Engineering Research Institute: Oakland, CA, USA, 1982; ISBN 9780943198248. [Google Scholar]
- Draper, N.R.; Smith, H. Applied Regression Analysis, 2nd ed.; Wiley: Hoboken, NJ, USA, 1981; ISBN 9780471029953. [Google Scholar]
Figure 1.
Distribution of river catchments and hydrometric stations. The star symbols represent the epicenters of the 1999 Chi-Chi earthquake and 2003 Chengkung earthquake.
Figure 1.
Distribution of river catchments and hydrometric stations. The star symbols represent the epicenters of the 1999 Chi-Chi earthquake and 2003 Chengkung earthquake.

Figure 2.
(a) The Cs–Q relationships before and after the 1999 Chi-Chi earthquake in the Chenyoulan River. (b) Variation of suspended sediment discharges in the Chenyoulan River. The thick black line represents the lower boundary of suspended sediment discharges.
Figure 2.
(a) The Cs–Q relationships before and after the 1999 Chi-Chi earthquake in the Chenyoulan River. (b) Variation of suspended sediment discharges in the Chenyoulan River. The thick black line represents the lower boundary of suspended sediment discharges.

Figure 3.
(a) The Cs–Q relationships before and after the 1999 Chi-Chi earthquake in the Tachia River. (b) The ratios of unit sediment concentrations after and before the 1999 Chi-Chi earthquake in the Tachia River.
Figure 3.
(a) The Cs–Q relationships before and after the 1999 Chi-Chi earthquake in the Tachia River. (b) The ratios of unit sediment concentrations after and before the 1999 Chi-Chi earthquake in the Tachia River.

Figure 4.
The Cs–Q relationships before and after the 1999 Chi-Chi earthquake in the Peinan River.

Figure 5.
Distribution of seismic frequencies, and relationships between seismic frequencies and the averagely annual SSD under different influence distances: (a) 10 km, (b) 50 km, and (c) 100 km. (d) Variation of determination coefficients at different influence distances.
Figure 5.
Distribution of seismic frequencies, and relationships between seismic frequencies and the averagely annual SSD under different influence distances: (a) 10 km, (b) 50 km, and (c) 100 km. (d) Variation of determination coefficients at different influence distances.

Figure 6.
Time series of unit sediment concentrations in (a) Touchien River, (b) Choshui River, and (c) Peinan River.
Figure 6.
Time series of unit sediment concentrations in (a) Touchien River, (b) Choshui River, and (c) Peinan River.

Figure 7.
Variations of the ratio, ∆κ, of unit concentration in (a) Touchien River, (b) Chenyoulan River, and (c) Peinan River.
Figure 7.
Variations of the ratio, ∆κ, of unit concentration in (a) Touchien River, (b) Chenyoulan River, and (c) Peinan River.

Figure 8.
Relationship between peak ground accelerations and recovery periods.

Figure 9.
Comparison of predicted and measured yearly suspended sediment discharges.


Table 1.
Efficiency of each influence factor for sediment supply.
| Influence Factor | R2 * | Efficiency (%) |
|---|---|---|
| average annual runoff (Q, km3/year) | 0.276 | 56.2 |
| average uniaxial compressive strength (UCS, MPa) | 0.815 | 18.5 |
| average joint density (Jv, m−3) | 0.966 | 3.4 |
| seismic frequency (Eq, year−1) | 0.943 | 5.7 |
| others | 0.838 | 16.2 |
* The value of R2 was obtained in the absence of one of the influence factors. Furthermore, the efficiency of the influence factor could be calculated as the difference between the R2 before and after the influence factor was pulled out.
© 2018 by the author. Licensee MDPI, Basel, Switzerland. This article is an open access article distributed under the terms and conditions of the Creative Commons Attribution (CC BY) license (http://creativecommons.org/licenses/by/4.0/).
Share and Cite
MDPI and ACS Style
Lin, G.-W. Variations of Fluvial Sediment Transport after Large Earthquakes: Field Study in Taiwan Catchments. Water 2018, 10, 1836. https://doi.org/10.3390/w10121836
AMA Style
Lin G-W. Variations of Fluvial Sediment Transport after Large Earthquakes: Field Study in Taiwan Catchments. Water. 2018; 10(12):1836. https://doi.org/10.3390/w10121836
Chicago/Turabian StyleLin, Guan-Wei. 2018. "Variations of Fluvial Sediment Transport after Large Earthquakes: Field Study in Taiwan Catchments" Water 10, no. 12: 1836. https://doi.org/10.3390/w10121836
Note that from the first issue of 2016, this journal uses article numbers instead of page numbers. See further details here.