Article

Potential of Biochar Filters for Onsite Wastewater Treatment: Effects of Biochar Type, Physical Properties and Operating Conditions

by
Luis Fernando Perez-Mercado
,
Cecilia Lalander
,
Christina Berger
and
Sahar S. Dalahmeh
*
Department of Energy and Technology, Swedish University of Agricultural Sciences (SLU), Box 7032, SE 750 07 Uppsala, Sweden
*
Author to whom correspondence should be addressed.
Water 2018, 10(12), 1835; https://doi.org/10.3390/w10121835
Submission received: 20 November 2018 / Revised: 5 December 2018 / Accepted: 7 December 2018 / Published: 12 December 2018
(This article belongs to the Section Wastewater Treatment and Reuse)

Abstract

:
The potential of biochar as a filter medium for onsite wastewater treatment was investigated in five sub-studies. Sub-study 1 compared pollutant removal from wastewater using pine-spruce biochar, willow biochar and activated biochar (undefined biomass) filters. Sub-study 2 investigated the effects of particle size (0.7, 1.4 and 2.8 mm) on pollutant removal using pine-spruce biochar filters. In sub-studies 3 and 4, the effects of the hydraulic loading rate (HLR; 32–200 L m−2) and organic loading rates (OLR; 5–20 g biochemical oxygen demand (BOD5) m−2) on pollutant removal using pine-spruce biochar filters were investigated, while sub-study 5 compared pollutant removal in pine-spruce biochar filters and in sand. The removal of chemical oxygen demand (COD), total nitrogen (Tot-N), ammonium nitrogen (NH4-N), phosphates (PO4-P) and total phosphorus (Tot-P) was monitored in all sub-studies. All types of biochar and all particle sizes of pine-spruce biochar achieved a high degree of removal of organic material (COD > 90%). Removal of Tot-P and PO4-P was higher in willow biochar and activated biochar (>70%) than in pine-spruce biochar during the first two months, but then decreased to similar levels as in pine-spruce biochar. Among the particle sizes tested, 0.7 mm pine-spruce biochar showed the lowest amount of Tot-P removal, while 2.8 mm pine-spruce biochar showed the lowest level of NH4-N removal. Different OLRs and HLRs did not influence COD removal (94–95%). Pine-spruce biochar showed a better degree of removal of Tot-N than sand. In conclusion, biochar is a promising filter medium for onsite wastewater treatment as a replacement or complement to sand, achieving high and robust performance regardless of the parent material, particle size or loading conditions.

Graphical Abstract

1. Introduction

Diffuse pollution from onsite wastewater treatment systems (OWTS) is a major contributor to environmental pollution in both developed and developing countries. For example, around one million people in Sweden are not connected to a public sewerage system and are served by approximately 700,000 OWTS [1]. Up to half of these OWTS function inadequately, due to age and/or poor maintenance. Consequently, OWTS release up to 15% of the total phosphorus load to the Baltic Sea [2]. Moreover, around 70% of all waterborne disease outbreaks in Sweden have been traced to private drinking water wells near OWTS, with the most common cause of outbreaks being contamination with faecal bacteria from OWTS [3]. Similarly, countries in Latin America rely heavily on onsite wastewater treatment systems (e.g., Imhoff tanks, wetlands, stabilisation ponds) for the treatment of wastewater from small towns and villages [4]. However, a large number of these wastewater treatment plants often experience design, construction and operational difficulties, resulting in poor performance, which makes these plants a major source of environmental pollution [5].
A typical system for onsite wastewater treatment consists of a septic tank followed by a sand-filter trench or soil infiltration system [1]. Natural sand is a finite source and can be associated with clogging problems [6]. Moreover, production of crushed sand has a high energy demand for crushing and transporting the heavy product. Consequently, the main obstacles to using sand filters are a scarcity of well-graded sand in some regions and high transportation costs due to the high bulk density. Therefore, there is a great need for efficient, renewable, environmentally friendly and readily available materials to replace sand beds and increase the removal of wastewater pollutants.
Biochar is a carbon produced by thermal decomposition (pyrolysis) of organic materials at an elevated temperature (300–800 °C) in the absence of oxygen [7]. Besides biochar, pyrolysis of organic materials produces syngas, which is used as a renewable fuel for heat production [8]. Generally, biochar is characterised by having a large surface area (200–1000 m2/g), low density and high porosity [9], which makes it an efficient adsorbent and good biofilm carrier. Due to the unique properties of biochar, there is growing interest in using it as a filter medium to enhance water and wastewater quality in onsite systems. Part of this interest is the recognition that the utilisation of biochar for wastewater purification can increase treatment efficiency and reduce the spread of contamination from hazardous chemicals in treated flow streams, compared with conventional soil and sand infiltration systems, and can also mitigate climate change effects through carbon sequestration [10].
The physical, chemical and structural properties of biochar (stability, pore size, pH, cation exchange capacity (CEC), ash fraction, specific surface area and mineral content) can vary greatly depending on the type of organic material used and the biochar production conditions (temperature, heating rate and oxidation) [7,11]. Previous studies have demonstrated the efficiency of biochar as an adsorbent and biofilm carrier for removing organic matter, surfactants, phosphorus (P) and nitrogen (N) from onsite wastewater and greywater treatment systems [12,13,14,15]. However, the effects of a biochar parent material on pollutant removal and the pollutant removal performance of biochar under different loading and operating conditions are not examined in these studies.
The capacity of filters to remove pollutants differs between materials due to differences in characteristics such as porosity, specific surface area, reactivity, adsorption capacity and ability to promote biofilm development [16]. In addition, wastewater production in households varies on a daily, weekly and seasonal basis, which leads to variability in organic loading rates (OLR) and hydraulic loading rates (HLR) to the wastewater treatment systems. Under peak conditions, this can lead to a temporary breakdown of the infiltration system, a so-called episodic failure [17]. Thus, it is necessary for the infiltration bed to have the capacity to withstand variations in HLR and OLR and maintain resilient and steady treatment performance. Consequently, successful design requires knowledge about the capacity of the particular filter material to buffer high variations in water flow and organic loading.
The overall aim of this study was to evaluate the potential of vertical flow biochar filters for onsite wastewater treatment, compared with sand filters, in regards to the removal of organic matter, phosphorus and nitrogen. Specific objectives were to: Assess the physical, chemical and hydraulic properties of different types of biochar and their importance for adsorption and biodegradation of wastewater pollutants. Secondly, to assess the performance of vertical flow biochar filters in removing organic matter, phosphorus and nitrogen under different organic and hydraulic loading conditions. Thirdly, to describe the effects of biochar particle size on organic matter and phosphorus removal, nitrification and denitrification.

2. Materials and Methods

2.1. Experimental Set-Up

Pine-spruce biochar was obtained from Vindelkol AB (Umea, Sweden), willow biochar was obtained from a local farmer (anonymous), activated biochar was obtained from VWR (Stockholm, Sweden) and sand was obtained from Rimbojord (Sand & Grus AB Jehander; Stockholm, Sweden). Laboratory-scale biochar and sand column filters were packed in acrylic columns of 5 cm (diam.) × 55 cm (depth) (Figure 1) and operated under room temperature (20 ± 2 °C).
To address the different objectives of this study, five sub-studies were conducted: Sub-study 1 assessed the effects of physical, chemical and hydraulic properties of different types of biochar on the removal of pollutants from wastewater. Three types of biochar (non-activated willow biochar, non-activated pine-spruce biochar and activated biochar of undefined origin) were used in filters operated at a HLR of 34 L m−2 day−1 and an OLR of 15 g biochemical oxygen demand (BOD5) m−2 day−1 (Table 1). Sub-study 2 investigated the effects of biochar particle size on pollutant removal using non-activated pine-spruce biochar.
Three particle sizes (0.7, 1.4 and 2.8 mm) were investigated for pollutant removal at a HLR 34 L m−2 day−1 and an OLR 15 g BOD5 m−2 day−1 (Table 1). Sub-study 3 investigated the effects of the OLR on pollutant removal in biochar filters. Non-activated pine-spruce biochar (particle size of d10 = 1.4 mm) was operated at two OLRs, 5 and 20 g BOD5 m−2 day−1. To achieve these OLRs, the filters were fed at HLRs of 200 and 34 L m−2 day−1, respectively. Sub-study 4 investigated the effects of increasing the HLR from 37 to 200 L m−2 day−1 using a filter of non-activated pine-spruce biochar (d10 = 1.4 mm) while keeping the OLR constant (5 ± 2 g BOD5 m−2 day−1) (Table 1). Sub-study 5 compared the performance of non-activated pine-spruce biochar with that of sand (d10 = 1.4 mm in both cases) in filters operated at a HLR of 37 L m−2 day−1 and an OLR of 5 g m−2 day−1.
Three replicate biochar filters were used for each biochar type and each particle size used in sub-studies 1–4. Only two replicate sand filters were used in sub-study 5.
The filters in sub-studies 1–4 were fed with synthetic wastewater, which was prepared by mixing real wastewater, nutrient broth and different types of detergents according to Dalahmeh et al. [18]. The desired strength of the synthetic wastewater was achieved by adjusting the proportions of the detergents and nutrient broth to the amount of water. In sub-study 5, real municipal wastewater collected from the Kungsängen municipal sewage treatment plant (Uppsala, Sweden) was used to feed the filters. The wastewater was prepared weekly and stored at 2–4 °C. All filters were fed with their intended daily wastewater dose using single-pass downflow over a period of 20–26 weeks (Table 1). Prior to feeding, the refrigerated wastewater was homogenised using a magnetic stirrer and then the required dose was pumped from the refrigerated container to a distribution container, which was kept at 20 ± 3 °C. Thereafter, when the feed temperature had acclimatised, it was pumped from the distribution container to the filter using a peristaltic pump or a computer-based distribution system. Depending on the sub-study, the filters were fed with 25 mL of wastewater on three to 10 occasions per day, to give the relevant HLR. The dosing events were evenly distributed over 24 h.

2.2. Characterisation of Material

Prior to packing the columns, the following properties of the biochar and sand media were determined: Loss on ignition, effective size and uniformity coefficient, specific surface area, surface composition and particle density of the material. After packing the columns, the following filter properties were determined: Bulk density, total porosity and hydraulic residence time. Constant-head hydraulic conductivity was determined only for the sand and activated biochar filters.
Loss on ignition was determined by heating the dried material to 550 °C for 4 h. Bulk density was determined by dividing the dry weight of the filter medium by the volume occupied by the medium (i.e., 5 cm × 55 cm). The particle density of biochar and sand, i.e., the ratio of total mass of solid particles to their total volume, excluding pore space between particles, was determined by dividing 25 g of sample by its corresponding volume. The volume of particles, excluding pores, was determined using the liquid immersion method, where the volume of deionised water displaced by the particles was measured. After adding water, air-filled pores were eliminated by gentle boiling of the mixture. The submerged particles were left to saturate for 24 h. The porosity of biochar and sand was determined as:
p = 100 × ( 1 ρ B ρ P )
where p is porosity as a percentage of the total volume, ρB is the bulk density and ρP is the particle density. Constant-head hydraulic conductivity was determined according to Reference [19]. The specific surface area of biochar and sand was determined with the Brunauer-Emmett-Teller (BET) method, using a kaolinite sample with a defined area of 15,900 m2 kg−1 as standard [20]. The BET equation was used to calculate the specific surface area of biochar and sand based on measurements at 99,834 Pa and 20 °C, where 1 mL of N2 gas corresponded to 2.86 m2 [20]. The residence time of water in the filter was determined after 10 days from start-up by adding a 100 mL pulse of NaCl tracer solution (10 g L−1) to the filters and then monitoring the electrical conductivity (EC) of the effluent as a function of time [21]. The mean residence time in the filter was defined as the time when 50% of the total tracer had eluted.
Material composition, i.e., the internal structure, surface topography and surface chemistry of the non-activated pine-spruce biochar, activated biochar and sand was identified using elemental scanning electron microscopy (SEM). SEM micrographs and energy dispersive X-ray spectrographs (EDS) of the samples were obtained using a HITACHI TM-1000 scanning electron microscope, equipped with an Oxford Instruments EDX detector (Belfast, UK). To obtain reliable statistics in the elemental analysis, the value used for each point was the average of three individual measurements. The scanned surface was mapped by moving over the sample with steps of 10 μm.

2.3. Chemical Analysis

Grab samples of influent and effluent were collected once a week throughout the experiments. The following chemical parameters were determined with a frequency of once or twice per week: Chemical oxygen demand (COD), biochemical oxygen demand (BOD7), total nitrogen (Tot-N), ammonium nitrogen (NH4-N), nitrate nitrogen (NO3-N), total phosphorus (Tot-P), phosphate (PO4-P), electrical conductivity (EC) and pH. These parameters were determined using chemical kits and the prescribed methods (Table 2), which are in accordance with the standard APHA methods (APHA, 2007). The analytical quality was ensured by using control and standard solutions with known concentrations of the substance for every measurement series (Table 2).

2.4. Statistical Analysis

An analysis of variance (ANOVA) at a 95% confidence level was used to assess differences in wastewater removal between: Different types of media, different particle sizes, different OLR values and different HLR values. When a statistically significant difference was found, a Tukey multiple comparison of means at 95% confidence level was carried out. All statistical analyses were performed using Statistica ver. 12 (Statsoft Inc., Tulsa, OK, USA).

3. Results and Discussion

3.1. Physical and Chemical Properties of Biochar and Sand

The specific surface area of the pine-spruce biochar varied from 170 to 200 m2 g−1 but was considerably higher (1000 m2 g−1) in the activated biochar. It was significantly lower for the sand (0.152 m2 g−1). Specific surface area is an important parameter when evaluating the suitability of a material for use in wastewater filters, as a large area indicates high potential for the development of a widespread biofilm [22]. Within the biofilm, biological degradation, mineralisation of organic matter, nitrification and denitrification take place.
Moreover, the larger the specific area, the higher the capacity for adsorption and the precipitation of various organic and inorganic pollutants.
The SEM revealed longitudinal hollow tubes with high porosity, resembling the original wood structure in the non-activated pine-spruce biochar (Figure 2), as also reported previously [23]. The SEM of the activated biochar revealed random pore structure on the surface of the material and pores that appeared to be distributed all over the surface. The SEM images of the sand particles revealed a solid structure with limited occurrence of micropores and the fewest micropores of the three types of material studied. In line with these findings, all biochar (activated and non-activated) materials showed similar porosity (60–74%), which far exceeded that of the sand (35%). This means that a filter made of biochar would have better capacity to hold water in macropores than a sand filter and also better capacity to harbour biofilm in the pores without clogging or restricting aeration, which are both crucial aspects of wastewater treatment. The non-activated biochar can thus be expected to provide more suitable surface conditions for bacterial attachment and biofilm development than the other materials, which should lead to an efficient biological degradation of organic matter and nitrification. It is possible that the richness of micropores and nanopores on the surface of the activated biochar could induce clogging due to faster biofilm accumulation, including trapping of organic material during the infiltration process, compared with the non-activated biochar with its larger pores [24].
The biochar (activated and non-activated) filters also had substantially smaller particle density and bulk density than sand filters of the same particle size (d10 = 1.4 mm) (Table 3), making transportation and handling easier for biochar than for sand.
The EDS images of the non-activated pine-spruce biochar revealed a relatively low mineral content (sodium (Na), magnesium (Mg), aluminium (Al), silicon (Si), chlorine (Cl), potassium (K), phosphorus (P), calcium (Ca), titanium (Ti) and iron (Fe) on the particle surfaces (Figure 2), with Ca being present in the highest proportions (13% w/w). Aluminium was present in proportions of 11–39% in all samples, but this was probably due to contamination from the aluminium foil used to wrap the biochar in the laboratory, and not from the biochar itself. No Fe or Mg was detected on the surface of the pine-spruce biochar, whereas the surface of the activated biochar contained substantial proportions of Fe (41%) and Ca (30%). The surface of the sand particles contained more Ca and Fe (15% and 21%, respectively) than the surface of the non-activated pine-spruce biochar, but less than the surface of activated biochar. According to the supplier of the sand used in the studies, it had been mixed with 5% lime. The presence of Ca, Fe, Al and Mg, which have an affinity for soluble reactive P, is an important feature of a filter medium, as adsorbed PO43− will precipitate to form surface complexes and hence be immobilised [25]. Based on the elemental composition, activated biochar and sand can be predicted to have the highest potential for P adsorption from wastewater.
The activated biochar filters had the longest mean hydraulic residence time among the different biochar types with the same effective size (d10 = 1.4 mm) (activated biochar 4.9 days, willow biochar 4.5 days, pine-spruce biochar 3.5 days), owing to the biochar activation process creating nano, micro and macro-pores (Figure 3 and Figure 4). This also appeared to be the case for pine-spruce biochar filters, with effective size other than 1.4 mm, which had a mean hydraulic residence time of about 3.5 days for d10 = 0.7 mm and about 2.9 days for d10 = 2.8 mm (Figure 4). The hydraulic residence time in all biochar filters proved to be much longer than in the sand filter, which had a residence time of only 0.5 h (Figure 3C). The longer retention time in the biochar can be attributed to its high water-holding capacity and high porosity. A long hydraulic residence time extends the duration of contact between wastewater and biofilm, which in turn increases the probability of organic matter degradation or nitrification.
Since macropores contribute little to the total surface area of a filter medium [26], it can be argued that filter matrices with both higher surface area and porosity should have a higher proportion of micropores than materials with less surface area and porosity. Thus, of the materials tested in the present study, activated biochar should have a higher proportion of micropores than non-activated biochar (willow and pine-spruce), and both should have a higher proportion of micropores than sand. This was supported by the observed differences in hydraulic retention time between the materials (activated biochar > non-activated biochar > sand). Water movement in unsaturated flow takes place mainly in the smallest pores [27], reducing the water velocity and increasing the retention time. Higher specific surface and retention time increase the contact opportunities between contaminants and biofilm/adsorption sites [27], leading to better pollutant removal performance than in other materials with less specific surface and porosity.

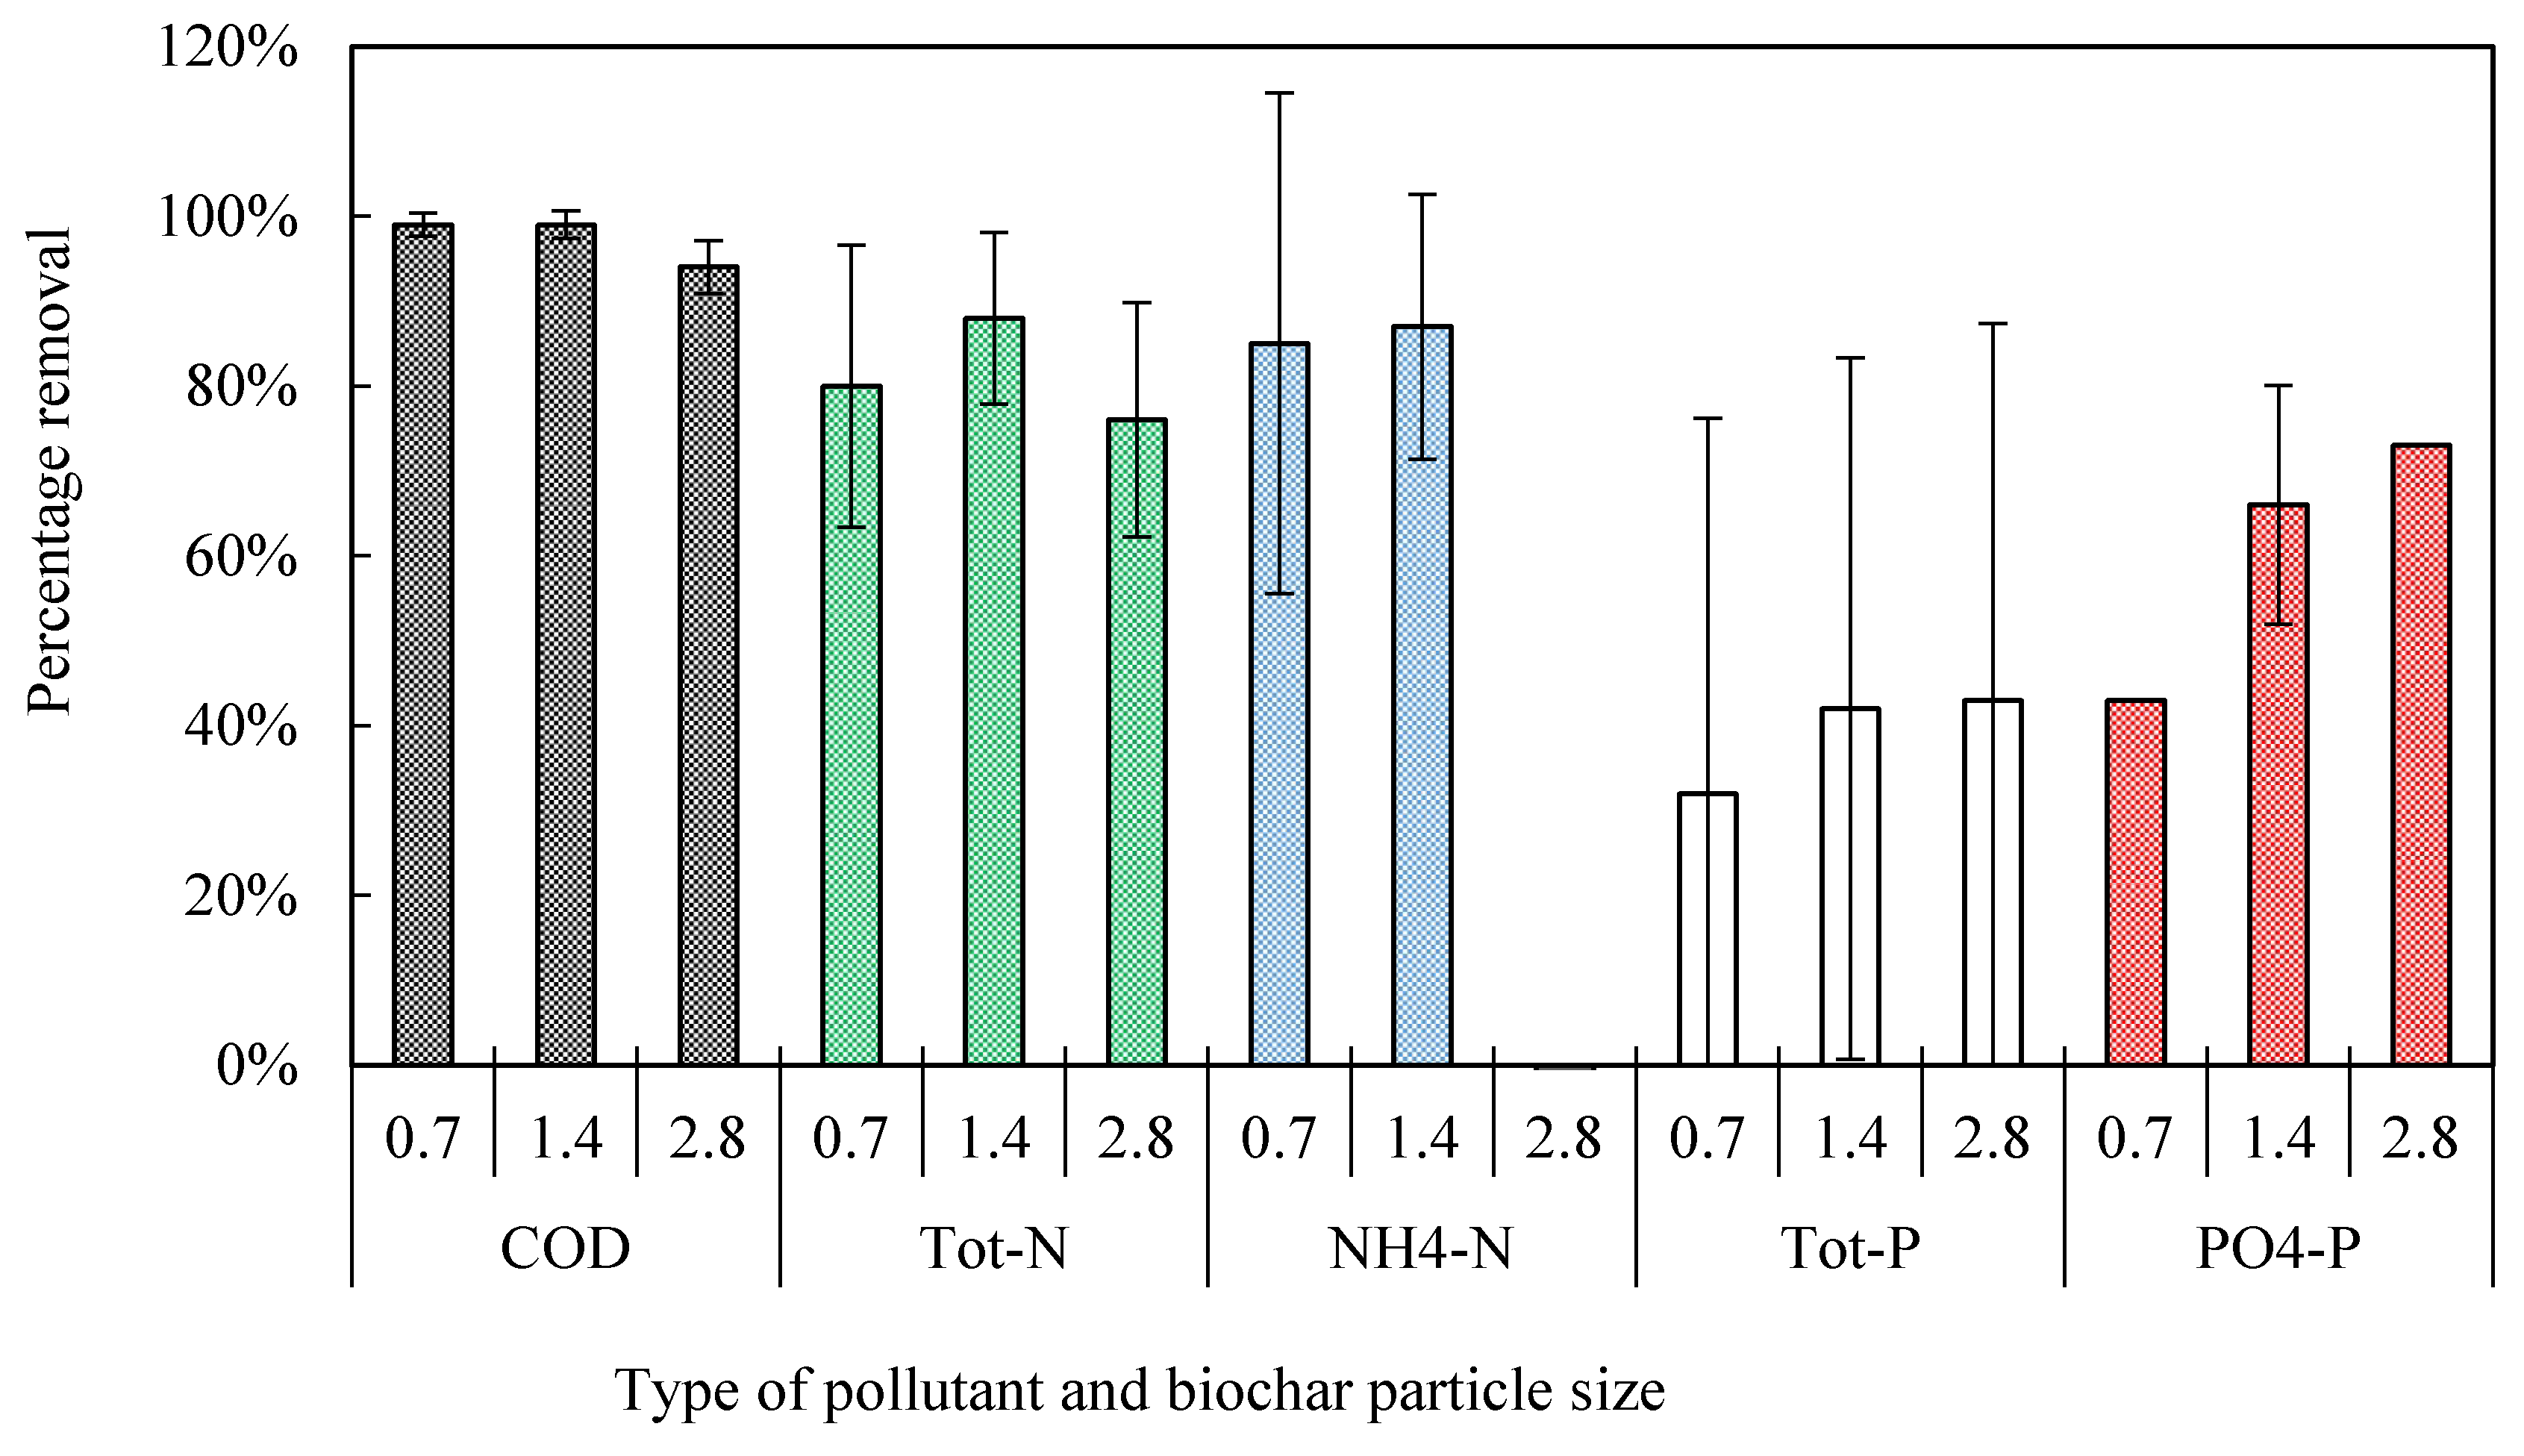
3.2. Treatment Performance

3.2.1. Influent Characteristics

Pollutant concentrations in the real or artificial wastewater used as influent varied from intermediate (approximately 330 mg COD L−1; 20 mg Tot-N L−1 and 4 mg Tot-P L−1) to high (approximately 1230 mg COD L−1; 78–95 mg Tot-N L−1 and 4 mg Tot-P L−1) (Table 4). The differences in the quality of the influent reflected differences in organic matter concentration between greywater (wastewater from kitchen, shower and laundry activities) and mixed household wastewater (wastewater from toilet, kitchen, shower and laundry) [10]. They could also reflect differences in wastewater produced in water-rich regions (e.g., Sweden) and water-scarce regions (e.g., Jordan) [28,29]. However, wastewater characteristics vary with factors such as water usage, household activities and the number of person equivalents connected to the system [17]. Rural areas with OWTS tend to yield more concentrated wastewater than municipal areas with large-scale wastewater treatment plants, particularly in water-scarce regions [28].

3.2.2. Organic Matter Removal
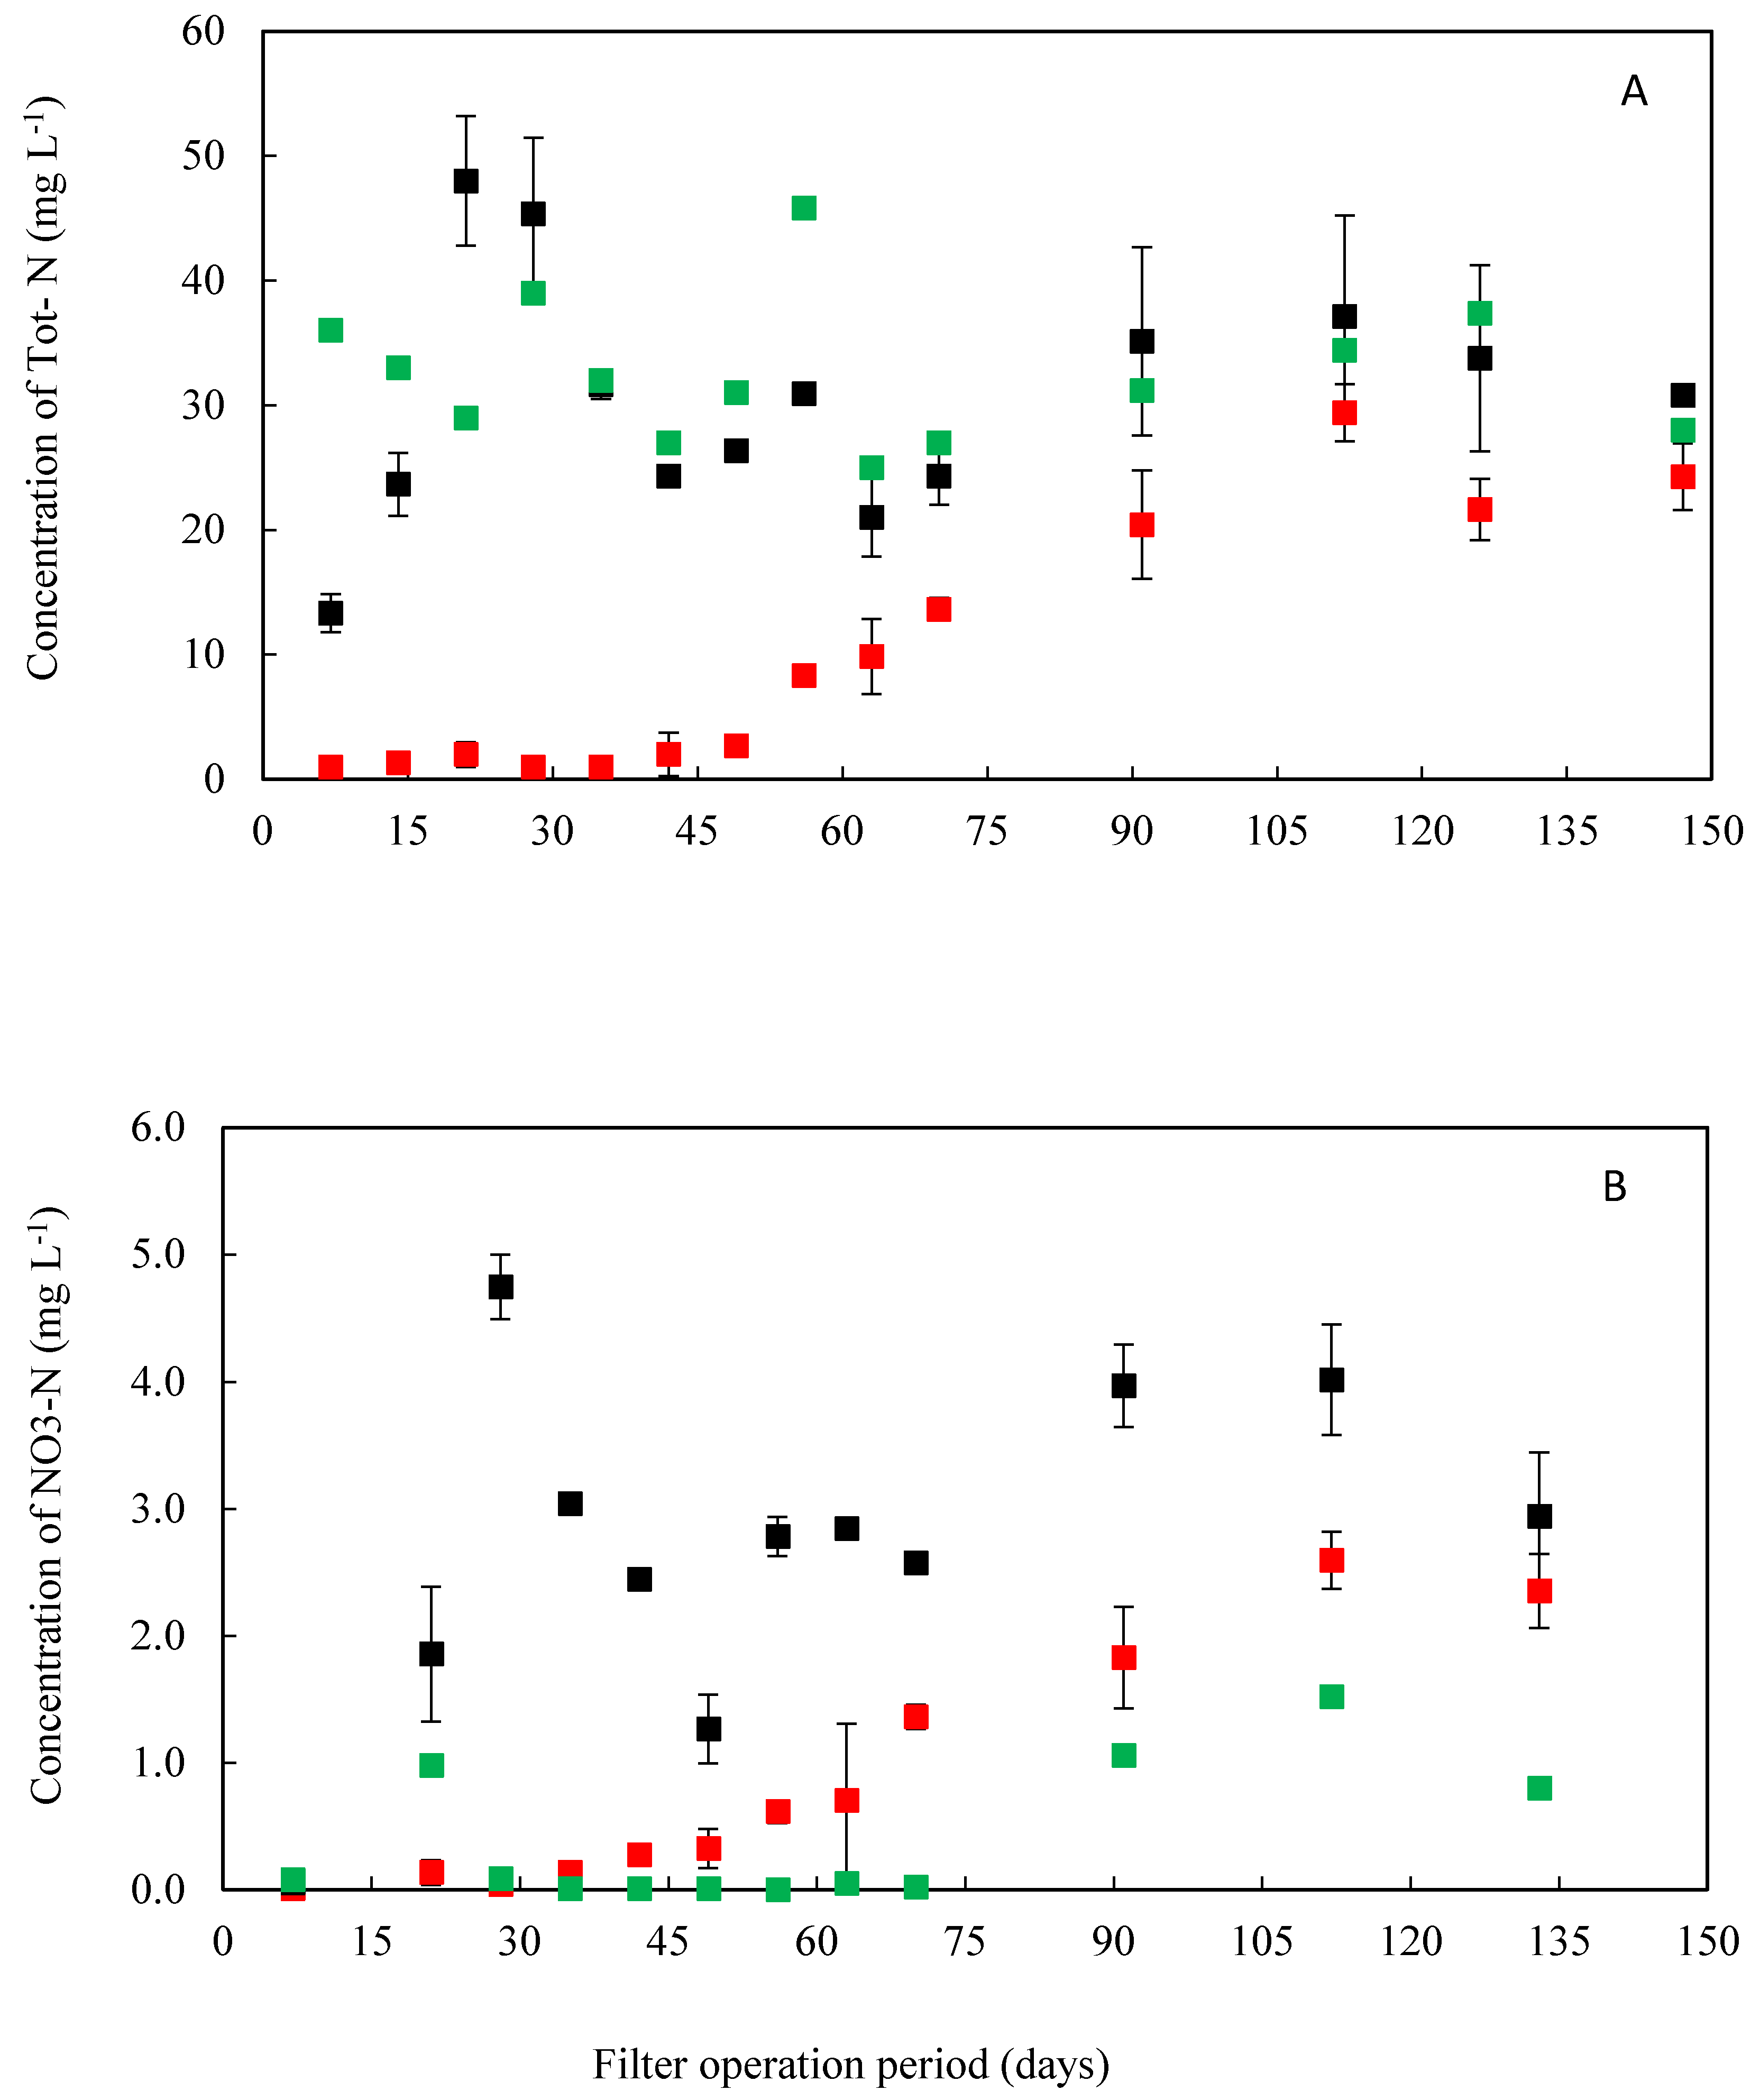
Comparisons of non-activated pine-spruce biochar, willow biochar and activated biochar showed that they all efficiently removed organic matter in terms of COD, with no significant differences between the biochar types (Figure 5). All biochars tested had a similar surface area, porosity and hydraulic residence time (Table 3), which resulted in similarly high performance in terms of organic matter removal.
Efficient removal of organic matter (94–99% of COD) was also demonstrated for all particle sizes tested (0.7, 1.4 and 2.8 mm) when operated for 6 months at a HLR of 34 L m−2 day−1 and an OLR of 20 ± 5 g BOD5 m−2 day−1 (Figure 6). However, there was a statistically significant difference between the 2.8 mm filter and the smaller sizes (0.7 and 1.4 mm) in terms of COD removal, with the coarser filter material displaying the lowest efficiency (94% with d10 = 2.8 mm, compared with 99% for d10 = 1.4 mm and 0.7 mm). A larger particle size allows for larger macropores between the particles, which increases the risk of wastewater breakthrough and rapid passage through the filter, giving less contact time between the filter medium and organic matter in the wastewater and thus less efficient treatment of wastewater. A finding supporting the occurrence of this process was that the hydraulic residence time of the 2.8 mm filters was shorter (66 h) than that of the 0.7 and 1.4 mm filters (85 and 87 h, respectively). Another indication of insufficient contact time due to rapid water passage was poor NH4-N nitrification, resulting in higher NH4-N concentrations in the effluent of the 2.8 mm biochar filters than the 0.7 and 1.4 mm filters (Figure 6). Although the difference in organic matter removal was statistically significant, the level achieved with the 2.8 mm filters (94%) was still high. The hydraulic retention time in the 2.8 mm filters was considered long enough to efficiently remove organic matter. Organic matter degradation by biofilm activity is the dominant removal process in sand and any other biofilter [30] and the rate in the present study seemed to be limited by the surface area of the filter material. The organic matter reduction achieved in the sand filters in this study (90–97%) was comparable to the >90% reported previously for sand filters with 0.21 mm effective particle size, as reported by Pell and Nyberg [30].
Removal of COD in the non-activated pine-spruce biochar was similar for OLRs of 5 ± 2 and 20 ± 5 g BOD5 m−2 day−1 (95 and 99%, respectively), with an effluent concentration of about 10 ± 3 mg COD L−1 in both cases (Figure 7). Despite the small difference in percentage removal of COD, the rate of removal at an OLR of 20 ± 5 g BOD5 m−2 day−1 was significantly higher. A possible explanation for this is that the higher organic load provided more substrate to the biofilm developing on the surface of the biochar. When the flux of organic matter to biofilm increases, the biological activity of the microorganisms is stimulated [31], and thereby also the mineralisation rate of organic matter [32]. It should also be noted that the biochar filters had a high capacity to buffer variations in loading conditions, as shown by their ability to maintain high COD removal rates with average fluctuations of 25% in the organic load. The performance of the biochar filters was also similar under the two HLRs tested (34 and 200 L m−2 d−1), with no significant effects or trends in percentage removal of COD.

3.2.3. Nitrogen

The different types of biochar filter did not show statistically significant differences in terms of nitrogen removal (as NH4-N) under the same conditions: i.e., HLR 32 ± 7 L m−2 day−1, OLR 20 ± 5 g BOD5 m−2 day−1 and particle size 1.4 mm (Figure 8A). The removal of Tot-N in pine-spruce biochar filters under a HLR of 32 ± 7 L m−2 day−1 and an OLR of 20 ± 5 g BOD5 m−2 day−1 was initially high (<90) and declined gradually over time, reaching a steady state rate of about 50% after 60 days, where it remained during the remaining 90 days of the trial (Figure 8A). The initial high removal was due to adsorption of NH4-N on the surface of the biochar. As the nitrifying bacteria developed with time, the nitrification of NH4-N increased and thus the removal of nitrogen declined (Figure 8B). Removal of Tot-N in the different biochar filters (50–52%) was 12-fold higher than in the sand filters (<5%), despite all filter types being operated under similar loading rates (32–34 L m−2 day−1). In the biochar filters, the removal of Tot-N was achieved through biological assimilation of NH4-N in the biofilm and the combined nitrification and denitrification.
The large surface area of the activated and non-activated biochar (Table 3) most likely enhanced adsorption of NH4-N from the wastewater. The biofilm that developed on the large biochar surface could also have assimilated nitrogen when growing, which would further enhance the removal of Tot-N. Given the high porosity and richness of micropores and nanopores in biochar (Figure 3), some zones are likely to be anaerobic as these small pores are saturated by water and covered by the biofilm layer. The presence of anaerobic zones triggers denitrifying bacterial activity, resulting in enhanced nitrogen removal in biochar. In contrast, sand filters have low micro and nano-porosity and have a small specific surface, which does not favour particle adsorption. Moreover, as seen from the SEM images, the surface of sand particles is solid, with few of the micropores or nanopores required for formation of the anaerobic microzones responsible for nitrogen removal by denitrification.
There was no significant difference in Tot-N removal in filters of different effective sizes (0.7, 1.4 and 2.8 mm) (Figure 6). Likewise, NH4-N removal with the 0.7 and 1.4 mm materials did not differ significantly, while 2.8 mm filters did not remove NH4-N efficiently. In this case too, it is likely that the higher proportion of macropores in filters with larger particle size (2.8 mm) compared with the other filters (0.7 and 1.4 mm) played a role. Macropores favour rapid passage of wastewater, which reduces contact opportunities of NH4-N with anoxic sites in micropores, where conditions are favourable for denitrification as suggested by Gill and O’Luanaigh [33].
Biochar filters with the same effective size (1.4 mm) showed a tendency for increased removal of Tot-N at higher OLRs (20 ± 5 g BOD5 m−2 day−1) compared with lower OLRs (5 ± 2 g BOD m−2 day−1). However, the high variation in Tot-N removal at the lower rate made it difficult to identify statistically significant trends. In contrast, no significant effects or trends in percentage removal of Tot-N could be detected by increasing the HLR fourfold (from 50 to 200 L m−2 day−1) at the same OLR (5 ± 2 g BOD5 m−2 day−1). Increasing the amounts of influent organic matter probably caused development of thicker and more homogeneously distributed biofilm, which could explain both the higher and more consistent Tot-N removal rates at the higher OLR.

3.2.4. Phosphorus

Phosphate (PO4-P) and Tot-P were efficiently removed in the non-activated willow biochar (89 ± 7% for PO4-P and 86 ± 9% for Tot-P) and activated biochar (86 ± 4% for PO4-P and 93 ± 3% for Tot-P) during the initial two months of sub-study 1. In contrast, the removal of Tot-P and PO4-P in the pine-spruce non-activated biochar was less efficient (producing a range of 32–60%) (Figure 5). The Tot-P and PO4-P removal rates in the sand filters reached intermediate values (75–83%), i.e., they were higher than in pine-spruce biochar, but lower than the activated and non-activated willow biochar. There was no statistically significant difference between the 0.7, 1.4 and 2.8 mm biochar filters in terms of Tot-P and PO4-P removal (40–60%). Likewise, the HLR and OLR had no significant effects on removal of PO4-P in the pine-spruce biochar filters (Figure 6).
Differences in the mineral composition of the filter materials could have affected the removal of Tot-P and PO4-P. As mentioned above, the characteristics of the filter material (specific surface and the mineral content on the surface of the particles) play a significant role in removal of PO4-P from wastewater by adsorption and precipitation [30]. It has been demonstrated that the capacity of sand filters to bind phosphorus depends on the pH and the Ca, Fe and Al concentrations in the sand [34]. For the biochar filters, the elemental SEM images suggest that the surface of the pine-spruce biochar was poor in terms of mineral and metal content (Fe, Ca and Mg) (Figure 4). Thus removal of PO4-P was not as efficient in that material as in the activated biochar and sand filters, both of which have a richer mineral content on their surfaces.

4. Conclusions

The physical and hydraulic properties (bulk density, porosity, surface area, hydraulic residence time) of the different types of biochar filters tested in this study suggest that they should have higher capacity for treating wastewater, both per unit volume and per unit weight, than in the commonly used sand filters. Due to their large surface area and porosity, the biochar materials achieved pollutant removal by adsorption from the start of operation and also provided substrate for the development of an active biofilm to a larger extent than the control sand filter.
Biochar filters proved to be efficient and robust in removal of organic matter from wastewater under both stable and variable loading regimes, including high and low hydraulic and organic loading rates. Different types of biochar (activated and non-activated) were equally efficient in the removal of organic matter. Moreover, biochar filters with effective particle sizes (d10) varying from 0.7 to >5 mm all achieved removal rates of organic matter of >90%. In biochar filters, organic matter removal is achieved immediately when the filter is taken into operation, while sand filters are less efficient in the initial phase.
Despite the biochar filters not being designed for enhanced denitrification, they achieved an intermediate to high (50–88%) level of removal of nitrogen, depending on the type of biochar and the loading rate. The biochar filters removed 12-fold more nitrogen than sand filters operated under the same conditions. A biochar particle size of 1.4 mm seemed to provide the highest removal rate under a hydraulic loading rate of 37 L m−2 day−1.
Non-activated willow biochar and activated biochar removed >86% of PO4-P, while pine-spruce biochar removed only 62% and sand removed only 75–83%. Most biochar filters and the sand filter showed a declining level of the removal of phosphorus over time.
In summary, willow and pine-spruce biochar could be considered suitable materials to replace or complement sand filters in onsite wastewater treatment systems, as they can efficiently remove organic matter and ammonium from wastewater. However, the long-term performance of these materials needs further investigation.

Author Contributions

L.F.P.-M. and C.B. collected the data; S.S.D. carried out the data analysis and wrote the manuscript; C.L. and L.F.P.-M. revised it.

Funding

This research was funded by the Swedish Research Council Formas, Swedish Agency for Marine and Water Management (Havs-och vattenmyndighet), Swedish International Development Cooperation Agency (SIDA) and Foundation Olle Engkvist Byggmästare.

Acknowledgments

We gratefully acknowledge Sven Smårs for his technical help and Gulaim Seisenbaeva for help in the scanning electron microscopy imaging. We thank Björn VInnerås, Mikael Pell for their valuable feedback. We thank Morgan Macaud, Amandine Diot and Maxime Leong Hoi for their help in running the experiments.

Conflicts of Interest

The authors declare no conflict of interest.

References

  1. SMED. Teknikenkät—Enskilda avlopp 2009; Ek, M., Junestedt, C., Larsson, C., Olshammar, M., Ericsson, M., Eds.; SMED: Norrköping, Sweden, 2011; p. 49. [Google Scholar]
  2. Hav- och vattenmyndigheten. Näringsbelastningen på Östersjön och Västerhavet 2014. In Sveriges underlag till Helcoms sjätte Pollution Load Compilation; Hav- och vattenmyndigheten: Göteborg, Sweden, 2016; p. 110. [Google Scholar]
  3. Lindberg, R.H.; Wennberg, P.; Johansson, M.I.; Tysklind, M.; Andersson, B.A. Screening of Human Antibiotic Substances and Determination of Weekly Mass Flows in Five Sewage Treatment Plants in Sweden. Environ. Sci. Technol. 2005, 10, 3421–3429. [Google Scholar] [CrossRef]
  4. Noyola, A.; Padilla-Rivera, A.; Morgan-Sagastume, J.M.; Güereca, L.P.; Hernández-Padilla, F. Typology of Municipal Wastewater Treatment Technologies in Latin America. Clean Soil Air Water 2012, 9, 926–932. [Google Scholar] [CrossRef]
  5. Cossio, C.; McConville, J.; Rauch, S.; Wilén, B.M.; Dalahmeh, S.; Mercado, A.; Romero, A.M. Wastewater management in small towns—Understanding the failure of small treatment plants in Bolivia. Environ. Technol. 2018, 39, 1393–1403. [Google Scholar] [CrossRef] [PubMed]
  6. Spychała, M.; Błazejewski, R. Sand filter clogging by septic tank effluent. Water Sci. Technol. 2003, 48, 153–159. [Google Scholar] [CrossRef] [PubMed]
  7. Steiner, C. Considerations in Biochar Characterization. In Agricultural and Environmental Applications of Biochar: Advances and Barriers; Guo, M., He, Z., Uchimiya, S.M., Eds.; Soil Science Society of America, Inc.: Madison, WI, USA, 2016. [Google Scholar]
  8. Ye, S.; Zeng, G.; Wu, H.; Zhang, C.; Dai, J.; Liang, J.; Yu, J.; Ren, X.; Yi, H.; Cheng, M.; et al. Biological technologies for the remediation of co-contaminated soil. Crit. Rev. Biotechnol. 2017, 8, 1062–1076. [Google Scholar] [CrossRef] [PubMed]
  9. Downie, A.; Krosky, A.; Munroe, P. Physical Properties of Biochar. In Biochar for Environmental Management Science and Technology; Lehmann, J., Joseph, S., Eds.; Earthscan: London, UK, 2009. [Google Scholar]
  10. Dalahmeh, S.S.; Lalander, C.; Pell, M.; Vinnerås, B.; Jönsson, H. Quality of greywater treated in biochar filter and risk assessment of gastroenteritis due to household exposure during maintenance and irrigation. J. Appl. Microbiol. 2016, 5, 1427–1443. [Google Scholar] [CrossRef]
  11. He, Z.; Uchimiya, S.M.; Guo, M. (Eds.) Production and Characterization of Biochar from Agricultural By-Products: Overview and Use of Cotton Biomass Residues. In Agricultural and Environmental Applications of Biochar: Advances and Barriers; Soil Science Society of America, Inc.: Madison, WI, USA, 2016. [Google Scholar]
  12. Niwagaba, C.B.; Dinno, P.; Wamala, I.; Dalahmeh, S.S.; Lalander, C.; Jönsson, H. Experiences on the implementation of a pilot grey water treatment and reuse based system at a household in the slum of Kyebando-Kisalosalo, Kampala. J. Water Reuse Desalin. 2014, 4, 294–307. [Google Scholar] [CrossRef] [Green Version]
  13. Dalahmeh, S. Capacity of Biochar Filters for Wastewater Treatment in Onsite Systems—Technical Report; Report 2016-90; Havs och vattenmyndighet: Göteborg, Sweden; Swedish University of Agricultural Sciences: Uppsala, Sweden, 2016; ISBN 978-91-576-9398-3.
  14. Dalahmeh, S.S.; Jönsson, H.; Hylander, L.D.; Hui, N.; Yu, D.; Pell, M. Dynamics and functions of bacterial communities in bark, charcoal and sand filters treating greyawter. Water Res. 2014, 54, 21–32. [Google Scholar] [CrossRef]
  15. Ye, S.; Zeng, G.; Wu, H.; Liang, J.; Zhang, C.; Dai, J.; Xiong, W.; Song, B.; Wu, S.; Yu, J. The effects of activated biochar addition on remediation efficiency of co-composting with contaminated wetland soil. Resources. Conserv. Recycl. 2019, 140, 278–285. [Google Scholar] [CrossRef]
  16. Rolland, L.; Molle, P.; Liénard, A.; Bouteldja, F.; Grasmick, A. Influence of the physical and mechanical characteristics of sands on the hydraulic and biological behaviors of sand filters. Desalination 2009, 248, 998–1007. [Google Scholar] [CrossRef]
  17. Beal, C.D.; Rassam, D.W.; Gardner, E.A.; Kirchhof, G.; Menzies, N.W. Influence of hydraulic loading and effluent flux on surface surcharging in soil absorption systems. J. Hydrol. Eng. 2008, 8, 681–692. [Google Scholar] [CrossRef]
  18. Dalahmeh, S.S.; Pell, M.; Hylander, L.D.; Lalander, C.; Vinnerås, B.; Jönsson, H. Effects of changing hydraulic and organic loading rates on pollutant reduction in bark, charcoal and sand filters treating greywater. J. Environ. Manag. 2014, 132, 338–345. [Google Scholar] [CrossRef] [PubMed]
  19. Dane, J.H.; Topp, C.G. Methods of Soil Analysis, Part 4: Physical Methods; Soil Science Society of America, Inc.: Madison, WI, USA, 2002. [Google Scholar]
  20. Brunauer, S.; Emmett, P.H.; Teller, E. Adsorption of Gases in Multimolecular Layers. J. Am. Chem. Soc. 1938, 2, 309–319. [Google Scholar] [CrossRef]
  21. Lens, P.N.; Vochten, P.M.; Speleers, L.; Verstraete, W.H. Direct treatment of domestic wastewater by percolation over peat, bark and woodchips. Water Res. 1994, 1, 17–26. [Google Scholar] [CrossRef]
  22. Korber, D.R.; Lawrence, J.R.; Lappin-Scott, H.M. Growth of Microorganisms on Surfaces. In Microbial Biofilms; Lappin-Scott, H.M., Costerton, J., Eds.; Cambridge University Press: Cambridge, UK, 2003; p. 15. [Google Scholar]
  23. Tabet, T.A.; Aziz, F.A. Cellulose Microfibril Angle in Wood and Its Dynamic Mechanical Significance. In Cellulose—Fundamental Aspects; Ven, T.v.d., Godbout, L., Eds.; InTech: Rijeka, Croatia, 2013; p. 05. [Google Scholar]
  24. Huggins, T.M.; Haeger, A.; Biffinger, J.C.; Ren, Z.J. Granular biochar compared with activated carbon for wastewater treatment and resource recovery. Water Res. 2016, 94, 225–232. [Google Scholar] [CrossRef] [Green Version]
  25. Kholoma, E.; Renman, G.; Renman, A. Phosphorus removal from wastewater by fieldscale fortified filter beds during a one-year study. Environ. Technol. 2016, 23, 2953–2963. [Google Scholar] [CrossRef]
  26. Çeçen, F.; Aktaş, Ö. Integration of Activated Carbon Adsorption and Biological Processes in Wastewater Treatment. In Activated Carbon for Water and Wastewater Treatment: Integration of Adsorption and Biological Treatment; Wiley-VCH: Weinheim, Germany, 2011; pp. 43–93. [Google Scholar]
  27. Stevik, T.K.; Aa, K.; Ausland, G.; Hanssen, J.F. Retention and removal of pathogenic bacteria in wastewater percolating through porous media: A review. Water Res. 2004, 6, 1355–1367. [Google Scholar] [CrossRef]
  28. Halalsheh, M.; Dalahmeh, S.; Sayed, M.; Suleiman, W.; Shareef, M.; Mansour, M.; Safi, M. Grey water characteristics and treatment options for rural areas in Jordan. Bioresour. Technol. 2008, 99, 6635–6641. [Google Scholar] [CrossRef]
  29. Vinnerås, B.; Palmquist, H.; Balmér, P.; Jönsson, H. The characteristics of household wastewater and biodegradable solid waste—A proposal for new Swedish design values. Urban Water J. 2006, 1, 3–11. [Google Scholar] [CrossRef]
  30. Pell, M.; Nyberg, F. Infiltration of waste-water in a newly started pilot sand-filter system. 1. Reduction of organic-matter and phosphorus. J. Environ. Qual. 1989, 4, 451–457. [Google Scholar] [CrossRef]
  31. Wilson, J.; Boutilier, L.; Jamieson, R.; Havard, P.; Lake, C. Effects of Hydraulic Loading Rate and Filter Length on the Performance of Lateral Flow Sand Filters for On-Site Wastewater Treatment. J. Hydrol. Eng. 2011, 8, 639–649. [Google Scholar] [CrossRef]
  32. Wijeyekoon, S.; Mino, T.; Satoh, H.; Matsuo, T. Effects of substrate loading rate on biofilm structure. Water Res. 2004, 10, 2479–2488. [Google Scholar] [CrossRef] [PubMed]
  33. Gill, L.W.; O’luanaigh, N.; Johnston, P.M.; Misstear, B.D.; O’suilleabhain, C. Nutrient loading on subsoils from on-site wastewater effluent, comparing septic tank and secondary treatment systems. Water Res. 2009, 10, 2739–2749. [Google Scholar] [CrossRef] [PubMed]
  34. Arias, C.A.; Brix, H.; Johansen, N.H. Phosphorus removal from municipal wastewater in an experimental two-stage vertical flow constructed wetland system equipped with a calcite filter. Water Sci. Technol. 2003, 5, 51–58. [Google Scholar] [CrossRef]
Figure 1. Schematic diagram of the laboratory-scale filters (diam. 5 cm) used for testing the wastewater treatment efficiency of four different filter media (triplicate columns): Activated biochar, non-activated willow biochar, non-activated pine spruce biochar and sand.
Water 10 01835 g001
Figure 2. Scanning electron microscope image of the surface of (A) non-activated pine-spruce biochar, (B) activated biochar and (C) sand. Magnification factor ×1500. The values in the tables show percentage of the chemical composition of the surface (mean ± standard deviation, n = 3).
Water 10 01835 g002
Figure 3. Response curves of the filter materials to addition of a NaCl tracer pulse of 10 g L−1, measured as electric conductivity (EC) in the effluent from filters of (A) activated biochar (×; n = 2), (B) non-activated willow biochar (; n = 3) and (C) sand (▲; n = 2). Diagrams to the left show EC in effluent against time and diagrams to the right show percentage of tracer recovered against time. All filter materials had an effective particle size (d10) of 1.4–1.5 mm and a hydraulic loading rate of 32 L m−2 day−1.
Water 10 01835 g003
Figure 4. (A) Response curve and (B) recovery curve after the addition of a NaCl tracer pulse of 10 g L−1, measured as electric conductivity (EC) in the effluent from non-activated pine-spruce biochar filters with an effective particle size (d10) of 0.7 (red diamond), 1.4 (black diamond) and 2.8 mm (blue diamond). All filters had a hydraulic loading rate of 32 L m−2 day−1.
Water 10 01835 g004
Figure 5. Performance of non-activated willow biochar (blue columns), non-activated pine-spruce biochar (red columns) and activated biochar (black columns) in the removal of wastewater pollutants at a hydraulic loading rate of 32 L m−2 day−1 and organic loading rate of 15 g BOD5 m−2 day−1. Effective size (d10) in all materials was 1.4 mm. Bars indicate mean value (n = 3) and error bars represent standard deviation.
Water 10 01835 g005
Figure 6. Performance of pine-spruce biochar filters with effective particle sizes (d10) of 0.7, 1.4 and 2.8 mm in the removal of wastewater pollutants at a hydraulic loading rate of 34 L m−2 day−1 and an organic loading rate of 20 ± 5 g BOD5 m−2 day−1. Bars indicate mean value (n = 3) and error bars represent standard deviation.
Water 10 01835 g006
Figure 7. Performance of pine-spruce biochar filters with an effective particle size (d10) of 1.4 mm in removal of wastewater pollutants at organic loading rates of 5 ± 2 and 20 ± 5 g BOD5 m−2 day−1. Bars indicate mean value (n = 3) and error bars represent standard deviation.
Water 10 01835 g007
Figure 8. Concentration of total nitrogen (Tot-N) (A) and nitrate nitrogen (NO3-N) (B) in the influent () and in the effluent from non-activated pine-spruce biochar () and from sand (■), both with effective particle size (d10) = 1.4 mm. Filters were operated for 6 months at a hydraulic loading rate of 37 L m−2 day−1 and organic loading rate of 5 g BOD5 m−2 day−1. Symbols are mean values (n = 3). Error bars represent standard deviation.
Water 10 01835 g008
Table 1. Variables tested in sub-studies 1–5 to assess the performance of non-activated and activated biochar and sand filters for small-scale wastewater treatment.
SpecificationsSub-Study 1Sub-Study 2Sub-Study 3Sub-Study 4Sub-Study 5
Type of material(1) Non-activated willow biochar (2) Non-activated pine-spruce biochar (3) Activated biochar(1) Non-activated pine-spruce biochar(1) Non-activated pine-spruce biochar(1) Non-activated pine-spruce biochar(1) Non-activated pine-spruce biochar (2) Sand
Number of replicates for each medium and treatment33333
Effective size (d10, mm)1.40.7, 1.4, and 2.81.41.41.4
Hydraulic loading rate (L m−2 day−1)3234200 and 34200 and 3737
Organic loading rate (g BOD5 m−2 day−1)15-20205 and 2055
Chemical pollutantsCOD, BOD5 NH4, NO3, Tot-N, PO4-P, Tot-PCOD, BOD7, NO3, Tot-N, PO4-P, Tot-PCOD, BOD7, NH4, NO3, Tot-NCOD, BOD7, NH4, NO3, Tot-NCOD, BOD7, NO3, Tot-N, PO4-P, Tot-P
Filter operation period (weeks)2026202026
Table 2. Chemical kits and methods used for analysis of wastewater characteristics.
Substance Kit NameMeasurement RangeUnitsStandard MethodControl Solution Name and ValueApparatus
ECElectrical conductivity mS cm−1 Calibration liquid: KCl 500 µS/cmConductivity Pocket Meter, Cond340i WTW, Germany
pH Standard Unit (SU) Calibration liquid: pH 7 and pH 9pH-meter Ino Lab pH Level 1, WTW pH-electrode Blueline 14 pH, Schott instruments
CODChemical oxygen demandSpectroquant COD Cell Test (Hg-free) 1.09772.0001 and 1.09773.000110–150 and 100–1500mg L−1No standard, but Hg-freePotassium hydrogen phthalate solution 1.11769.0100, Merck 170 mg L−1 and Combi R1, Combicheck 20 1.14675.0001, Merck 750 ± 75 mg L−1Thermoreactor TR 420, Merck, Germany Spectroquant NOVA 60, Merck, Germany Pipettor, VWR, Poland Analog Vortex Mixer, VWR, USA
NH4-NAmmoniumSpectroquant Ammonium Cell Test 1.14544.00010.5–16mg L−1EPA 350.1, US Standard Methods 4500-NH3 D, and ISO 7150/1Combi R1, Combicheck 20 1.14675.0001, Merck
12 ± 1 mg L−1
Spectroquant NOVA 60, Merck, Germany Pipettor*, VWR, Poland Analog Vortex Mixer, VWR, USA
NO3-NNitrate Spectroquant Nitrate Cell Test 1.14764.00011–50mg L−1 Nitrate standard solution 1.19811.0500, Merck 1000 mg L−1Spectroquant NOVA 60, Merck, Germany Pipettor*, VWR, Poland Analog Vortex Mixer, VWR, USA
Tot-NTotal nitrogenSpectroquant Nitrogen (total) Cell Test 1.147630001 and 1.00613.00110–150 and 0.5–15mg L−1EN ISO 11905-1 (digestion)Nitrate standard solution 1.19811.0500, Merck
1000 mg L−1
Thermoreactor TR 420, Merck, Germany Spectroquant NOVA 60, Merck, Germany Pipettor*, VWR, PolandAnalog Vortex Mixer, VWR, USA
Tot-PTotal phosphorusSpectroquant Phosphate Cell Test 1.14543.00010.05-5mg L−1EPA 365.2 + 3, APHA 4500-P E, and DIN EN ISO 6878Phosphate standard solution 1.19898.0500, Merck
1000 mg L−1
Thermoreactor TR 420, Merck, Germany Spectroquant NOVA 60, Merck, Germany Pipettor*, VWR, Poland Analog Vortex Mixer, VWR, USA
PO4-PPhosphateSpectroquant Phosphate Cell Test 1.14543.00010.05-5mg L−1EPA 365.2+3, APHA 4500-P E, and DIN EN ISO 6878Phosphate standard solution 1.19898.0500, Merck
1000 mg L−1
Spectroquant NOVA 60, Merck, Germany Pipettor*, VWR, Poland Analog Vortex Mixer, VWR, USA
Table 3. Properties of the activated biochar, willow biochar, pine-spruce biochar and sand filter materials used in column experiments. The hydraulic properties (porosity and mean residence time) were measured at a hydraulic residence time of 32 ± 7 L m−1 day−1.
Filter MaterialActivated BiocharNon-Activated Willow BiocharNon-Activated Pine-Spruce BiocharSand
Particle size (mm)1.5 and 2.8–51–1.4 and 2.8–51.4–51.4–5
Air-dry water content (%)0.66.3
Specific surface area (m2/g)>1000 170–2000.152
Bulk density (kg m−3)5602701871690
Particle density (kg m−3)1890740 2570
Total porosity (%)70.663.372–7434
Water-filled porosity (%) 48–53
Mean residence time (h)11910887 1; 85 2; 66 30.5
Hydraulic conductivity (cm h−1)500 360
1 Residence time of pine-spruce biochar filters with d10 = 0.7 mm. 2 Residence time of pine-spruce biochar filters with d10 = 1.4 mm. 3 Residence time of pine-spruce biochar filters with d10 = 2.8 mm.
Table 4. Concentrations of organic matter (BOD7 and COD) and nitrogen and phosphorus species in raw wastewater used to feed the filters in sub-studies 1–5. All concentrations are in mg L−1.
SpecificationsSub-Study 1Sub-Study 2Sub-Study 3Sub-Study 4Sub-Study 5
Type of material(1) Non-activated willow biochar
(2) Non-activated pine-spruce biochar
(3) Activated biochar *
(1) Non-activated pine-spruce biochar(1) Non-activated pine-spruce biochar(1) Non-activated pine-spruce biochar(1) Non-activated pine-spruce biochar
(2) Sand
Effective size (d10, mm)1.40.7, 1.4, 2.81.41.41.4
Hydraulic loading rate (L m−2 day−1)3234200343720037
Organic loading rate (g BOD5 m−2 day−1)15–2020520555
COD (mg L−1)1230–11401229 ± 320325 ± 1031229 ± 320496 ± 87325 ± 103496 ± 87
BOD7 (mg L−1)490–630 *629 ± 10526 ± 10629 ± 105131 ± 5026 ± 10131 ± 50
NO3-N1–31.3 ± 2.517 ± 81.3 ± 2.56 ± 617 ± 86 ± 6
NH4-N3.7–11.011 ± 97 ± 311 ± 9 7 ± 3
T-N (mg L−1)78–9578 ± 2726 ± 878 ± 2730 ± 426 ± 830 ± 4
PO4-P (mg L−1)2.6–3.23.2 ± 0.8 3.2 ± 0.81.87 ± 0.94 1.87 ± 0.94
Tot-P (mg L−1)3.6–3.83.8 ± 0.7 3.8 ± 0.7
* BOD5

