Infiltration and Anti-Filtration Recharge-Pumping Well and Laboratory Recharge Tests

School of Water Conservancy and Environment, University of Jinan, Jinan 250022, China
*
Author to whom correspondence should be addressed.
Water 2018, 10(12), 1834; https://doi.org/10.3390/w10121834
Submission received: 20 October 2018
/
Revised: 4 December 2018
/
Accepted: 7 December 2018
/
Published: 12 December 2018
(This article belongs to the Special Issue Groundwater Resources Assessment: Quantity and Quality)
Abstract
:Infiltration and anti-filtration recharge-pumping wells (hereinafter, referred to as IAF recharge-pumping wells) can enable rain-flood flowing in rivers or channel recharge to aquifers, in flood periods, and pump groundwater to be utilized in non-flood periods. In this study, a round IAF recharge-pumping well and a square IAF recharge-pumping well were developed, the structure and characteristic were introduced, the calculation equations of single-well recharge quantity of IAF recharge-pumping wells, in unconfined aquifers were deduced, and the steady-state flow recharge test was conducted in the laboratory. The conclusions were as follows. The theoretical equation of the single-well recharge quantity was reasonable. Compared to existing anti-filtration recharge wells, the new IAF recharge-pumping well had stronger anti-deposit and anti-scour abilities and the single-well recharge quantity increased by 400%. Compared to the square IAF recharge-pumping well, the round IAF recharge-pumping well had a better inlet flow pattern and a larger single-well recharge quantity. With an increase in the test times, the single-well recharge quantity gradually decreased and tended to be stable. The existence of the pumping pipe had a little influence on the single-well recharge quantity.
1. Introduction
Groundwater is an important part of water resources and has an important resource-function, an eco-environmental function, and a geo-environment function [1]. In recent years, water shortages have been one of the important limiting factors for social and economic development around the world. In areas where groundwater is the main source of water, water shortages and water quality problems have been caused by the severe over-exploitation of groundwater, which, in turn, has seriously hampered the social and economic development of those areas. Pingtan Island is a serious water-shortage area, in order to alleviate the shortage of water resources, people began to recharge abundant rain-flood resources and surface water into the aquifer by developing efficient recharge facilities [2,3].
Groundwater recharge is to recharge the abundant rain-flood resources or surface water into the aquifer, in the rainy season, which plays an important role in increasing rain-flood resource utilization rate and improves the water resource shortage [4,5,6]. In USA, the Aquifer Storage and Recovery (ASR) has been developed as a particular form of artificial recharge of groundwater that enables non-potable aquifers to be used for the storage of water [7,8,9]. In Holland, the desalinated Rhine water is recharged into the aquifer by natural infiltration and injection during the flood season [10]. In Orange, USA, people began to use the local topography and geological conditions to recharge the excess water resources, and reclaimed water to the ground, through shafts, rivers, and artificial lakes, in 1956 [11]. In Shanghai, China, the groundwater level was controlled by annually recharging the reclaimed water to artificial recharge wells, in the 1960s [12]. Groundwater recharge is generally divided into deep recharge and shallow infiltration [13,14,15]. For the shallow infiltration, the water is accumulated in the pits, ponds, pools, and then it slowly penetrates to the aquifer [16]. For the deep recharge, the water recharges to the aquifer through the recharge well [17].
In the field of recharge facility applications, anti-filtration recharge wells is a unique recharge facility of underground reservoirs, in China [18,19]. In China, the Shandong Peninsula is a hilly area with average per capita water resource of 291.3 m3, which is a serious water-shortage area. In order to use the rain-flood resources, improve the water resources utilization, and solve the water-shortage problem, underground reservoirs have been constructed, since the 1990s, such as the Wanghe Underground Reservoir and the Huangshui River Underground Reservoir. Anti-filtration recharge wells as an efficient recharge facility have also been put into use. For a medium-small valley with no pollution or only slight pollution, anti-filtration recharge wells are generally set on the river channel or the irrigation canal, which are used to solve the rain-flood recharge problem. In these, the upper part of the aquifer is clay or loam, with a weak permeability, and the lower layer is sand, therefore, the rain-flood can be recharged to the aquifer, during the flood season, and does not need to be filtered and purified. The anti-filtration recharge wells can save the cost of clean water and can carry out large-scale rain-flood recharge. However, during the operation of the existing anti-filtration recharge wells, as the running time increases, the surface of the recharge pool is easily covered by silt, which easily produces a blockage phenomenon. Additionally, with a large flow-rate, the filter material (sand and gravel) in the recharge pool is easily washed away by the river water, resulting in a loss of the anti-filtration function and causing a blockage of the aquifer, which gradually decreases the capacity of the recharge [20].
This study focused on the existing anti-filtration recharge wells used in the Jiaodong Peninsula, China. Based on the demands of the underground reservoir in Pingtang—increasing the recharge capacity (which was a precondition) and also taking the pumping function into consideration—two new infiltration and anti-filtration recharge-pumping wells (hereinafter, referred to as IAF recharge-pumping wells) were designed—one round IAF recharge-pumping well and another square IAF recharge-pumping well. The theoretical equations of the single-well recharge quantity of the IAF pumping-recharge wells were deduced, a laboratory recharge test equipment was developed, and laboratory steady-state flow recharge tests were carried out. Research on the new IAF recharge-pumping wells and the existing anti-filtration recharge wells was also considered, for comparison. This study should help improve the recharge ability of the existing anti-filtration recharge wells and provide an efficient recharge facility for rain-flood utilization in the Pingtan Island, which has an important practical significance.
2. The IAF Recharge-Pumping Wells
2.1. Description of the Study Area
Pingtan Island, located in the eastern part of the Fujian Province, is the fifth largest island in China. It extends from 119°32′ E to 120°10′ E longitude and 25°15′ N to 25°45′ N latitude, with a total area of 391.91 km2. The terrain of the Pingtan Island is high in the north and the south and low in the middle. Most of the southern and the northern parts are hilly and low mountains, and the middle part is marine plain. The Pingtan Island has a tropical marine monsoon climate with an annual average temperature of 19.6 °C and annual average precipitation of 1100 mm. The precipitation is unevenly distributed in the Pingtan. Eighty-two percent of the annual precipitation is concentrated between March to September, and the rain-flood resources are abundant. However, compared with the land area, the Pingtan Island has several short river channels, with rapid runoff, and all of the rivers flow into the sea, the surface runoff is difficult to use effectively, and the utilization of rainwater resources is only 20%. The water surface evaporation is 1330 mm and the land surface evaporation is 550 mm. So, for the whole island, drought is more serious. In order to build a comprehensive utilization system of the rainwater resources in the Pingtan Island, a safe multi-source water supply system has been established. Therefore, the construction of a rainwater storage system, based on the groundwater reservoir in the Pingtan Island has been proposed, so as to realize the full development and utilization of the rainwater resources [21,22,23]. Therefore, an efficient recharge facility is needed to be developed for use, in the Pingtan.
2.2. Design of the IAF Recharge-Pumping Wells
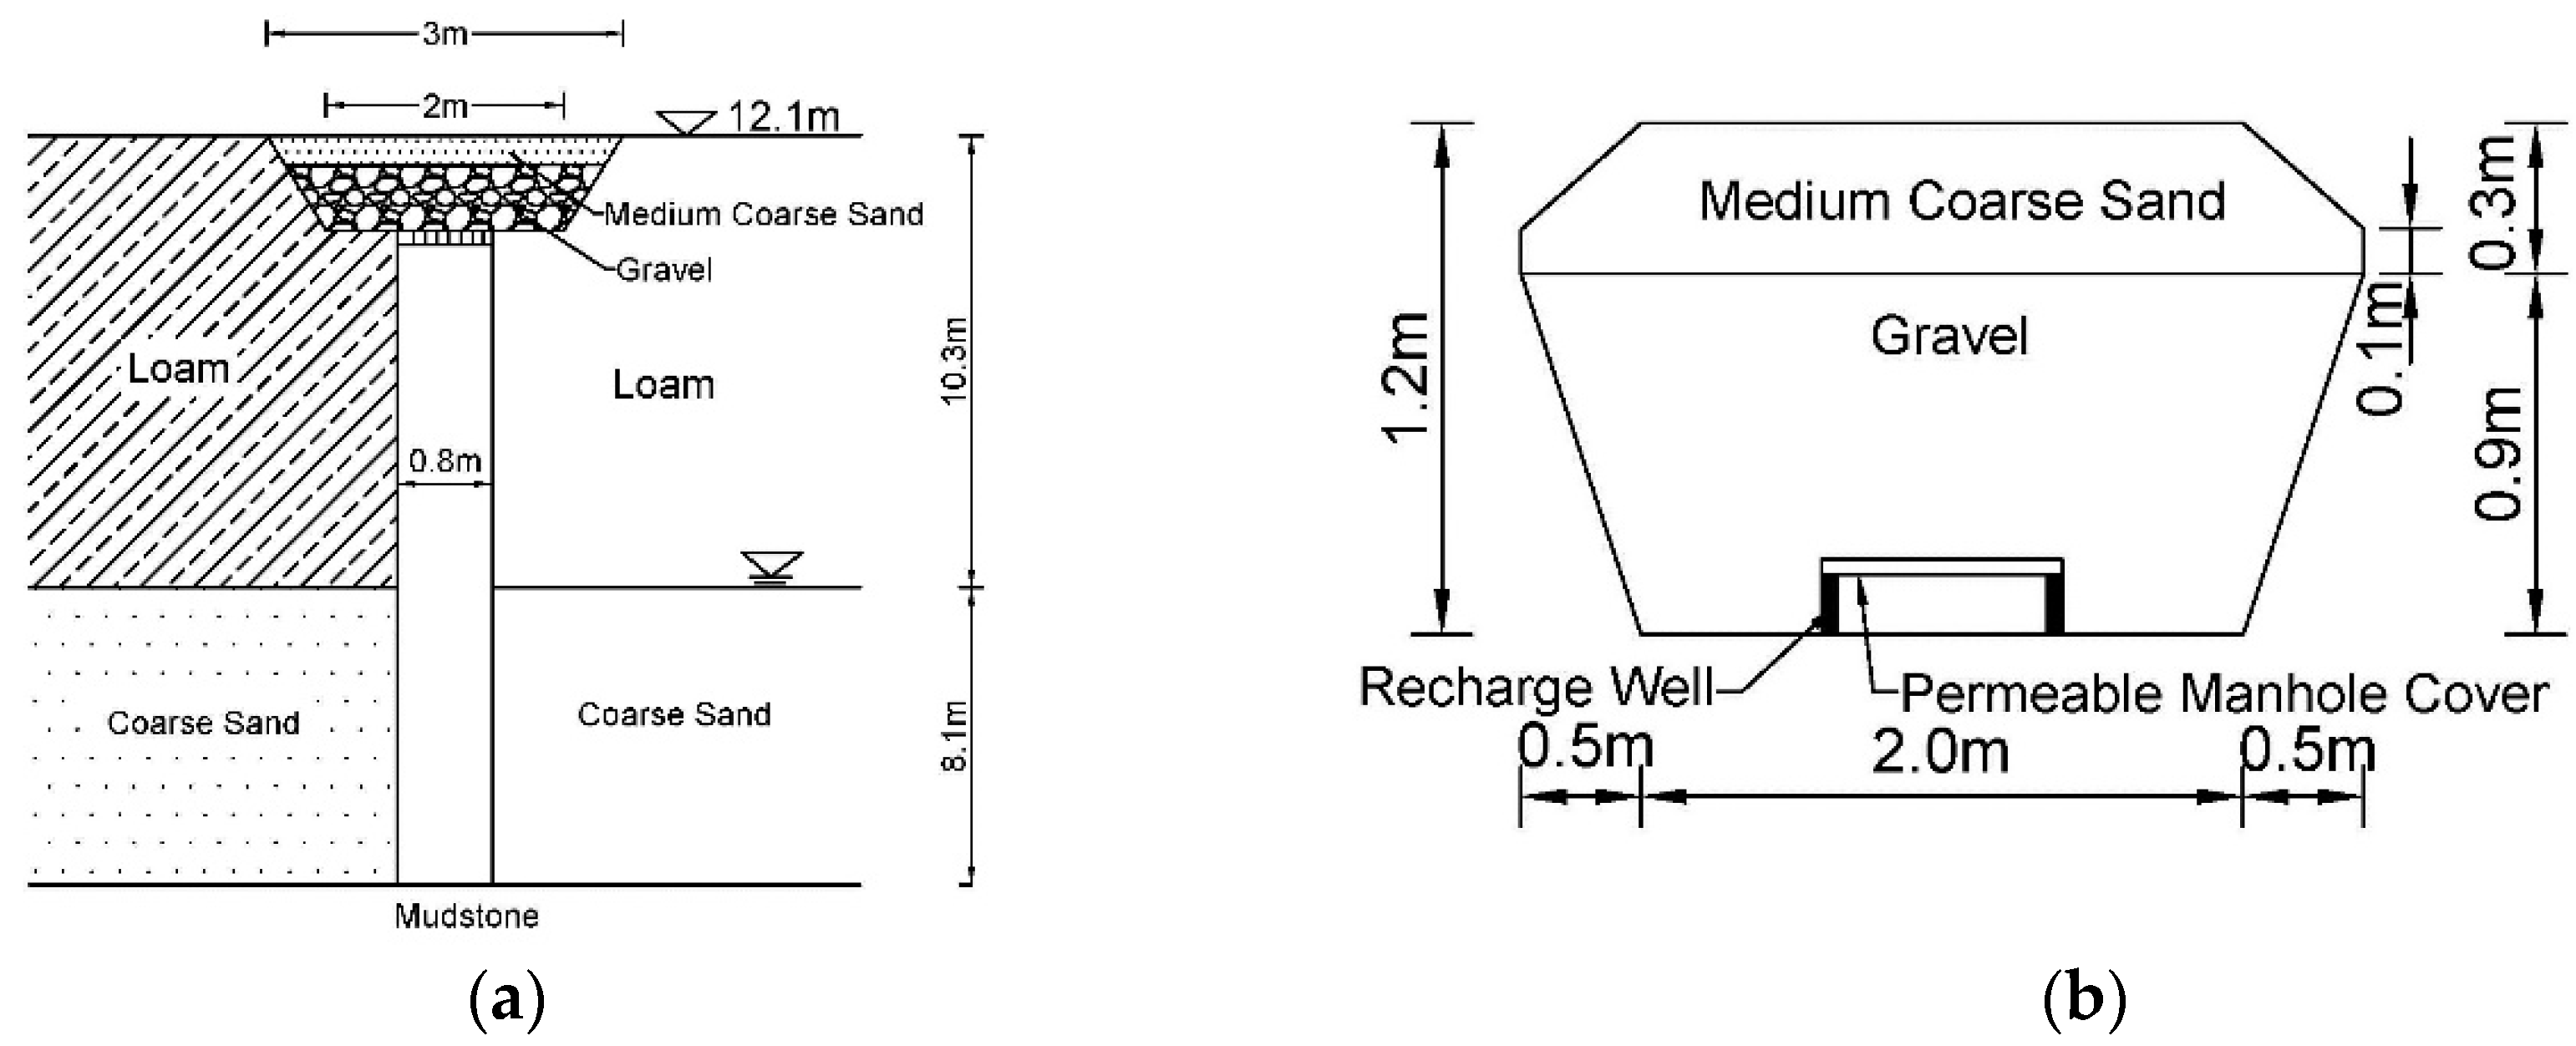
An existing anti-filtration recharge well has a certain purification capability, as shown in Figure 1. The existing anti-filtration recharge well consists of a recharge pool and an artificial recharge well. The recharge pool is a trapezoid soil pit which is backfilled with the sand-gravel filter material. The artificial recharge well is placed at the bottom-center of the recharge pool [24]. When the water flows through the anti-filtration recharge well placed in the river or the channel, the surface water would infiltrate into the recharge pool, vertically, then fall into the artificial recharge well and turn into a horizontal flow, into the aquifer, after the particles and impurities of the water are filtered. However, during the recharge, recharge ability of the existing anti-filtration recharge wells is decreased, gradually.
The problems of the existing anti-filtration recharge wells are as follows: (1) The recharge pool causes excessive water-head loss, which greatly reduces the single-well recharge quantity, and water can be just infiltrated in one-side. If the inflow section area is increased, the area of the recharge pool also increases, more land is occupied, and more filter material is consumed. (2) When the riverbed is relatively flat, due to the top elevation of the recharge pool being basically the same as that of the riverbed, the silt in the river enters the recharge pool and plugs the pores, resulting in a decrease of the recharge capacity. (3) When the vertical gradient of the riverbed is large, since the recharge pool is a pit, the recharge pool is easily destroyed by the water-flow and the filter sand is easily taken away, which disables the filtration function of the recharge pool and the sediment particles enter into the recharge well and clog the aquifers, causing the existing anti-filtration recharge wells to no longer work. (4) The existing anti-filtration recharge well do not take the pumping function into account, some pumping wells are drilled when people need to pump groundwater, during the dry season, causing more funds and lands to be occupied.
In view of the above-mentioned shortcomings of the existing anti-filtration recharge wells, the new design of the recharge-pumping well should mainly work to improve the infiltration capacity, the anti-deposit and anti-scour abilities of the recharge pool, as well as add a pumping facility. Therefore, the new IAF recharge-pumping well has been improved in the following aspects, during the design process: (1) In order to improve the infiltration capacity and the anti-deposit property, the recharge pool is replaced by the recharge wellhead and is placed on the ground, and the sand-gravel filter material is replaced by a layer of geotextile, which covers the surface of the recharge wellhead. Compared to the recharge pool, the surfaces of the infiltration and the anti-filtration recharge-pumping wellhead (hereinafter, referred to as IAF recharge-pumping wellhead) are permeable to the rain-flood, water can infiltrate into the recharge wellhead from multiple surfaces to increase the inflow section, and the geotextile can effectively filter the granular impurities of the river water and also reduce the use of sand and gravel materials. Furthermore, the geotextile is convenient for repair and replacements. (2) In order to improve the anti-sour property, the wellhead is made of reinforced concrete material. (3) In order to realize the initial split-flow control, the recharge wellhead is made of an impermeable body, within a certain range of the bottom, which can prevent wastewater from flowing into the well, at the initial stage of rainfall. (4) In order to prevent wastewater from recharging into the recharge well, when the river water is polluted, a geomembrane can be used to cover the outer layer of the geotextile, which serves as an impermeable layer. (5) In order to add the pumping function, pumping equipment, a water-pump valve, and submersible pump brackets are installed in the wellhead.
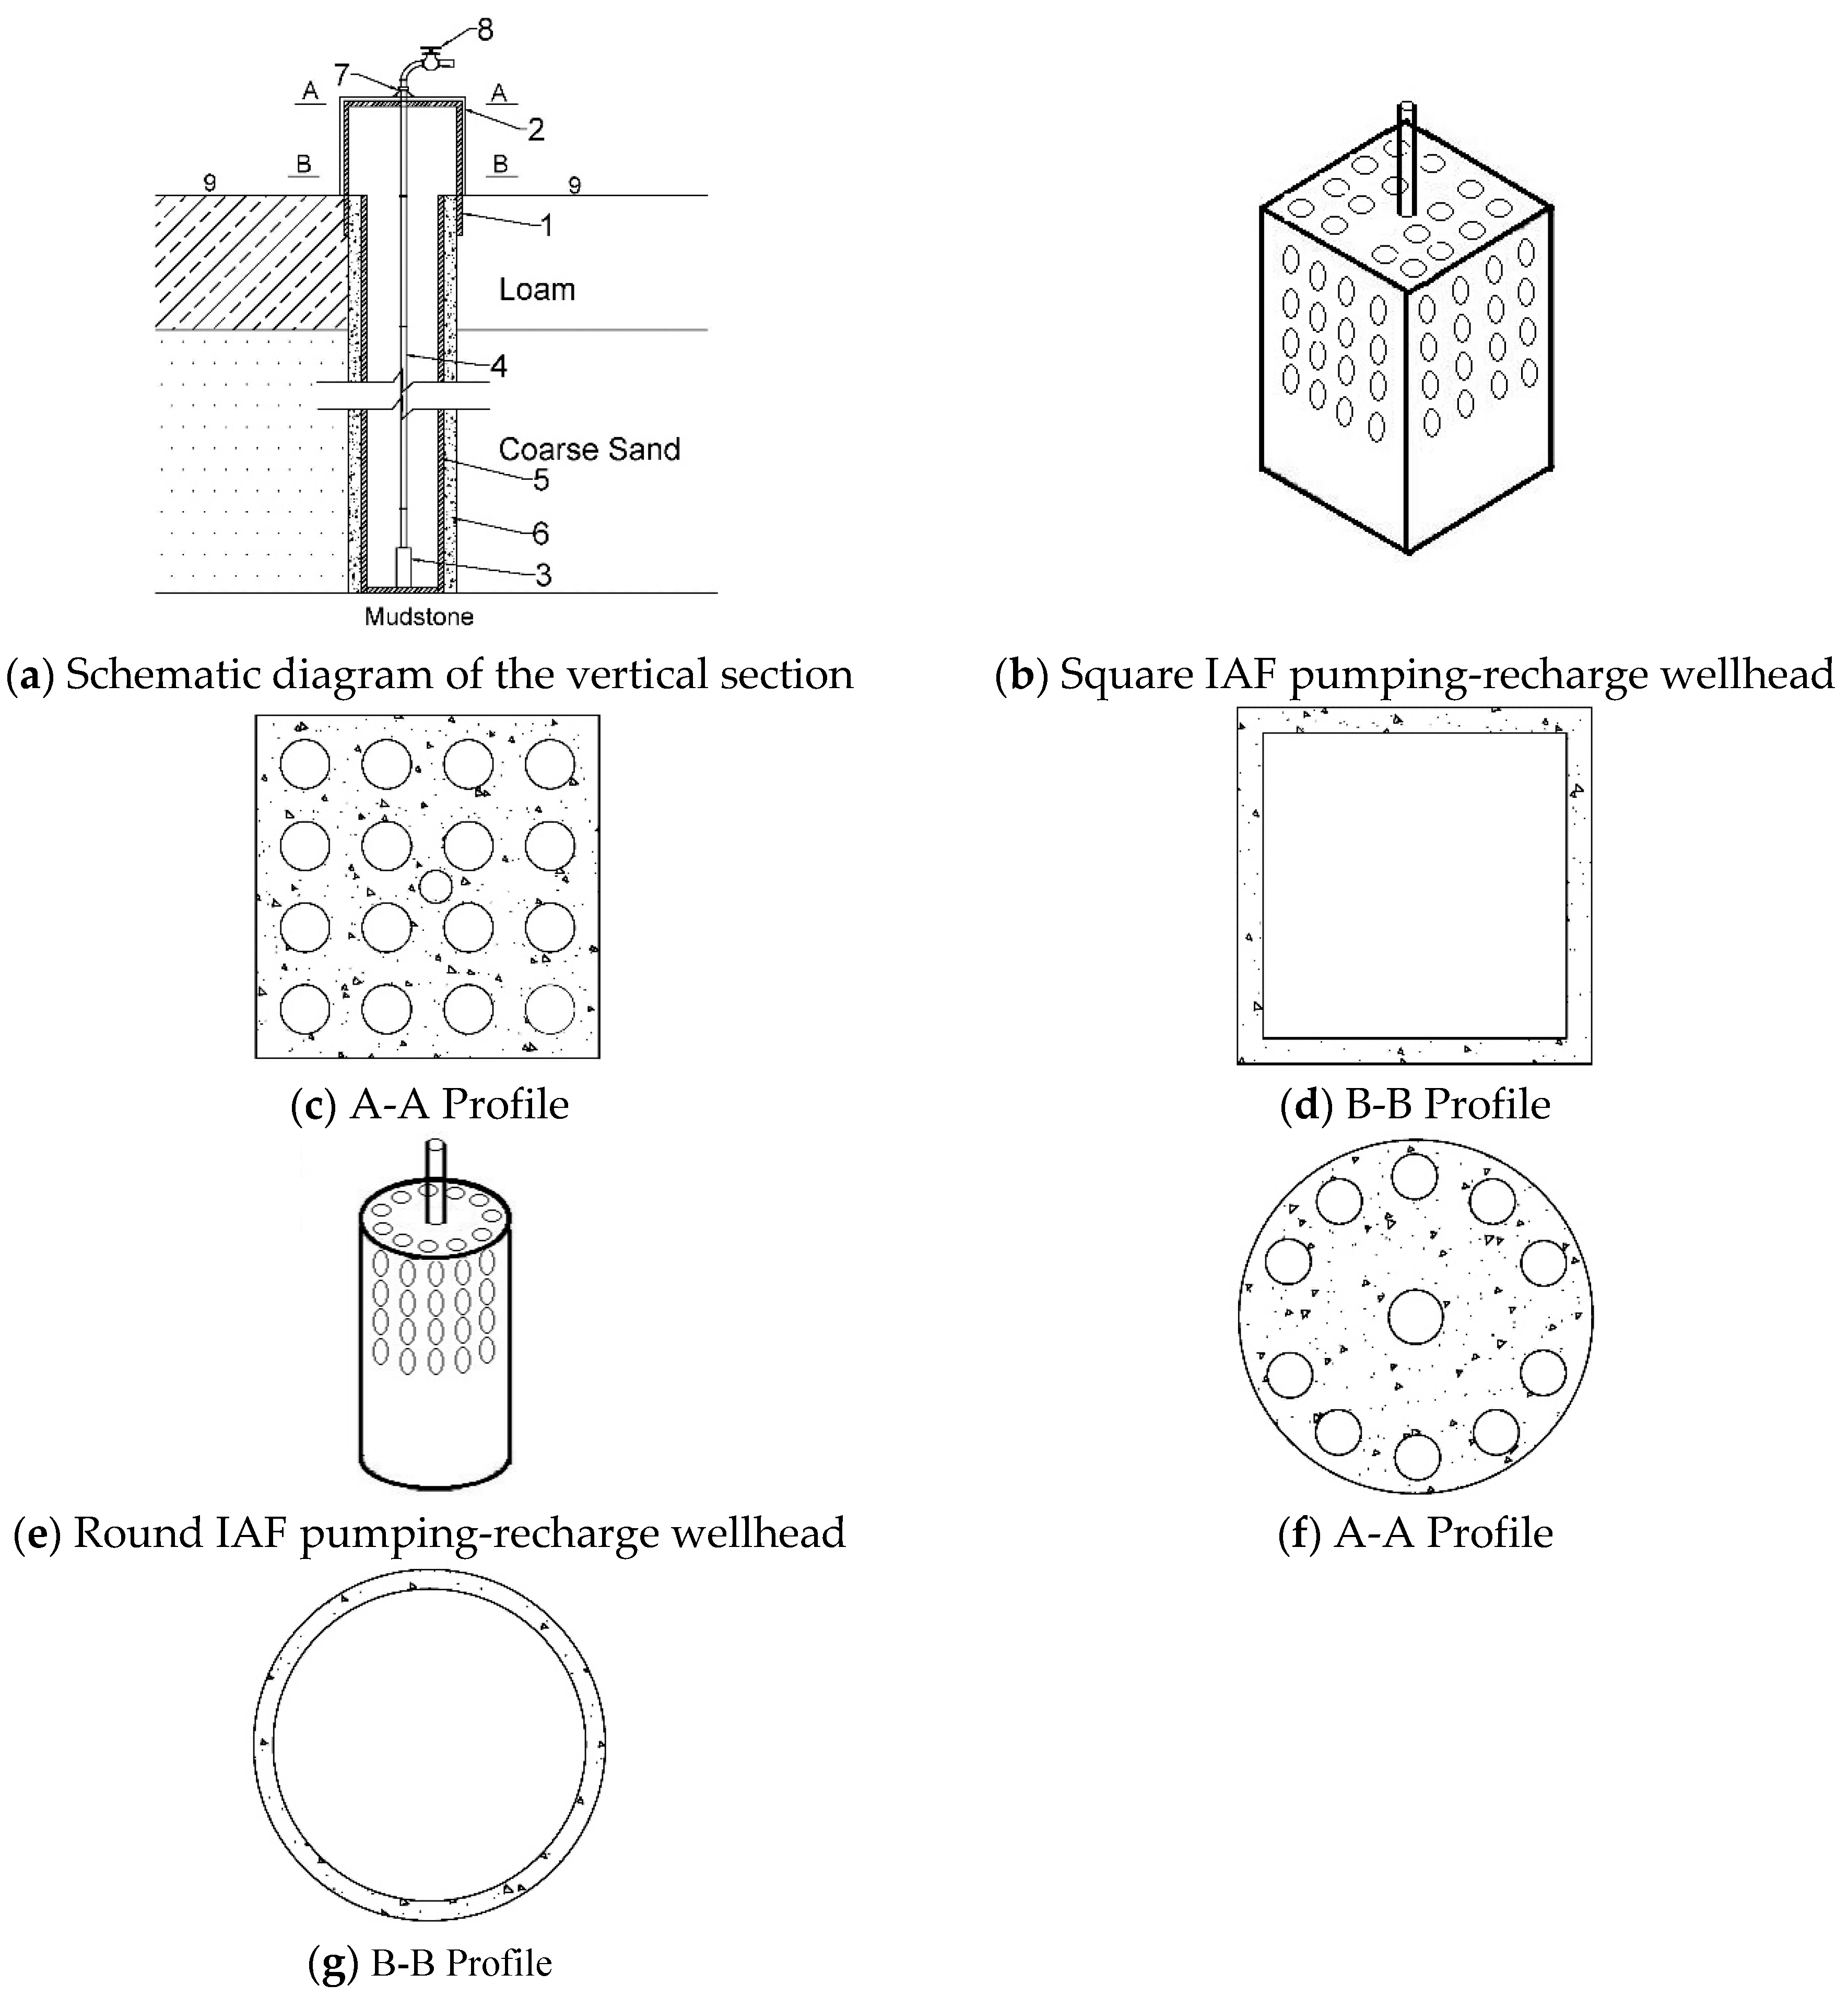
Two new types of IAF recharge-pumping wells have been designed with the aim of improving upon the deficiencies of the existing anti-filtration recharge well. One square IAF recharge-pumping well is a cube, the second round IAF recharge-pumping well is a cylinder, as shown in Figure 2. The applicable conditions of the IAF recharge-pumping wells are as follows:
(1) For an uneven distribution of the precipitation, in a medium-small valley with seasonal rivers, there is a large amount of abandoned river water, during the flood season and a water shortage, during the non-flood season. The river is either not polluted or is slightly polluted.
(2) The upper part of the aquifer is an impermeable or weakly-permeable layer (loam or clay), and the surface water can recharge into the aquifer, through the recharge well.
2.3. Calculation of the Single-Well Recharge Quantity of the IAF Recharge-Pumping Wells
For the calculation of the single-well pumping volume, the Dupuit equation can be referred to, therefore, the equation of the single-well pumping volume is no longer deduced, and only the equation for calculation of the single-well recharge quantity of the IAF recharge-pumping well in an unconfined aquifer, was deduced in this paper.
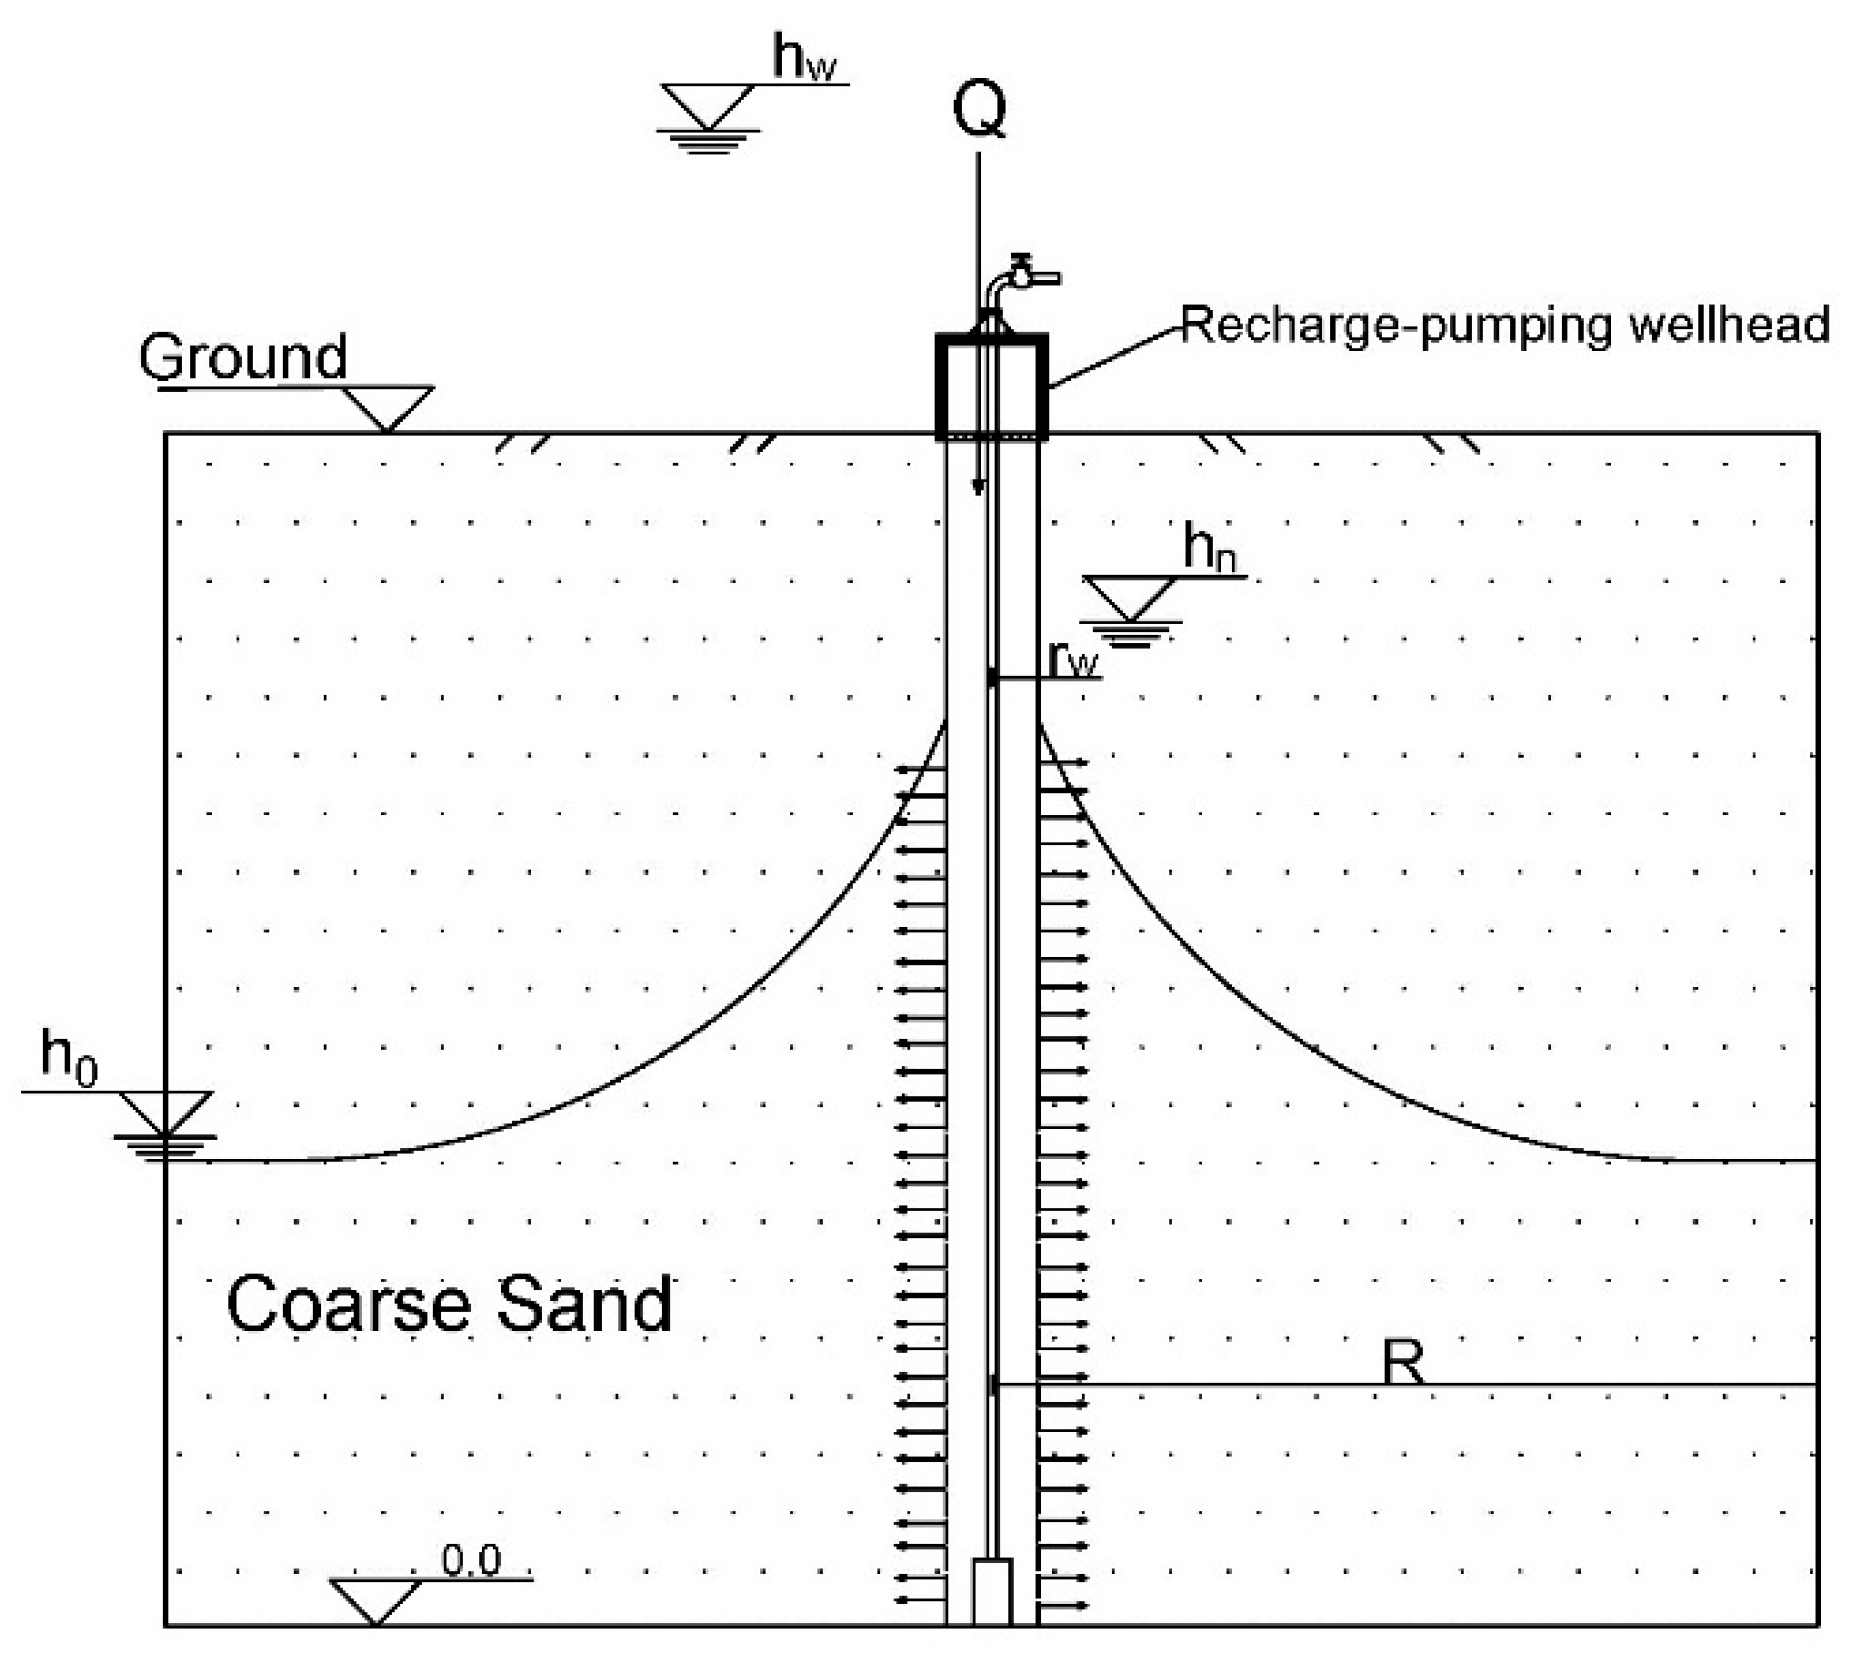
Assuming that there was a circular island with a radius R, a fully-penetrating recharge-pumping well in an unconfined aquifer, was dug in the center of the island. The groundwater level of the island remained unchanged and horizontal, before recharging. The steady-flow recharge model of the IAF recharge-pumping wells in an unconfined aquifer, is shown in Figure 3.
The basic assumptions are as follows: (1) The water flows from the recharge-pumping wellhead into the well, completely, and there is no leakage during the progress. (2) The water flowing from the wellhead to the well, and then into the aquifer follows Darcy’s Law. (3) The aquifer is homogeneous and isotropic. (4) The groundwater level of the island remains horizontal, before recharging. (5) The water-storage capacity of the aquitard is ignored.
When the IAF recharge-pumping well is used as the recharge well, the recharge process can be divided into two—the seepage around the wellhead and the well-flow in the recharge well.
The steady-flow recharge model of the IAF recharge-pumping well consists of Equations (1)–(3). Equation (1) is the seepage equation of the IAF recharge-pumping wellhead. Equation (2) is the horizontal well-flow equation of a fully-penetrating recharge well in an unconfined aquifer. Equation (3) is the assumed relation between the water head after the water flows over the recharge-pumping wellhead (hf) and the effective recharge water head in the recharge well (hn).
where Af is the flow-section area of the recharge-pumping wellhead (m2); h0 is the initial groundwater level (m); hf is the water head after the water flows over the recharge-pumping wellhead (m); hn is the effective recharge water head in the recharge well (m); hw is the water head outside the recharge-pumping wellhead, which is the recharge water level of the channel (m); kf is the comprehensive permeability coefficient of the geotextile and the sidewall of the wellhead (m/s); k is the permeability coefficient of the water-bearing sand layer (m/s); mf is the thickness of the geotextile and the sidewall of the recharge-pumping wellhead (m); Q is the single-well seepage quantity of the IAF recharge-pumping wellhead (m3/s); Qh is the single-well recharge quantity of the IAF recharge-pumping well (m3/s); R is the radius of influence (m); r is the distance from the well center (m); rw is the radius of the recharge well (m); βc is the comprehensive coefficient of the IAF recharge-pumping well, which reflects the head loss of the wellhead and is determined by the recharge test.
Under the basic assumption (1), the seepage quantity of the wellhead Q is equal to the recharge quantity of the recharge well Qh. With the equation groups of Equations (1)–(3), hf can be obtained, as shown in Equations (4) and (5). The single-well recharge quantity of the IAF recharge-pumping well can be calculated by Equation (1) or Equations (2) and (3).
where αfcx is the coefficient related to the wellhead and the aquifer.
Therefore, the equation for the groundwater curve generated by recharging in an unconfined aquifer is deduced, as shown in Equation (6).
where h is the groundwater head at a distance r from the recharge well center (m).
3. The Laboratory Steady-Flow Recharge Test
3.1. Test Equipment
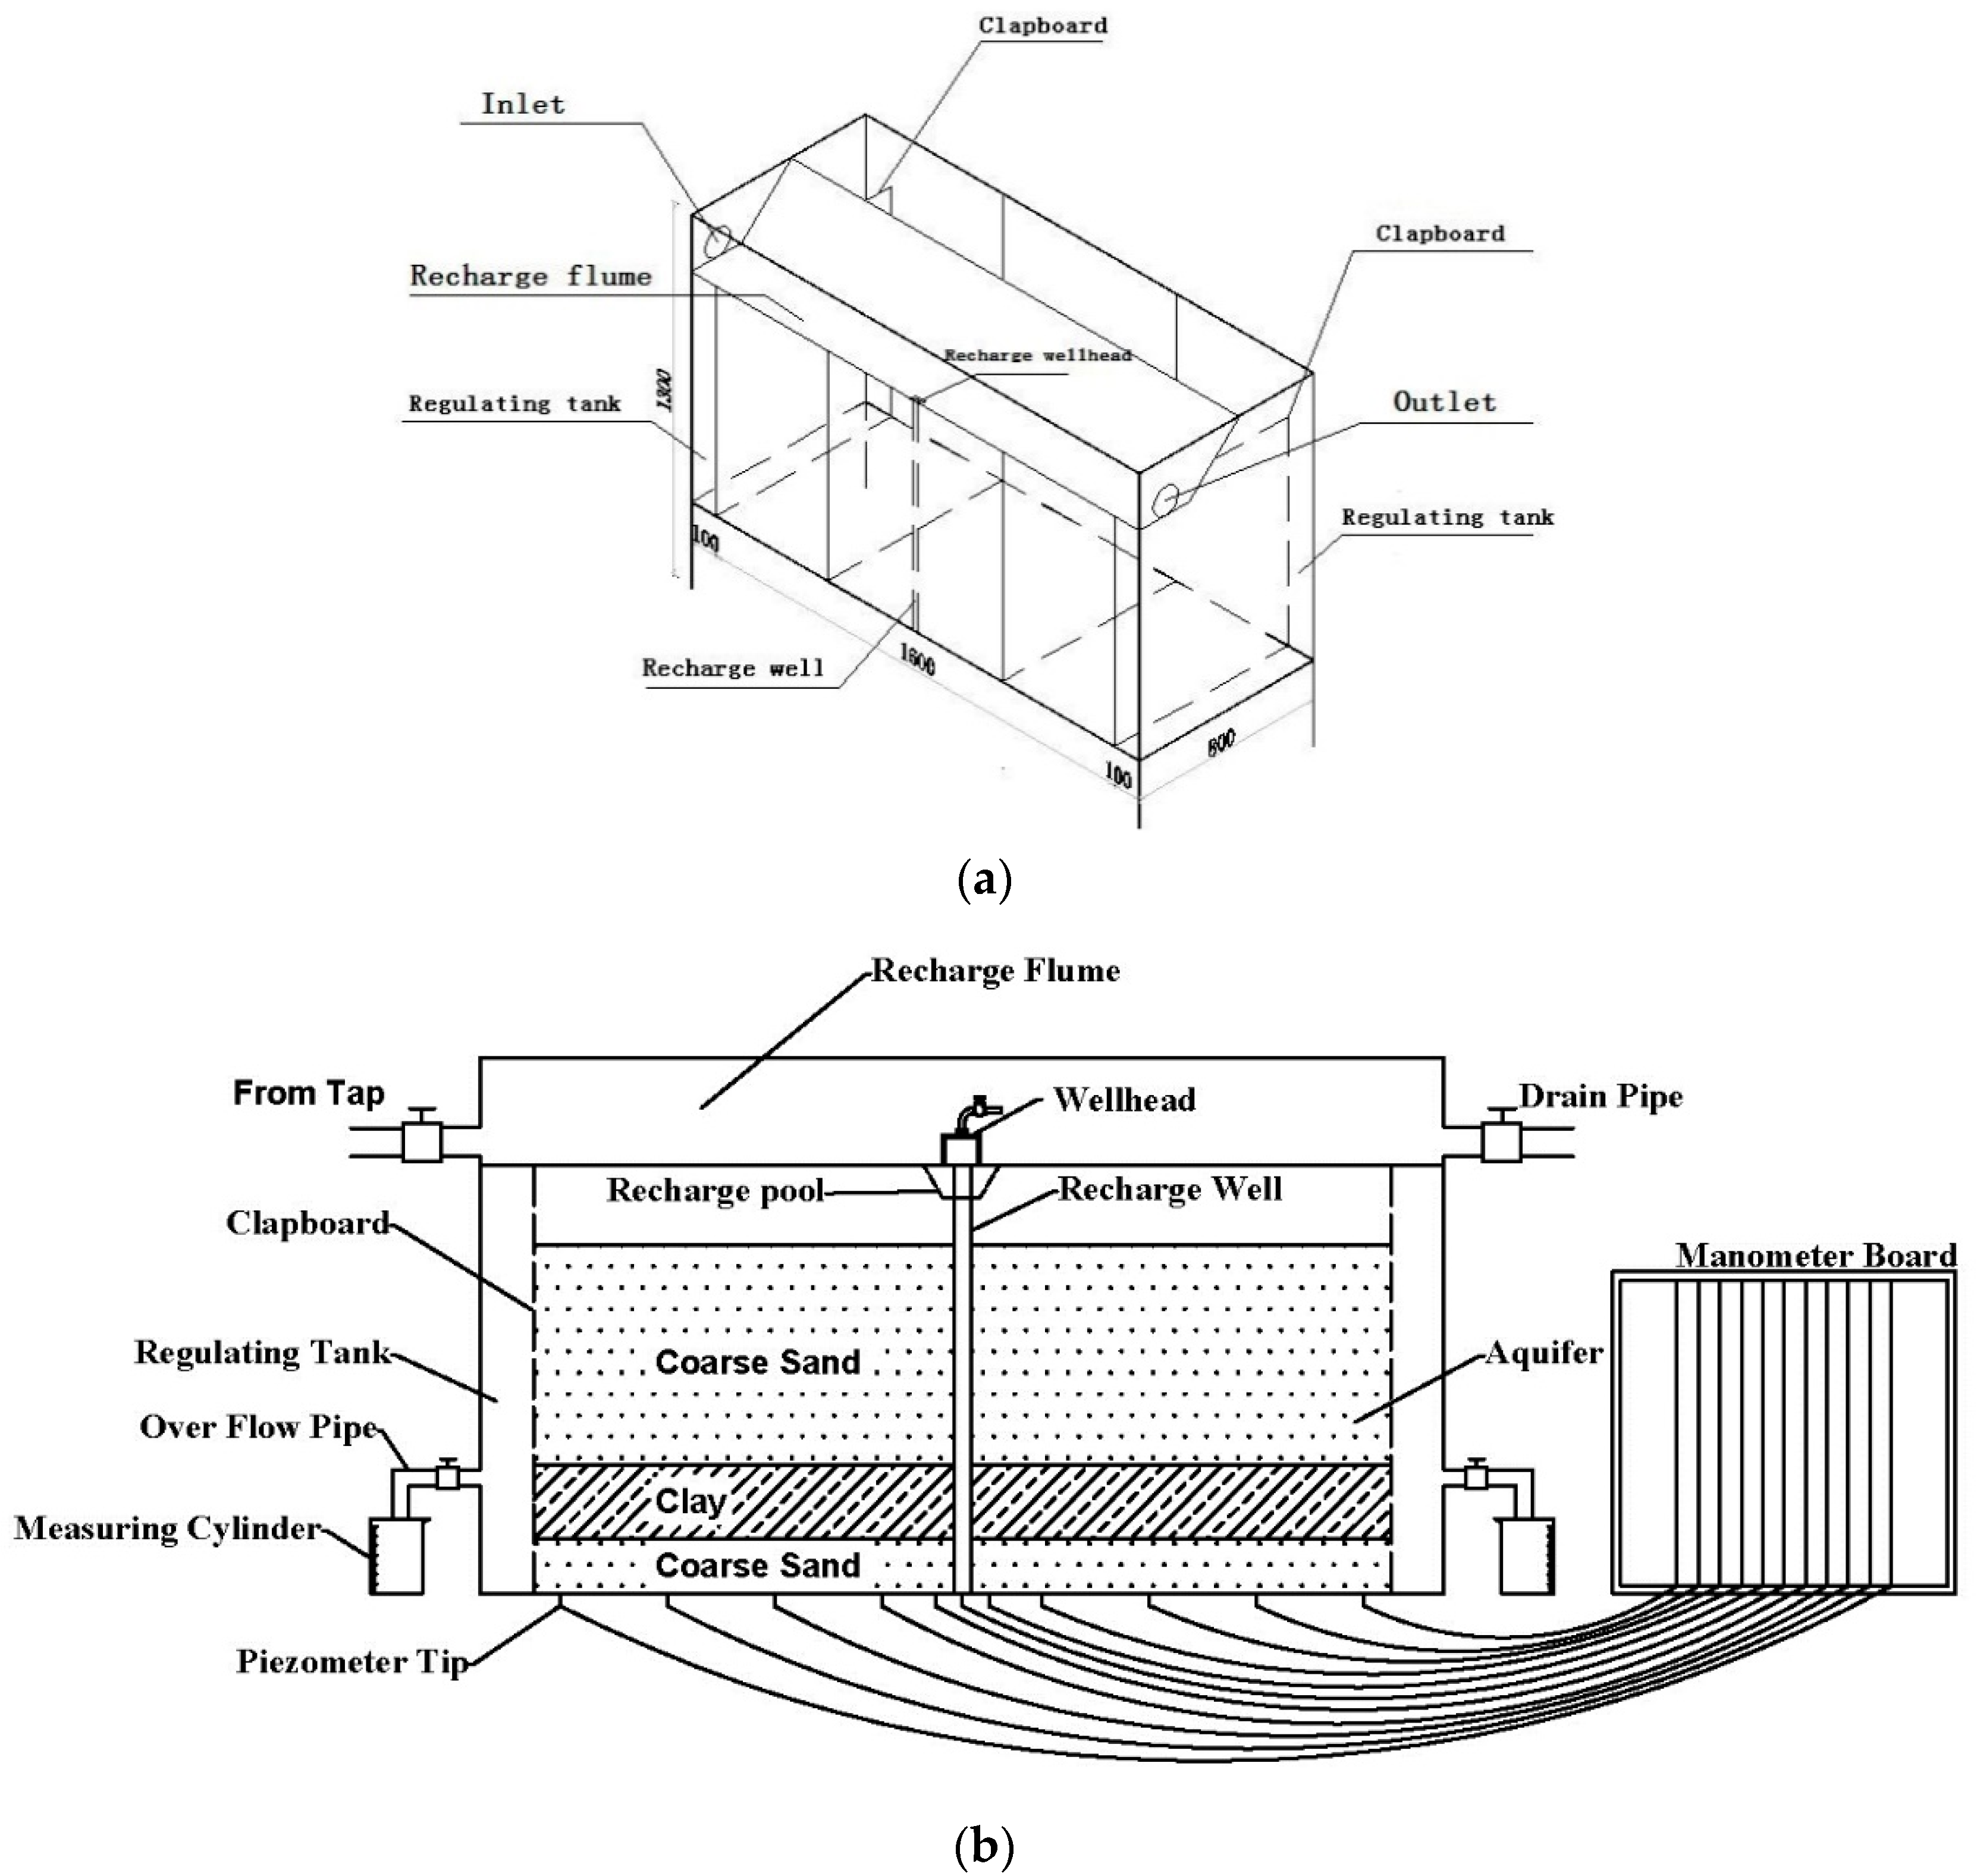
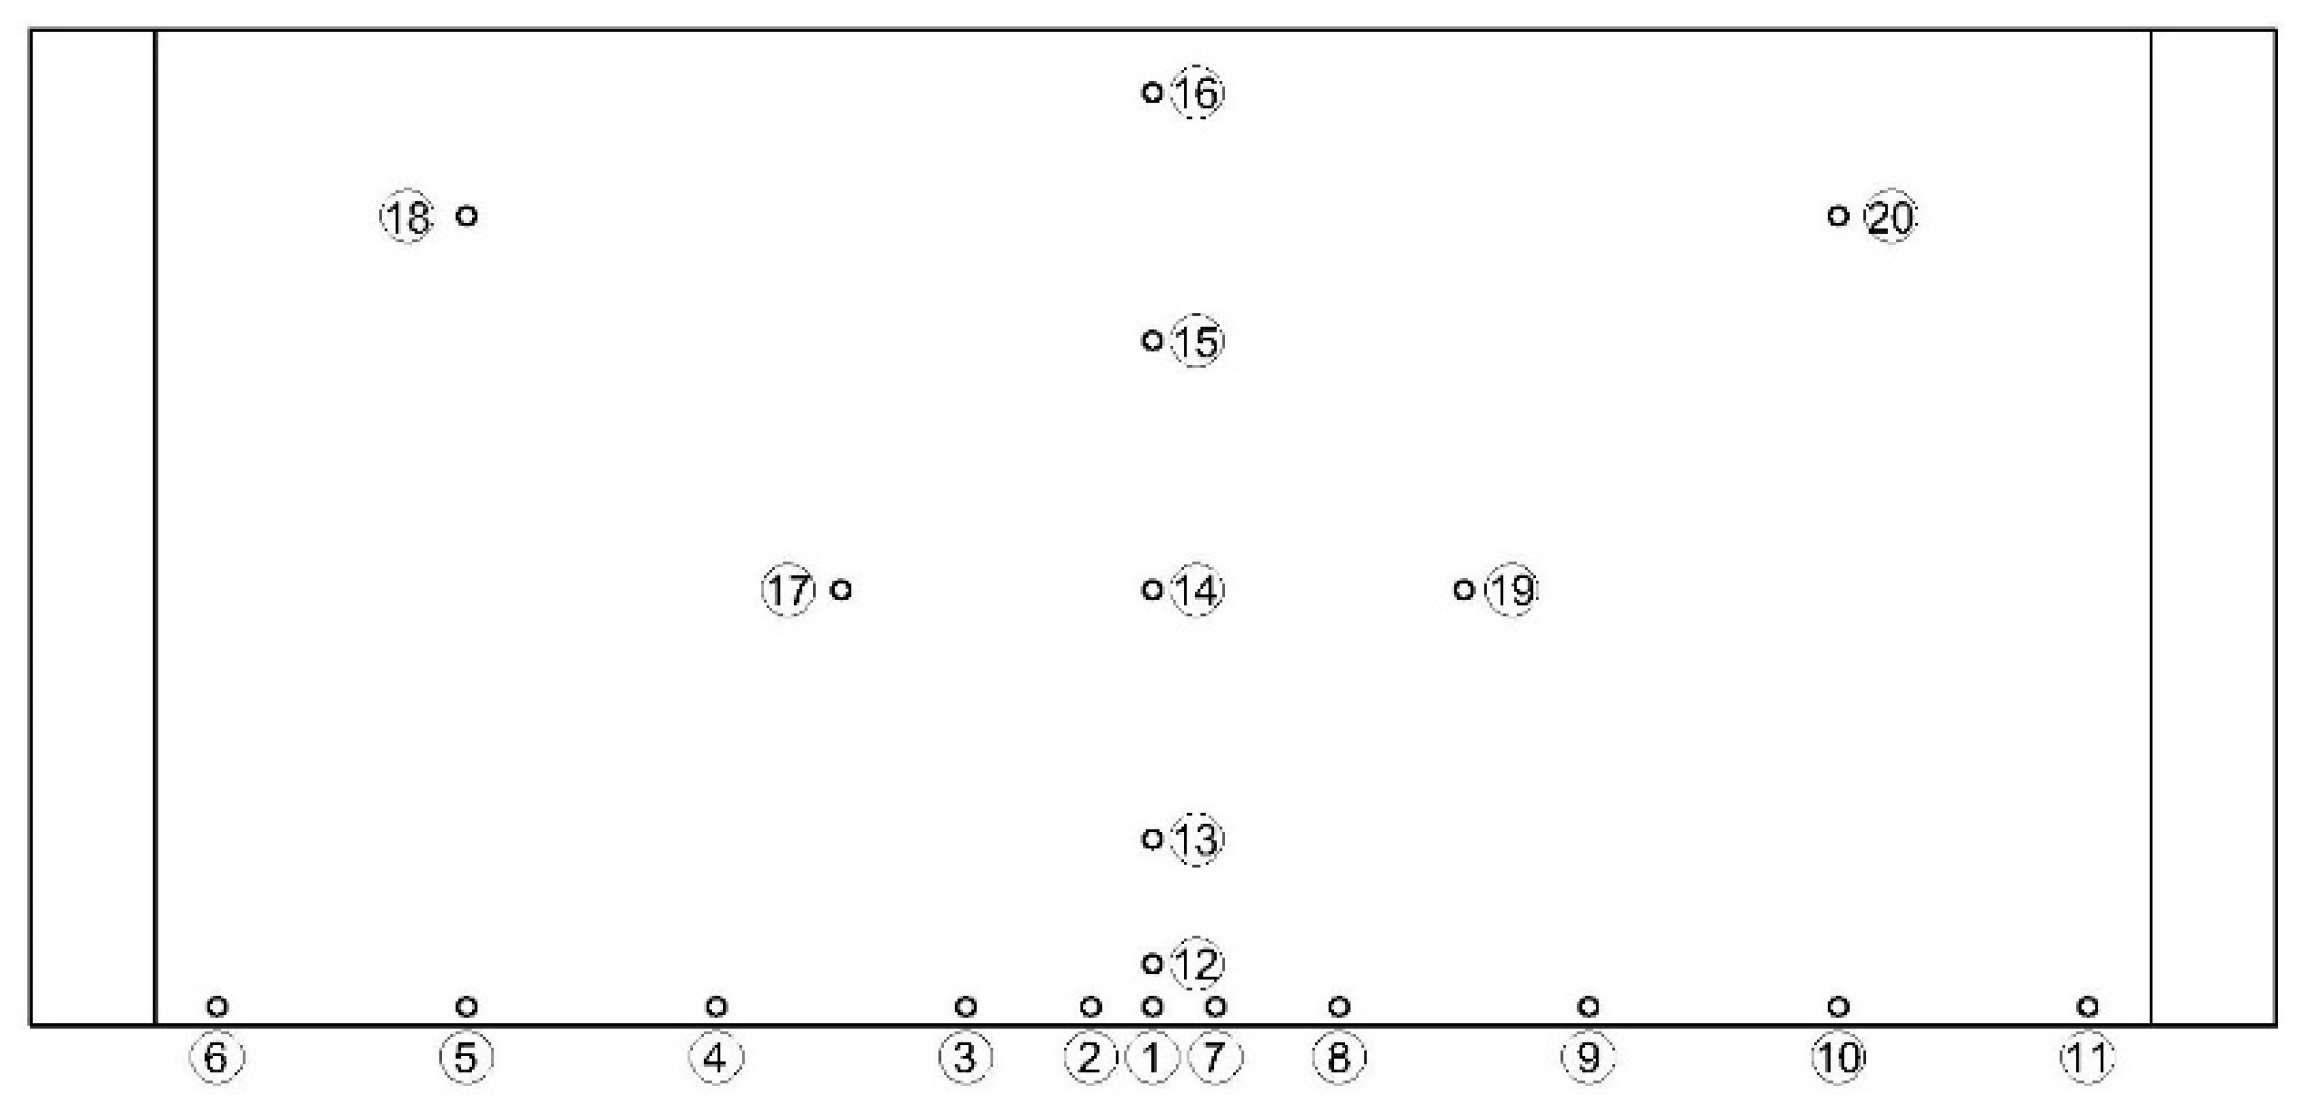
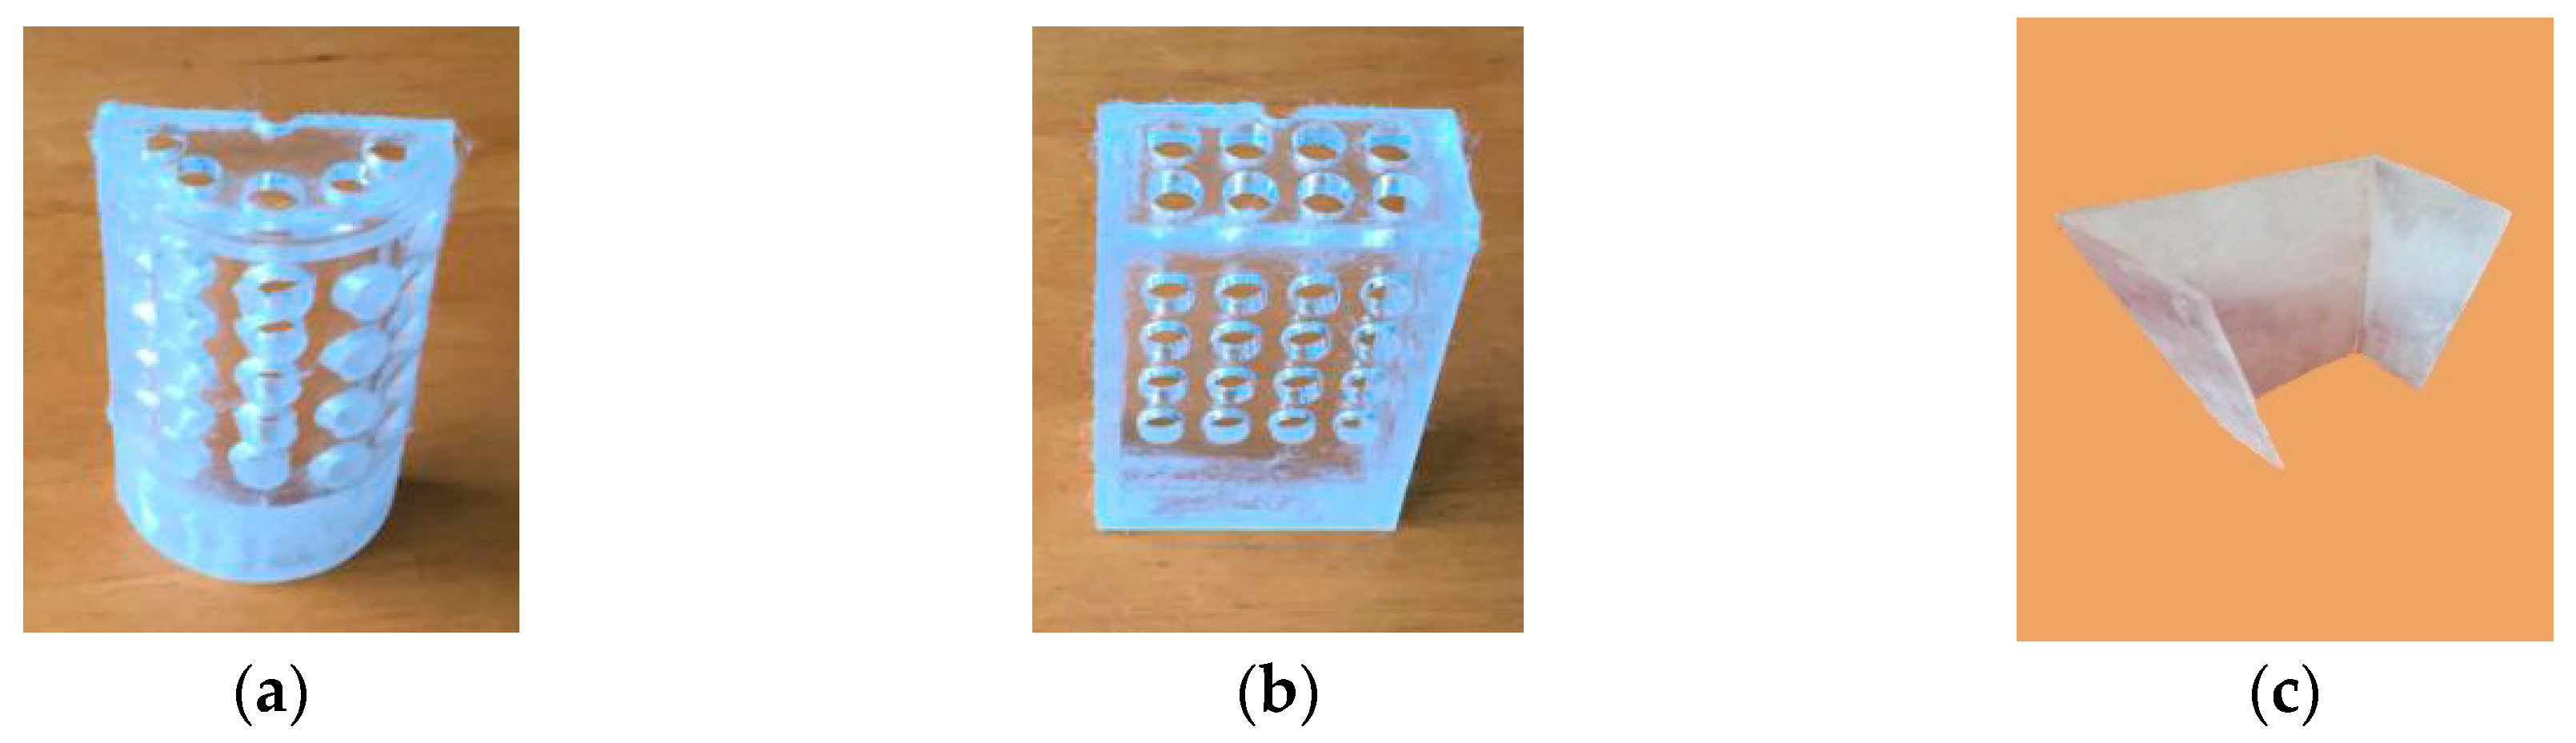
The sand tank mode is shown in Figure 4, the sand tank was a steel frame structure with transparent organic glass on each side, and allowed a direct observation of the loading and flowing state of the medium. The sand tank was 1.8 × 0.8 × 1.3 m (length × width × height), which was divided into three parts. The middle part was a 1.6 m medium-filled area and the other two part were the regulating tanks with a length of 0.1 m on both sides. There was a porous baffle plate between the medium-filled area and the regulating tank. In order to realize the constant water head, a valve was installed in the regulating tank to control its water level. Twenty piezometric tubes were arranged at the bottom of the medium-filling area to measure the water head of each part of the sand tank, during the recharge process, among them, No. 1–11 piezometric tube was symmetrically distributed along the recharge well, as shown in Figure 5. As a result of simulating a half-well test, the recharge wellhead model, the recharge well model, and the aquifer model were also made in half. Since the sand tank and the recharge well were both symmetrical in structure, a rectangular sand tank was used to simulate a semicircular aquifer. An organic glass pipe with a diameter of 20 mm and a length of about 1.0 m was divided into half, along the diameter, which was used to simulate a half recharge well and was closely-bonded and fixed to the middle of the front wall of the sand tank. Considering the actual proportional relationship between the recharge wellhead and the ordinary recharge well, the ratio of each recharge wellhead model was 1:25. The IAF recharge-pumping wellhead model had a height of 60 mm with an outer diameter of 40 mm. For comparative analysis, the recharge pool model was also made at a ratio of 1:25 and its bottom sizes and top sizes were 40 × 20 mm and 40 × 80 mm, respectively, as shown in Figure 6. The organic glass pipe used to simulate the recharge well, was used to open the hole and wrap the filter screen, which not only prevented the sand particles from entering the well, but also prevented the fine particles of the recharge water from entering the aquifer. The design’s open porosity was 20%. According to the aquifer conditions of the Luyangpu groundwater reservoir of the Pingtan Island, the stratum in the recharge test was divided into three layers and placed in the medium-filling area—the first layer was coarse sand (48 cm thickness), the second layer was clay (16 cm thickness), and the third layer was coarse sand (12 cm thickness), again. The sand sample used natural river sand, with an average particle size of 0.836 mm. The coefficient of uniformity was 3.20, and the coefficient of curvature was 1.18, which was classified as non-performing coarse sand. The dry density of the sand was controlled in the range of 1.44–1.50 g/cm3, and the hydraulic conductivity was 3.07–3.55 × 10⁻⁴ m/s. When the sand sample was filled, it was evenly scattered, loaded in layers, and compacted layer by layer. At the same time, the gas in the sand was gradually exhausted with water.
The filter layer of the recharge-pumping wellhead used the geotextile. The composite hydraulic conductivity of the geotextile and the wall of the recharge-pumping wellhead (about 20% open porosity) was 6.2 × 10⁻⁴ m/s.
3.2. Methods
Four groups of the recharge tests of the fully-penetrating well in the unconfined aquifer were simulated. (1) The recharge test of the artificial recharge well; (2) the recharge test of the existing anti-filtration recharge well; (3) the recharge test of the round IAF recharge-pumping well; and (4) the recharge test of the square IAF recharge-pumping well.
In order to explore the effect of the pumping pipe on the single-well recharge quantity, a comparative recharge test was carried out. Taking the round IAF recharge-pumping well and the round IAF recharge well as an example, the main difference between them was whether there was a pumping pipe.
At the beginning of the test, the water flowed from the water supply pipe into the flume. After the water supply switch was turned on, a part of the water in the flume infiltrated into the recharge well, and the other part flowed out from the other end of the flume. The water in the recharge well flowed horizontally into the aquifer and then into the regulating tank, through the porous baffle plate. During the test, the water supply switch and the regulating tank valve were adjusted to maintain the water level of the recharge flume at 92 cm and the water level of the regulating tanks was 20 cm (taking the bottom of the rectangular sand tank as the 0 cm benchmark elevation), which formed a constant supply of water head and a fixed water head boundary, to simulate the process of steady-flow recharge. When the water level was stable, we considered that the amount of water flowing out of the regulating tank, at a certain time, was equal to the single-well recharge quantity. In the test, the water head value of the piezometer tube, in each group of tests, was recorded and the amount of recharged water collected was measured, along with the time taken.
4. Results and Discussion
4.1. Test Results
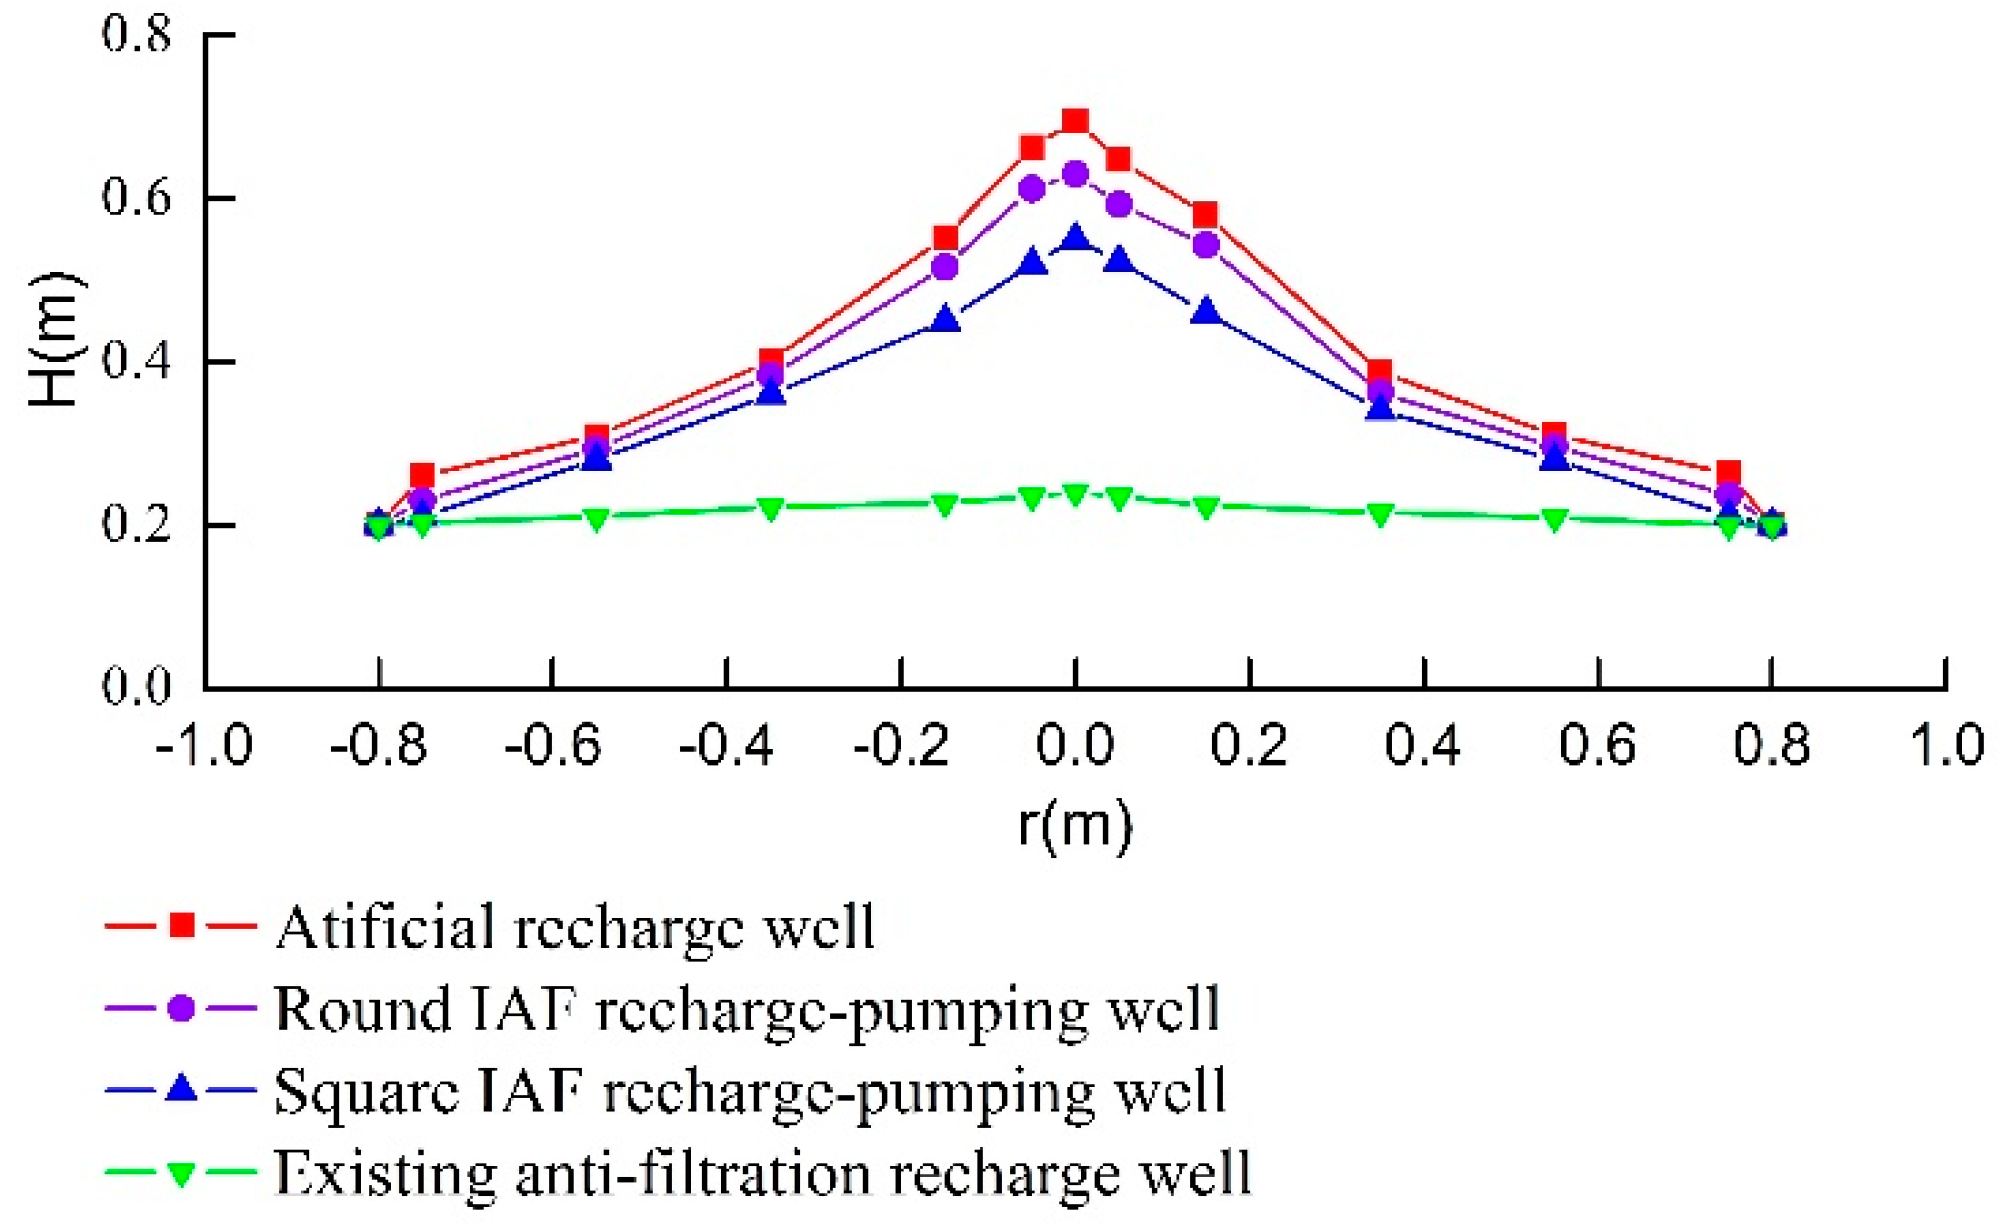
The single-well recharge quantities of the four recharge tests are presented in Table 1. The single-well recharge quantity of the comparative recharge test is presented in Table 2. The water head of the four recharge tests was measured by the piezometric tubes (No. 1–11), as shown in Figure 7.
(1) Under the same test conditions, the groundwater level of the artificial recharge well was the highest, followed by the round IAF recharge-pumping well, the square IAF recharge-pumping well, and the existing anti-filtration recharge well.
(2) Under the same test conditions, the single-well recharge quantity of the existing anti-filtration recharge well, the round IAF recharge-pumping well, and the square IAF recharge-pumping well were 14.4%, 59.8%, and 58.4% of the recharge quantity of the artificial recharge well, respectively.
(3) Under the same test conditions, compared to the existing anti-filtration recharge well, the single-well recharge quantity of the IAF recharge-pumping well increased by, approximately, four-times.
(4) Under the same test conditions, compared with IAF recharge-pumping well, the single-well recharge quantity of the IAF recharge well increased by about 3%.
4.2. Experimental Verification of the Theoretical Calculation Equation of the Single-Well Recharge Quantity
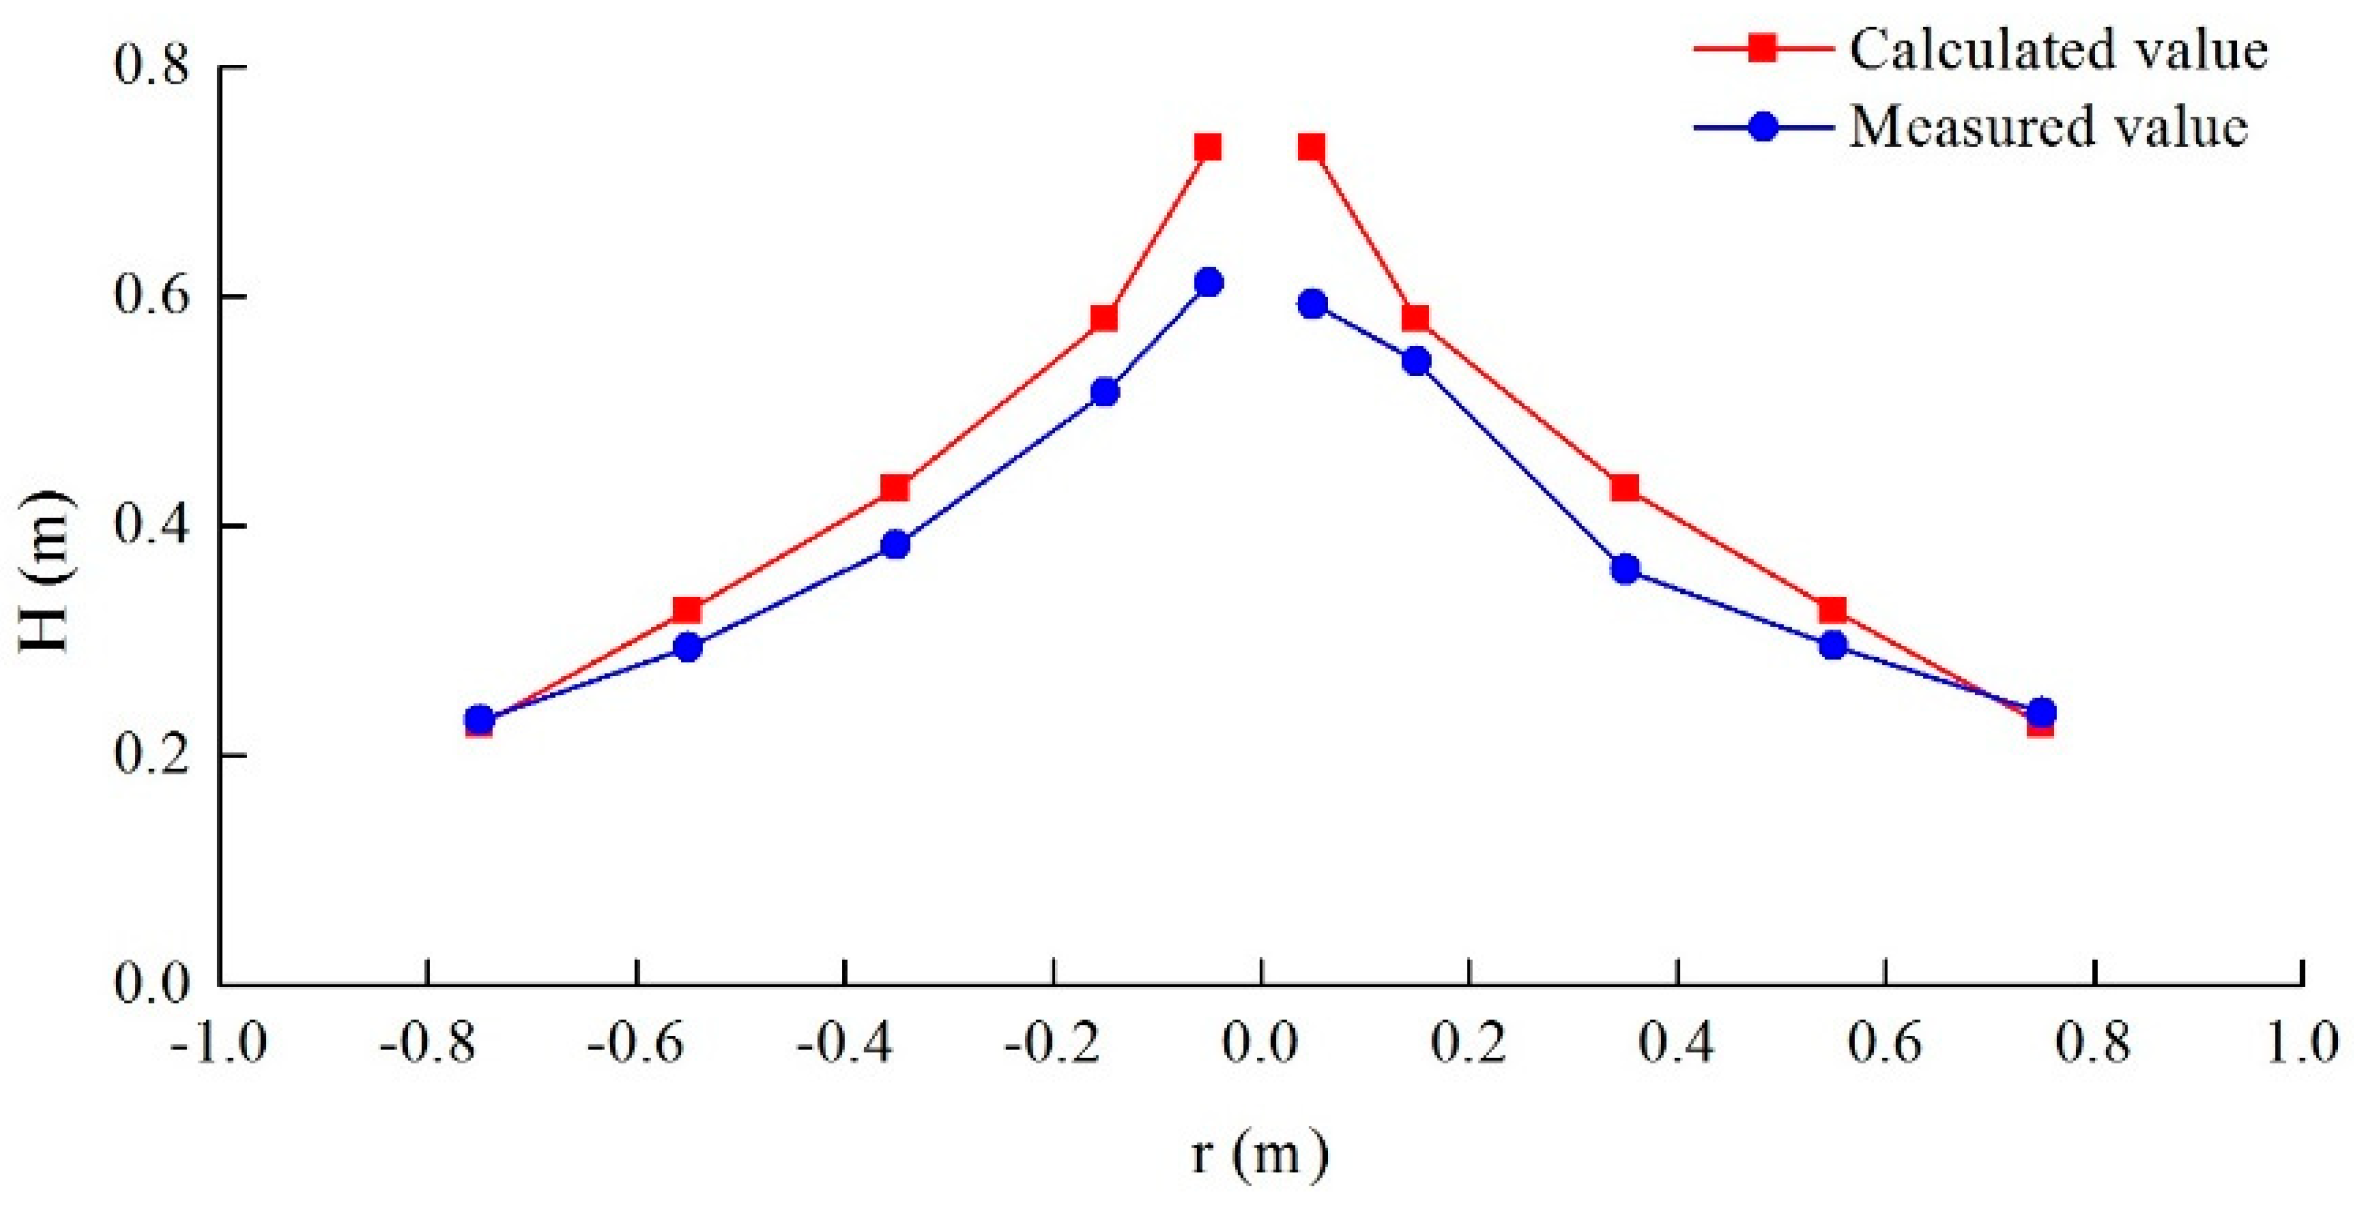
Taking the round IAF recharge-pumping well as an example, through the comparison and analysis of the groundwater level between the measured value (measured by piezometric tubes No. 1–11) and the calculated value of the theoretical equations (Equation (6)), the rationale of the theoretical equations of the single-well recharge quantity can be verified.
The comparison of the groundwater level between the calculated value and the measured value in the laboratory recharge test is presented in Figure 8.
We can observe the following from Figure 8.
(1) The calculated values showed a similar regularity with the measured values.
(2) The fitting degree between the calculated values and the measured values was relatively good in the low-water levels, and the average difference was 7.33%. However, there was a certain gap between the calculated value and the measured value in the high-water levels, and the average difference was 12.87%. The reasons, for this, were as follows: (1) The calculated value of the groundwater level represented the groundwater level, but the measured value of the groundwater level denoted the water head value of the corresponding bottom position of the rectangular sand tank. (2) The water flow contained air bubbles and fine particles, when the water flowed from the recharge well into the aquifer, and these air bubbles and fine particles would have attached to the sidewall of the well and the aquifer surrounding the recharge well, which would result in a blockage and a certain head loss. Therefore, there was a large gap between the measured value and the calculated value, near the recharge well. However, the aquifer away from the recharge well was less influenced by the blockage, hence the gap between the measured value and the calculated value got smaller. (3) The fine particles of the upper sand layer would be brought to the bottom of the sand layer by the oblique flow and the vertical flow around the recharge well, which led to a larger water head loss. However, horizontal flow mainly existed in the sand layer, near the end of the sand tank, and the fine particles showed a little sinkage, meanwhile, some fine particles were taken away from the aquifer by the horizontal flow and discharged into the regulating tank, which resulted in a relatively small water head loss. Therefore, the calculated values agreed well with the measured value, in the low-water level, but there was a certain gap between them, in the high-water level.
The above analysis shows that the theoretical calculation equation of single-well recharge quantity is reasonable.
4.3. Influence of the Wellhead Types on the Single-Well Recharge Quantity
The following could be observed from the analysis of the single-well recharge quantity (see Table 1) and the measured values of the groundwater level of the different wellheads (see Figure 7):
(1) The wellhead type affected the single-well recharge quantity; when the recharge water flowed through the recharge pool or the recharge wellhead, the comprehensive head loss of the existing recharge pool was the largest, followed by the square IAF recharge-pumping wellhead, and the round IAF recharge-pumping wellhead. The recharge pool exhibited the largest reduction.
(2) Compared with the anti-filtration recharge well, the single-well recharge quantity of the IAF recharge-pumping well increased by, approximately, four-times. The maximum cross section area of the recharge-pumping wellhead was 1/5–1/4 of the recharge pool, and the flow section area was 1.17–1.38 times the recharge pool, illustrating that the recharge-pumping wellhead had a small covered area and had a large recharge quantity.
(3) Due to the flow-section area, the square recharge-pumping wellhead were 1.18 times that of the round recharge-pumping wellhead. In general, the single-well recharge quantity of the square IAF recharge-pumping well should be 1.18 times that of the round IAF recharge-pumping well. However, the recharge tests showed that the single-well recharge quantity of the square IAF recharge-pumping well was smaller than the single-well quantity of the round IAF recharge-pumping well, due to the following reasons. The section profile of the round recharge-pumping wellhead and the recharge well were both round, when the water flowed from the wellhead into the recharge well, the water flow was relatively smooth with a small head loss but a relatively large recharge quantity. However, the shape of the square recharge-pumping wellhead was different from the recharge well, since the water flow was not smooth with the large head loss, and the single-well recharge quantity was relatively small.
4.4. Influence of the Recharge Test Times on the Single-Well Recharge Quantity
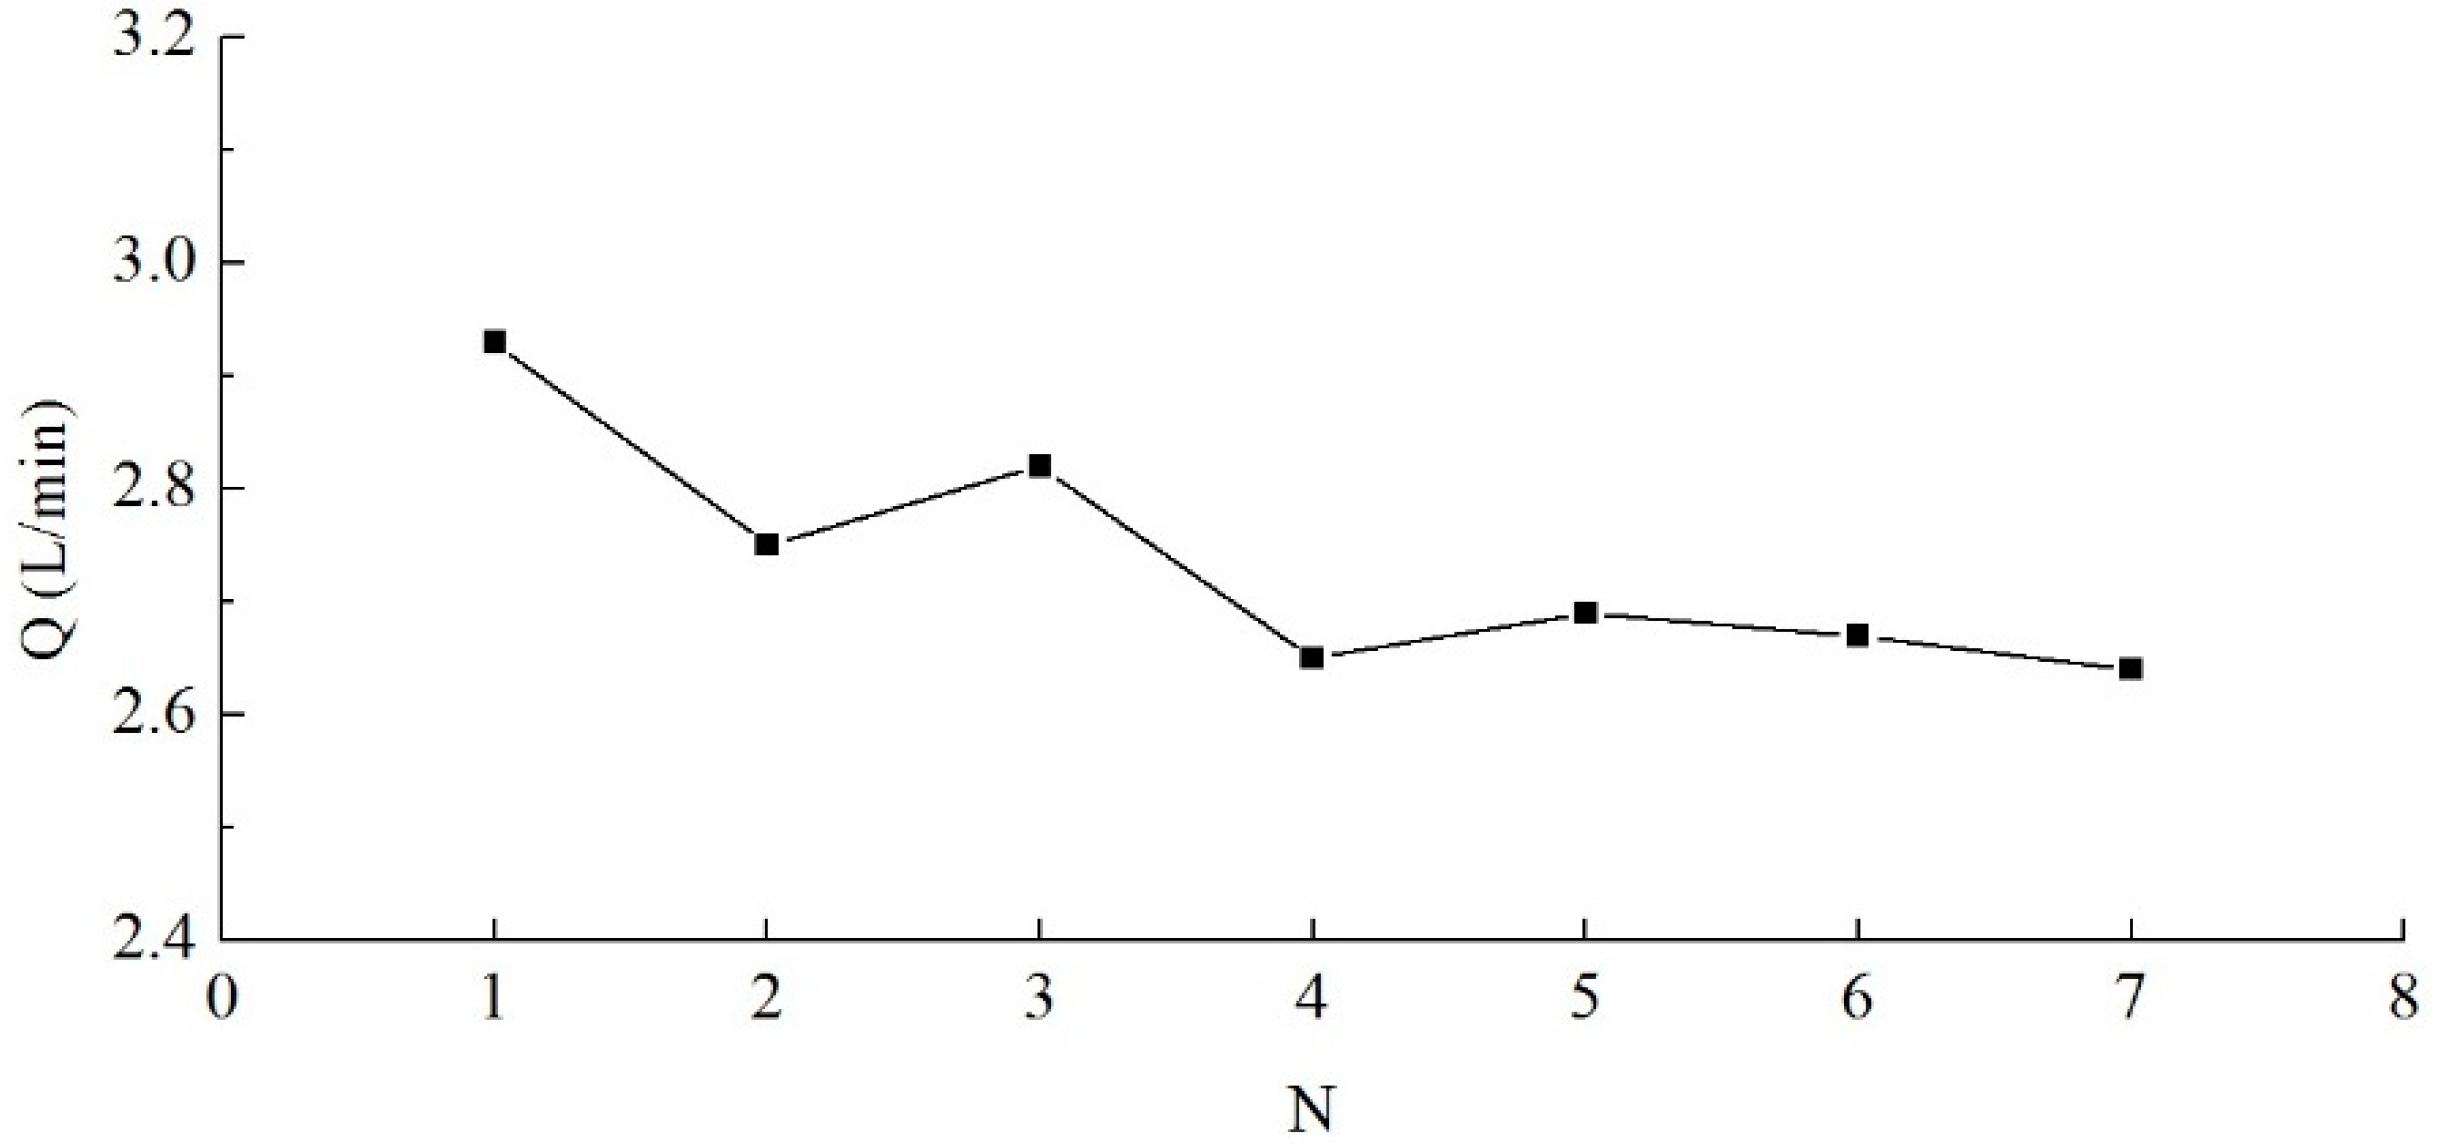
Taking the round IAF recharge-pumping well as an example. Under the same test conditions, a total of seven groups of recharge tests were carried out. Each group test was recharged for 5 min, and a total of seven sets of the single-well recharge quantity was measured. Figure 9 shows the relation curve between the single-well recharge quantity Q and the recharge test time N, in a successive recharge test.
Figure 9 illustrates that the single-well recharge quantity of the first recharge test was the largest during a successive recharge test. With an increasing number of recharge tests, the single-well recharge quantity gradually decreased and tended to be stable. The stable single-well recharge quantity was approximately 89% of the first one.
The main reasons for this phenomenon were as follows:
The recharge water was mixed with certain air bubbles and impurities, so it would form closed bubbles which would gradually accumulate. These closed bubbles and the impurities in the sand layer pore would form a blockage that would gradually accumulate. The blockage would reduce the single-well recharge quantity. As the recharge test continued, the unstable closed bubbles and impurities in the sand layer pore would be taken away by the groundwater flow and discharged into the regulating tank. Relatively stable closed bubbles and impurities in the sand layer pore would stay and form a relatively stable blockage, and the single-well recharge quantity would be relatively stable.
4.5. Influence of the Pumping Pipe on the Single-Well Recharge Quantity
In order to explore the effect of the pumping pipe on the single-well recharge quantity, a comparative test was carried out. Taking two wellheads with the same shape and open porosity as an example—an IAF recharge-pumping wellhead and an IAF recharge wellhead without the pumping pipe. Under the same test conditions, the single-well recharge quantity of IAF recharge well was 2.61 L/min and the single-well recharge quantity of the IAF recharge-pumping well was 2.53 L/min, as shown in Table 2. Compared with IAF recharge-pumping well, the single-well recharge quantity of the IAF recharge well increased by about 3%. This showed that the pumping pipe did not have much influence on the single-well recharge quantity.
5. Conclusions
On the basis of analyzing the shortcomings of the existing anti-filtration recharge wells in the recharge process, and according to the actual demand of groundwater recharge in the Pingtan Island, the IAF recharge-pumping well was developed, the theoretical calculations of a single-well recharge quantity of the IAF recharge-pumping well in unconfined aquifer was derived, and the laboratory steady-state flow test was designed and carried out. From the above recharge tests and analysis, we can draw the following conclusions:
(1) Compared with the existing anti-filtration recharge well, the single-well recharge quantity of the square IAF recharge-pumping well and the round IAF recharge-pumping well increased by 405% and 414%, respectively, and the anti-deposit and anti-scour capabilities were improved, effectively.
(2) Compared with the square IAF recharge-pumping well, the round IAF recharge-pumping well had a better inlet flow pattern and a larger single-well recharge quantity.
(3) The theoretical calculations of the single-well recharge quantity was reasonable, as was observed by comparing the fitting degree between calculated value and measured value. These theoretical equations could be used to analyze and calculate the single-well recharge quantity of the IAF recharge-pumping wells.
(4) Among successive recharge tests, the first test of the IAF recharge-pumping well had the maximum single-well recharge quantity. With increasing number of recharge tests, the single-well recharge quantity decreased, gradually, and tended to stabilize, eventually.
(5) Under the same conditions, the existence of the pumping pipe had a little influence on the single-well recharge quantity.
Author Contributions
This paper was composed by collaboration among all authors. W.L. designed this study, provided the method and revised the manuscript. Y.L. carried out the data analysis and prepared the first draft of the manuscript. J.H. helped perform the recharge test. X.Z. and X.L. supported this manuscript.
Funding
This work was financially supported by the Shandong Province Science and Technology Development Plans (2013GSF11606), the Natural Science Foundation of the Shandong province (ZR2014EFM023), and the Public Special Scientific Research of the Ministry of Water Resources (201401024).
Acknowledgments
All authors are very grateful to the editor and the three anonymous reviewers for their valuable comments, which have greatly improved the paper.
Conflicts of Interest
The authors declare no conflict of interest.
References
- Taherdangkoo, R.; Abdideh, M. Application of wavelet transform to detect fractured zones using conventional well logs data (Case study: Southwest of Iran). Int. J. Petrol. Eng. 2016, 2, 125–139. [Google Scholar] [CrossRef]
- Taherdangkoo, R.; Abdideh, M. Fracture density estimation from well logs data using regression analysis: validation based on image logs (Case study: South West Iran). Int. J. Petrol. Eng. 2016, 2, 289–301. [Google Scholar] [CrossRef]
- Taherdangkoo, M.; Taherdangkoo, R. Modified BNMR algorithm applied to Loney’s solenoid benchmark problem. Int. J. Int. J. Appl. Electrom. 2014, 46, 683–692. [Google Scholar]
- Yan, J.; Zhang, Y.; Zhang, J.; Yang, X. The method of urban rain-flood utilization based on environmental protection. Energy Procedia 2011, 5, 403–407. [Google Scholar] [CrossRef]
- Hung Vu, V.; Merkel, B.J. Estimating groundwater recharge for Hanoi, Vietnam. Sci. Total Environ. 2018, 651, 1047–1057. [Google Scholar] [CrossRef]
- Hund, S.V.; Allen, D.M.; Morillas, L.; Johnson, M.S. Groundwater recharge indicator as tool for decision makers to increase socio-hydrological resilience to seasonal drought. J. Hydrol. 2018, 563, 1119–1134. [Google Scholar] [CrossRef]
- Eastwood, J.C.; Stanfield, P.J. Key success factors in an ASR scheme. Q. J. Eng. Geol. Hydrogeol. 2001, 34, 399–409. [Google Scholar] [CrossRef]
- Handel, F.; Liu, G.S.; Dietrich, P.; Liedl, R.; Butler, J.J., Jr. Numerical assessment of ASR recharge using small-diameter wells and surface basins. J. Hydrol. 2014, 517, 54–63. [Google Scholar] [CrossRef]
- Page, D.W.; Peeters, L.; Vanderzalm, J.; Barry, K.; Gonzalez, D. Effect of aquifer storage and recovery (ASR) on recovered stormwater quality variability. Water Res. 2017, 117, 1–8. [Google Scholar] [CrossRef]
- Vries, J.J.D.; Simmers, I. Groundwater recharge: an overview of processes and challenges. Hydrogeol. J. 2002, 10, 5–17. [Google Scholar] [CrossRef]
- Clark, R.; Gonzalez, D.; Dillon, P.; Charles, S.; Cresswell, D.; Naumann, B. Reliability of water supply from stormwater harvesting and managed aquifer recharge with a brackish aquifer in an urbanising catchment and changing climate. Environ. Model. Softw. 2015, 72, 117–125. [Google Scholar] [CrossRef]
- Wu, X.F.; Tang, J. Artificial recharge and reuse of groundwater. Eng. Invest. Surv. 1998, 4, 37–42. [Google Scholar]
- Leach, B. The development of a groundwater recharge model for Hong Kong. Int. Assoc. Sci. Hydrol. Bull. 1982, 27, 469–491. [Google Scholar] [CrossRef] [Green Version]
- Majumdar, P.K.; Ram, S.; Rao, P.R. Artificial Recharge in Multiaquifers of a Mountainous Watershed. J. Hydrol. Eng. 2009, 14, 215–222. [Google Scholar] [CrossRef]
- Minnig, M.; Moeck, C.; Radny, D.; Schirmer, M. Impact of urbanization on groundwater recharge rates in Dübendorf, Switzerland. J. Hydrol. 2017, 563, 1135–1146. [Google Scholar] [CrossRef]
- Liu, Y.Y.; Jiang, X.; Zhang, G.X.; Xu, J.; Wang, X.H.; Qi, P. Assessment of Shallow Groundwater Recharge from Extreme Rainfalls in the Sanjiang Plain, Northeast China. Water 2016, 8, 440. [Google Scholar] [CrossRef]
- Zheng, G.; Cao, J.R.; Cheng, X.S.; Ha, D.; Wang, F.J. Experimental study on the artificial recharge of semiconfined aquifers involved in deep excavation engineering. J. Hydrol. 2018, 557, 868–877. [Google Scholar] [CrossRef]
- Li, W.L.; Shu, L.C.; Yin, Z.Z. Concept and design theory of groundwater reservoir. J. Hydraul. Eng. 2006, 37, 613–618. [Google Scholar]
- Li, W.L. Structure design theory and method of recharge well with filter layer. Groundwater 2009, 31, 126–129. [Google Scholar]
- Li, W.L.; Li, Y.T. Influence of Sediments on Permeability of Recharge Well with Filter Layer during Artificial Recharge of Groundwater. Adv. Mater. Res. 2011, 255–260, 2806–2809. [Google Scholar] [CrossRef]
- Jha, M.K.; Chikamori, K.; Kamii, Y.; Yamasaki, Y. Field Investigations for Sustainable Groundwater Utilization in the Konan Basin. Water Resour. Manag. 1999, 13, 443–470. [Google Scholar] [CrossRef]
- Zhang, M.L.; Chen, H.; Wang, J.Z.; Pan, J. Rainwater utilization and storm pollution control based on urban runoff characterization. J. Environ. 2010, 22, 40–46. [Google Scholar] [CrossRef] [Green Version]
- Song, M.; Wang, R. Water resources utilization efficiency and influence factors under environmental restrictions. J. Clean. Prod. 2018, 184, 611–621. [Google Scholar] [CrossRef]
- He, J.P.; Li, W.L.; Lu, H.Y.; Wei, P.K.; Gao, S. Laboratory Steady-State Flow Tests of Round Dual Infiltration Recharge Well with Filter Layer. Presented at the International Conference on Water Conservancy, Hydropower and Building Engineering, Guangzhou, China, 28 December 2017. [Google Scholar]
Figure 1.
Diagram of the existing anti-filtration recharge well, (a) the existing anti-filtration recharge well profile, and (b) the recharge pool profile.
Figure 1.
Diagram of the existing anti-filtration recharge well, (a) the existing anti-filtration recharge well profile, and (b) the recharge pool profile.

Figure 2.
Structural diagram of the IAF pumping-recharge well. Figure (a): 1—Geotextile; 2—Wellheadl; 3—Submersible pump; 4—Water pipe; 5—Recharge well; 6—Filter material; 7—Submersible pump bracket; 8—Water pump valve; 9—Ground.
Figure 2.
Structural diagram of the IAF pumping-recharge well. Figure (a): 1—Geotextile; 2—Wellheadl; 3—Submersible pump; 4—Water pipe; 5—Recharge well; 6—Filter material; 7—Submersible pump bracket; 8—Water pump valve; 9—Ground.

Figure 3.
Steady-flow recharge model of the recharge-pumping well.

Figure 4.
The laboratory recharge test equipment.

Figure 5.
Arrangement of the piezometric tubes at the bottom of the recharge equipment.

Figure 6.
Wellhead model during the recharge test. (a) Round IAF wellhead; (b) square IAF wellhead; and (c) recharge pool.
Figure 6.
Wellhead model during the recharge test. (a) Round IAF wellhead; (b) square IAF wellhead; and (c) recharge pool.

Figure 7.
Measured value of the groundwater level.

Figure 8.
Comparison of the calculated value and the measured value.

Figure 9.
Curve between the single-well recharge quantity Q and the repeated recharge test time N.


Table 1.
Results of the laboratory steady-state flow recharge test.
| Name of Recharge Well | Recharge Quantity (L/min) | Flow Section Area of Well Head (cm2) | Maximum Cross Section Area (cm2) |
|---|---|---|---|
| Artificial recharge well | 4.23 | 1.57 | 1.57 |
| Existing anti-filtration recharge well | 0.61 | 32.00 | 32.00 |
| Round IAF recharge-pumping well | 2.53 | 37.68 | 6.28 |
| Square IAF recharge-pumping well | 2.47 | 44.00 | 8.00 |
Table 2.
Single-well recharge quantity of the comparative recharge test.
| Name of Recharge Well | Recharge Quantity (L/min) |
|---|---|
| Round IAF recharge-pumping well | 2.53 |
| Round IAF recharge well | 2.61 |
© 2018 by the authors. Licensee MDPI, Basel, Switzerland. This article is an open access article distributed under the terms and conditions of the Creative Commons Attribution (CC BY) license (http://creativecommons.org/licenses/by/4.0/).
Share and Cite
MDPI and ACS Style
Li, Y.; Li, W.; He, J.; Zhang, X.; Li, X. Infiltration and Anti-Filtration Recharge-Pumping Well and Laboratory Recharge Tests. Water 2018, 10, 1834. https://doi.org/10.3390/w10121834
AMA Style
Li Y, Li W, He J, Zhang X, Li X. Infiltration and Anti-Filtration Recharge-Pumping Well and Laboratory Recharge Tests. Water. 2018; 10(12):1834. https://doi.org/10.3390/w10121834
Chicago/Turabian StyleLi, Yuxi, Wanglin Li, Jiapeng He, Xiaojiao Zhang, and Xinyi Li. 2018. "Infiltration and Anti-Filtration Recharge-Pumping Well and Laboratory Recharge Tests" Water 10, no. 12: 1834. https://doi.org/10.3390/w10121834
Note that from the first issue of 2016, this journal uses article numbers instead of page numbers. See further details here.