Effects of Backwashing on Granular Activated Carbon with Ammonium Removal Potential in a Full-Scale Drinking Water Purification Plant

1
Center of Safe and Energy-Saving Engineering Technology for Urban Water Supply and Drainage System, School of Ecological Environment and Urban Construction, Fujian University of Technology, Fuzhou 350118, Fujian, China
2
Department of Urban Engineering, School of Engineering, The University of Tokyo, 7-3-1 Hongo, Bunkyo-ku, Tokyo 113-8656, Japan
3
Research Center for Water Environment Technology, School of Engineering, The University of Tokyo, 7-3-1 Hongo, Bunkyo-ku, Tokyo 113-8656, Japan
*
Author to whom correspondence should be addressed.
Water 2018, 10(12), 1830; https://doi.org/10.3390/w10121830
Submission received: 19 November 2018
/
Revised: 4 December 2018
/
Accepted: 6 December 2018
/
Published: 11 December 2018
(This article belongs to the Section Wastewater Treatment and Reuse)
Abstract
:Granular activated carbon (GAC) has been widely introduced to advanced drinking water purification plants to remove organic matter and ammonium. Backwashing, which is the routine practice for GAC maintenance, is an important operational factor influencing the performance of GAC and its microbial biomass. In this study, the effects of backwashing on the ammonium removal potential of GAC were evaluated. In addition, abundances of ammonia-oxidizing archaea (AOA) and ammonia-oxidizing bacteria (AOB) on GAC were analyzed. GAC samples before and after backwashing were collected from a full-scale drinking water purification plant. Samplings were conducted before and after implementation of prechlorination of raw water. The results showed that the ammonium removal potential of the GAC increased by 12% after backwashing before prechlorination (p < 0.01). After implementing the prechlorination, the ammonium removal potential of the GAC decreased by 12% even after backwashing (p < 0.01). The AOA was predominant on the GAC in the two samplings. Regardless of prechlorination, the amounts of the AOA and the AOB remained at the same level before and after backwashing. Analysis of the backwashing water indicated that the amounts of the AOA and AOB washed out from the GAC were negligible (0.08%–0.26%) compared with their original amounts on the GAC. These results revealed the marginal role of backwashing on the biomass of ammonia oxidizers on GAC. However, the results also revealed that backwashing could have a negative impact on the ammonium removal potential of GAC during prechlorination.
1. Introduction
Ozonation followed by granular activated carbon (GAC) has been widely installed in drinking water purification plants (DWPPs) to improve water quality [1,2]. GAC has a large specific surface area [3]. While physical adsorption is a major function of GAC, microorganisms proliferating on the surface of GAC play an important role in water purification [4]. The oxidation of ammonium is one of its key biological functions. Waterborne ammonium reacts with chlorine to form monochloramine, which in some countries serves as a long-lasting disinfectant, ensuring pipeline water security [5]. However, ammonium could further react with excessive chlorine and generate odorous trichloramine in the finished water under some conditions [6]. In order to produce high-grade drinking water, trichloramine in finished water must be kept at a nondetectable level (<0.02 mg/L), as required by the Bureau of Waterworks of the Tokyo Metropolitan Government, Japan. Although several studies have discussed the operational and environmental factors influencing the nitrification performance of GAC, such as GAC material, empty bed contact time, GAC aging, backwashing, temperature, and raw water [1,7,8,9], the mechanisms of these effects have not been completely revealed, which has hindered the generalization of the results of these studies to a broad context. Understanding microbial ecology is the key to solving the current problems in water treatment technology and enhancing its performance, because microorganisms are always involved and play a key role in the geochemical cycle [10,11].
It is generally accepted that ammonia oxidation is performed by two groups of ammonia-oxidizing microorganisms: ammonia-oxidizing archaea (AOA) and ammonia-oxidizing bacteria (AOB) [12,13,14]. Although AOA were discovered only a decade ago, they are considered to play an essential role in ammonia oxidation, especially in the oligotrophic environment [10,15,16]. The existence and predominance of AOA on GAC has been reported by several studies [2,17,18]. Moreover, it has been found that the ammonium concentration is critical for the activities of AOA and AOB on GAC [19]. Ozonation is also a key factor determining the community structure of AOA on GAC [18]. Nevertheless, the impact of other factors (environmental and operational factors) of water treatment on the existence and abundance of ammonia oxidizers, as well as the ammonium removal performance of GAC, has not been well elucidated.
In drinking water treatment, backwashing is a routine practice for GAC maintenance. The purpose of backwashing is to reduce clogging, head loss, and unwanted organisms in GAC [20]. Meanwhile, backwashing is an efficient method to maintain the proper biofilm on GAC, because inadequate backwashing leads to the formation of thick biofilm, which can hinder the access of substrates to the microorganisms. On the other hand, a thin biofilm may decrease the performance of GAC because most of the microorganisms will be dislodged by backwashing [21]. Though some studies have demonstrated the effects of backwashing on the microbial biomass of GAC, inconsistent results have been obtained [22,23,24]. Moreover, these results have focused on whole microbial communities, while the effects of backwashing on ammonia-oxidizing microorganisms, which are the functional microbes mediating ammonia oxidation, have rarely been studied. To our knowledge, the only existing study on the impact of backwashing on the nitrifiers of GAC was reported by Laurent et al. [7], and they found that the biomass of the nitrifiers did not change after backwashing. In fact, there are two groups of ammonia oxidizers on GAC, and they have been reported to react differently to environmental factors, such as ammonia concentration and temperature. Therefore, it is necessary to also evaluate the effects of operational factors such as backwashing on their activities and communities.
When the biological activities of GAC decrease in winter, prechlorination or breakpoint chlorination is implemented before coagulation/sedimentation to chemically remove ammonium in the raw water. Moreover, chlorine is an effective disinfectant for controlling microbial activities and growth in the drinking water system [25]. Kasuga et al. [2] reported that prechlorination had a strong negative impact on the ammonia oxidation performance of GAC and the abundances of AOA and AOB on GAC.
In this study, GAC samples were collected from a full-scale DWPP before and after backwashing. The sampling was performed before and after implementing prechlorination in order to evaluate the effects of backwashing and prechlorination on the ammonium removal potential of GAC and the abundances of AOA and AOB associated with GAC. Additionally, the dislodged amounts of AOA and AOB in the backwashing water were measured. The results of this study are useful for understanding the nitrification performance of GAC and optimizing a backwashing program.
2. Materials and Methods
GAC, which had been in use for 19 months, was collected before and after backwashing from a full-scale DWPP in Tokyo in October 2012. The DWPP purifies river water by coagulation/sedimentation, primary sand filtration, ozonation, GAC filtration, and secondary sand filtration. The empty bed contact time of the GAC was 19 min. The GAC was backwashed every 120 hours, and finished water with residual chlorine was used for backwashing. Prechlorination was implemented when water temperature decreased. After prechlorination began, a similar sampling was conducted at the same GAC pond in November 2012.
The backwashing program consists of two phases: (1) lower flow of water (20 m3/min and later 30 m3/min) with air scour (60 m3/min) and (2) higher flow of water. The flow rate of backwashing water changes with time (i.e., 20 m3/min (1–3 min), 30 m3/min (4–10 min), 60 m3/min (11–20 min), 30 m3/min (21–23 min), and 20 m3/min (24–25 min)). Around 2 L of the water samples during backwashing were collected after 3, 8, 13, and 21 min, respectively. The detailed information of the backwashing program and the water sampling times is summarized in Table 1.
The GAC was brought to the laboratory within 1 h, and the ammonium removal potential test was started immediately according to Niu et al. [18]. The ammonium removal potential of the GAC was evaluated by incubating 50 g of wet GAC at 20 °C in 300 mL of inorganic medium (50 mg/L of MgSO4∙7H2O, 20 mg/L of KH2PO4, 20 mg/L of CaCl2∙2H2O, and nonchelated trace elements mixture) containing 1.4 mg N/L of ammonium for 24 h. This batch experiment was carried out in triplicate, and a control without ammonium was also included. The supernatant was collected every 15 min and was filtrated through 0.2-μm pore polytetrafluoroethylene membranes (Advantec, Tokyo, Japan) during the first hour. The ammonium removal potential was estimated by dividing the ammonium removal rate by the dry weight of the GAC. The ammonium concentration in the medium and water samples collected from the effluent of each purification process of DWPP was measured by a spectrophotometer (U2010, Hitachi, Tokyo, Japan) with the indophenol blue colorimetric method.
DNA from the GAC (around 0.5 g in triplicate) and backwashing water samples (around 2 L) were extracted by a FastDNA spin kit for soil (MP-Biomedicals, Santa Ana, CA, USA). The exact weight of the GAC and the volume of water used for the DNA extraction were measured for the calculation of the amounts of AOA and AOB. The archaeal and bacterial amoA genes were measured with a LightCycler 480 II (Roche, Basel, Switzerland). The primers, standards, and PCR program used for quantitative PCR (q-PCR) analysis of the AOA and AOB associated with the GAC and the water samples followed the method described by Niu et al. [18].
Statistical analysis was performed by using SPSS 19.0.
3. Results and Discussion
3.1. Ammonium Concentration in Raw Water and the Effluents of the DWPP
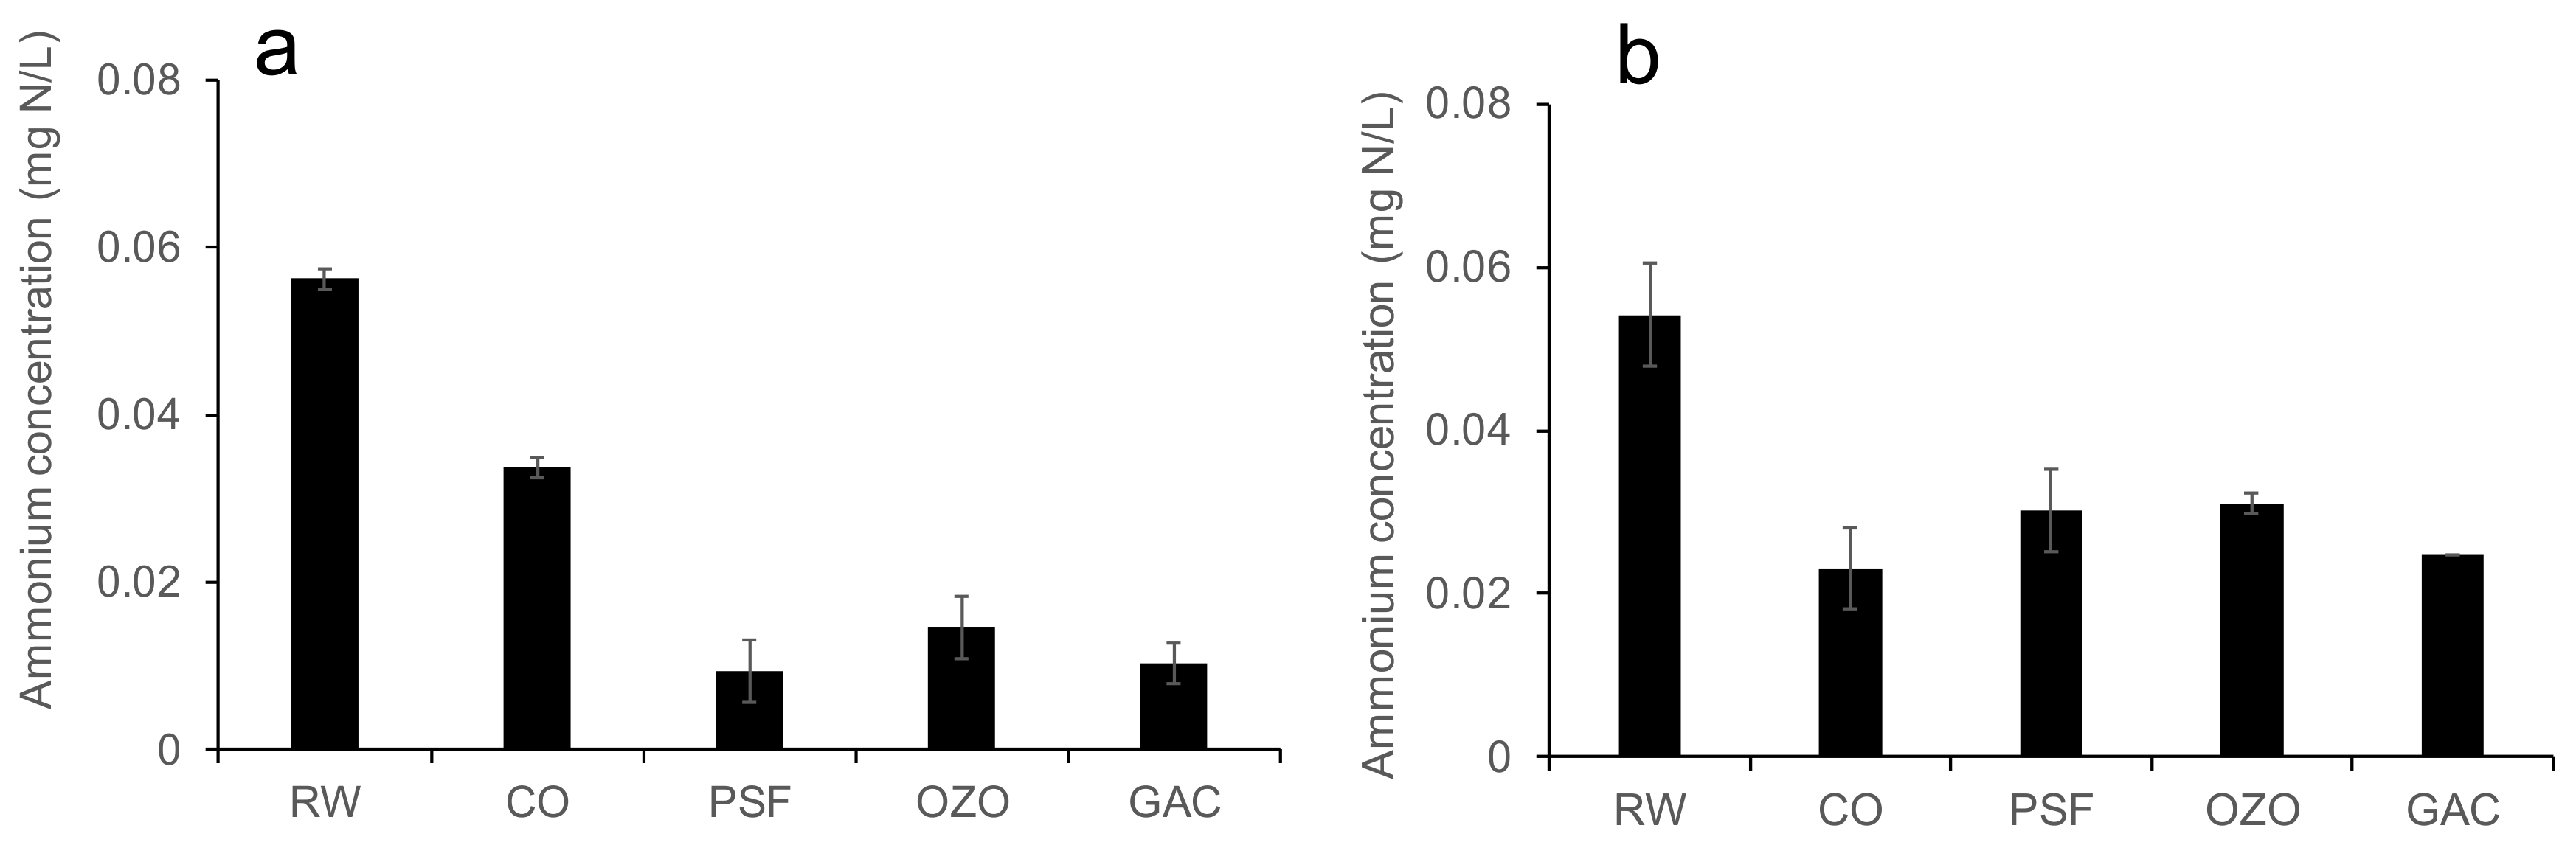
The ammonium concentrations in the raw water and the effluent of the purification processes in the DWPP are shown in Figure 1. The concentration was around 0.05 mg N/L in the raw water of the two samplings (i.e., with or without prechlorination). The significant decreases in the ammonium concentrations in the effluents of coagulation/sedimentation (p < 0.01) in the two samplings were probably due to the effects of physicochemical and electrochemical reactions during the processes of flocculation and sedimentation [23]. The first significant decrease in the ammonium concentration after the primary sand filtration (p < 0.01) in Figure 1a should be attributed to the biological activities of the ammonia-oxidizing microorganisms. However, after starting prechlorination, because of the disinfection effect of prechlorination, the ammonium concentration was not reduced by the primary sand filtration. The significant reduction in the ammonium concentration from coagulation/sedimentation to the GAC effluent was only observed when prechlorination was not implemented. In addition, there was more ammonium left in the GAC effluent (0.02 mg N/L) on the sampling after implementing prechlorination compared with the ammonium concentration (0.01 mg N/L) in the GAC effluent on the sampling before implementing prechlorination. As prechlorination could chemically remove ammonium in the raw water, the reduction of ammonium concentration in the effluent of coagulation/sedimentation during the prechlorination period was higher than that in the coagulation/sedimentation without implementing prechlorination (57% vs. 40%). However, due to the negative impact of chlorine disinfection on microorganisms in the following purification processes (i.e., primary sand filtration and GAC), ammonium concentration could not be further reduced.
3.2. Effects of Backwashing on Ammonium Removal Potential of GAC
Figure 2 shows the changes in the ammonium removal potential of GAC before and after backwashing. Without prechlorination, the ammonium removal potential was 0.040 mg N/L/h/g-dry. It increased by 12% after backwashing (p < 0.01) in the first sampling. On the other hand, the removal potential decreased by 12% after backwashing (from 0.048 to 0.042 mg N/L/h/g-dry) when prechlorination was implemented (p < 0.01).
3.3. Effects of Backwashing on Abundances of AOA and AOB Associated with GAC
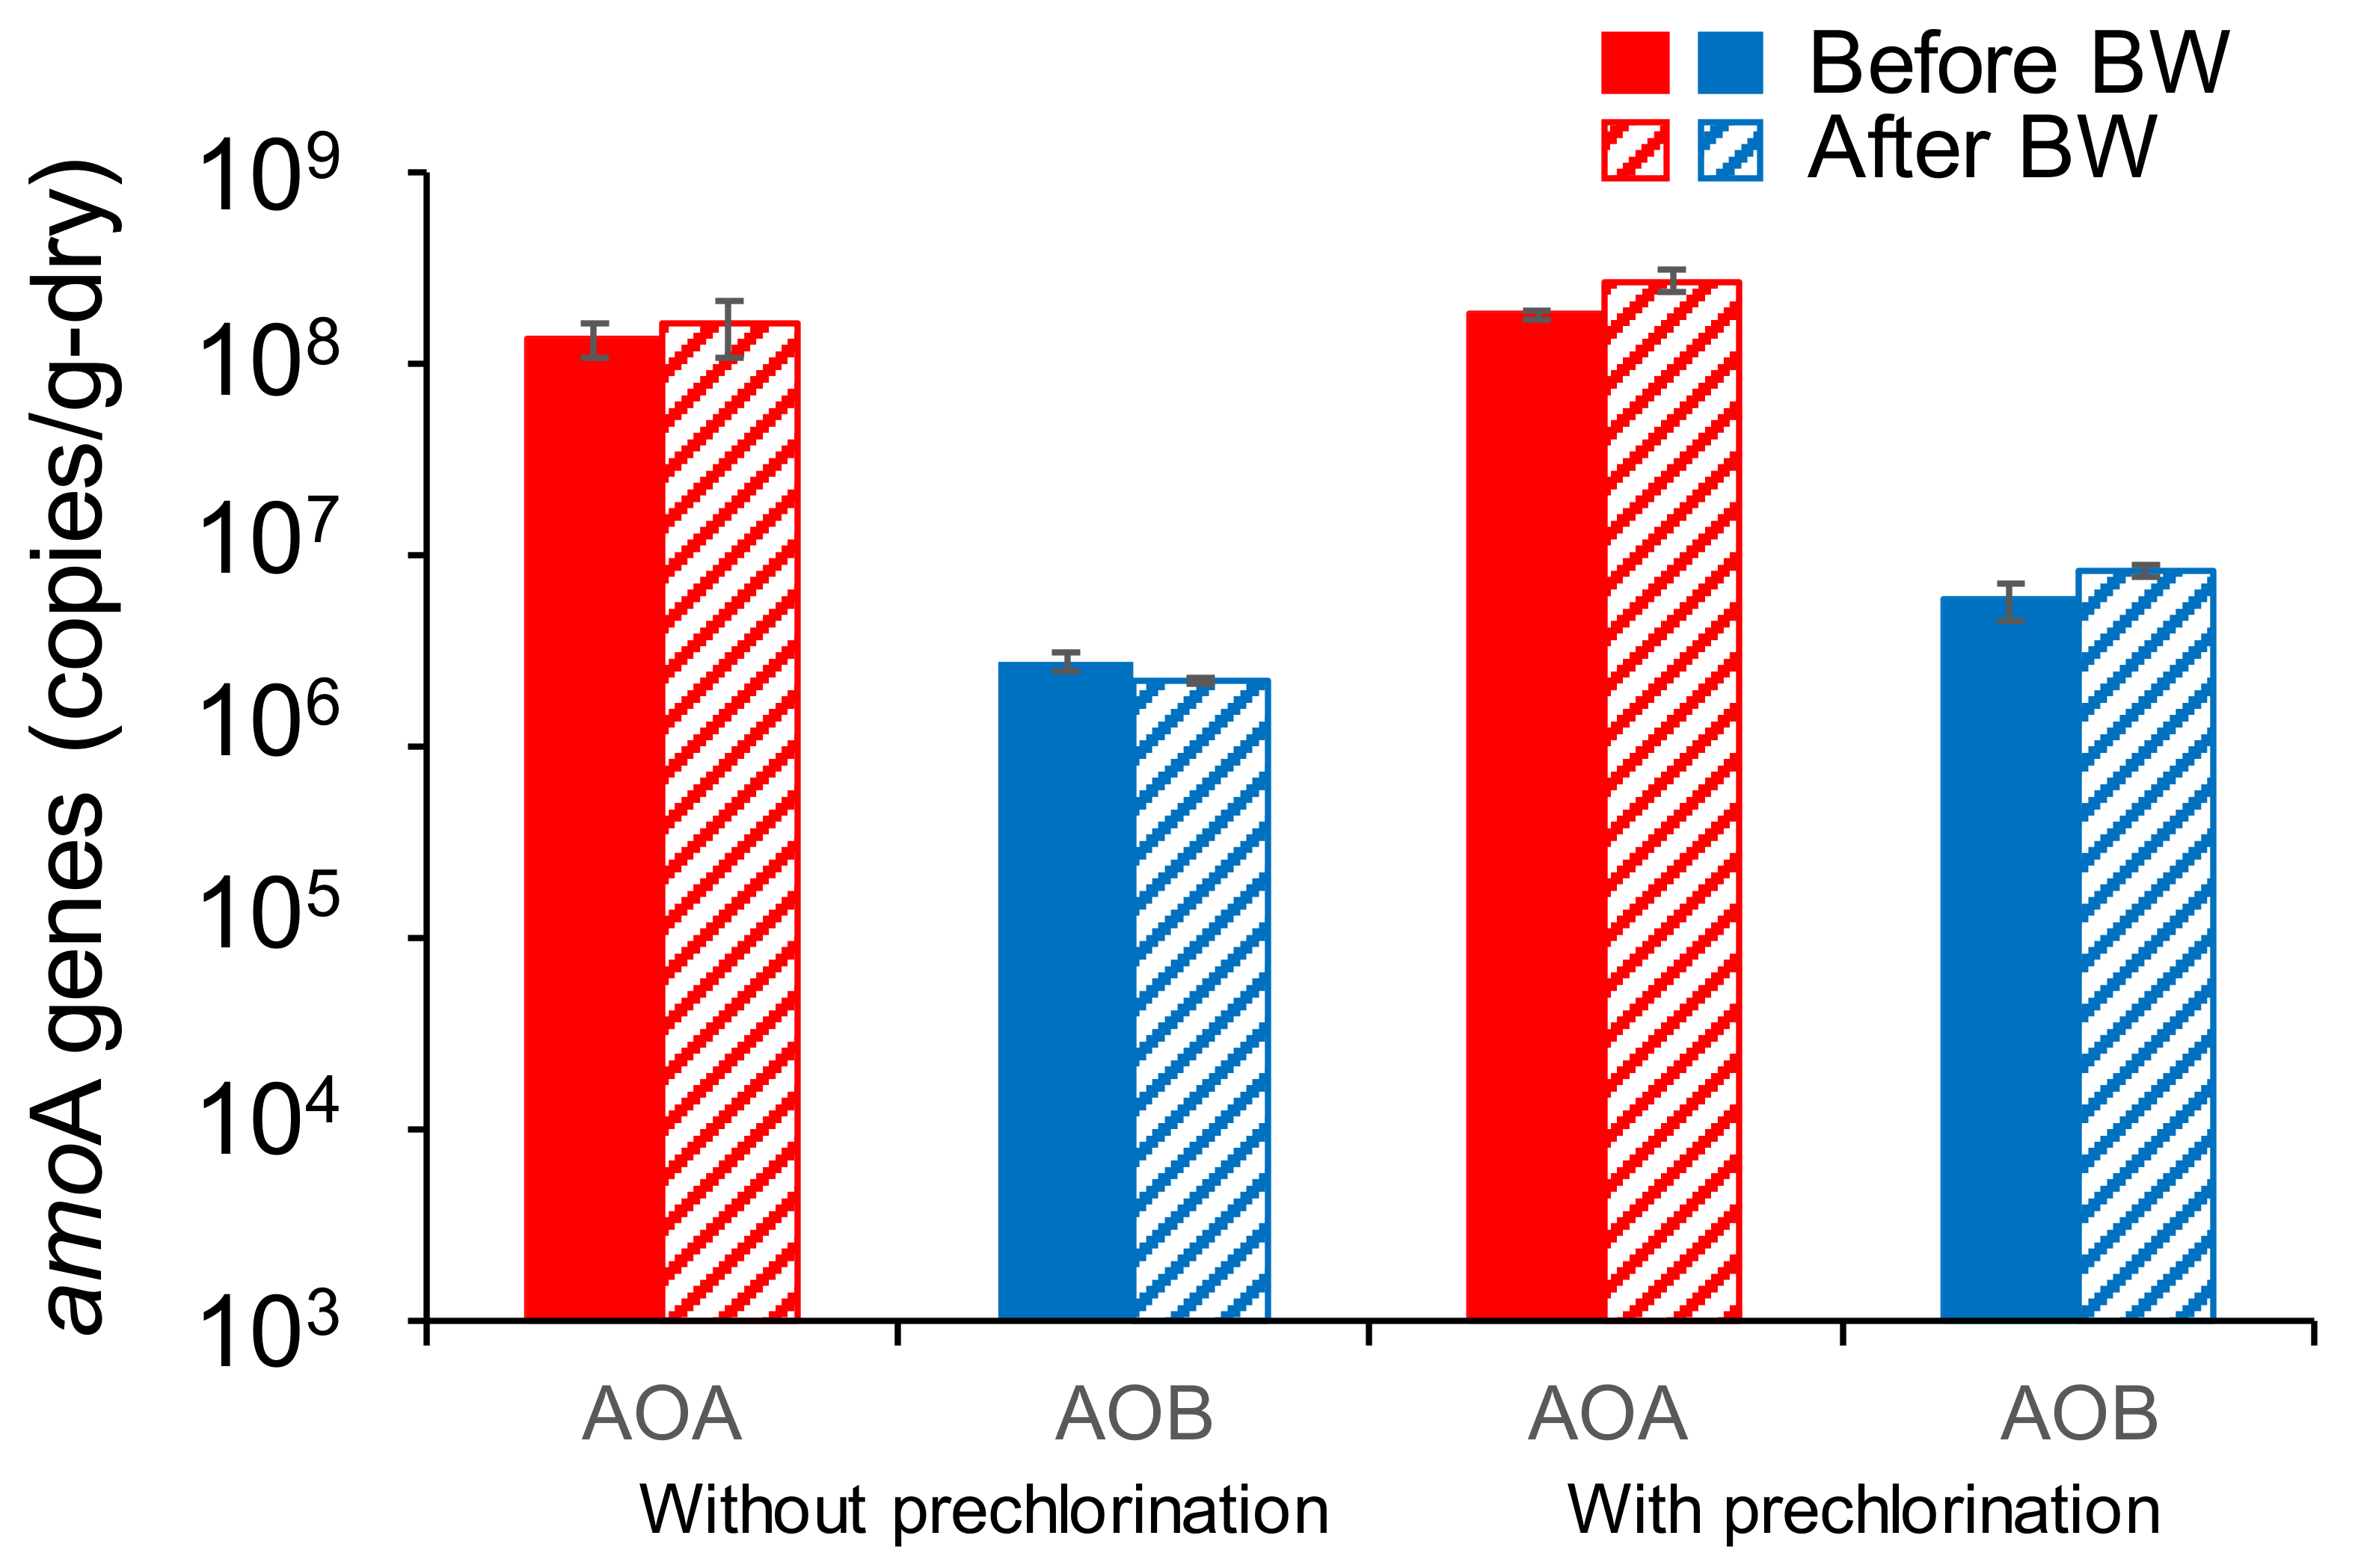
The quantitative PCR results of the AOA and AOB amoA genes are shown in Figure 3. AOA was predominant on the GAC in the two samplings (108 gene copies/g-dry of AOA compared with 106 gene copies/g-dry of AOB). Regardless of prechlorination, backwashing did not significantly affect the amounts of either AOA or AOB (p > 0.01). The results of this study were consistent with the reports of Laurent et al. [7], in which the effect of backwashing on the biomass of the nitrifiers was reported to be negligible. In addition, de Vet et al. [26] also demonstrated that the abundance of ammonia oxidizers on a trickling filter used in the DWPP was not affected by backwashing, and backwashing did not deteriorate nitrification. However, Kasuga et al. [22] and Liao et al. [23] reported that a large amount of bacterial biomass was reduced after backwashing. Moreover, Kim et al. [24] showed that backwashing had a lesser impact on the microbial community than it did on microbial biomass, which was significantly reduced by backwashing. Niche separation of the different microorganisms on the GAC may be the reason for the different results, as backwashing may have a strong effect on biomass of some types of bacteria, while it has a less significant impact on the biomass of ammonia oxidizers.
Although abundances of AOA and AOB on GAC remained stable after backwashing, the ammonium removal potential changed in the two samplings. The increase in the ammonium removal potential in the first sampling was probably due to the removal of accumulated flocs or excess biofilm that hindered the material diffusion to the nitrifiers. However, prechlorination could have an adverse impact on the activities of ammonia oxidizers after backwashing. As a result, ammonium removal potential was significantly decreased after backwashing.
3.4. Analysis of AOA and AOB Dislodged from GAC by Backwashing
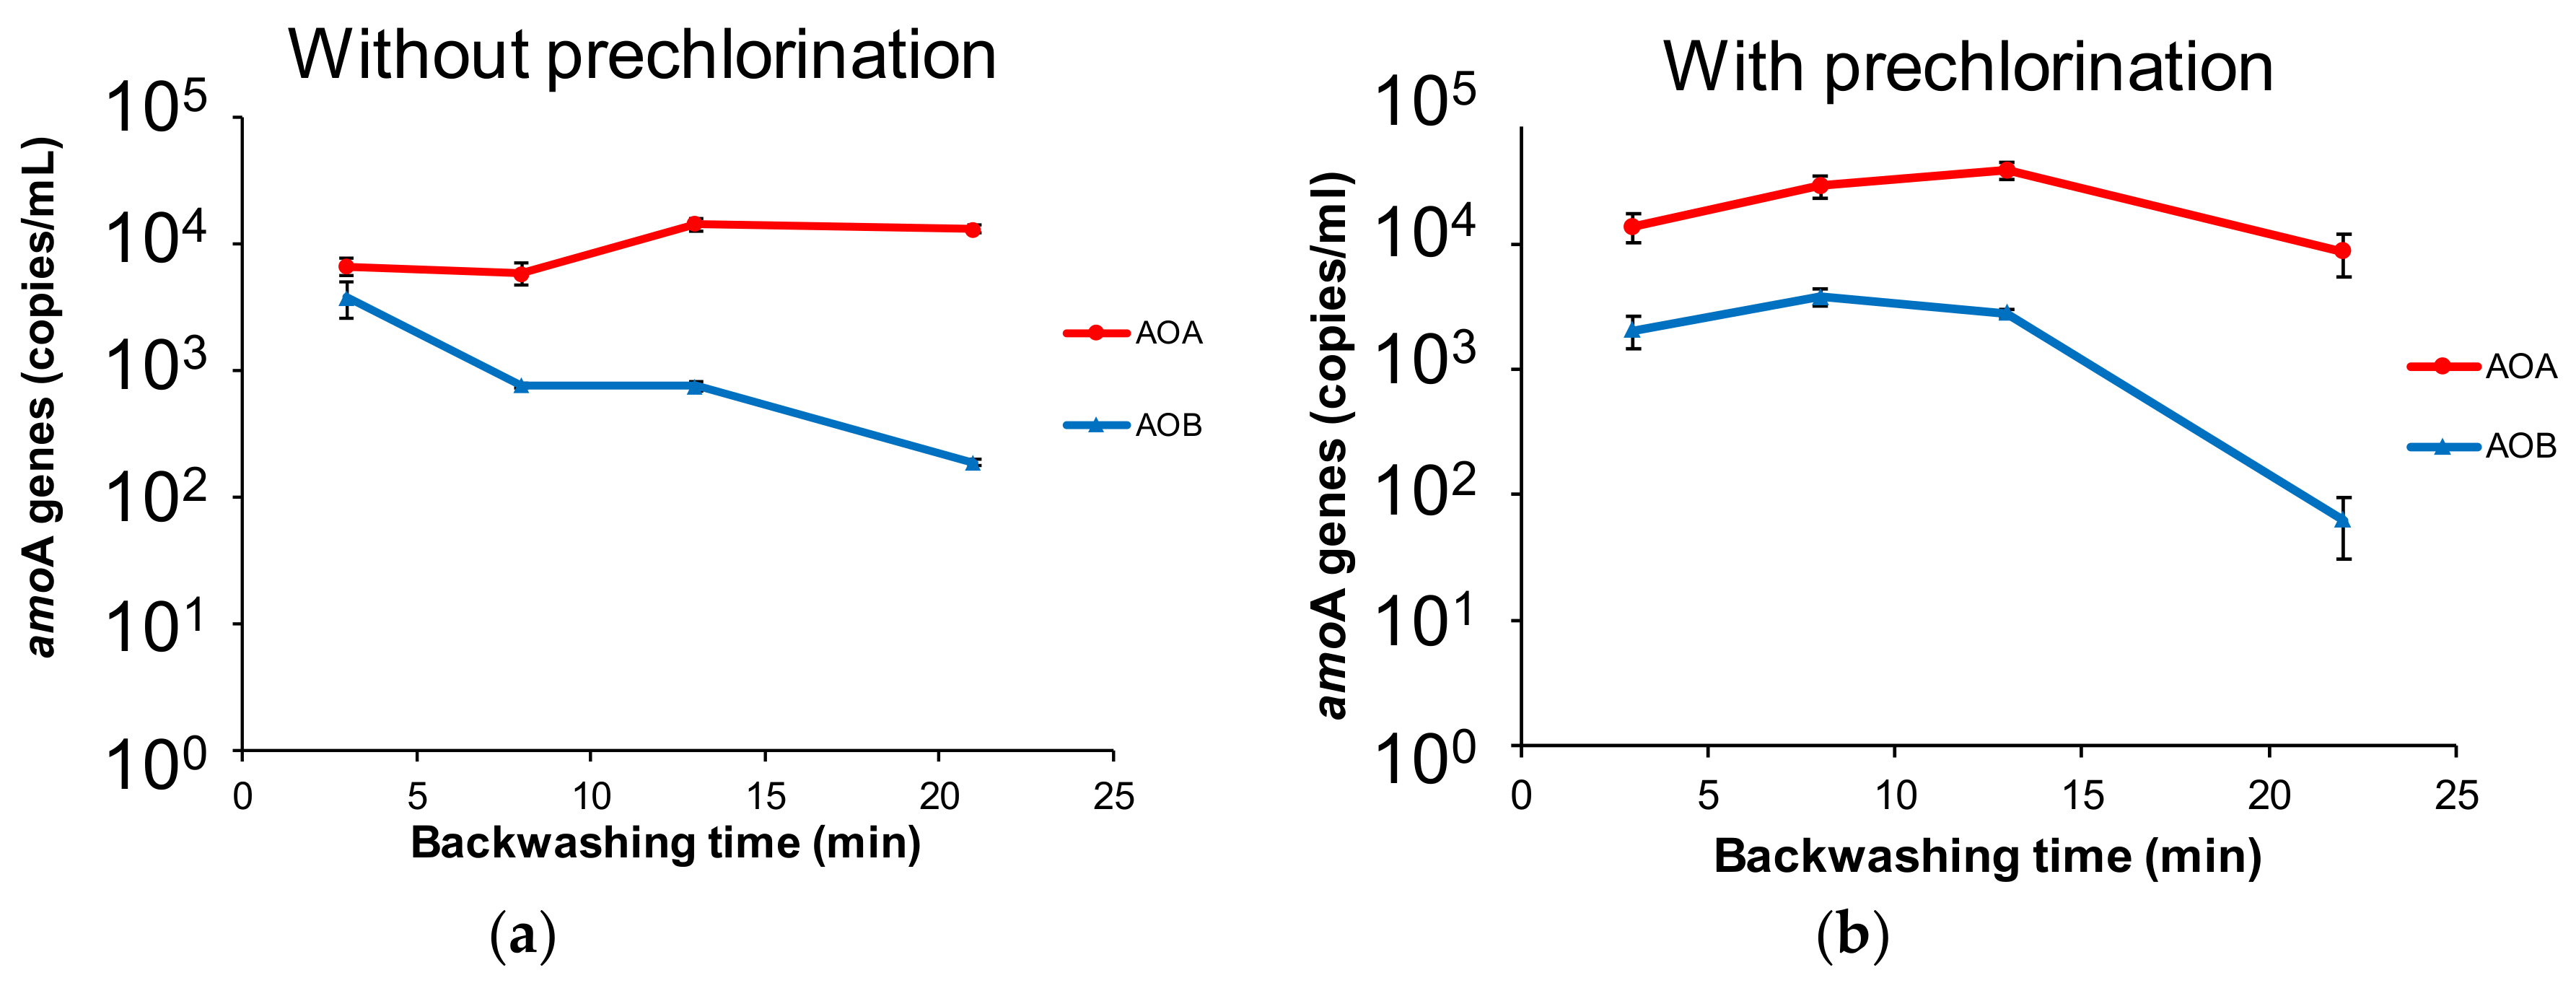
In order to compare the dislodged biomass of the ammonia oxidizers in the different stages of the backwashing program, the abundances of AOA and AOB in the backwashing water were evaluated as shown in Figure 4. In the first phase of the backwashing program (air scour + low flow of water), the dislodged amount of the AOA was higher than that of the AOB (p < 0.01), which was attributed to the predominance of the AOA on the GAC. In the second phase of the backwashing program (high flow of water), the abundance of AOA in the backwashing water remained stable and even increased (p < 0.01), indicating that AOA was continuously washed out by backwashing. This trend was consistent in the two samplings. Interestingly, the abundance of AOB decreased during the backwashing program, especially during the last stage of backwashing. These results suggested that less biomass of AOB was washed out in the second phase when compared with AOA biomass. It is likely that AOB were hardly dislodged by the water. Moreover, there was a significant decrease in the abundance of AOB during the second phase without prechlorination; however, this trend was not observed when prechlorination was conducted. It is likely that AOB were damaged by the chlorine [2]. As a result, more AOB could be washed out by the water. The contradictory results with respect to AOA and AOB indicated that AOB may stick to GAC stronger than AOA.
The percentage of the total amount of the ammonia oxidizers discharged by backwashing was compared with their original amounts on the GAC. The dislodged amounts of the AOA and AOB were calculated by multiplying the amounts of the AOA or AOB in the water by the amount of backwashing water. The original amounts of the AOA and AOB were calculated by multiplying the amounts of the AOA or AOB on the GAC with the total weight of the GAC before backwashing. As shown in Table 2, the dislodged amounts of the AOA and AOB during backwashing only accounted for 0.08%−0.12% and 0.23%−0.26% of their original amounts on the GAC, respectively. The results were consistent with the finding that there were no significant changes in the amounts of AOA and AOB on the GAC (Figure 3) and suggested that the discharged amounts were quite marginal compared with their original amounts on the GAC.
4. Conclusions
This study demonstrated the marginal effects of backwashing on the abundances of AOA and AOB on GAC. Without prechlorination, backwashing contributed to the recovery of the ammonium removal potential of GAC. On the other hand, backwashing during the prechlorination period could adversely affect the ammonium removal potential of GAC. Further analysis, including additional samplings in different plants, is suggested to confirm these phenomena and the relevant mechanisms. This study, with meaningful first-hand information, provides an important scientific basis for the maintenance and optimization of GAC in engineering systems.
Author Contributions
All authors collaborated in this work. Conceptualization, J.N. and I.K.; Methodology, J.N. and I.K.; Formal Analysis, J.N.; Writing-Original Draft Preparation, J.N.; Writing-Review & Editing, I.K., F.K., and H.F.
Funding
This research was funded by Tokyo Waterworks, Japan. The authors would also like to thank the Natural Science Foundation of Fujian Province (2018J05011) and the Research Start-up Funds of Fujian University of Technology (GY-Z17075) for supporting the composition and publication of this manuscript.
Conflicts of Interest
The authors declare no conflict of interest.
References
- Yapsakli, K.; Mertoglu, B.; Çeçen, F. Identification of nitrifies and nitrification performance in drinking water biological activated carbon (BAC) filtration. Process Biochem. 2010, 45, 1543–1549. [Google Scholar] [CrossRef]
- Kasuga, I.; Nakagaki, H.; Kurisu, F.; Furumai, H. Predominance of ammonia-oxidizing archaea on granular activated carbon used in a full-scale advanced drinking water treatment plant. Water Res. 2010, 44, 5039–5049. [Google Scholar] [CrossRef]
- Seredyńska-Sobecka, B.; Tomaszewska, M.; Janus, M.; Morawski, A.W. Biological activation of carbon filters. Water Res. 2006, 40, 355–363. [Google Scholar] [CrossRef] [PubMed]
- LeChevallier, M.W.; McFeters, G.A. Microbiology of activated carbon. In Drinking Water Microbiology; McFeters, G.A., Ed.; Spinger: New York, NY, USA, 1990; pp. 104–119. [Google Scholar]
- Regan, J.M.; Harrington, G.W.; Noguera, D.R. Ammonia- and nitrite-oxidizing bacterial communities in a pilot-scale chloraminated drinking water distribution system. Appl. Environ. Microb. 2002, 68, 73–81. [Google Scholar] [CrossRef]
- Haas, C.N. Disinfection. In Water Quality and Treatment: A Handbook of Community Water Supplies, 5th ed.; Letterman, R.D., Ed.; McGraw-Hill, Inc.: New York, NY, USA, 1999; pp. 877–932. [Google Scholar]
- Laurent, P.; Andersson, A.; SERVAJS, P. Impact of backwashing on nitrification in the biological activated carbon filters used in drinking water treatment. Environ. Technol. 2003, 24, 277–287. [Google Scholar] [CrossRef]
- Andersson, A.; Laurent, P.; Kihn, A.; Prévost, M.; Servais, P. Impact of temperature on nitrification in biological activated carbon (BAC) filters used for drinking water treatment. Water Res. 2001, 35, 2923–2934. [Google Scholar] [CrossRef]
- Prévost, M.; Desjardins, R.; Lafrance, P.; Duchesne, D.; Coallier, J. Optimization of biological activated carbon (BAC) filtration of drinking water: Effect of filtration velocity, ozone dosage and position and of carbon type. In Proceedings of the AWWARF-Fifth National Conference on Drinking Water Proceedings, Winnipeg, MB, Canada, 13–15 September 1993; pp. 63–77. [Google Scholar]
- Limpiyakorn, T.; Fürhacker, M.; Haberl, R.; Chodanon, T.; Srithep, P.; Sonthiphand, P. amoA-encoding archaea in wastewater treatment plants: A review. Appl. Microbiol. Biotechnol. 2013, 97, 1425–1439. [Google Scholar] [CrossRef]
- Gonzalez-Martinez, A.; Sihvonen, M.; Muñoz-Palazon, B.; Rodriguez-Sanchez, M.A.; Vahala, R. Microbial ecology of full-scale wastewater treatment systems in the Polar Arctic Circle: Archaea, Bacteria and Fungi. Sci. Rep. 2018, 8. [Google Scholar] [CrossRef] [Green Version]
- Könneke, M.; Bernhard, A.E.; de la Torre, J.R.; Walker, C.B.; Waterbury, J.B.; Stahl, D.A. Isolation of an autotrophic ammonia-oxidizing marine archaeon. Nature 2005, 437, 543–546. [Google Scholar] [CrossRef]
- Martens-Habbena, W.; Berube, P.M.; Urakawa, H.; de la Torre, J.R.; Stahl, D.A. Ammonia oxidation kinetics determine niche separation of nitrifying archaea and bacteria. Nature 2009, 461, 976–979. [Google Scholar] [CrossRef]
- Van der Wielen, P.W.; Voost, S.; van der Kooij, D. Ammonia-oxidizing bacteria and archaea in groundwater treatment and drinking water distribution systems. Appl. Environ. Microb. 2009, 75, 4687–4695. [Google Scholar] [CrossRef] [PubMed]
- Nicol, G.W.; Schleper, C. Ammonia-oxidising Crenarchaeota: Important players in the nitrogen cycle? Trends Microbiol. 2006, 14, 207–212. [Google Scholar] [CrossRef] [PubMed]
- Alonso-Sáez, L.; Waller, A.S.; Mende, D.R.; Bakker, K.; Farnelid, H.; Yager, P.L.; Lovejoy, C.; Tremblay, J.-É.; Potvin, M.; Heinrich, F.; et al. Role for urea in nitrification by polar marine Archaea. Proc. Natl. Acad. Sci. USA 2012, 109, 17989–17994. [Google Scholar] [CrossRef] [PubMed] [Green Version]
- Kasuga, I.; Nakagaki, H.; Kurisu, F.; Furumai, H. Abundance and diversity of ammonia-oxidizing archaea and bacteria on biological activated carbon in a pilot-scale drinking water treatment plant with different treatment processes. Water Sci. Technol. 2010, 61, 3070–3077. [Google Scholar] [CrossRef] [PubMed]
- Niu, J.; Kasuga, I.; Kurisu, F.; Furuami, H.; Shigeeda, T.; Takahashi, K. Abundance and diversity of ammonia-oxidizing archaea and bacteria on granular activated carbon and their fates during drinking water purification process. Appl. Microbiol. Biotechnol. 2016, 100, 729–742. [Google Scholar] [CrossRef] [PubMed]
- Niu, J.; Kasuga, I.; Kurisu, F.; Furumai, H.; Shigeeda, T. Evaluation of autotrophic growth of ammonia-oxidizers associated with granular activated carbon used for drinking water purification by DNA-stable isotope probing. Water Res. 2013, 47, 7053–7065. [Google Scholar] [CrossRef] [PubMed]
- Simpson, D.R. Biofilm processes in biologically activated carbon water purification. Water Res. 2008, 42, 2839–2848. [Google Scholar] [CrossRef]
- Morin, P.; Camper, A.K. Attachment and fate of carbon fines in simulated drinking water distribution system biofilms. Water Res. 1997, 31, 399–410. [Google Scholar] [CrossRef]
- Kasuga, I.; Shimazaki, D.; Kunikane, S. Influence of backwashing on the microbial community in a biofilm developed on biological activated carbon used in a drinking water treatment plant. Water Sci. Technol. 2007, 55, 173–180. [Google Scholar] [CrossRef]
- Liao, X.; Chen, C.; Zhang, J.; Dai, Y.; Zhang, X.; Xie, S. Operational performance, biomass and microbial community structure: Impacts of backwashing on drinking water biofilter. Environ. Sci. Pollut. Res. 2015, 22, 546–554. [Google Scholar] [CrossRef]
- Kim, T.G.; Yun, J.; Hong, S. Effects of water temperature and backwashing on bacterial population and community in a biological activated carbon process at a water treatment plant. Appl. Microbiol. Biotechnol. 2014, 98, 1417–1427. [Google Scholar] [CrossRef] [PubMed]
- Gray, N.F. Chapter Thirty-One-Free and Combined Chlorine. In Microbiology of Waterborne Diseases, 2nd ed.; Percival, S.L., Williams, D.W., Gray, N.F., Yates, M.V., Chalmers, R.M., Eds.; Academic Press: Cambridge, MA, USA, 2014; pp. 571–590. [Google Scholar]
- De Vet, W.W.J.M.; Kleerebezem, R.; van der Wielen, P.W.J.J.; Rietveld, L.C.; van Loosdrecht, M.C.M. Assessment of nitrification in groundwater filters for drinking water production by qPCR and activity measurement. Water Res. 2011, 45, 4008–4018. [Google Scholar] [CrossRef] [PubMed]
Figure 1.
The ammonium concentration in the raw water and the effluent of the water purification processes in the two samplings (i.e., without prechlorination (a) and with prechlorination (b)). RW: raw water, CO: coagulation/sedimentation, PSF: primary sand filtration, OZO: ozonation, GAC: granular activated carbon, and error bar: the standard deviation.

Figure 2.
The ammonium removal potential of the GAC before (■) and after backwashing ( ![Water 10 01830 i001]() ) in the sampling time of “without prechlorination” and “with prechlorination”. BW: backwashing, and error bar: the standard deviation.
) in the sampling time of “without prechlorination” and “with prechlorination”. BW: backwashing, and error bar: the standard deviation.
 ) in the sampling time of “without prechlorination” and “with prechlorination”. BW: backwashing, and error bar: the standard deviation.
Figure 2.
The ammonium removal potential of the GAC before (■) and after backwashing ( ![Water 10 01830 i001]() ) in the sampling time of “without prechlorination” and “with prechlorination”. BW: backwashing, and error bar: the standard deviation.
) in the sampling time of “without prechlorination” and “with prechlorination”. BW: backwashing, and error bar: the standard deviation.
) in the sampling time of “without prechlorination” and “with prechlorination”. BW: backwashing, and error bar: the standard deviation.
Figure 3.
Abundances of AOA and AOB on the GAC before (solid bar) and after (bar with slash) backwashing in the sampling time of “without prechlorination” and “with prechlorination”. AOA: ammonia-oxidizing archaea, AOB: ammonia-oxidizing bacteria, and error bar: the standard deviation.
Figure 3.
Abundances of AOA and AOB on the GAC before (solid bar) and after (bar with slash) backwashing in the sampling time of “without prechlorination” and “with prechlorination”. AOA: ammonia-oxidizing archaea, AOB: ammonia-oxidizing bacteria, and error bar: the standard deviation.

Figure 4.
The abundances of the amoA genes of AOA (•) and AOB (▲) in the backwashing water during the backwashing program. The water samples were collected without prechlorination (a) and with prechlorination (b).
Figure 4.
The abundances of the amoA genes of AOA (•) and AOB (▲) in the backwashing water during the backwashing program. The water samples were collected without prechlorination (a) and with prechlorination (b).


Table 1.
Information regarding the backwashing program and the sampling times of the backwashing water samples.
Table 1.
Information regarding the backwashing program and the sampling times of the backwashing water samples.
| Time (min) | 1–3 | 4–7 | 8–10 | 11–20 | 21–23 | 24–25 | |
|---|---|---|---|---|---|---|---|
| Program | |||||||
| Air scour (flow rate (m3/min)) | 60 | 60 | |||||
| Finished water with residual chlorine (flow rate (m3/min)) | 20 | 30 | 30 | 60 | 30 | 20 | |
| Sampling time of backwashing water (minutes from the beginning of the program) | 3 | 8 | 8 | 13 | 21 | ||
Table 2.
Percentage of the discharged AOA and AOB in the backwashing water as compared with the original amounts on the GAC.
Table 2.
Percentage of the discharged AOA and AOB in the backwashing water as compared with the original amounts on the GAC.
| Sampling Time | Percentage of Discharged AOA and AOB in Original Amount on GAC (%) | |
|---|---|---|
| AOA | AOB | |
| Without prechlorination | 0.08 | 0.23 |
| With prechlorination | 0.12 | 0.26 |
© 2018 by the authors. Licensee MDPI, Basel, Switzerland. This article is an open access article distributed under the terms and conditions of the Creative Commons Attribution (CC BY) license (http://creativecommons.org/licenses/by/4.0/).
Share and Cite
MDPI and ACS Style
Niu, J.; Kasuga, I.; Kurisu, F.; Furumai, H. Effects of Backwashing on Granular Activated Carbon with Ammonium Removal Potential in a Full-Scale Drinking Water Purification Plant. Water 2018, 10, 1830. https://doi.org/10.3390/w10121830
AMA Style
Niu J, Kasuga I, Kurisu F, Furumai H. Effects of Backwashing on Granular Activated Carbon with Ammonium Removal Potential in a Full-Scale Drinking Water Purification Plant. Water. 2018; 10(12):1830. https://doi.org/10.3390/w10121830
Chicago/Turabian StyleNiu, Jia, Ikuro Kasuga, Futoshi Kurisu, and Hiroaki Furumai. 2018. "Effects of Backwashing on Granular Activated Carbon with Ammonium Removal Potential in a Full-Scale Drinking Water Purification Plant" Water 10, no. 12: 1830. https://doi.org/10.3390/w10121830
Note that from the first issue of 2016, this journal uses article numbers instead of page numbers. See further details here.