A Simple Method for Estimating Field Crop Evapotranspiration from Pot Experiments

1
College of Resource and Environmental Sciences, Nanjing Agriculture University, Nanjing 210095, China
2
State Experimental Station of Agro-Ecosystem in Fengqiu, State Key Laboratory of Soil and Sustainable Agriculture, Institute of Soil Science, Chinese Academy of Sciences, Nanjing 210008, China
*
Authors to whom correspondence should be addressed.
Water 2018, 10(12), 1823; https://doi.org/10.3390/w10121823
Submission received: 29 October 2018
/
Revised: 4 December 2018
/
Accepted: 8 December 2018
/
Published: 11 December 2018
(This article belongs to the Special Issue Soil Hydrology in Agriculture)
Abstract
:Pot experiments are a low-cost and easy-to-use technique for studies of soil evaporation and plant transpiration in controlled environments. However, little attention has been paid to the applicability of evapotranspiration (ET) measured in pot experiments to the field. The objective of this study was to determine whether a pot experiment can be used for measuring field ET. Evapotranspiration experiments with winter wheat and summer maize were conducted in pots and lysimeters under various water-deficit conditions. The measured ET values in the pot experiments under different water conditions were considerably different from those of the lysimeters. Causes of such differences in ET were analyzed, and a series of corrections were proposed to eliminate the effects of different crop densities, representative areas per plant, and soil moisture conditions on pot experiment results. After these corrections, the discrepancy in the total ET of wheat-maize seasons between pots and lysimeters was greatly reduced from a maximum of 117% to only approximately 10%. The relative mean square errors (RMSEs) for daily ET values also decreased from a maximum value of 4.56 mm to less than 1.5 mm for the wheat season and from a maximum value of 6.02 mm to approximately 2 mm for the maize season. Possible measures were proposed to further improve the accuracy of the corrected ET obtained from pot experiments. In sum, pot experiments can serve as a feasible tool for estimating ET in the field just with a few routine measurements at regions where large-scale weighing lysimeters, an eddy covariance device, and even meteorological data are not available. The proposed corrections can also be used for upscaling small-scale ET measurements to a large scale.
1. Introduction
Evapotranspiration (ET) is one of the most important components in field water cycles. The accurate measurement or estimation of ET in fields is of great importance for quantifying soil hydrological processes and, thus, making appropriate decisions regarding irrigation measures to improve water use efficiency levels in agricultural areas, particularly in arid or semi-arid regions. Currently, many tools and techniques, such as scintillometers [1], the eddy covariance (EC) method [2,3,4], and the Bowen ratio-energy balance (BREB) measurement system [5,6], are available for measuring ET at the field scale. Food and Agriculture Organization (FAO) crop coefficient methods [7] are also usually used for estimating field-scale ET [8] based on reference crop ET calculated by various models as reviewed by [9]. In addition, there are some models, including the Penman-Monteith model [10], the Shuttleworth-Wallace Model [11] and the clumping model [12], that can directly estimate field-scale ET. Among them, lysimeters [13,14] are normally used as a standard tool for evaluating field-scale approaches [15,16,17,18]. Moreover, lysimeters cannot be replaced with the EC and BREB methods given their uncertain footprints, especially when plot experiments are used to evaluate the effects of field management systems or soil water and nutrient deficits on ET. Even so, there are still some disadvantages or faults of lysimeter applications. First, lysimeters are so expensive that conducting such experiments with enough treatments and duplications is impossible in most cases. Second, the representativeness of the ET measured by lysimeters is apt to be suspect for different crop densities, crop heights, root characteristics, soil water and nutrient statuses, and soil profile structures between inside and outside lysimeters [19]. More reviews on lysimeters can be found in [19]. So far, it remains unclear how a lysimeter can be used to upscale ET to the plot or field scale.
Compared to large-scale lysimeters, pot experiments and micro lysimeters are low-cost and easy-to-use tools that have been widely used in studies of soil evaporation and plant physiological processes of plant transpiration, growth, and dry biomass production and allocation in controlled environments [20,21,22,23,24,25]. However, due to the limited amount of soil available to the roots, plant growth and, thus, ET in pots can be very different from that in the field due to differences in soil water status [26,27] and nutrient and oxygen supply characteristics [28,29,30]. Water or nutrient stress and, thus, a reduction in the crop yield or biomass amount can occur more frequently in pots even under the same apparent soil water conditions as in lysimeters. Furthermore, a minor difference in crop density between pots and lysimeters can result in a considerable difference of ET between them. Finally, soil evaporation is dependent on the representative area per plant, which can differ considerably between pots and lysimeters, especially in the maize season. For the above reasons, the measured ET in a pot has never been adopted to represent the ET in a lysimeter or in the field.
Fortunately, some conservative relationships between plants and soil environmental factors have been found in some studies [31,32]. These conservative relationships are independent of soil volume size [24] and, thus, may be helpful for upscaling ET from pot scale to field scale. For example, consistent transpirational responses of crops to drought stress have been found by [26] for different pot sizes. A consistent relationship between dry matter accumulation and total transpiration was found by [24] between pots and lysimeters. Conservative behavior of biomass water productivity has also been observed by [31] and [32] under various environmental conditions. The conservative behaviors of biomass water productivity have been successfully used to partition eddy covariance ET [33,34]. However, few studies have been conducted to upscale ET in pots to field scale based on the relationship between dry biomass productivity and plant transpiration.
Therefore, the first objective of this study is to analyze the differences in pot and lysimeter ET values from experiments involving planted wheat and maize. The second objective is to propose and test an approach for correcting or upscaling the measured ET of the pots to a comparable level with those of the lysimeters. By using the same approach, the measured ET in the pots can be upscaled to any field with known crop density and biomass per plant. Although it cannot reach an accuracy as high as that of lysimeters, the approach proposed herein can be taken as a low-cost way for field ET estimates in regions with limited conditions. Finally, we discuss and present possible ways to further improve the accuracy of the approach as well as its potential use in the fields.
2. Materials and Methods
2.1. Experimental Site
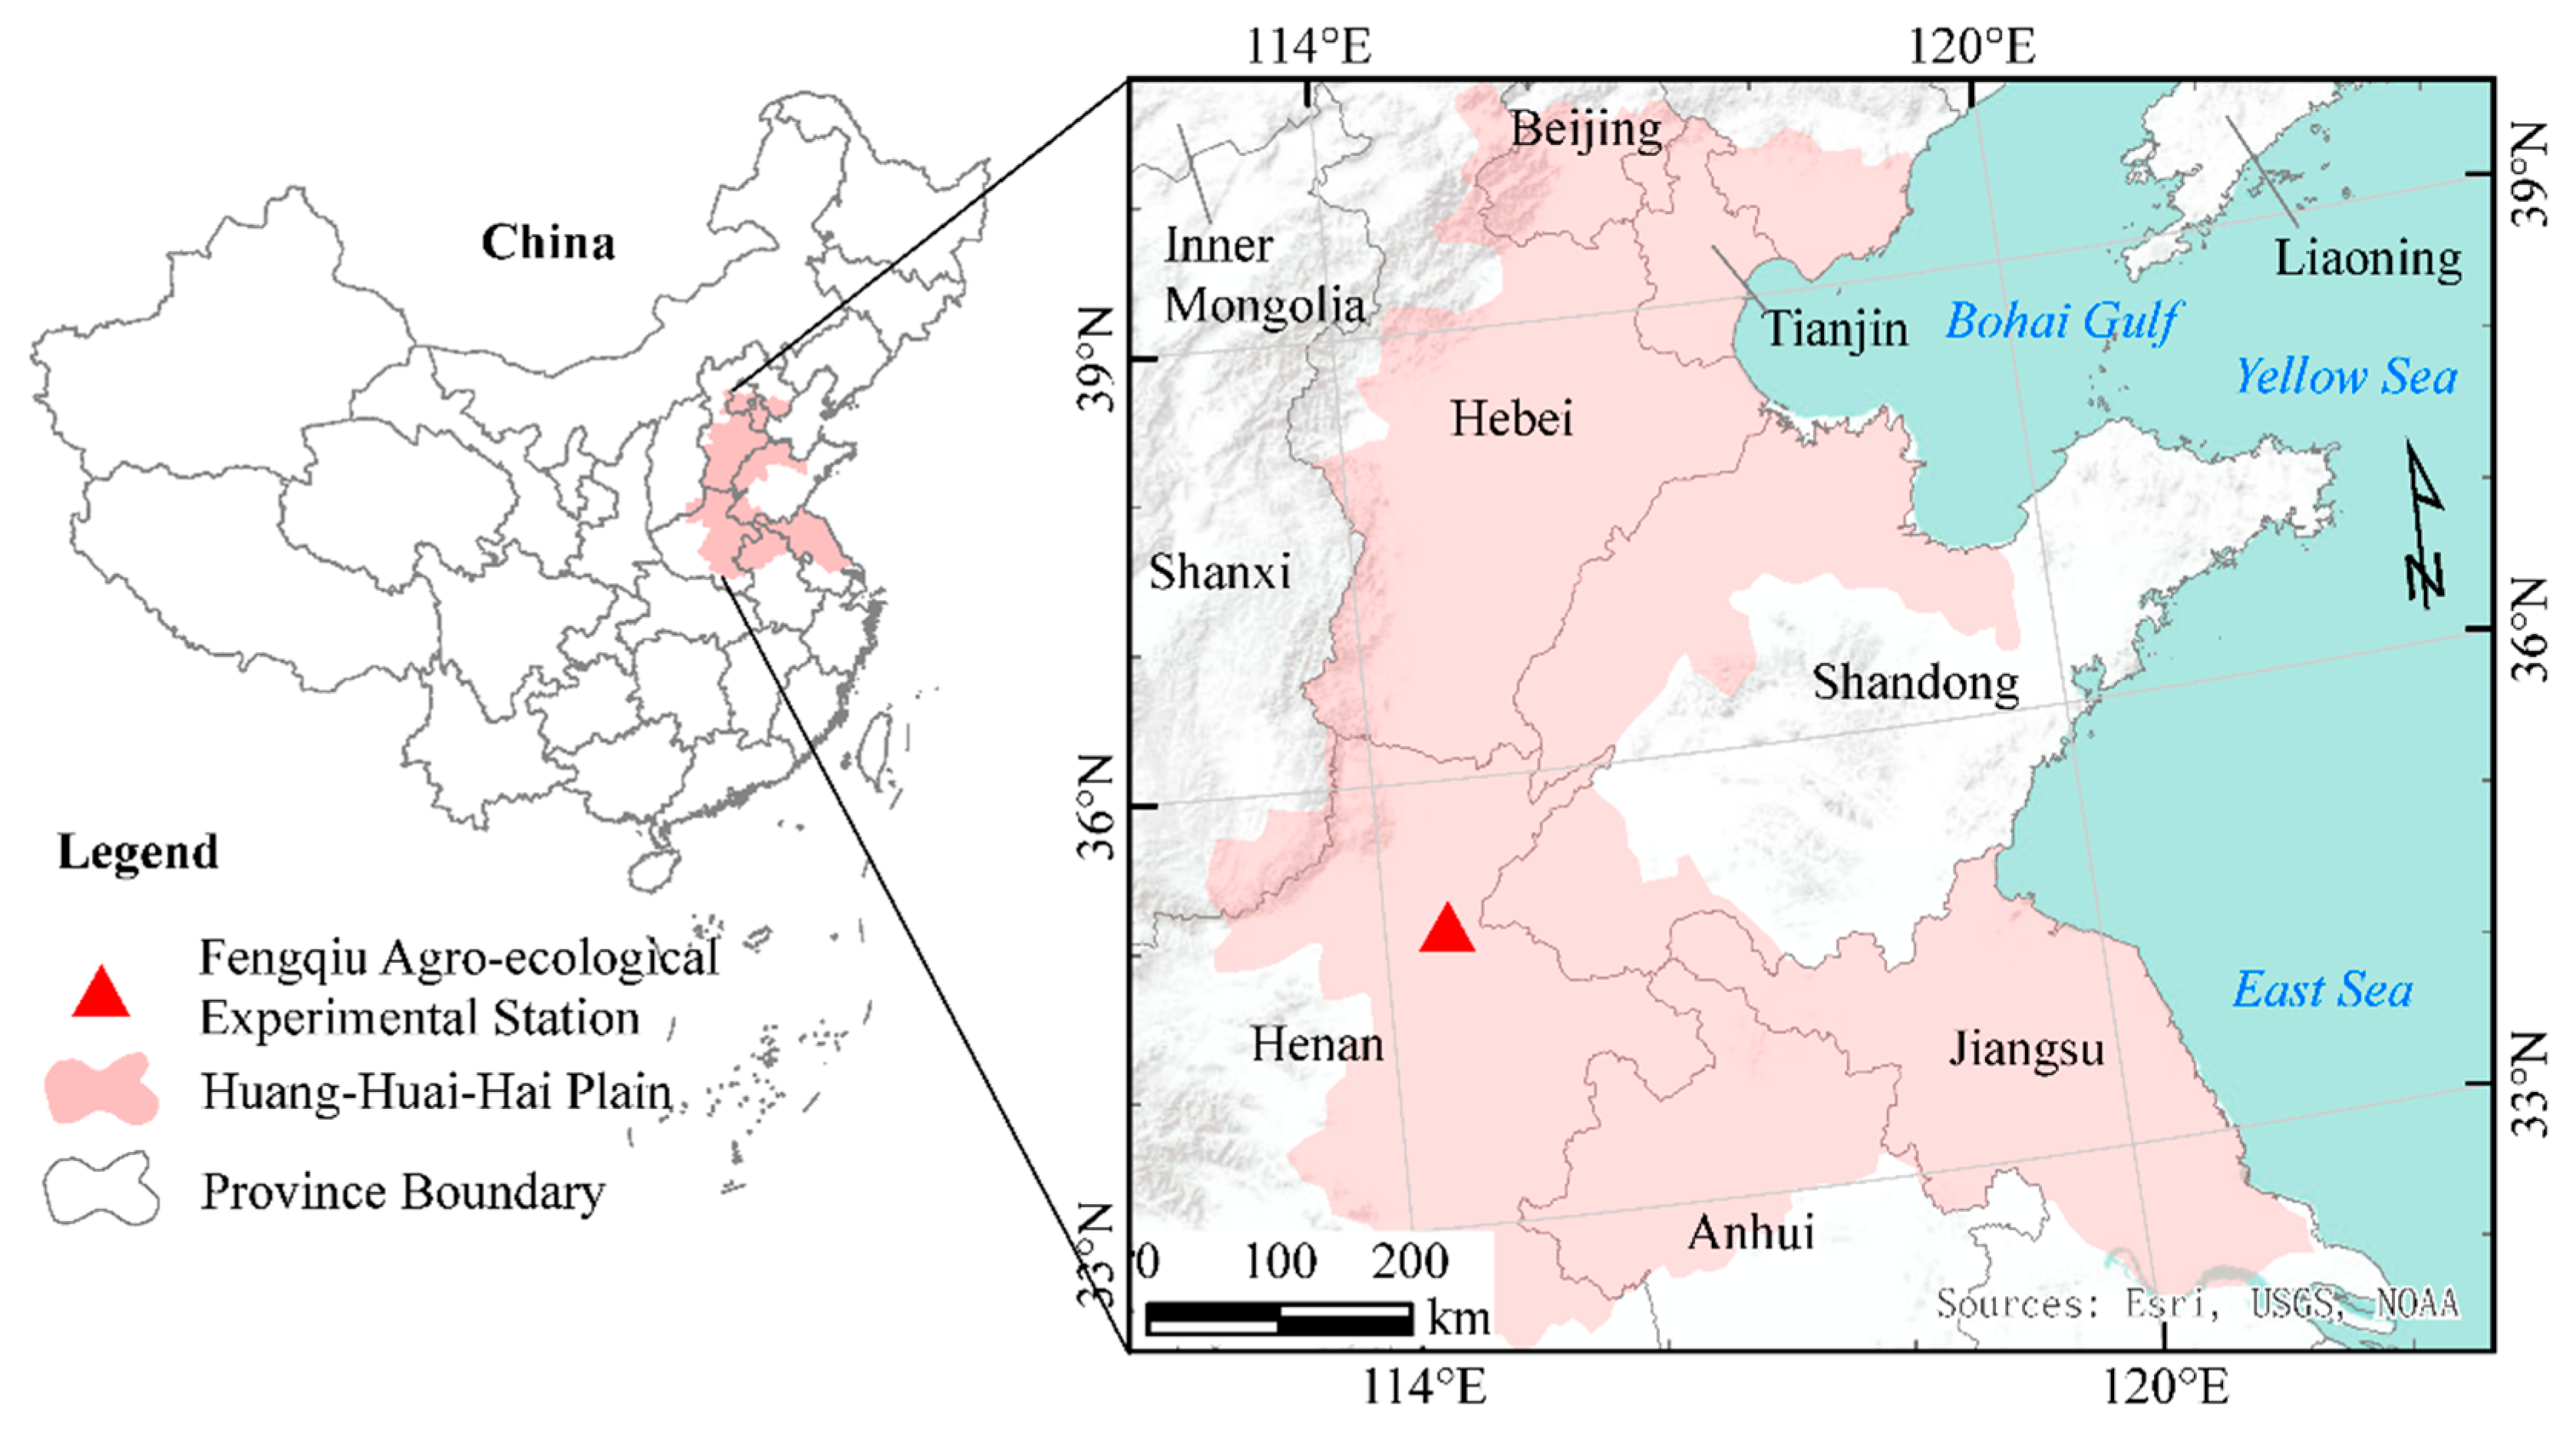
The experiments were conducted at the Chinese Academy of Sciences Fengqiu Agro-ecological Experimental Station (35°00 N, 114°24′ E). The station is located in the hinterland of the Huang-Huai-Hai Plain (Figure 1), which is characterized by flat topography and an average altitude of 67.5 m above sea level. The region is characterized by a typical monsoon climate, an annual mean air temperature of 13.9 °C, and an annual mean rainfall of 615 mm, of which 60–90% occurs between May and October [35]. The annual mean water surface evaporation level is 1858 mm, which is much greater than that of the precipitation [36]. During growing seasons, the maximum air temperature is 39.7 °C and the minimum air temperature is −1.1 °C. Sandy loam soil accounts for more than 98% of the total arable land area of the region. Basic soil physical and chemical properties of the experimental site are listed in Table 1, which are also valid for the soils in the pot and lysimeter experiments. A wheat–maize rotation is the main cropping system applied in the study area. Normally, precipitation levels do not satisfy the crop water requirement, especially during wheat seasons. Therefore, irrigation is required to alleviate soil water deficits.
2.2. Experimental Design
2.2.1. Pot Experiments
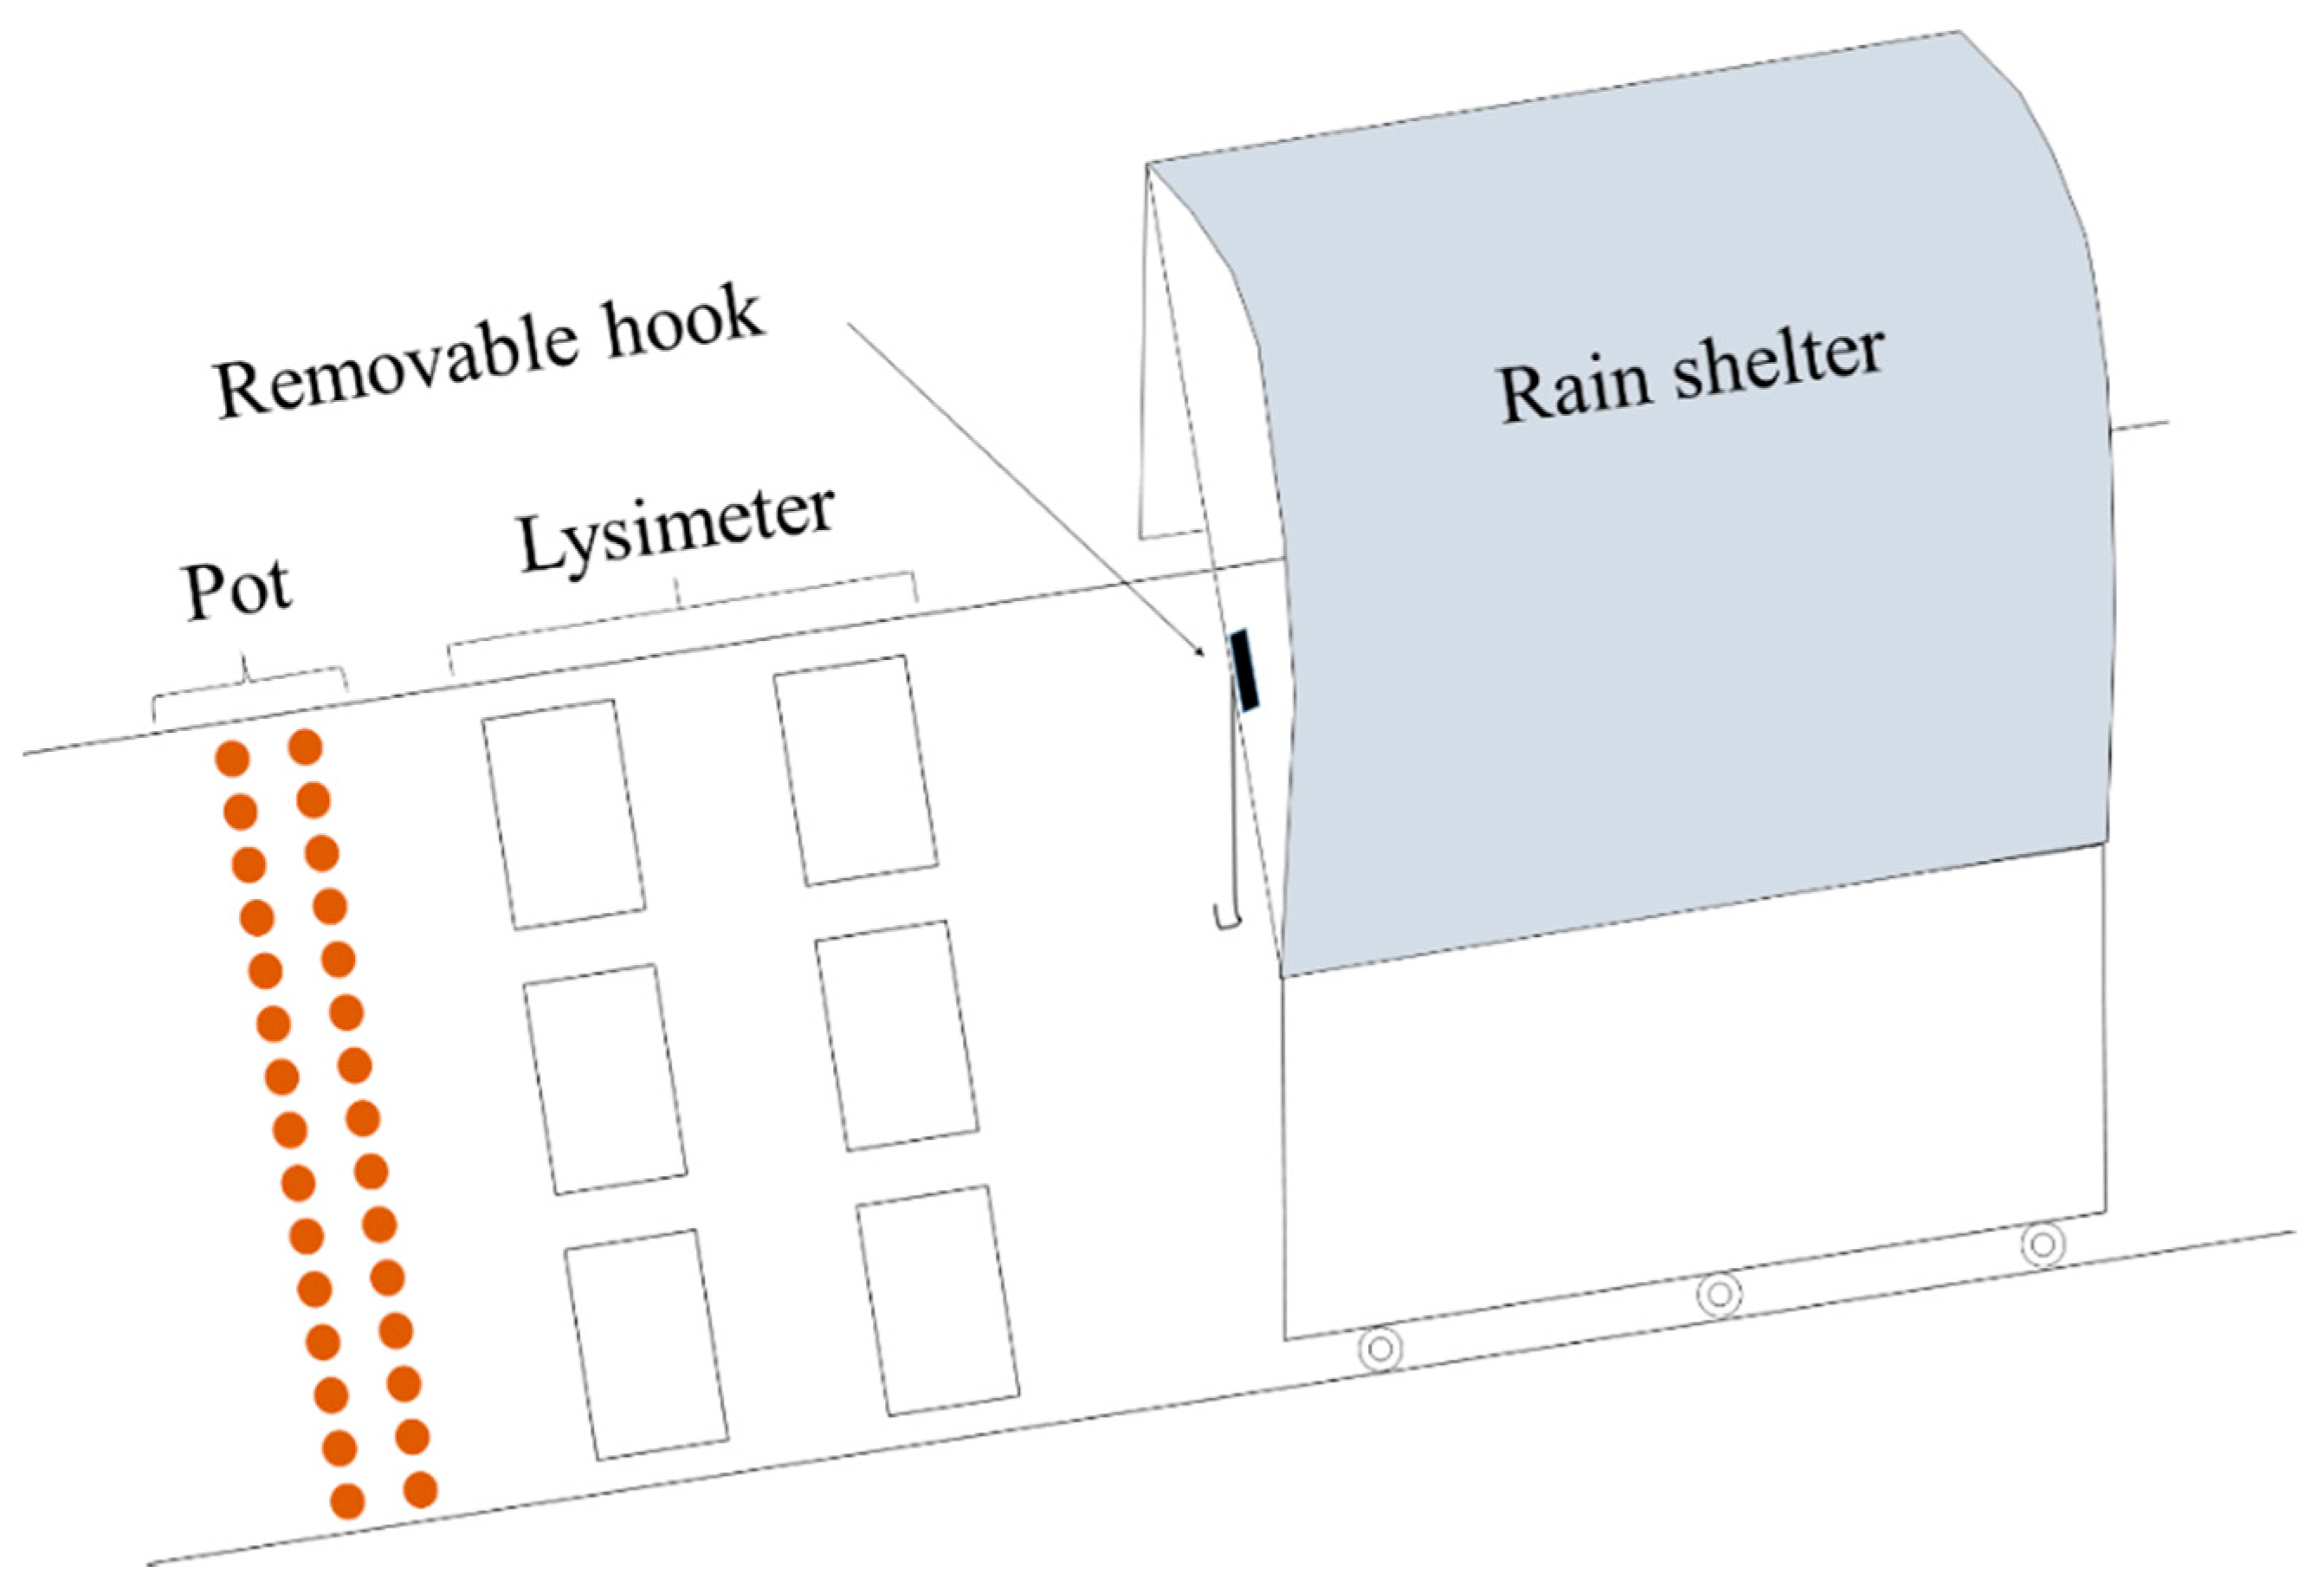
Pot experiments were conducted using 27 ceramic pots (diameter: 30 cm; height: 38.5 cm) positioned in a field in 2013–2014 for winter wheat and in 2014 for maize. A rain shelter with a glass roof was used to prevent rainfall from entering the soil (Figure 2). The soil was sampled from the cultivated layer (0–30 cm) near the experimental site, and then air-dried, crushed, and mixed for pot experiments. Each pot was uniformly packed with roughly 35 kg of soil at the same bulk density (1.2 kg m−3) as that of the cultivated horizon of the outer field. The bottom of each pot had a hole for draining excess water. Each hole was covered with a piece of plastic screening to prevent soil from leaking. Finally, the filled pots together with their outer buckets (diameter: 40 cm; height: 50 cm) were buried in the field. The heights of soil surfaces in the pots were kept consistent with the surrounding field. Two bricks and a plastic pan were placed underneath each pot to separate the pot from the subsoil in the pit. During the crop growing seasons, the pots were lifted once every 3 days by a removable power-driven hook installed on the top of the rain shelter, and then weighed by an electronic balance with an accuracy of 2 g (0.03 mm). Changes in pot weights were used to calculate the total water volumes for controlling the soil moisture contents in the pots.
Three groups of treatments (bare soil without crops (B); covered soil with crops (C); and normal pots with crops (N)) were designed. Each group involved three volumetric soil moisture content levels of 11 ± 2%, 18 ± 2%, and 25 ± 2%, which are lower than the field capacity (Table 1) and represent low, middle, and high soil moisture conditions, respectively. Nine treatments were applied (B11, B18, B25, C11, C18, C25, N11, N18, and N25). Each treatment was applied in triplicate. The total number of pots was 27. Seeds were sown in 18 pots. At the seeding stage, all 18 planted pots were well-watered for even seedling emergence, and the other 9 pots were watered to maintain uniform soil moisture conditions across the planted pots. At the growing stage, the soil moisture contents in each pot were controlled by routine weighing pots, calculating water loss and adding water into the pot. During the experiments, no water was drained from the pots for all of the three soil moisture content levels, which can be easily found by checking the pan when weighing each pot each time.
One row of wheat seeds (variety: Aikang 58, Henan Jinlei Seedling Co., Ltd., Xinxiang, China) was sown with the density of 180 kg/ha on 10 October 2013, and was cropped on 4 June 2014. Sufficient fertilizers (450 kg N ha−1, 200 kg P ha−1, and 150 kg K ha−1) were applied. All P and K fertilizers with 60% N fertilizers were applied as basal fertilizers. The remaining 40% N fertilizers were applied with water on 9 March 2014. The soil surfaces of nine planted pots were then covered with foam sheets to limit soil evaporation. The water control was conducted from 9 March 2014 to 4 June 2014.
Three maize seeds (variety: Zhengdan 958, Henan Jinboshi seed Industry Co., Ltd., Zhengzhou, China) were sown in each pot on 4 June 2014. The same amount of fertilizer (450 kg N ha−1, 200 kg P ha−1, and 150 kg K ha−1) used in the winter season was applied. All P fertilizers, K fertilizers, and 40% N fertilizers were applied when sowing. The remaining 60% N fertilizers were applied on 27 June 2014. After three leaves had expanded on 27 June 2014, only one plant remained in each pot, and the soil surfaces of nine planted pots were covered with foam sheets to limit soil evaporation. Soil water control began on 27 June 2014, and continued to 25 September 2014.
2.2.2. Lysimeter Experiments
Six weighable lysimeters (length: 1.5 m, width: 1 m, depth: 1.8 m), with undisturbed soils sampled from the outer field close to the pot experiments and the experimental area, were also covered by the removable rain shelter to prevent rainfall from entering the soil (Figure 2). The base of each lysimeter included a 20-cm layer of coarse sand from which a pipe facilitated water drainage from the soil. Six tensiometers were vertically inserted to 20 cm, 40 cm, 60 cm, 80 cm, 120 cm, and 160 cm soil depths of each lysimeter to measure soil water potential changes, and were transferred to soil moisture contents based on the measured soil water retention curves of undisturbed soils sampled from different layers with a sandbox (Eijkelkamp, Netherlands) and a pressure membrane (Soilmoisture Equipment Corp, Goleta, CA, USA). Lysimeter weight changes were monitored through load cells with an accuracy of 50 g (i.e., at a water depth of 0.03 mm for the lysimeters). Lysimeter weights, water drainage levels, and soil water potentials were automatically measured by weighing sensors (Interface Inc., LaGrange, GA, USA) and pressure transducers (Honeywell International Inc., Morristown, USA) and acquired four times a day using a data logger (Campbell Scientific, Inc., Logan, UT, USA).
The lysimeter experiments were carried out at the same time as the pot experiments. Three water treatments and each with two replicates were designed. At the seeding stage, all six lysimeters were well-watered to support strong seedling emergence. From the beginning of the shooting period, the total soil water storages in lysimeters were controlled at three levels (50 ± 15 mm (W50), 100 ± 15 mm (W100), and 150 ± 15 mm (W150)) below the total field water capacity (722 mm, determined by the sum of field water capacities of all soil layers) corresponding to soil volumetric moisture content levels of 37%, 35%, and 32%, respectively. When the total soil water storage in a lysimeter reached 15 mm below that of the experimental treatment, water was added to allow the total soil water storage to exceed the expected value by 15 mm.
Six rows of wheat seeds (variety: Aikang 58, Henan Jinlei Seedling Co., Ltd., Xinxiang, China) were sown with the same density (180 kg/ha) as that of the surrounding field on 10 October 2013, and the resulting plants were cropped on 4 June 2014. The water control was conducted from 9 March 2014 to 4 June 2014, in the wheat season. Maize seeds (variety: Zhengdan 958, Henan Jinboshi seed Industry Co., Ltd., Zhengzhou, China) were sown in three rows and four columns on 4 June 2014. There were three seeds at one sowing point. After three leaves had expanded on 27 June 2014, only 12 plants remained in each lysimeter. The soil water control for the maize season began on 27 June 2014, and continued to 25 September 2014, the end of the growing season. Sufficient fertilizer volumes (225 kg N ha−1, 100 kg P ha−1, and 75 kg K ha−1) were applied for both wheat and maize.
2.2.3. Measurements
The crop density in each pot or lysimeter was measured at the start of the soil water control period. The crop height and wet biomass levels per plant in the outer field were measured seven times over different development periods. In each time period, the height of 10 randomly selected plants in the outer field was measured, and the plants were cut to weigh their wet biomass using an electronic balance with an accuracy level of 0.02 g. The crop heights of each pot and lysimeter were also measured. At the end of the growing period, heights, crop yields, and aboveground dry biomass levels were measured for all of the pots and lysimeters.
The relationship between crop height and wet biomass was determined from the data measured in the field around the experimental area. Crop heights for each day were obtained by linearly interpolating measured crop heights over several development periods. Then, the wet biomass levels for each day were estimated from crop heights based on their relationship.
The ET for each pot or lysimeter was calculated from the decrease in weight per area plus irrigation and minus drainage amounts between two adjacent measurements. Lysimeter data were acquired daily, while a minimum time interval of 3 days was applied for the measured pot experiment data to minimize manual weighing effects. Therefore, for the pot experiments, the mean daily value between two adjacent measurements was used over the time interval.
2.3. Methods for Correcting ET in the Pot Experiments
Similar to those between lysimeters and the surrounding field [38,39], the processes occurring in a pot differ from those observed in a field or lysimeter. First, due to the limits of pot sizes, the crop density in a pot is different from that in a lysimeter, as crop roots have to absorb water and nutrients from a smaller volume of soil in a pot than in a lysimeter. Second, the representative area per plant in a pot is normally also different from that in a lysimeter. Third, water and nutrient stress occur more frequently in a pot and, thus, a reduction in crop yield or biomass is more possible even at the same apparent soil water content level as in a lysimeter. Therefore, some corrections must be made on the measured ET values from pot experiments to achieve ET values comparable to those of lysimeters.
2.3.1. Density Corrections
Correcting the ET of a pot with crops first involves making it represent the ET of the field with crops planted with the same density as that in the lysimeter. The ETPot was corrected by multiplying the ET produced by a single plant in a pot with the crop density of a lysimeter, as follows:
where ETD is the ET corrected by the lysimeter crop density (mm); ETPot is the originally measured pot ET (mm); AL and AP are the surface areas of lysimeters and pots (m2), respectively; NL denotes the number of plants in a lysimeter; and NP denotes the number of plants in a pot. For winter wheat, the plant quantity refers to the number of tillers.
2.3.2. Area Corrections
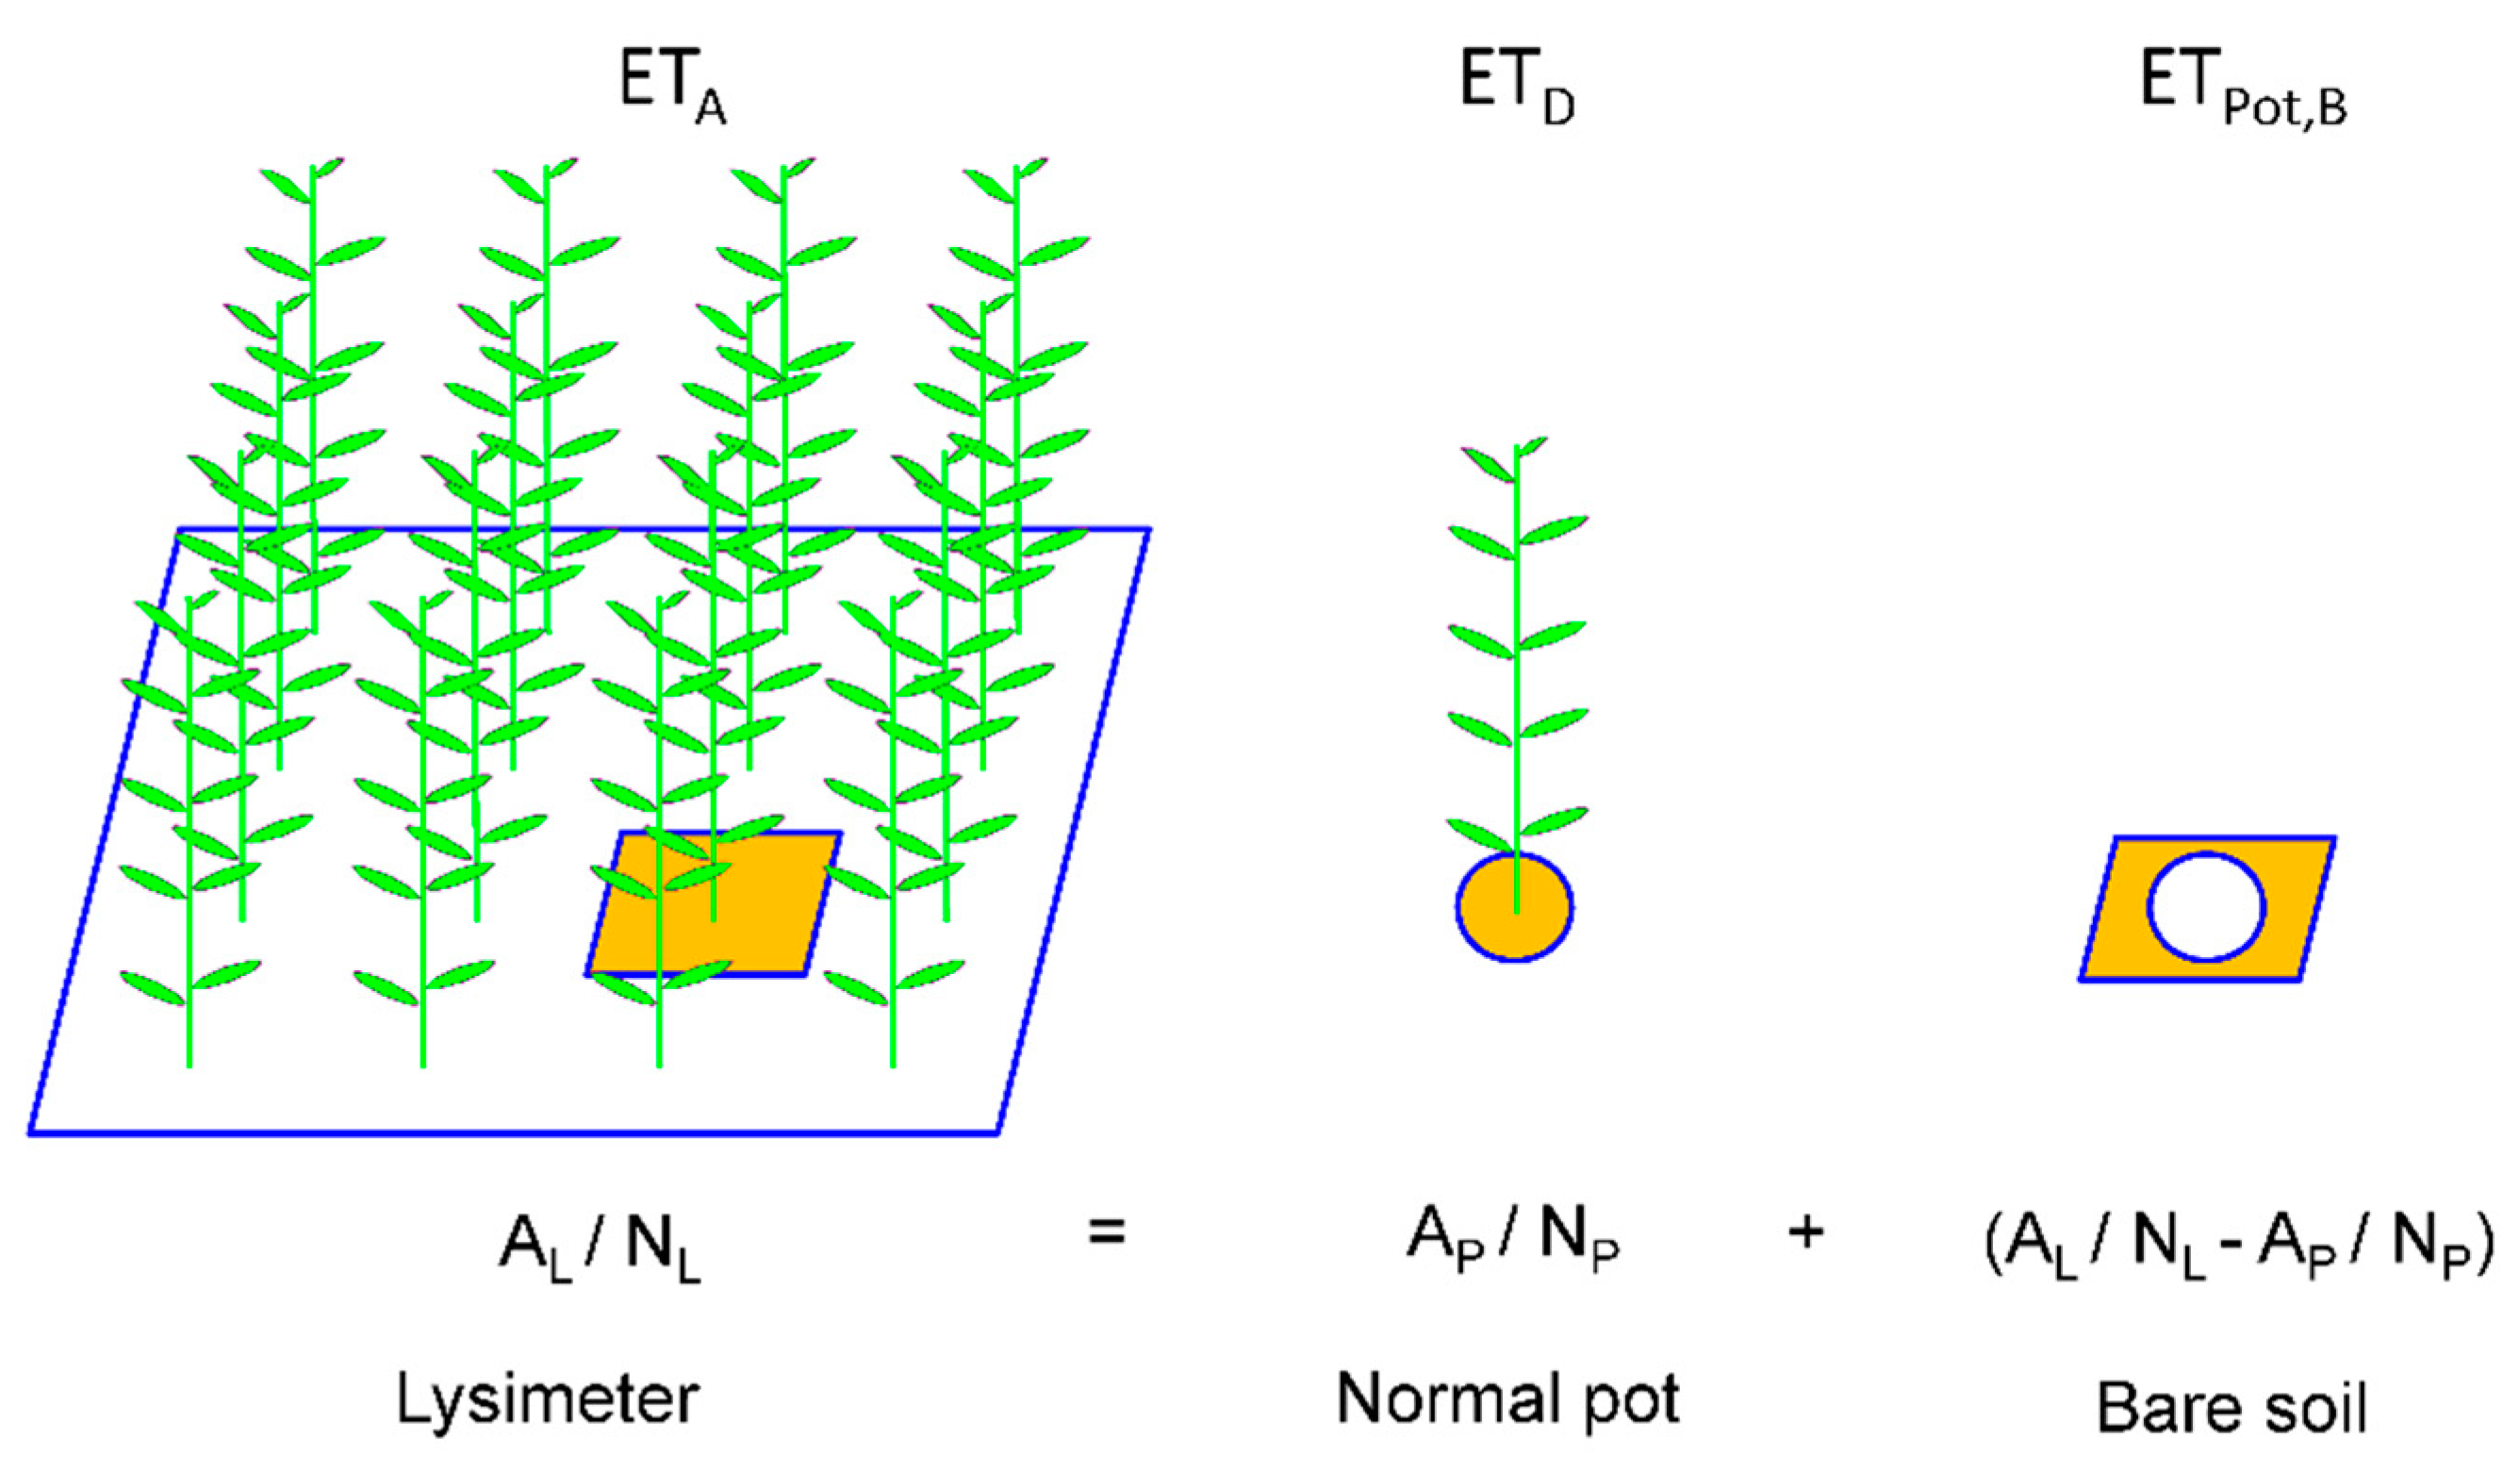
Area corrections for pots with crops were conducted based on the following considerations: (1) the difference between surface areas represented by one plant in a pot and a lysimeter can result in a change in ET; and (2) the missing area in a normal pot during density corrections is bare soil on which the evaporation is assumed to be equal to that of the pot without crops at the same soil moisture content level. For planted pots with covered soil surfaces, area corrections are not required, as the evaporation in bare soil is negligible. The method used to conduct area corrections for normal pots is shown in Figure 3, and the expression is as follows:
where ETA is the ET corrected by the representative area per plant in a lysimeter (mm), and ETPot,B is the mean measured ET for pots with bare soils of the same soil moisture content level (mm).
2.3.3. Biomass Correction
Because crop transpiration water use efficiency (TWUE) is conservative for a crop suffering from soil water or nutrient stress [31,32], ET reduction can be explained by the dry biomass reduction. Biomass levels in the planted pots were also corrected based on the crop density of a lysimeter using the same method as that applied to ET values. Biomass corrections for normally planted pots were conducted based on ETA using the following formula
where ETB is the ET corrected by the amount of dry biomass in a lysimeter (mm), ML is the amount of aboveground dry biomass in a lysimeter at harvest (kg m−2), and MD is the amount of aboveground dry biomass in a planted pot at harvest corrected by the crop density in a lysimeter (kg m−2). ETD,C and MD,C are the mean ETD and mean MD, respectively, for the planted pots with covered soil surfaces.
For the planted pots with covered soil surfaces, soil evaporation is negligible and, thus, the expression for correcting ET based on the aboveground dry biomass weight in a lysimeter is
2.3.4. Requirements and Procedures for Upscaling ET from Pot Experiments
In this study, we use lysimeters to draw comparisons to quantitatively test the method for upscaling ET values in pots. If the method proposed here can give comparable ET values to those of lysimeters, it is expected to be used for the estimation of field ET at different scales. In sum, it is necessary to determine the minimum requirements and procedures for upscaling ET from pot experiments to the lysimeter or field scale in applications.
- Requirements: At least three pots must be used. First, a normal pot with crops and without cover must serve as a basis for ET correction. Second, a pot with a cover must be used to obtain the ratio coefficient between transpiration and aboveground dry biomass of a specific crop. Finally, a pot with bare soil must be used to determine soil evaporation levels under corresponding soil moisture conditions. For closely planted crops, the last pot can be removed for the negligible portion of evaporation in ET during growing seasons.
- Measurements: Changes in pot weight must be measured using at least a 0.1 mm resolution, because daily cropland ET is normally several or tens of mm. The frequency of weighing is dependent on the time scale used to measure the targeted field. Crop densities and the harvested aboveground biomass amount in pots and the targeted field must be measured. The representative area of one plant can be obtained from the inverse of the crop density.
- Procedures: First, calculate the original ET in the pots. Second, correct the ET in the normal pot and the aboveground dry biomass amounts in the pots with covers using Equation (1) based on the crop density of the targeted field. Third, correct the density-corrected ET using Equation (2) according to the representative area per plant in the targeted field. Finally, correct the area-corrected ET using Equation (3) based on the actual amounts of the harvested aboveground dry biomass in the targeted field.
2.4. Statistical Analysis
A one-way analysis of variance was performed in SPSS to evaluate differences between water treatments in terms of the aboveground dry biomass weights of wheat and maize. A least significant difference (LSD) test was used to differentiate between treatments with significant differences of p < 0.05. All statistical analyses were conducted by using SPSS16.0 (SPSS Inc., Chicago, IL, USA).
Linear regressions and a corresponding determination coefficient (r2) were used to determine the relationship between aboveground dry biomass weights and transpiration for wheat and maize for the pots with covered soil surfaces and to evaluate the degrees of consistency between the corrected daily ET values of the pots and the ET values measured by the lysimeters. Root mean square error (RMSE) was used to quantitate the average difference in daily ET between the pot experiments and the lysimeters after each phase of correction.
3. Results and Discussion
3.1. Soil Water Control in Pots and Lysimeters
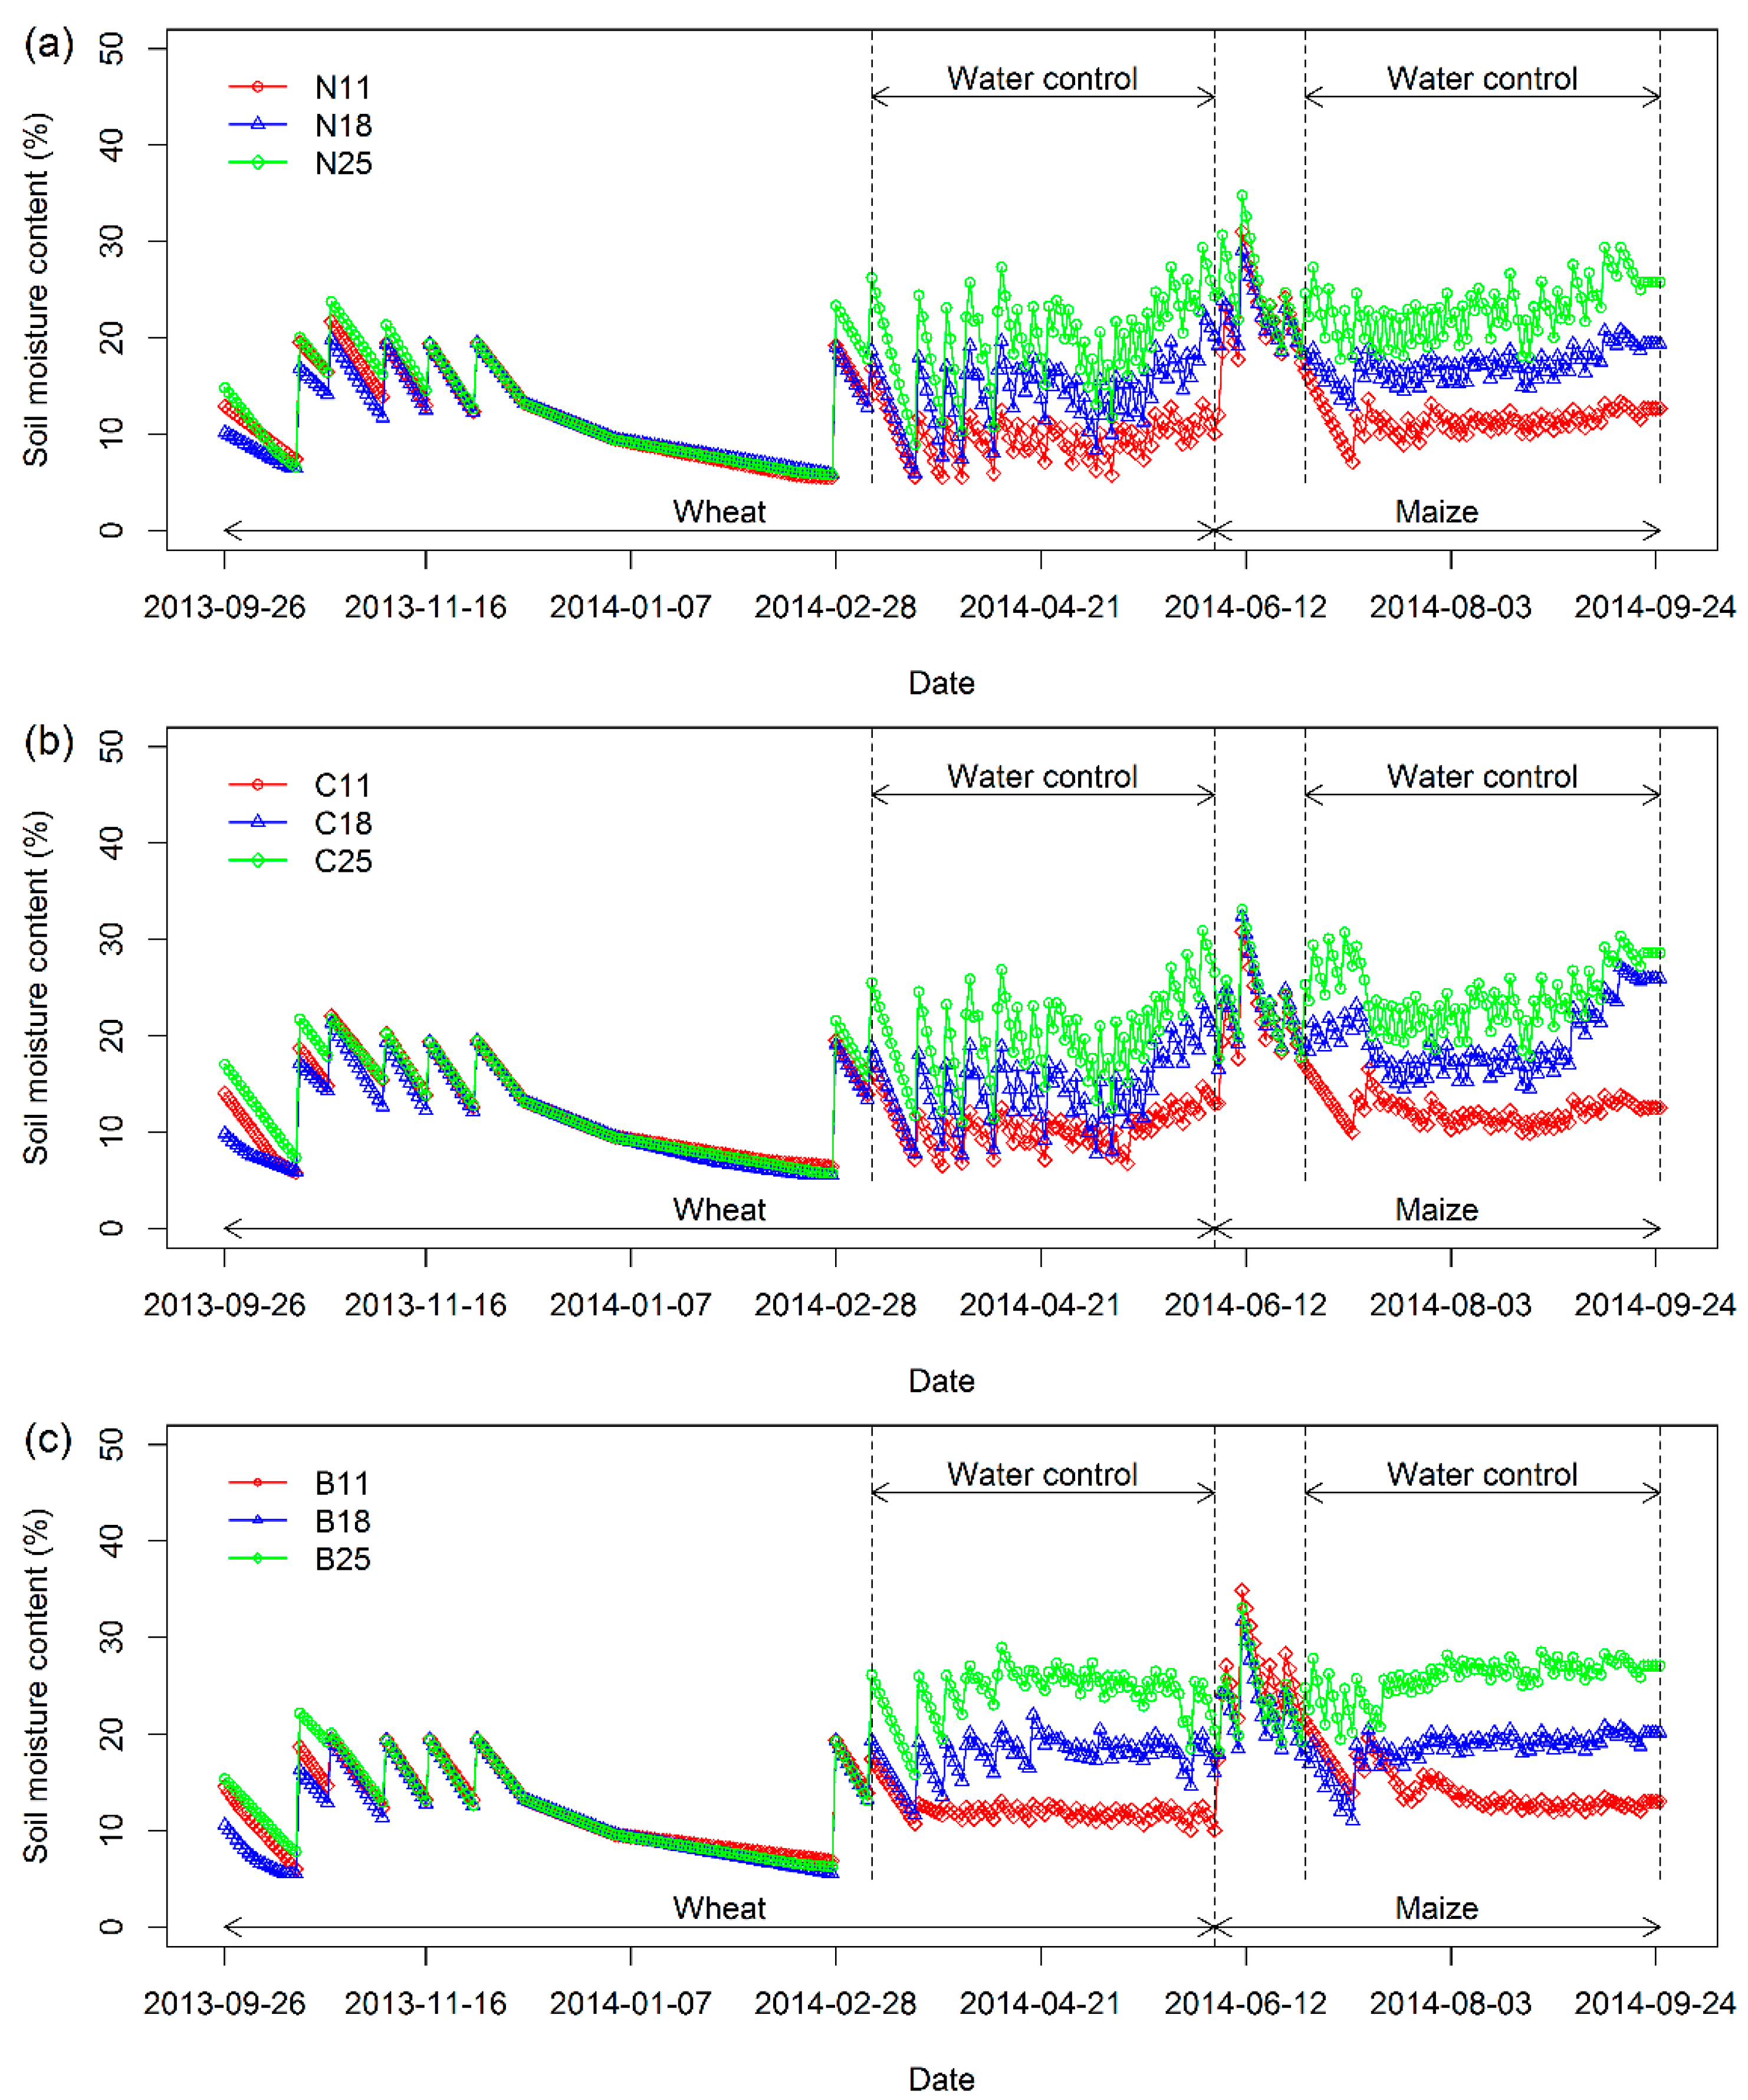
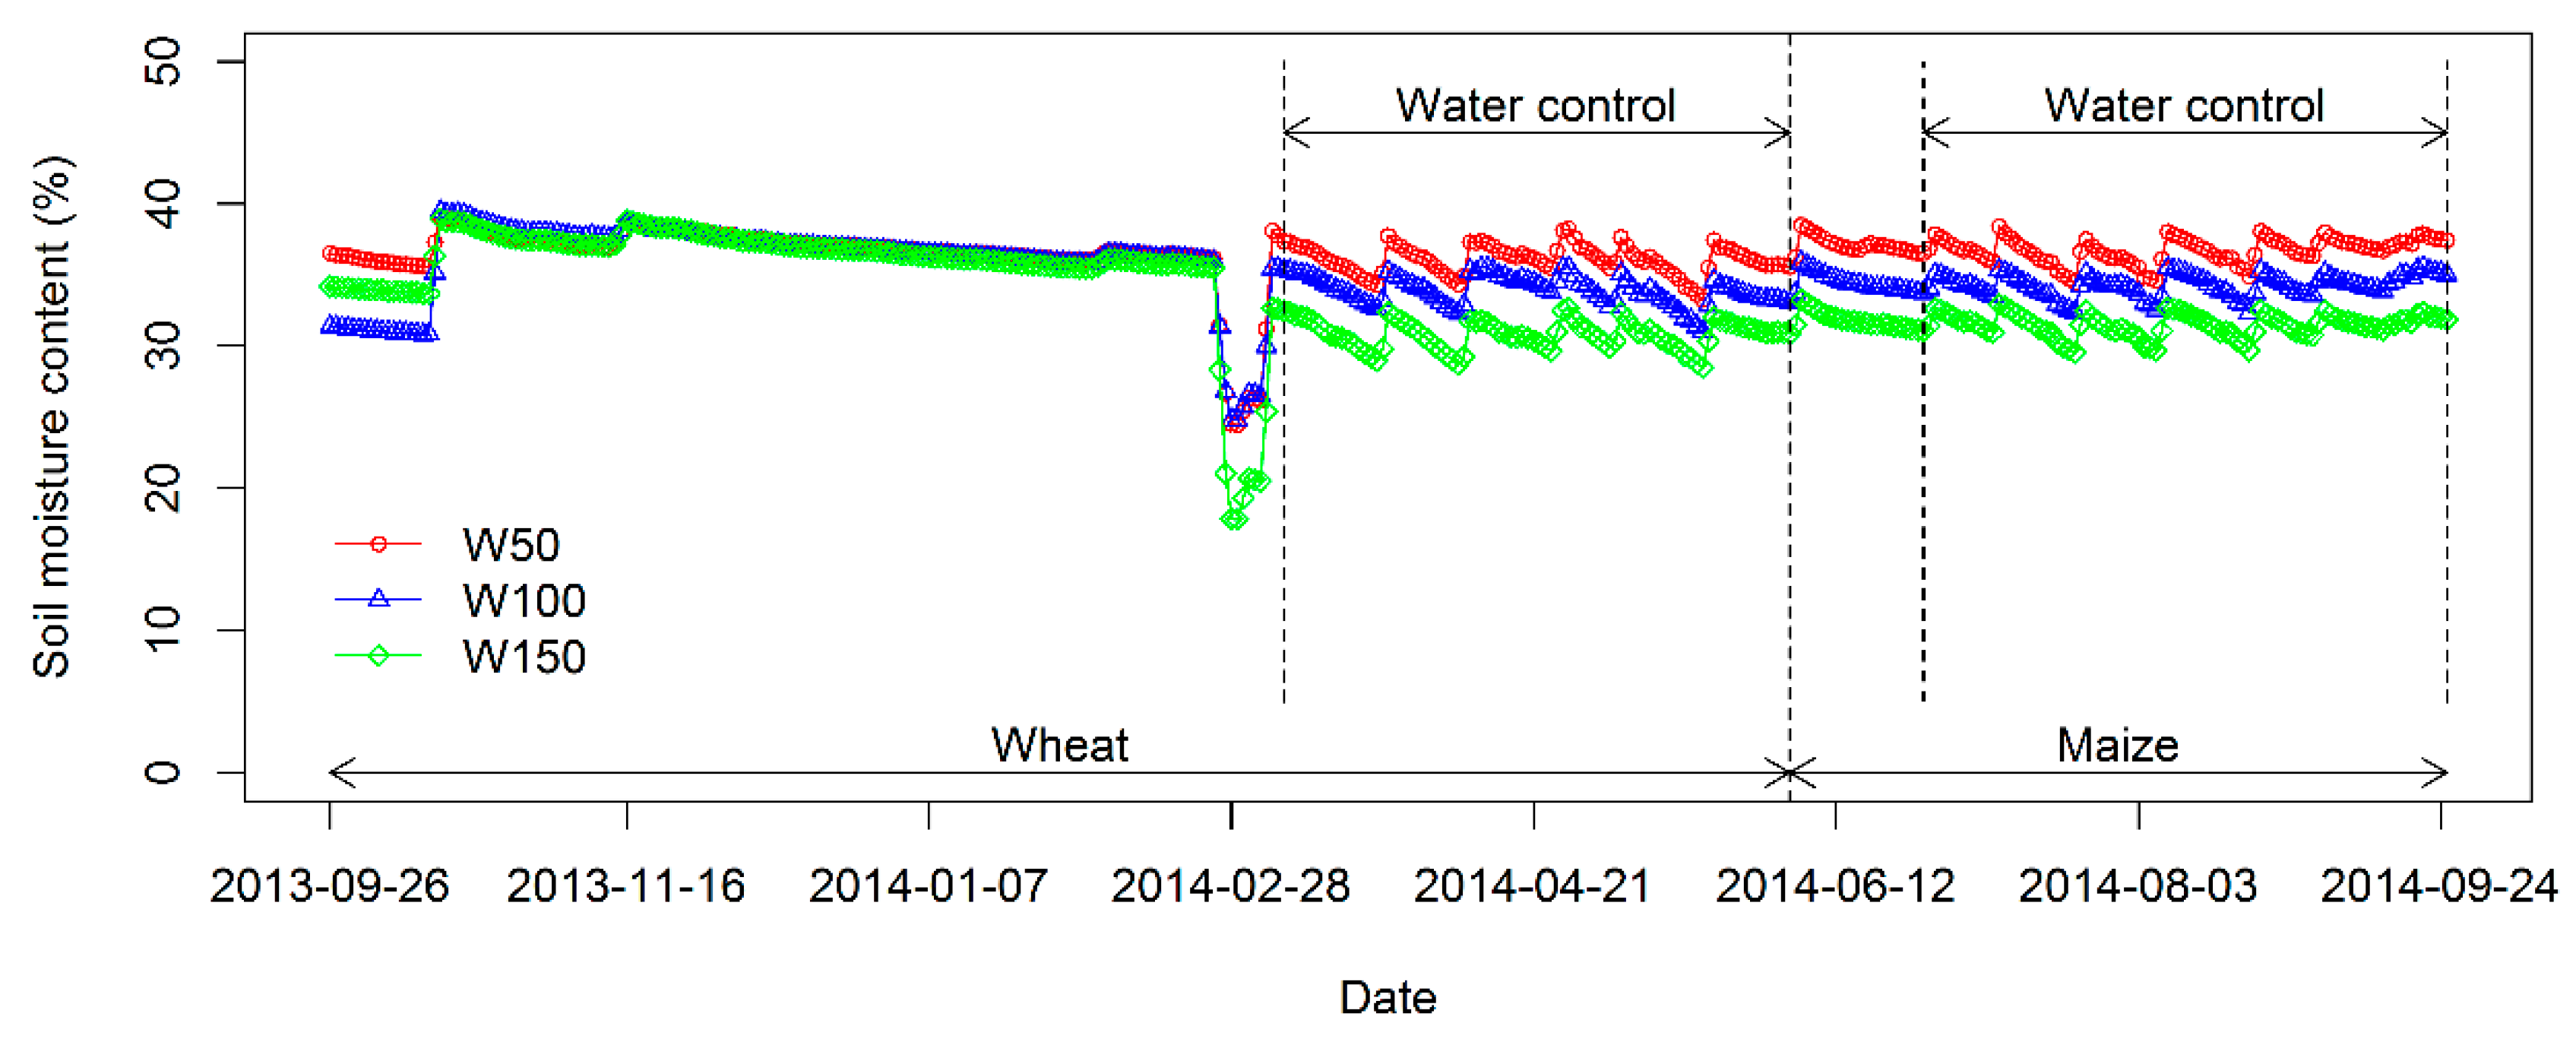
Figure 4 and Figure 5 present the soil moisture content changes that occurred during the wheat and maize seasons in the pot and lysimeter experiments, respectively. As is depicted in Figure 4 and Figure 5, the soil moisture contents of all treatments are the same prior to the water control terms. Soil moisture levels generally fluctuated within the expected range during the water control period. Generally, the soil moisture contents in pots were controlled at the expected level (11%, 18%, and 25%). The actual mean soil moisture contents in the lysimeters are about 37%, 35%, and 32%, respectively, for W50, W100, and W150.
3.2. Crop Growth and Uncorrected Evapotranspiration
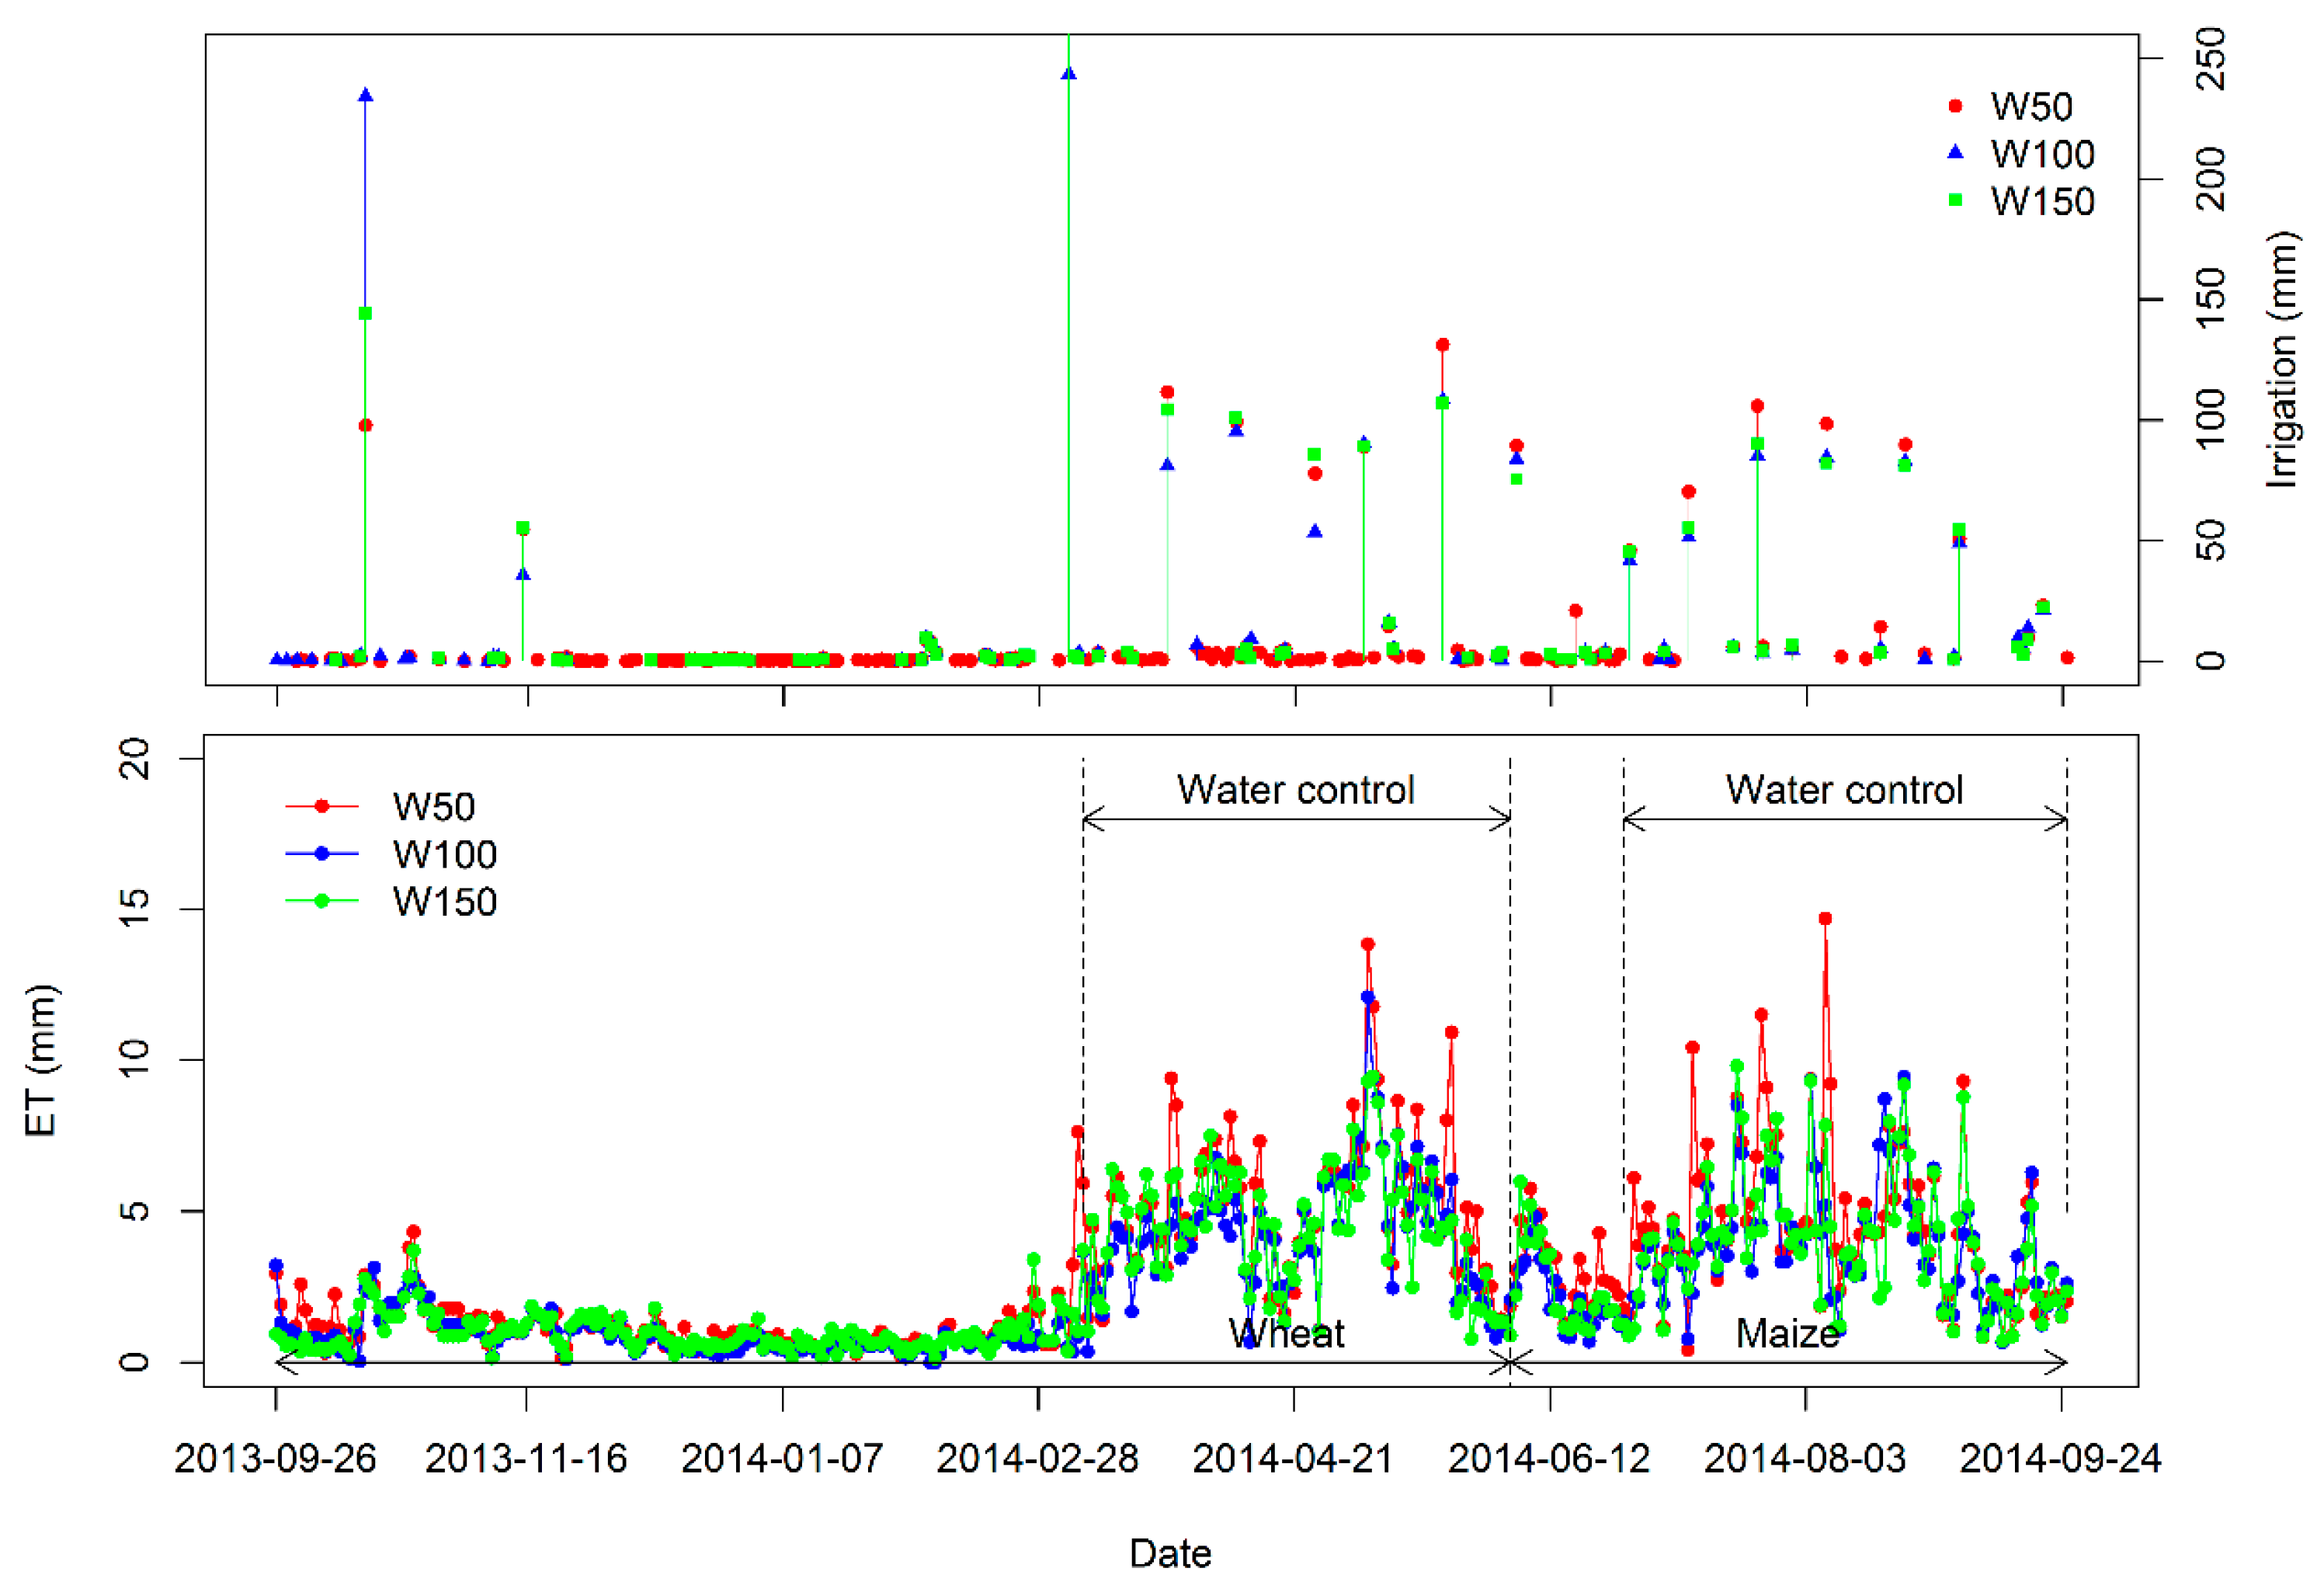
Figure 6 shows the irrigation and ET values for three water treatments applied in the lysimeter experiments during the wheat and maize seasons. More frequent irrigations required by controlling soil moisture levels make the total ET values of all treatments higher than the annual ET value (830 mm) in this region. The total ET values for the treatments W150, W100, and W50 are 926 mm, 976 mm, and 1133 mm, respectively. Distinct differences in daily ET curves between the three water treatments emerge after irrigations. An increase in irrigation amount may contribute to an increase in ET, as a heavier irrigation leaves more water available for soil evaporation [40]. For the periods following irrigations, there are no obvious differences between the daily ET curves shown in Figure 6. The results shown in Figure 7 indicate that there is no significant difference in the harvested aboveground dry biomass weights of wheat and maize among the three water treatments in the lysimeter experiments. It can be concluded that all of the lysimeter crops were well-watered, and no water stress occurred. Thus, the average crop parameters in the lysimeters (Table 2) were taken as a reference to correct the measured ET values in the pot experiments. The average daily ET curve of lysimeters shown in Figure 6 was taken as the daily ET curve under sufficient irrigation to draw comparisons with the corrected ET values derived from the pot experiments.
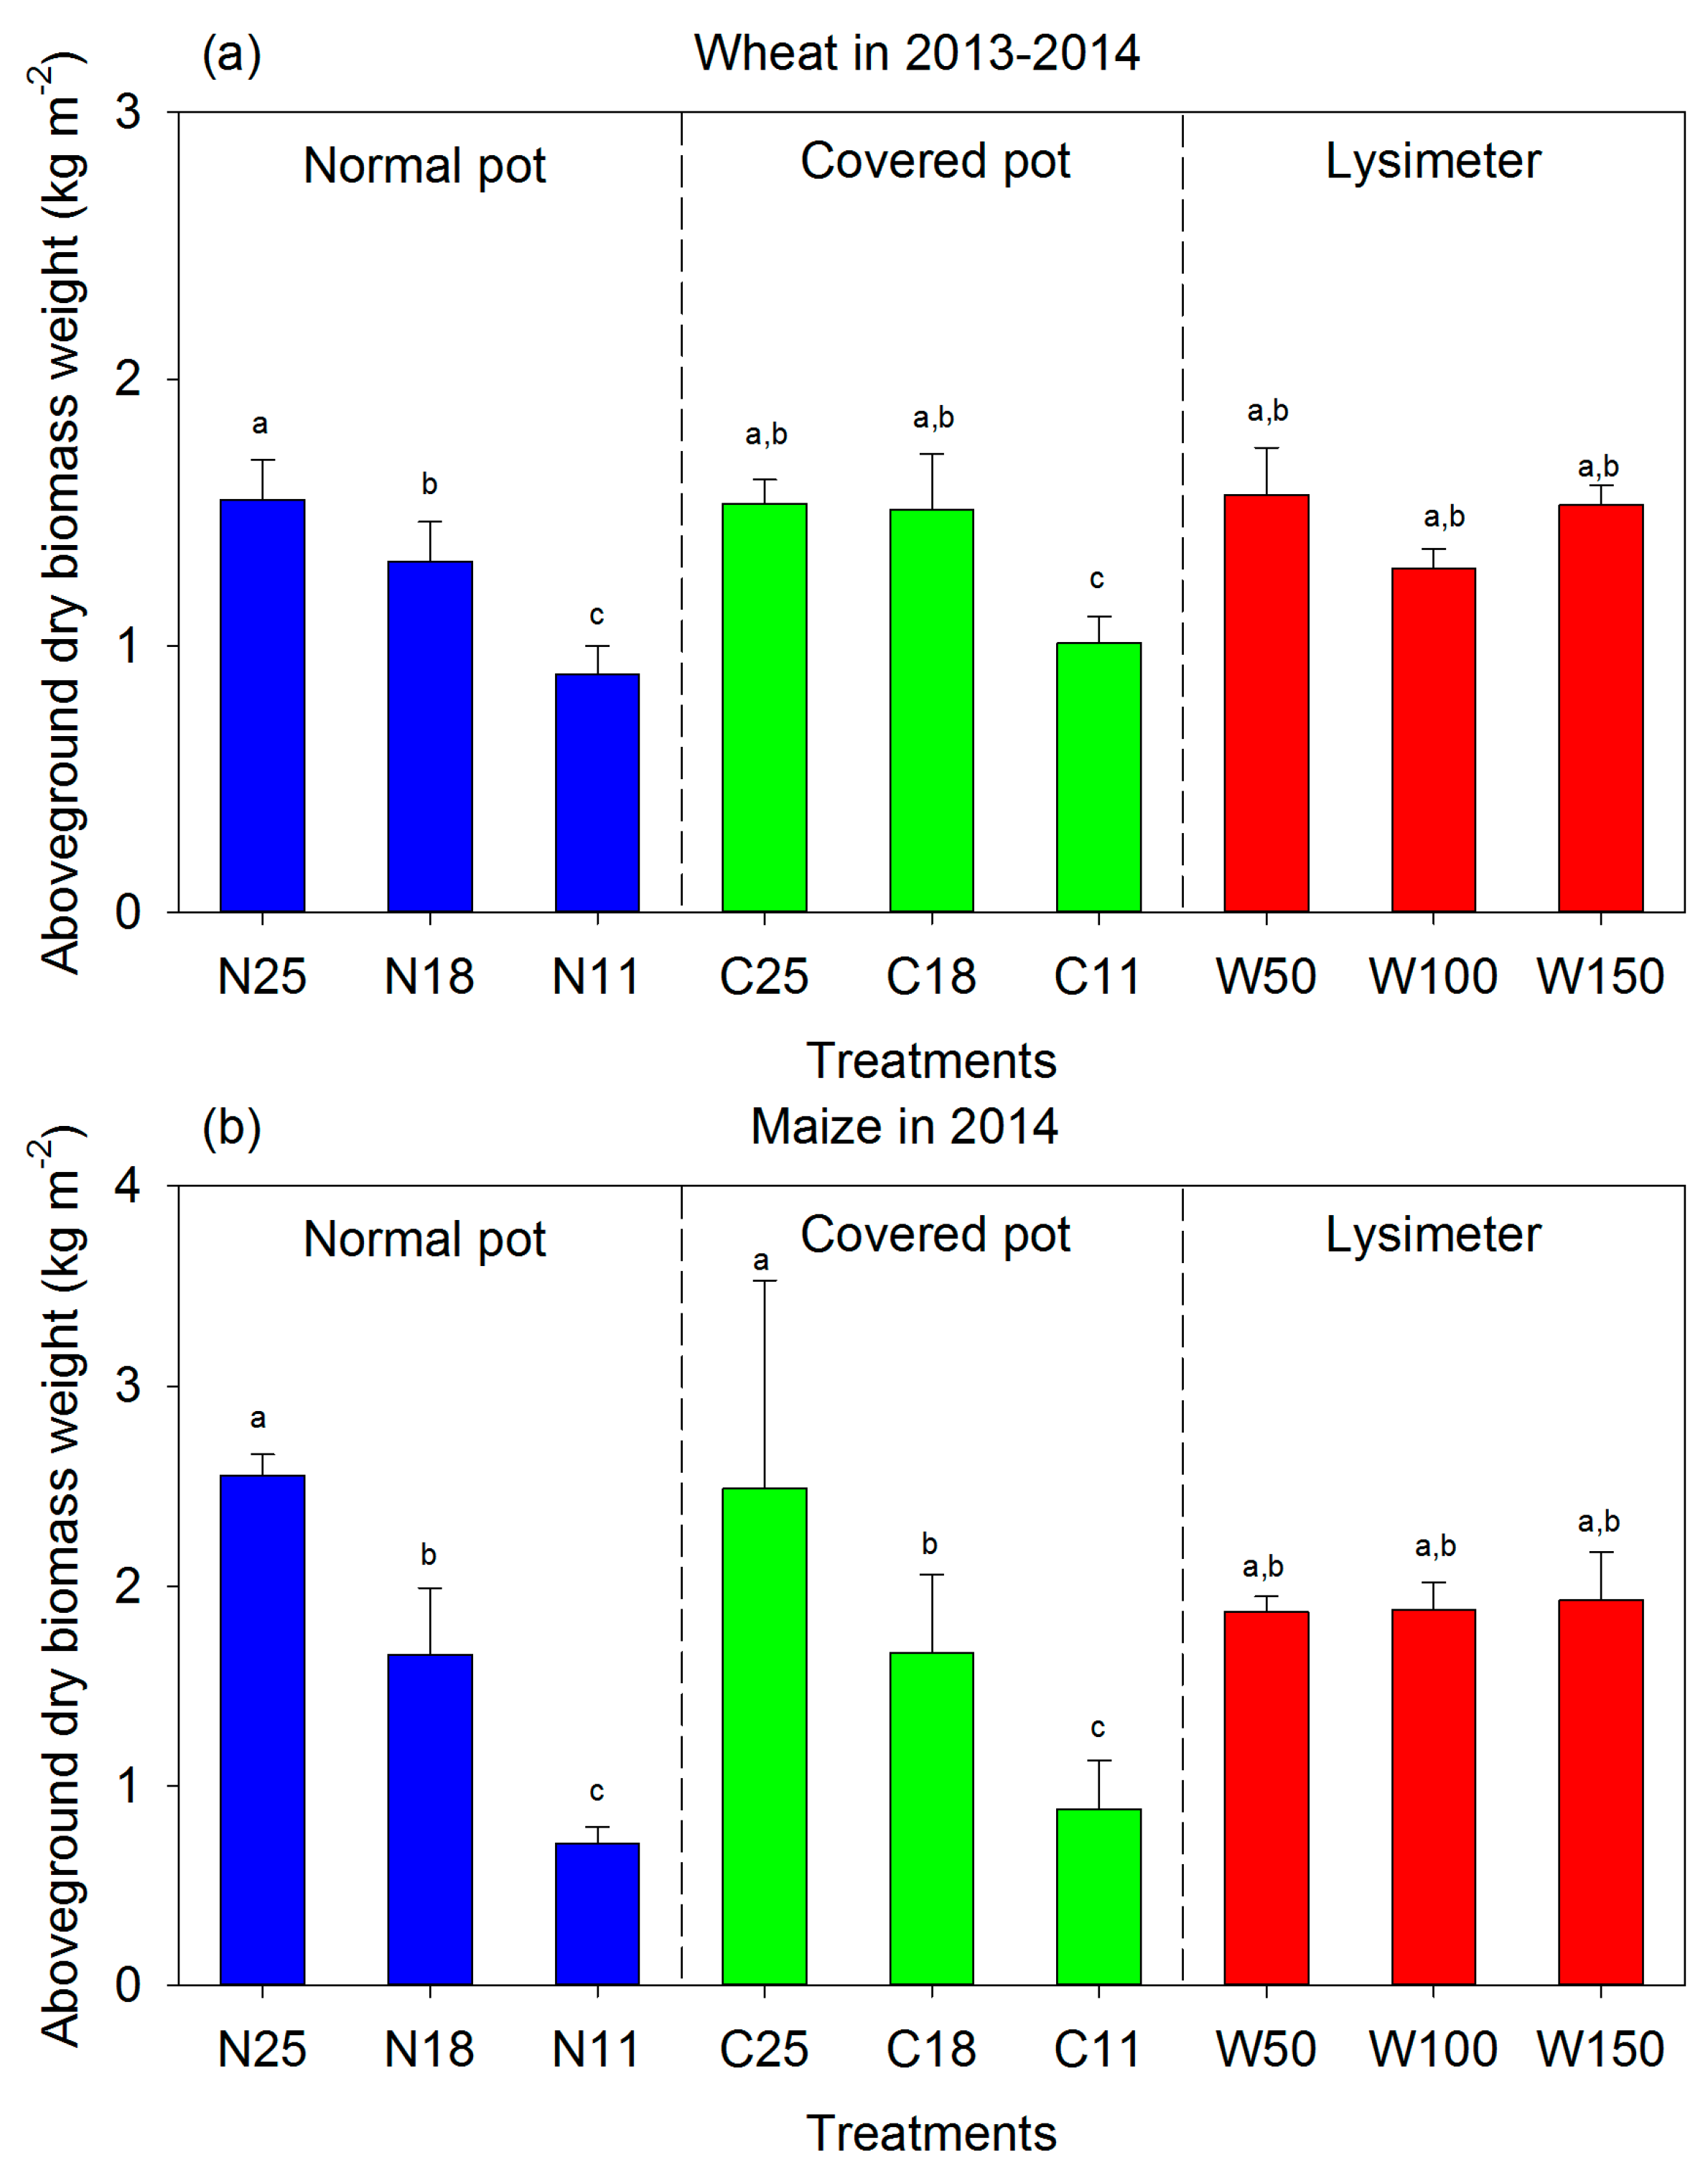
As is shown in Figure 7, the water treatments applied in the pot experiments had a significant effect on the aboveground dry biomass weights of wheat and maize. The aboveground dry biomass weights in the pots increased with soil moisture contents, while no significant difference was found among the three water treatments in the lysimeter experiments whether for wheat or maize. Additionally, no significant difference in aboveground dry biomass weight was found between the normal and covered pots with the same soil moisture levels. The aboveground dry biomass weights of all three water treatments in the lysimeters at harvest show no significant differences from those of the 18% and 25% water treatments in the pots, but show a significant difference from those of the lowest water treatments (11%) applied in the pot experiments for both wheat and maize. Thus, it can be concluded that the soil water content levels in the lysimeters were comparable to those between the 18% and 25% water treatments used in the pot experiments.
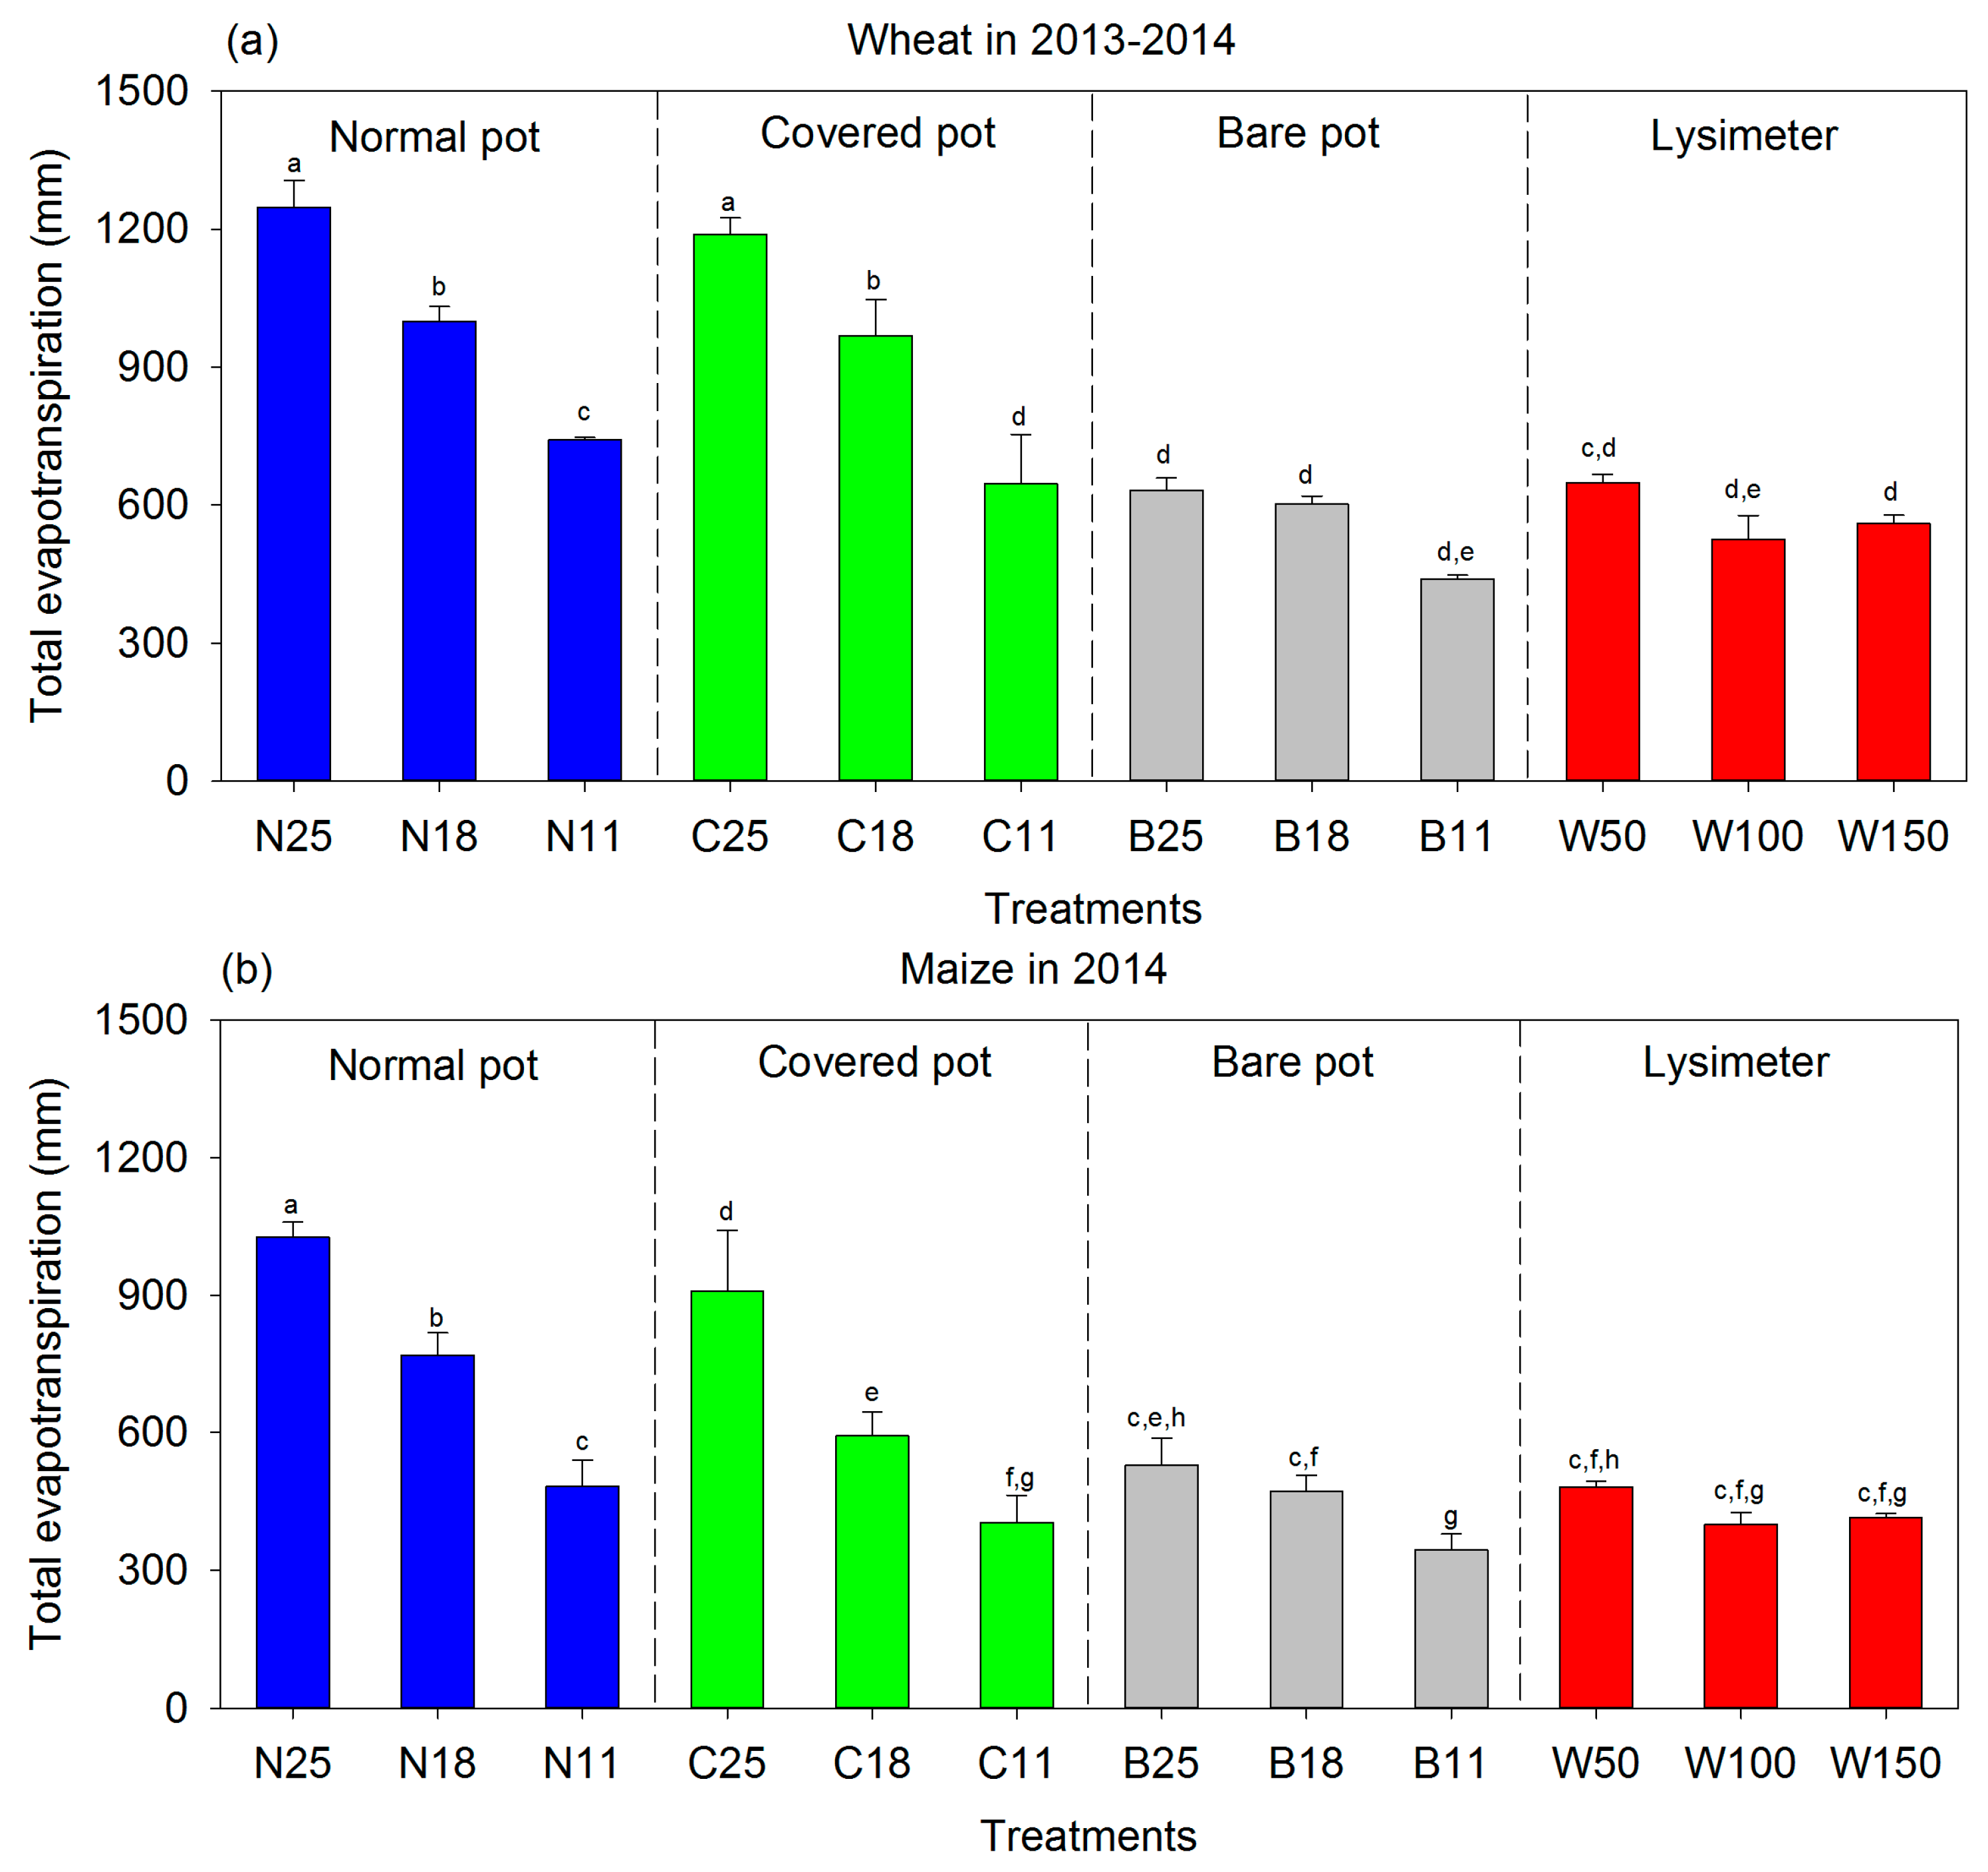
Figure 8 shows the uncorrected total ET per unit of surface area for the pots and lysimeter experiments conducted in the wheat and maize seasons. A significant difference in the total ET values was found within the group of normal and covered pots with crops. The total ET values decrease with reduced soil moisture contents for the normal and covered pots with crops. However, no significant difference can be found among the three water treatments of lysimeters for the wheat and maize seasons and for the group of bare soils in pots for the wheat season. Even for the maize season, only the lowest moisture treatment (B11) presents a significantly different total evaporation value from that of the other two water treatments of the bare soil group. This is reasonable, because soil evaporation is considerably affected by the available water amount, which mainly comes from the very thin layer close to the soil’s surface [41]. Once again, the results shown in Figure 8 confirm that the crops in all of the lysimeters were well-watered and, thus, low levels of water stress occurred.
As is shown in Figure 8, compared to those of the pot experiments, the total ET values in the lysimeters are generally comparable to those of the bare soil treatments and the lowest water treatments involving pots with crops. Nevertheless, the total ET values for the high and middle water treatments involving pots with crops are significantly different from those of the lysimeters with little water stress. It is most likely that the volume effects result in the great differences in the measured ET values between the pots and lysimeters [24]. Other possible explanations may involve the differences in crop density, representative areas per plant, and soil moisture and nutrient conditions (Table 2) between the pots and lysimeters. The aboveground biomass weights for wheat and maize at harvest also show different values for the three soil water treatments in the pot experiments, even if the values are corrected based on the average crop density in the lysimeters. Therefore, the ET measured through the pot experiments must be corrected before being adopted.
3.3. Relationship between Aboveground Biomass and Transpiration
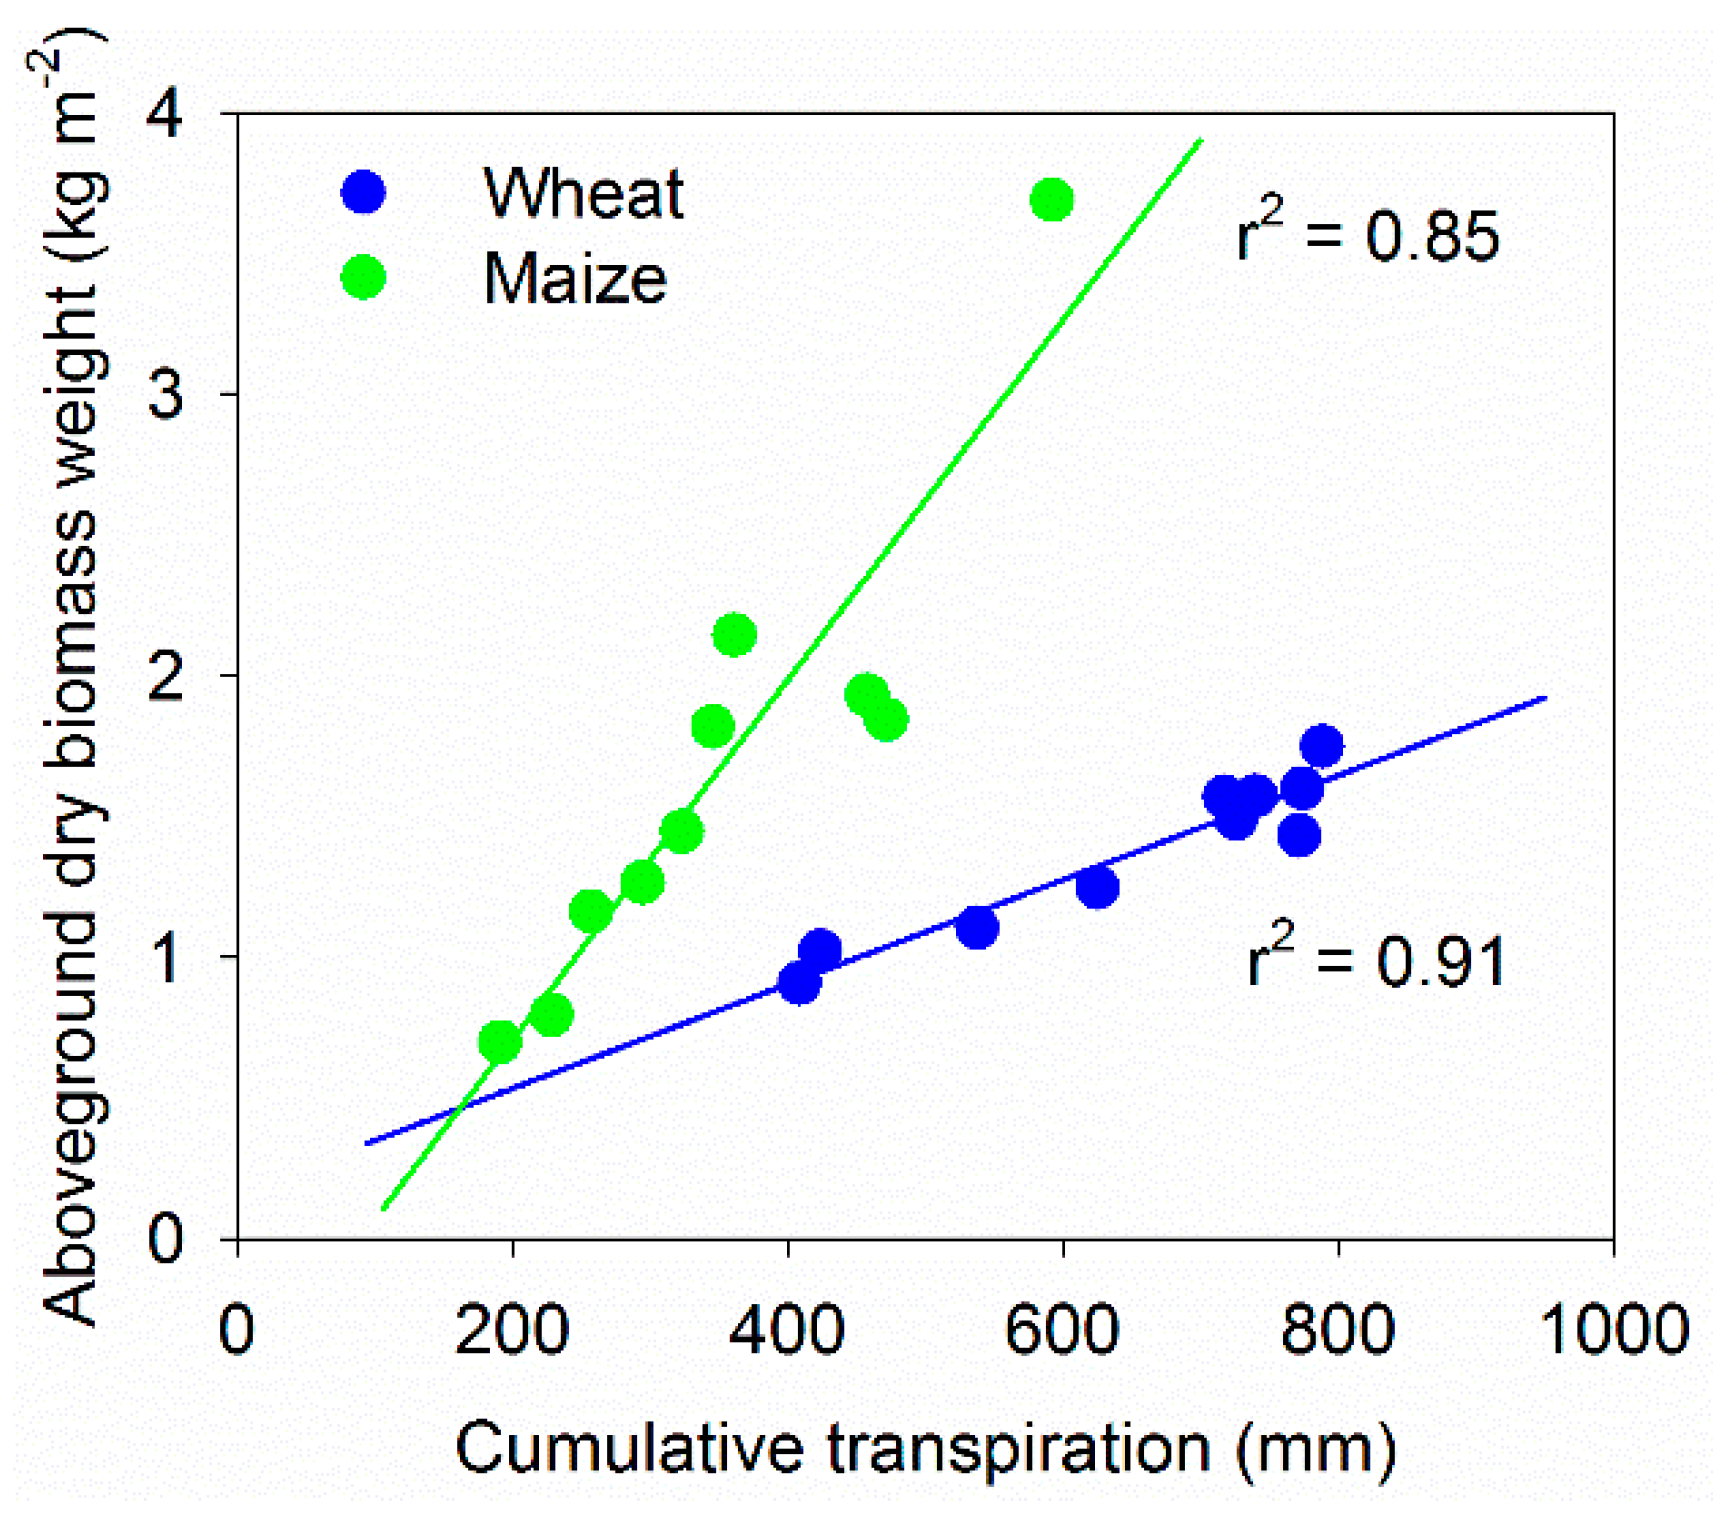
After making corrections based on the average crop density for the lysimeters, relationships between harvested aboveground dry biomass weights and cumulative transpiration during the growing period for both crops were identified and are depicted in Figure 9. The high determination coefficients show that the aboveground dry biomass weights at harvest have a good linear relationship with the total transpiration whether for the wheat or maize season. The result is consistent with many other studies [31,32]. Maize seems to have a higher biomass water productivity level than wheat, which is slightly different from that shown in [24]. A difference in the ratio of roots to shoots may be responsible for these results.
The strong linear relationship between aboveground dry biomass weights and total transpiration denotes that the biomass water productivity of wheat and maize is conservative [32,34] and depends little on water and nutrient levels. Moreover, the result shown in [24] illustrated that this relationship is also stable regardless of the soil volume concerned. The conservative relationship between aboveground dry biomass weight and transpiration forms the basis on which we conduct ET corrections in this study. The results above show that the soil water content levels in the lysimeters fall between those of the water treatments of 18% and 25% used in the pot experiments. Thus, it should be reliable to correct ET values derived from the pot experiments based on this linear relationship to achieve comparable ET values with the lysimeters.
3.4. Corrected Evapotranspiration from the Pot Experiments
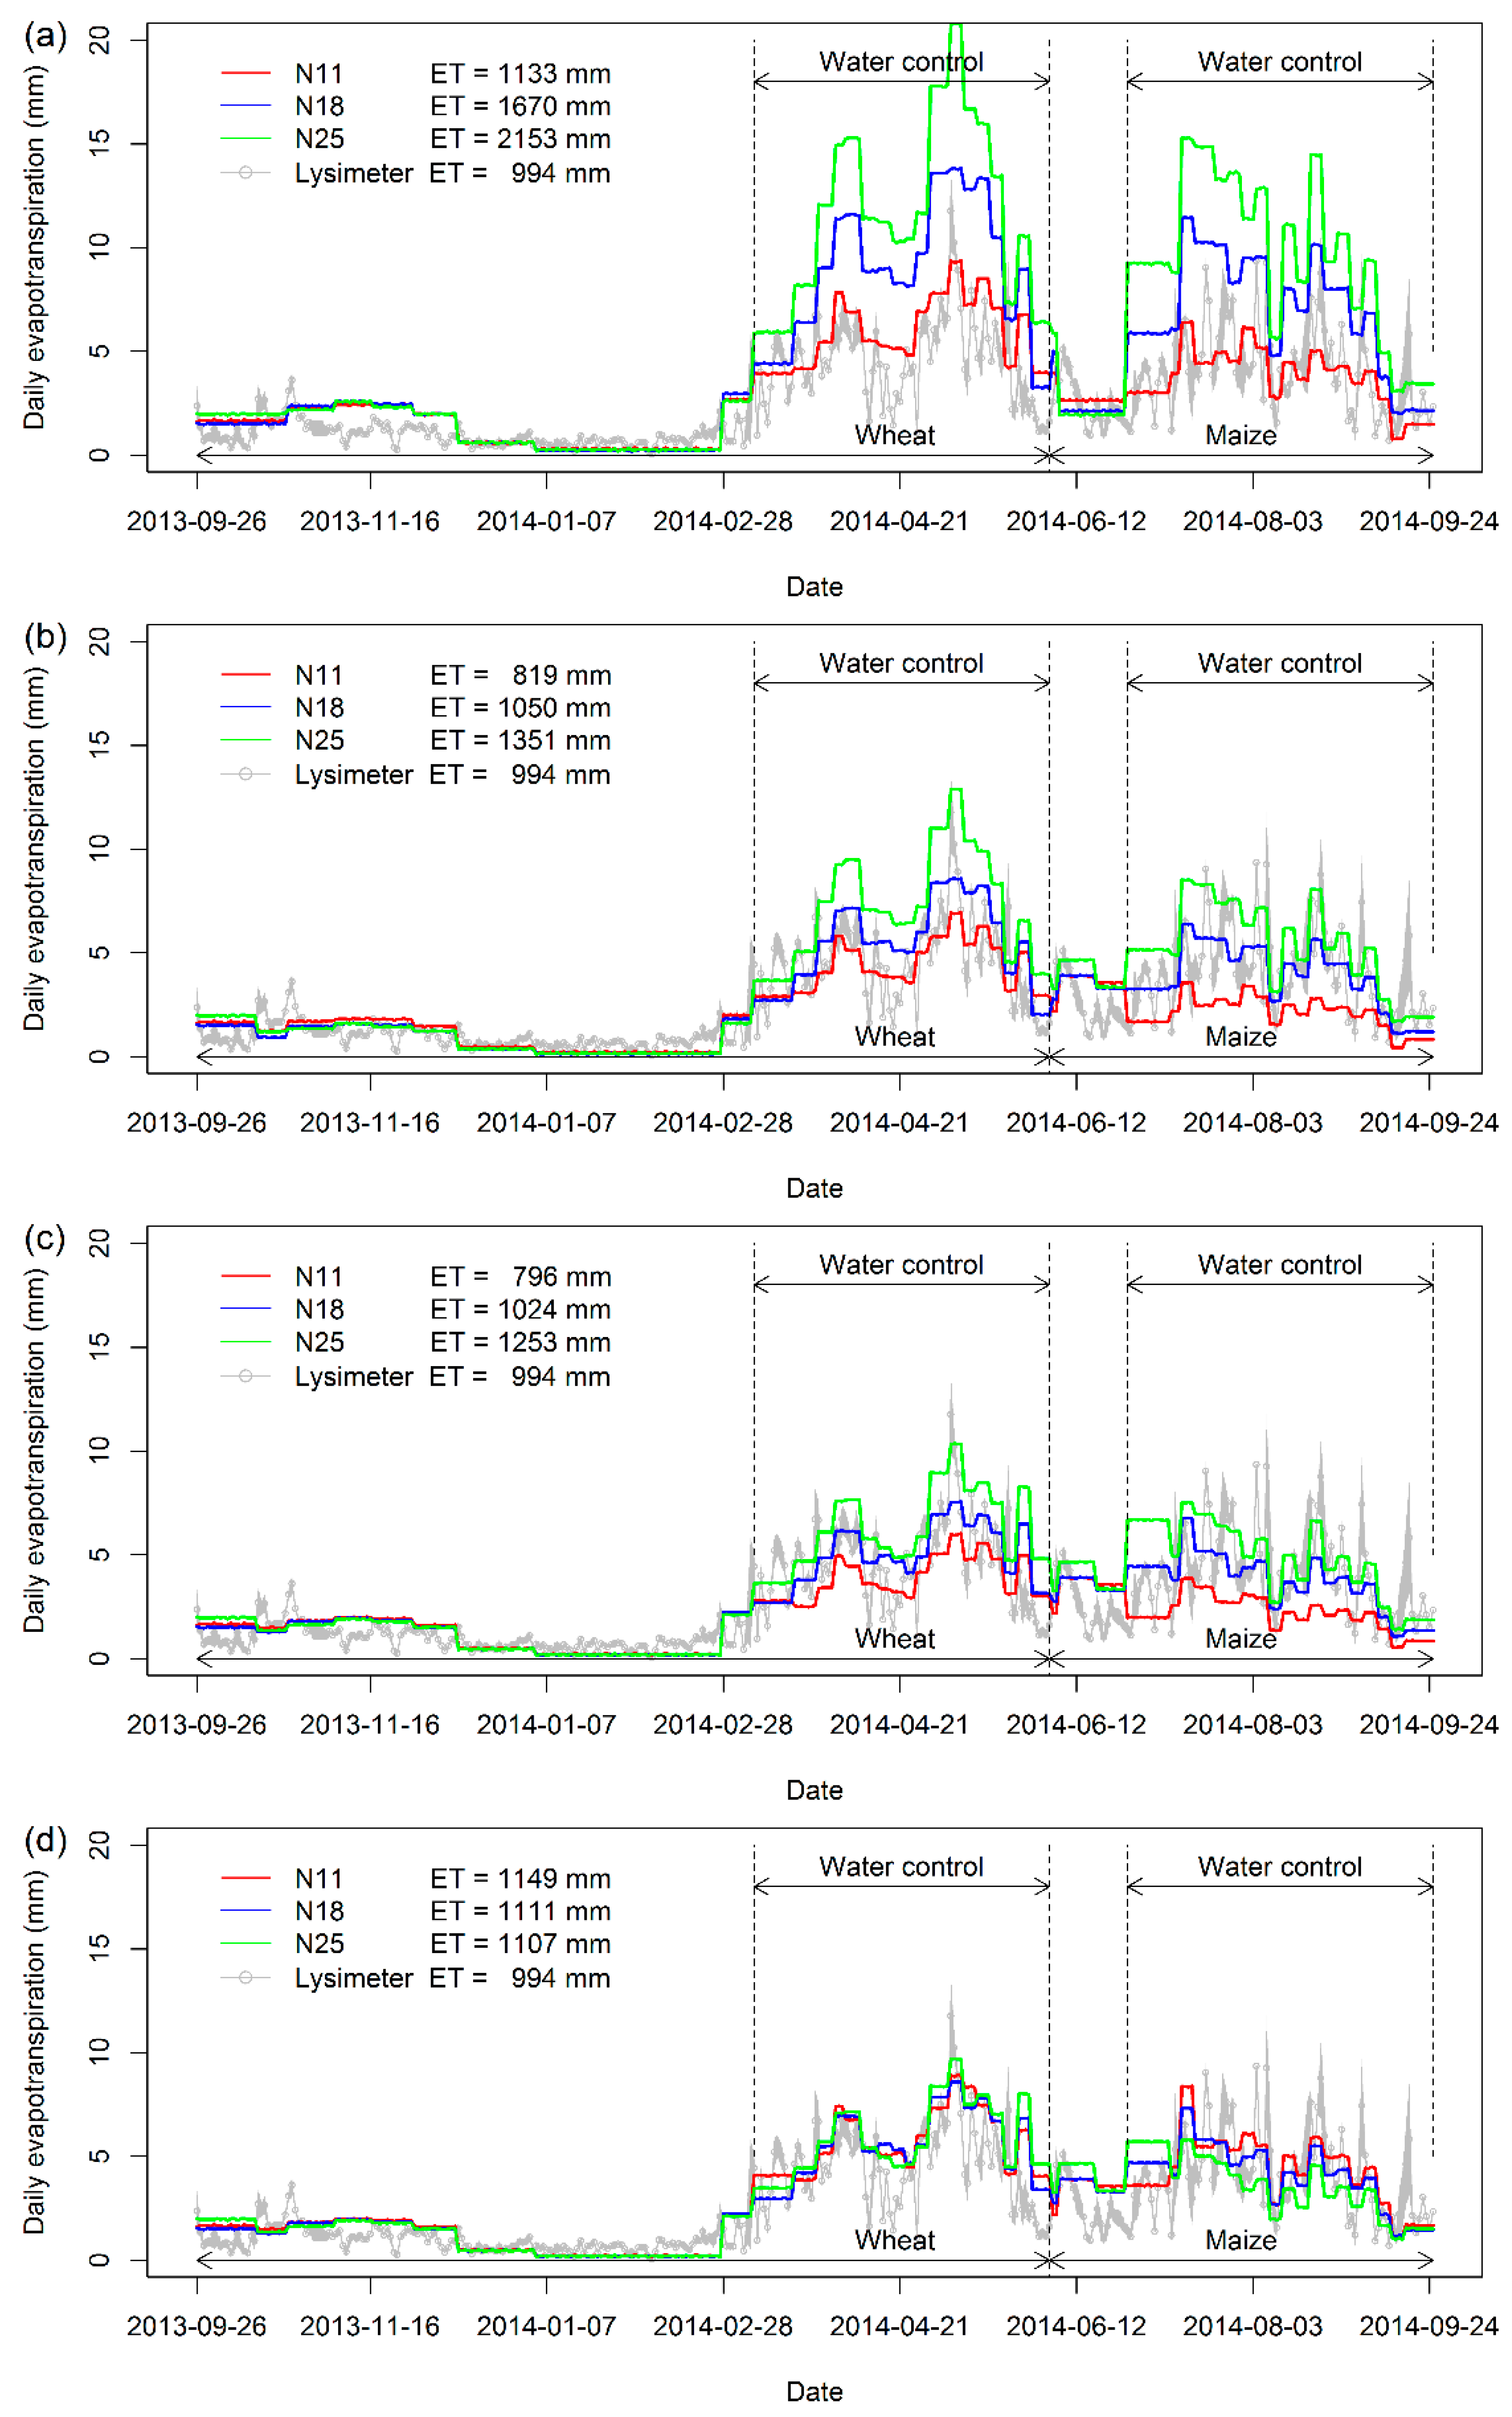
Figure 10 compares the average daily ET curve of the lysimeters with the uncorrected daily ET curves of the normal pots with three water treatments (N11, N18, and N25), with the corrected daily ET curves after the successive corrections of crop density, the representative area per plant, and the aboveground dry biomass weight. Clearly, the uncorrected daily ET values of the normal pots (N18 and N25) are much greater than those of the lysimeters (Figure 10a). Most daily ET values measured during the middle and later stages of wheat and maize development are higher than 10 mm, diverging from the observed data based on lysimeters in the same region [42,43]. The total pot ET values of the two seasons for N11, N18, and N25 are 14%, 68%, and 117% greater than those measured by the lysimeters, respectively.
After making corrections based on the crop density derived from the lysimeters, all three daily ET curves of the pot experiments drop considerably (Figure 10b). A lower ET was obtained for N11 than for the lysimeter, which is reasonable because N11 involves water stress while the lysimeter experiments represent conditions of sufficient water supply. The reduction in the total ET values of the treatments N25 and N18 after crop density corrections can explain 69% and 92% of the differences in ET between the pot and lysimeter experiments, respectively, as depicted in Figure 10a.
As is illustrated in Figure 3, even after density corrections are made, the ET still cannot represent the ET derived from the lysimeters because the bare soil area values for soil evaporation are still different from those in the lysimeters. The results shown in Figure 10c indicate that the corrected ET curves based on the representative area per plant in the lysimeters become similar to those of the lysimeters except for N11, the most serious case of water stress. The area correction for this step can further explain 9% and 4% of the differences in ET between the pot and lysimeter experiments, respectively, as shown in Figure 10a.
For the different soil water conditions, the daily ET curves of the pot experiments are distinct from one another, as shown in Figure 10a–c. It is impossible to obtain comparable daily ET values to those of lysimeters via pot experiments without any corrections. The aboveground dry biomass weight may serve as a substitute for soil moisture content in correcting daily ET, as its relationship with transpiration depends little on the available soil volumes of wheat and maize roots [24]. As shown in Figure 10d, differences in daily ET values from the pot experiments are almost eliminated in the corrected daily ET curves by the aboveground dry biomass weight in the lysimeters. The corrected daily ET curves from the three water treatments of pot experiments almost coincide with one another during the wheat season. Although there are still some differences in daily ET curves between the three water treatments of the pot experiments during the maize season, such differences have been greatly reduced. Compared to the wheat season, the corrected ET values for the maize season appear to be more susceptible to pot soil moisture conditions. As a result, an 83% difference in the uncorrected total ET between N18 and the lysimeters, and a 90% difference between N25 and the lysimeters, were eliminated by applying all of the three corrections listed above. The relative errors of the corrected total ET values from the water treatments N11, N18, and N25 amount to approximately 16%, 12%, and 11%, respectively, relative to those of the lysimeters.
Table 3 compares the RMSEs of the daily ET values derived from the pot experiments and lysimeters after each phase of correction for the wheat and maize seasons (Figure 10). Before corrections are made, the RMSEs of the daily ET values in the pots are greater than 3 mm for the middle and high water treatments. The maximum RMSE can reach 6.02 mm in the maize season, which is higher than the daily ET values of most days. After corrections, almost all of the RMSEs are less than the uncorrected data. The RMSEs of daily ET values are only approximately 1.34 mm for the wheat season and 1.98 mm for the maize season, which are comparable to the daily ET value during the winter season. Actually, the RMSEs above may be overestimated, because the weighing frequency of 3 days in the pot experiments is not enough to accurately describe the differences of daily ETs within the 3 days. Comparisons at the time scale of 3 days should be more appropriate to reflect the real differences between the two methods. As a result, all of the RMSEs of daily ET values between the pot experiments and lysimeters, whether before or after corrections, drop when comparisons were conducted at the time scale of 3 days (Table 3).
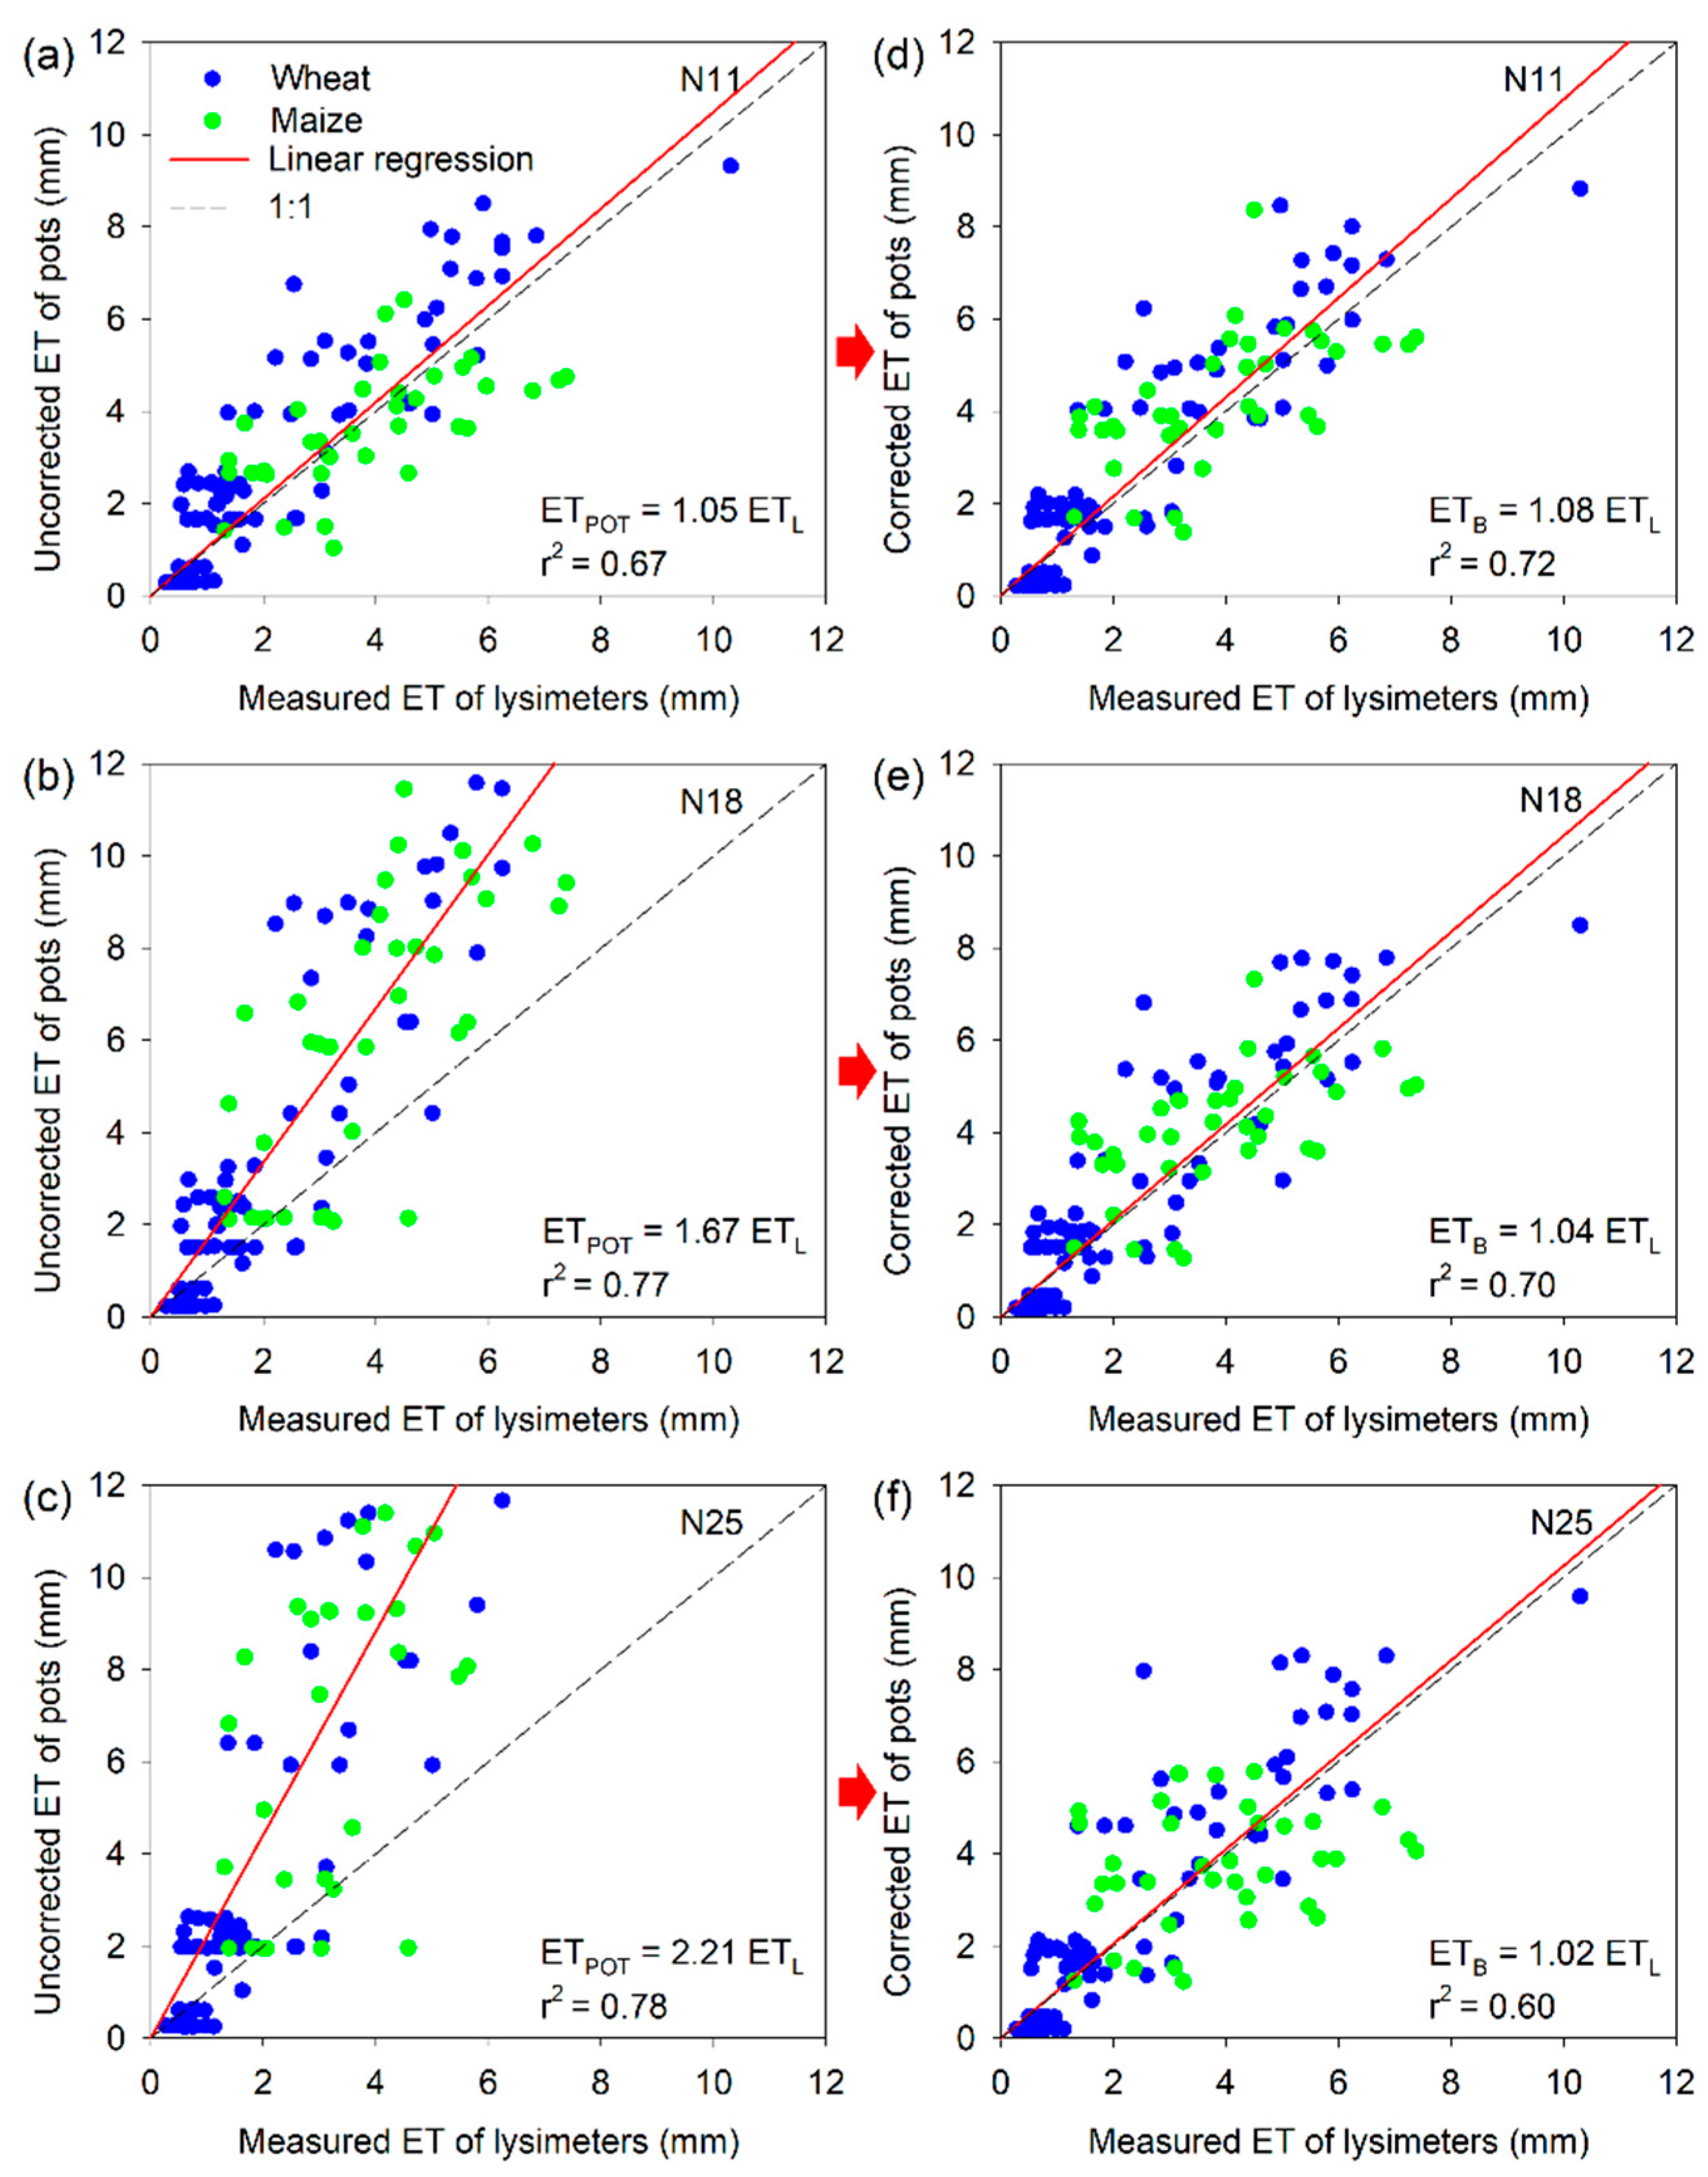
The uncorrected and corrected ET values for all three phases of the pot water treatments (N11, N18, and N25) are compared with the lysimeter ET values in Figure 11. For conducting comparisons on the same time scale, the mean daily ET values of every 3 days were used in Figure 11 to upscale the data of lysimeters to that of the pot experiments. A linear regression without an intercept was conducted to evaluate their degrees of agreement. The slopes of the linear regressions before corrections deviate from 1, especially in Figure 11b and Figure 11c. After corrections, all slopes of the three linear regressions are closer to 1. The corrected ET values are slightly greater than those measured by the lysimeters with a relative error of 2–8%. The determination coefficient (r2) decreases from 0.77 to 0.70 for N18, and from 0.78 to 0.60 for N25, but increases from 0.67 to 0.72 for N11, which is comparable to some results of comparisons between eddy covariance and Bowen ratio-energy balance methods in [44], and between eddy covariance and a large-scale weighing lysimeter in [16]. Considering the great differences in soil volume, soil water, and nutrient conditions between lysimeters and pots, the determination coefficients in Figure 11, which are relatively lower than those in the comparisons among other methods for measuring ET, should be acceptable. This implies that the corrected daily ET curves of the pots are generally consistent with those of the lysimeters.
It is interesting to explore the causes of such differences in ET found between the pot and lysimeter experiments after a series of corrections were made. First, the different frequencies of the measurements should be responsible for the discrepancy. The lysimeter data were obtained once a day, while the pots were weighed once every 3 days. Thus, the peak daily ET values, especially those measured immediately after irrigations, were decreased by using the mean value to downscale the measured pot ET values. Second, the different irrigation schedules applied also differentiate the daily ET values of the pots and lysimeters, as soil evaporation is very sensitive to irrigation as is shown in Figure 6. Third, the effects of different soil water levels on soil evaporation are not considered in our corrections. Such an effect could be magnified with a decrease in the crop fraction [45]. Fourth, potted plants can be damaged by disease or pest infestations, which cannot be corrected by a normal relationship between crop biomass weights and transpiration. Fifth, the water biomass productivity of wheat and maize is not necessarily constant on a daily scale [31,32,34,46], even if it appears to be conservative for the crop season. The actual allocation ratio of photosynthetic products to roots and shoots varies as crops adapt to their ambient environments (e.g., water or nutrient stress [28,47,48,49,50,51,52], or light available to shoots [53]). Finally, edge effects of pots [19] on ET cannot be eliminated by the linear corrections. Also, the effects of competition that occur due to plant density are not linear [54], and, thus, cannot be corrected in our approach.
It is of value to discuss the ways to improve the accuracy of the corrected ET derived from the pot experiments. As discussed above, most of the errors in daily ET values, and, thus, total ET values for growth seasons, may be attributed to the pot sizes and to the different water management strategies employed, which can be overcome to some extent. For example, a representative area per potted plant that is consistent with those for the lysimeters could be used to reduce the discrepancies by regulating crop densities or by using pots of a particular size. The water management in pots could be improved by applying irrigations with a consistent schedule and frequency with lysimeters. If more frequent irrigation is really required, soils in pots should be watered through an inserted tube to prevent excess soil evaporation [24]. A fully automatic and well-controlled micro-lysimeter with crops [21,23] helps to further reduce artificial errors in measurements and improve the measurement accuracy at a smaller time scale. As the linear relationship between dry biomass levels and transpiration is not necessarily safe when applied to a broad range of water conditions [24], comparable soil moisture conditions should be maintained to avoid violating this linear relationship. Finally, proper management strategies should also be adopted to protect crops from disease and pest infestations.
4. Conclusions
In this study, the measured ETs of the pot experiments involving different water treatments were found to differ from those of the lysimeters. Causes of such differences in ET values were analyzed, and a series of corrections were proposed to eliminate such discrepancies. After corrections were made, discrepancies in the total ETs or mean daily ETs between the pots and lysimeters were greatly reduced from a maximum of 117% to only about 10% for both the wheat and maize seasons. The correction method proposed here can be further improved by controlling the crop density and pot size and by improving soil water management strategies. Overall, pot experiments are cost-efficient, easy to conduct, and broadly applicable. Such experiments can serve as a feasible way for estimating or upscaling ET in the field at regions with limited conditions, in which large-scale weighing lysimeters, an eddy covariance device, and even meteorological data are not available, especially when total crop water requirements are more valued than daily ETs for different growth durations.
Author Contributions
X.C., J.Z., D.M., and Y.L. designed the study. D.M. analyzed the data and wrote the manuscript. Y.L. collected and analyzed soil samples. Y.L. and D.M. contributed to the management and maintenance of field experiment. All authors reviewed the manuscript.
Funding
This research was funded by the National Natural Science Foundation of China, grant number 41671228); the National Key Technology Research and Development Program of China, grant number 2016YFD0300809, 2016YFD0200107; the 135 Field Frontier Project of the institute of soil science, Chinese Academy of Sciences, grant number ISSASIP1603; the earmarked fund for China Agriculture Research System, grant number CARS-03; and the State Key Laboratory Foundation of soil and sustainable agriculture, grant number Y812000005.
Conflicts of Interest
The authors declare no conflicts of interest.
References
- Yee, M.S.; Pauwels, V.R.N.; Daly, E.; Beringer, J.; Rudiger, C.; McCabe, M.F.; Walker, J.P. A comparison of optical and microwave scintillometers with eddy covariance derived surface heat fluxes. Agric. For. Meteorol. 2015, 213, 226–239. [Google Scholar] [CrossRef]
- Steinwand, A.L.; Harrington, R.F.; Or, D. Water balance for Great Basin phreatophytes derived from eddy covariance, soil water, and water table measurements. J. Hydrol. 2006, 329, 595–605. [Google Scholar] [CrossRef]
- Evett, S.R.; Schwartz, R.C.; Howell, T.A.; Baumhardt, R.L.; Copeland, K.S. Can weighing lysimeter ET represent surrounding field ET well enough to test flux station measurements of daily and sub-daily ET? Adv. Water Resour. 2012, 50, 79–90. [Google Scholar] [CrossRef]
- Gebler, S.; Hendricks Franssen, H.J.; Pütz, T.; Post, H.; Schmidt, M.; Vereecken, H. Actual evapotranspiration and precipitation measured by lysimeters: A comparison with eddy covariance and tipping bucket. Hydrol. Earth Syst. Sci. Discuss. 2014, 11, 13797–13841. [Google Scholar] [CrossRef]
- Irmak, S.; Skaggs, K.E.; Chatterjee, S. A review of the bowen ratio surface energy balance method for quantifying evapotranspiration and other energy fluxes. Trans. ASABE 2014, 57, 1657–1674. [Google Scholar]
- Zeggaf, A.T.; Takeuchi, S.; Dehghanisanij, H.; Anyoji, H.; Yano, T. A Bowen ratio technique for partitioning energy fluxes between maize transpiration and soil surface evaporation. Agron. J. 2008, 100, 988–996. [Google Scholar] [CrossRef]
- Allen, R.G.; Pereira, L.S.; Raes, D.; Smith, M. Crop Evapotranspiration. Guidelines for Computing Crop Water Requirements; FAO (Food and Agriculture Organization): Rome, Italy, 1998. [Google Scholar]
- Pereira, L.S.; Allen, R.G.; Smith, M.; Raes, D. Crop evapotranspiration estimation with FAO56: Past and future. Agric. Water Manag. 2015, 147, 4–20. [Google Scholar] [CrossRef]
- Djaman, K.; Balde, A.B.; Sow, A.; Muller, B.; Irmak, S.; N’Diaye, M.K.; Manneh, B.; Moukoumbi, Y.D.; Futakuchi, K.; Saito, K. Evaluation of sixteen reference evapotranspiration methods under sahelian conditions in the Senegal River Valley. J. Hydrol. Reg. Stud. 2015, 3, 139–159. [Google Scholar] [CrossRef]
- Monteith, J.L. Evaporation and environment. Symp. Soc. Exp. Biol. 1965, 19, 205–234. [Google Scholar]
- Shuttleworth, W.J.; Wallace, J.S. Evaporation from Sparse Crops—An Energy Combination Theory. Q. J. R. Meteorol. Soc. 1985, 111, 839–855. [Google Scholar] [CrossRef]
- Brenner, A.J.; Incoll, L.D. The effect of clumping and stomatal response on evaporation from sparsely vegetated shrublands. Agric. For. Meteorol. 1997, 84, 187–205. [Google Scholar] [CrossRef]
- Augenstein, M.; Goeppert, N.; Goldscheider, N. Characterizing soil water dynamics on steep hillslopes from long-term lysimeter data. J. Hydrol. 2015, 529, 795–804. [Google Scholar] [CrossRef]
- Putz, T.; Kiese, R.; Wollschlager, U.; Groh, J.; Rupp, H.; Zacharias, S.; Priesack, E.; Gerke, H.H.; Gasche, R.; Bens, O.; et al. TERENO-SOILCan: A lysimeter-network in Germany observing soil processes and plant diversity influenced by climate change. Environ. Earth Sci 2016, 75. [Google Scholar] [CrossRef]
- Alfieri, J.G.; Kustas, W.P.; Prueger, J.H.; Hipps, L.E.; Evett, S.R.; Basara, J.B.; Neale, C.M.U.; French, A.N.; Colaizzi, P.; Agam, N.; et al. On the discrepancy between eddy covariance and lysimetry-based surface flux measurements under strongly advective conditions. Adv. Water Resour. 2012, 50, 62–78. [Google Scholar] [CrossRef]
- Ding, R.; Kang, S.; Li, F.; Zhang, Y.; Tong, L.; Sun, Q. Evaluating eddy covariance method by large-scale weighing lysimeter in a maize field of northwest China. Agric. Water Manag. 2010, 98, 87–95. [Google Scholar] [CrossRef]
- Unlu, M.; Kanber, R.; Kapur, B. Comparison of soybean evapotranspirations measured by weighing lysimeter and Bowen ratio-energy balance methods. Afr. J. Biotechnol. 2010, 9, 4700–4713. [Google Scholar]
- Zhang, Z.; Tian, F.; Hu, H.; Yang, P. A comparison of methods for determining field evapotranspiration: Photosynthesis system, sap flow, and eddy covariance. Hydrol. Earth Syst. Sci. 2014, 18, 1053–1072. [Google Scholar] [CrossRef]
- Allen, R.G.; Pereira, L.S.; Howell, T.A.; Jensen, M.E. Evapotranspiration information reporting: I. Factors governing measurement accuracy. Agric. Water Manag. 2011, 98, 899–920. [Google Scholar] [CrossRef]
- Esmaeilzade-Moridani, M.; Kamkar, B.; Galeshi, S.; Ghaderifar, F.; Da Silva, J.A.T. Leaf Expansion and Transpiration Responses of Millet Species to Soil Water Deficit. Pedosphere 2015, 25, 834–843. [Google Scholar] [CrossRef]
- Halperin, O.; Gebremedhin, A.; Wallach, R.; Moshelion, M. High-throughput physiological phenotyping and screening system for the characterization of plant–environment interactions. Plant J. 2016. [Google Scholar] [CrossRef]
- Liu, C.M.; Zhang, X.Y.; Zhang, Y.Q. Determination of daily evaporation and evapotranspiration of winter wheat and maize by large-scale weighing lysimeter and micro-lysimeter. Agric. For. Meteorol. 2002, 111, 109–120. [Google Scholar] [CrossRef]
- Ruiz-Penalver, L.; Vera-Repullo, J.A.; Jimenez-Buendia, M.; Guzman, I.; Molina-Martinez, J.M. Development of an innovative low cost weighing lysimeter for potted plants: Application in lysimetric stations. Agric. Water Manag. 2015, 151, 103–113. [Google Scholar] [CrossRef]
- Wu, Y.Z.; Huang, M.B.; Warrington, D.N. Growth and transpiration of maize and winter wheat in response to water deficits in pots and plots. Environ. Exp. Bot. 2011, 71, 65–71. [Google Scholar] [CrossRef]
- Wu, Y.-Z.; Huang, M.-B.; Warrington, D.N. Responses of Different Physiological Indices for Maize (Zea mays) to Soil Water Availability. Pedosphere 2011, 21, 639–649. [Google Scholar] [CrossRef]
- Ray, J.D.; Sinclair, T.R. The effect of pot size on growth and transpiration of maize and soybean during water deficit stress. J. Exp. Bot. 1998, 49, 1381–1386. [Google Scholar] [CrossRef]
- Wang, S.P.; Okamoto, G.; Hirano, K.; Lu, J.; Zhang, C.X. Effects of restricted rooting volume on vine growth and berry development of Kyoho grapevines. Am. J. Enol. Viticult. 2001, 52, 248–253. [Google Scholar]
- Ronchi, C.P.; DaMatta, F.M.; Batista, K.D.; Moraes, G.A.B.K.; Loureiro, M.E.; Ducatti, C. Growth and photosynthetic down-regulation in Coffea arabica in response to restricted root volume. Funct. Plant Biol. 2006, 33, 1013–1023. [Google Scholar] [CrossRef]
- Shi, K.; Hu, W.H.; Dong, D.K.; Zhou, Y.H.; Yu, J.Q. Low O2 supply is involved in the poor growth in root-restricted plants of tomato (Lycopersicon esculentum Mill.). Environ. Exp. Bot. 2007, 61, 181–189. [Google Scholar] [CrossRef]
- Townend, J.; Dickinson, A.L. A Comparison of Rooting Environments in Containers of Different Sizes. Plant Soil 1995, 175, 139–146. [Google Scholar] [CrossRef]
- Ben-Gal, A.; Karlberg, L.; Jansson, P.E.; Shani, U. Temporal robustness of linear relationships between production and transpiration. Plant Soil 2003, 251, 211–218. [Google Scholar] [CrossRef]
- Steduto, P.; Hsiao, T.C.; Fereres, E. On the conservative behavior of biomass water productivity. Irrig. Sci. 2007, 25, 189–207. [Google Scholar] [CrossRef]
- Kool, D.; Agam, N.; Lazarovitch, N.; Heitman, J.L.; Sauer, T.J.; Ben-Gal, A. A review of approaches for evapotranspiration partitioning. Agric. For. Meteorol. 2014, 184, 56–70. [Google Scholar] [CrossRef]
- Zhou, S.; Yu, B.F.; Zhang, Y.; Huang, Y.F.; Wang, G.Q. Partitioning evapotranspiration based on the concept of underlying water use efficiency. Water Resour Res 2016, 52, 1160–1175. [Google Scholar] [CrossRef]
- Huang, P.; Zhang, J.B.; Zhu, A.N.; Xin, X.L.; Zhang, C.Z.; Ma, D.H.; Yang, S.; Mirza, Z.; Wu, S.J. Coupled water and nitrogen (N) management as a key strategy for the mitigation of gaseous N losses in the Huang-Huai-Hai Plain. Biol. Fert. Soils 2015, 51, 333–342. [Google Scholar] [CrossRef]
- Li, X.P.; Zhang, J.B.; Liu, J.T.; Liu, J.L.; Zhu, A.N.; Lv, F.; Zhang, C.Z. A modified checkbook irrigation method based on GIS-coupled model for regional irrigation scheduling. Irrig. Sci. 2011, 29, 115–126. [Google Scholar] [CrossRef]
- Huang, P.; Zhang, J.B.; Ma, D.H.; Wen, Z.F.; Wu, S.J.; Garland, G.; Pereira, E.I.P.; Zhu, A.N.; Xin, X.L.; Zhang, C.Z. Atmospheric deposition as an important nitrogen load to a typical agro-ecosystem in the Huang-Huai-Hai Plain. 2. Seasonal and inter-annual variations and their implications (2008–2012). Atmos Environ 2016, 129, 1–8. [Google Scholar] [CrossRef]
- Allen, R.G.; Fisher, D.K. Low-Cost Electronic Weighing Lysimeters. Trans. ASAE 1990, 33, 1823–1833. [Google Scholar] [CrossRef]
- Allen, R.G.; Pruitt, W.O.; Jensen, M.E.; Burman, R.D. Environmental requirements of lysimeters. In Lysimeters for Evapotranspiration and Environmental Measurements; Allen, R.G., Howell, T.A., Pruitt, W.O., Walter, I.A., Jensen, M.E., Eds.; ASCE: New York, NY, USA, 1991; pp. 170–181. [Google Scholar]
- Allen, R.G.; Pereira, L.S.; Smith, M.; Raes, D.; Wright, J.L. FAO-56 dual crop coefficient method for estimating evaporation from soil and application extensions. J. Irrig. Drain. Eng. 2005, 131, 2–13. [Google Scholar] [CrossRef]
- Rosa, R.D.; Paredes, P.; Rodrigues, G.C.; Alves, I.; Fernando, R.M.; Pereira, L.S.; Allen, R.G. Implementing the dual crop coefficient approach in interactive software. 1. Background and computational strategy. Agric. Water Manag. 2012, 103, 8–24. [Google Scholar] [CrossRef]
- Zhang, B.; Liu, Y.; Xu, D.; Zhao, N.; Lei, B.; Rosa, R.D.; Paredes, P.; Paco, T.A.; Pereira, L.S. The dual crop coefficient approach to estimate and partitioning evapotranspiration of the winter wheat-summer maize crop sequence in North China Plain. Irrig. Sci. 2013, 31, 1303–1316. [Google Scholar] [CrossRef]
- Zhao, N.; Liu, Y.; Cai, J.; Paredes, P.; Rosa, R.D.; Pereira, L.S. Dual crop coefficient modelling applied to the winter wheat-summer maize crop sequence in North China Plain: Basal crop coefficients and soil evaporation component. Agric. Water Manag. 2013, 117, 93–105. [Google Scholar] [CrossRef]
- Li, S.; Kang, S.Z.; Zhang, L.; Li, F.S.; Zhu, Z.L.; Zhang, B.Z. A comparison of three methods for determining vineyard evapotranspiration in the and desert regions of northwest China. Hydrol. Process. 2008, 22, 4554–4564. [Google Scholar] [CrossRef]
- Kang, S.Z.; Gu, B.J.; Du, T.S.; Zhang, J.H. Crop coefficient and ratio of transpiration to evapotranspiration of winter wheat and maize in a semi-humid region. Agric. Water Manag. 2003, 59, 239–254. [Google Scholar] [CrossRef]
- Xu, L.K.; Hsiao, T.C. Predicted versus measured photosynthetic water-use efficiency of crop stands under dynamically changing field environments. J. Exp. Bot. 2004, 55, 2395–2411. [Google Scholar] [CrossRef] [Green Version]
- Dignat, G.; Welcker, C.; Sawkins, M.; Ribaut, J.M.; Tardieu, F. The growths of leaves, shoots, roots and reproductive organs partly share their genetic control in maize plants. Plant Cell Environ. 2013, 36, 1105–1119. [Google Scholar] [CrossRef] [Green Version]
- Ericsson, T. Growth and shoot—Root ratio of seedlings in relation to nutrient availability. Plant Soil 1995, 168, 205–214. [Google Scholar] [CrossRef]
- Feller, C.; Favre, P.; Janka, A.; Zeeman, S.C.; Gabriel, J.P.; Reinhardt, D. Mathematical Modeling of the Dynamics of Shoot-Root Interactions and Resource Partitioning in Plant Growth. PLoS ONE 2015, 10. [Google Scholar] [CrossRef]
- Guswa, A.J. Effect of plant uptake strategy on the water-optimal root depth. Water Resour. Res. 2010, 46. [Google Scholar] [CrossRef]
- Rudd, K.; Albertson, J.D.; Ferrari, S. Optimal root profiles in water-limited ecosystems. Adv. Water Resour. 2014, 71, 16–22. [Google Scholar] [CrossRef]
- Schymanski, S.J.; Sivapalan, M.; Roderick, M.L.; Beringer, J.; Hutley, L.B. An optimality-based model of the coupled soil moisture and root dynamics. Hydrol. Earth Syst. Sci. 2008, 12, 913–932. [Google Scholar] [CrossRef] [Green Version]
- Kasperbauer, M.J.; Hunt, P.G. Root size and shoot root ratio as influenced by light environment of the shoot. J. Plant Nutr. 1992, 15, 685–697. [Google Scholar] [CrossRef]
- Francisco, J.V.; Victor, O.S.; Elias, F. Chapter 12 Plant Density and Competition. In Principles of Agronomy for Sustainable Agriculture; Francisco, J.V., Elias, F., Eds.; Springer International Publishing: Cham, Switzerland, 2016; pp. 159–167. [Google Scholar]
Figure 1.
Schematic locations of the Fengqiu Agro-ecological Experimental Station and the Huang-Huai-Hai Plain in China [37].
Figure 1.
Schematic locations of the Fengqiu Agro-ecological Experimental Station and the Huang-Huai-Hai Plain in China [37].

Figure 2.
A schematic sketch of the devices for the pot and lysimeter experiments.

Figure 3.
A schematic sketch of corrected pot evapotranspiration (ET) values based on representative areas per plant. NL and AL denote the number of plants and the soil surface area, respectively, for a lysimeter. NP and AP denote the number of plants and the soil surface area, respectively, for a pot. ETA is the corrected ET for pots based on the representative area for each plant. ETD is the corrected ET for pots based on the mean crop density level found for lysimeters. ETPot,B is the measured ET value for pots without crops.

Figure 4.
The soil moisture content changes measured in the pot experiments during the wheat and maize seasons. Soil moisture contents in pots were controlled at 11 ± 2%, 18 ± 2%, and 25 ± 2%, respectively, for (a) normal pots with crops (N11, N18, N25); (b) covered soil with a crop (C11, C18, C25); and (c) bare soil without a crop (B11, B18, B25).

Figure 5.
The soil moisture content changes observed in the lysimeter experiments during the wheat and maize seasons. Soil water deficits in lysimeters compared to field water capacities were controlled to 50 ± 15 mm (W50), 100 ± 15 mm (W100), and 150 ± 15 mm (W150) during water control terms.
Figure 5.
The soil moisture content changes observed in the lysimeter experiments during the wheat and maize seasons. Soil water deficits in lysimeters compared to field water capacities were controlled to 50 ± 15 mm (W50), 100 ± 15 mm (W100), and 150 ± 15 mm (W150) during water control terms.

Figure 6.
The irrigation and daily ET for the three water treatments applied in the lysimeter experiments during the wheat and maize seasons.
Figure 6.
The irrigation and daily ET for the three water treatments applied in the lysimeter experiments during the wheat and maize seasons.

Figure 7.
Aboveground dry biomass weights of (a) wheat and (b) maize per area measured during the pot and lysimeter experiments at harvest. Data for pots were corrected based on the average crop density found for the lysimeters. The three soil moisture content treatments involved 11 ± 2%, 18 ± 2%, and 25 ± 2% for pots with a crop (N11, N18, N25) and for covered pots with crops (C11, C18, C25). Three water-deficit treatments applied to lysimeters were controlled to 50 ± 15 mm (W50), 100 ± 15 mm (W100), and 150 ± 15 mm (W150), compared to field water capacity levels. Different letters (a, b, c) denote significant differences between treatments (p < 0.05).

Figure 8.
The uncorrected total evapotranspiration of (a) wheat and (b) maize of the pot and lysimeter experiments. The three soil moisture content treatments applied were 11 ± 2%, 18 ± 2%, and 25 ± 2% for normal pots with a crop (N11, N18, N25), for covered pots with crops (C11, C18, C25), and for bare soil without crops (B11, B18, B25), respectively. The three water-deficit treatments applied to the lysimeters were controlled to 50 ± 15 mm (W50), 100 ± 15 mm (W100), and 150 ± 15 mm (W150), relative to the field water capacity. Different letters (a, b, c, d, e, f, g, h) denote significant differences between treatments (p < 0.05).

Figure 9.
The relationship between the harvested aboveground dry biomass weight and cumulative transpiration for the growing period for wheat and maize per area in pots with covered soil surfaces. r2 is the determination coefficient of the linear regression.
Figure 9.
The relationship between the harvested aboveground dry biomass weight and cumulative transpiration for the growing period for wheat and maize per area in pots with covered soil surfaces. r2 is the determination coefficient of the linear regression.

Figure 10.
Comparisons between (a) uncorrected, (b) density-corrected, (c) area-corrected, and (d) biomass-corrected daily ET for pots and those for lysimeters. N11, N18, and N25 correspond to 11%, 18%, and 25%, respectively, for normal pots with crops.
Figure 10.
Comparisons between (a) uncorrected, (b) density-corrected, (c) area-corrected, and (d) biomass-corrected daily ET for pots and those for lysimeters. N11, N18, and N25 correspond to 11%, 18%, and 25%, respectively, for normal pots with crops.

Figure 11.
Comparisons between the uncorrected ET (ETPOT) or corrected ET (ETB) for the pots with different soil water treatments ((a) 11%, (b) 18%, and (c) 25% for the uncorrected and (d) 11%, (e) 18%, and (f) 25% for the corrected) and measured ET values derived from the lysimeters (ETL). A linear regression was applied to the data for the wheat and maize seasons. r2 is the determination coefficient of the linear regression.


Table 1.
Soil physical and chemical properties.
| Soil Depth (cm) | BK | pH | OM | TP * | TK * | TN * | Sand | Silt | Clay | θs | θf | θwp |
|---|---|---|---|---|---|---|---|---|---|---|---|---|
| (g cm−3) | (g kg−1) | (%) | (%) | |||||||||
| 0–20 | 1.20 | 8.86 | 11.82 | 0.80 | 21.3 | 0.60 | 47.0 | 31.7 | 21.3 | 43.59 | 31.86 | 5.50 |
| 20–40 | 1.54 | 9.01 | 5.86 | 0.59 | 22.9 | 0.44 | 39.9 | 33.9 | 26.2 | 42.04 | 30.84 | 5.50 |
| 40–60 | 1.35 | 8.58 | 8.22 | 0.59 | 22.9 | 0.44 | 8.7 | 38.4 | 52.9 | 49.17 | 44.63 | 6.80 |
| 60–80 | 1.42 | 8.52 | 6.92 | 0.59 | 22.9 | 0.44 | 5.3 | 59.2 | 35.5 | 46.34 | 42.97 | 5.20 |
| 80–100 | 1.43 | 8.84 | 4.00 | 0.60 | 19.8 | 0.19 | 13.0 | 72.2 | 14.8 | 46.19 | 41.95 | 3.55 |
| 100–180 | 1.41 | 9.03 | 3.25 | 0.60 | 19.8 | 0.19 | 23.2 | 66.6 | 10.2 | 46.91 | 44.79 | 3.50 |
Note: BK, bulk density; OM, soil organic matter; TP, total phosphorous; TK, total potassium; TN, total nitrogen; θs, porosity (v/v); θf, field capacity (v/v); θwp, wilting point (v/v). * data are cited from [35].
Table 2.
Comparisons of pot and lysimeter crop density levels (N/A), representative areas per plant (A/N), and aboveground dry biomass weights per area for the harvest period (M).
Table 2.
Comparisons of pot and lysimeter crop density levels (N/A), representative areas per plant (A/N), and aboveground dry biomass weights per area for the harvest period (M).
| Treatment | Wheat | Maize | |||||||
|---|---|---|---|---|---|---|---|---|---|
| N | N/A (m−2) | A/N (10−4 m2) | M (kg m−2) | N | N/A (m−2) | A/N (m2) | M (kg m−2) | ||
| Lysimeter | Mean | 1848 | 1232 | 8.12 | 1.46 | 12 | 8 | 0.1250 | 1.89 |
| PotPotPot | N11 | 102 | 1467 | 6.82 | 0.89 | 1 | 14 | 0.0697 | 0.71 |
| N18 | 104 | 1495 | 6.69 | 1.32 | 1 | 14 | 0.0697 | 1.66 | |
| N25 | 115 | 1649 | 6.06 | 1.55 | 1 | 14 | 0.0697 | 2.55 | |
Note: N and A denote the number of plants and the soil surface area, respectively, in a lysimeter or pot. M is the amount of aboveground dry biomass at harvest measured for a lysimeter, but the corrected value for a planted pot.
Table 3.
The root mean square errors (RMSEs) of the uncorrected and corrected daily ET values of the pots compared with those of the lysimeters.
Table 3.
The root mean square errors (RMSEs) of the uncorrected and corrected daily ET values of the pots compared with those of the lysimeters.
| Time Scale | ET-Correction | Wheat (mm) | Maize (mm) | ||||
|---|---|---|---|---|---|---|---|
| N11 | N18 | N25 | N11 | N18 | N25 | ||
| 1 day | No correction | 1.43 | 3.00 | 4.56 | 2.46 | 3.72 | 6.02 |
| Density correction | 1.12 | 1.29 | 2.01 | 2.49 | 1.68 | 2.20 | |
| Area correction | 1.24 | 1.20 | 1.57 | 2.44 | 1.82 | 2.15 | |
| Biomass correction | 1.30 | 1.31 | 1.42 | 1.83 | 1.79 | 2.10 | |
| 3 days | No correction | 1.24 | 2.92 | 4.52 | 1.34 | 3.16 | 5.59 |
| Density correction | 0.89 | 1.11 | 1.90 | 2.28 | 1.31 | 1.92 | |
| Area correction | 1.04 | 1.00 | 1.43 | 2.23 | 1.51 | 1.89 | |
| Biomass correction | 1.12 | 1.14 | 1.27 | 1.48 | 1.46 | 1.84 | |
Note: The three soil moisture content treatments are 11 ± 2%, 18 ± 2%, and 25 ± 2% for normal pots with crops (N11, N18, N25).
© 2018 by the authors. Licensee MDPI, Basel, Switzerland. This article is an open access article distributed under the terms and conditions of the Creative Commons Attribution (CC BY) license (http://creativecommons.org/licenses/by/4.0/).
Share and Cite
MDPI and ACS Style
Lu, Y.; Ma, D.; Chen, X.; Zhang, J. A Simple Method for Estimating Field Crop Evapotranspiration from Pot Experiments. Water 2018, 10, 1823. https://doi.org/10.3390/w10121823
AMA Style
Lu Y, Ma D, Chen X, Zhang J. A Simple Method for Estimating Field Crop Evapotranspiration from Pot Experiments. Water. 2018; 10(12):1823. https://doi.org/10.3390/w10121823
Chicago/Turabian StyleLu, Yunxuan, Donghao Ma, Xiaomin Chen, and Jiabao Zhang. 2018. "A Simple Method for Estimating Field Crop Evapotranspiration from Pot Experiments" Water 10, no. 12: 1823. https://doi.org/10.3390/w10121823
Note that from the first issue of 2016, this journal uses article numbers instead of page numbers. See further details here.