Response of Physiological Indicators to Environmental Factors under Water Level Regulation of Paddy Fields in Southern China

1
Zhejiang Institute of Hydraulics and Estuary, Hangzhou 310020, China
2
School of Water Conservancy, North China University of Water Resources and Electric Power, Zhengzhou 450045, China
3
State Key Laboratory of Hydrology-Water Resources and Hydraulic Engineering, Nanjing Hydraulic Research Institute, Nanjing 210029, China
4
Research Center of Fluid Machinery Engineering and Technology, Jiangsu University, Zhenjiang 212013, China
*
Author to whom correspondence should be addressed.
Water 2018, 10(12), 1772; https://doi.org/10.3390/w10121772
Submission received: 10 October 2018
/
Revised: 25 November 2018
/
Accepted: 26 November 2018
/
Published: 3 December 2018
(This article belongs to the Special Issue Sustainable Irrigated Agriculture: Crop Water Relations, Soil Management and Smart Irrigation)
Abstract
:Agricultural water level control is the key to the combined control of water-saving irrigation and controlled drainage. It is easy to observe and master in farmland practice, and has important theoretical and practical significance. In this paper, a systematic study on stomatal regulation and photosynthetic-evapotranspiration coupling mechanism, as well as the effect of meteorological environmental factors on photosynthetic-evapotranspiration coupling mechanism of paddy rice in drought and flooding conditions was conducted by taking paddy field’s water level as a regulation indicator of paddy rice’s irrigation and drainage. Results showed that net photosynthetic rate (Pn) and evapotranspiration rate (Tr) had quadratic and linear relationship with stomatal conductance (Gs), respectively. The responding range of Gs in drought condition was lower than that in flooding condition. Drought stress aggravated the photosynthetic stomatal limitation of rice leaves at noon, and partial closure of stomata was the main reason resulting in the reduction of Pn suffering from drought at noon. Change curve of paddy rice’s leaf temperature difference (ΔT) showed a W or V type daily change curve and its change rule was rightly contrary to that of Tr. Pn had quadratic curve relationships with photosynthetically active radiation (PAR) and surrounding CO2 concentration (Cs) both in the morning and in the afternoon, Pn had quadratic curve relationships in the morning and linear relationships in the afternoon with air temperature (Ta), respectively. Tr showed linear relationships with PAR, Ta, relative air humidity (RH) and barometric pressure saturation deficit (VPD).
1. Introduction
Rice irrigation area is important for regional economic development, social harmony and stability, improvement of ecological environment and so on [1]. However, there are still some problems in rice irrigation areas, such as low efficiency of water and fertilizer utilization, and serious agricultural non-point source pollution, which restrict the sustainable development [2,3]. With the development of the theory of crop irrigation and drainage, water-saving irrigation and controlled drainage technology attracted great attention [4,5]. Water level regulation is crucial for water-saving irrigation-drainage, which is meaningful for water saving, pollution reduction and high rice yield in south China [6,7,8].
Photosynthesis and evapotranspiration are the two most important physiological processes of crops, where the photosynthesis is a process that leaves produce organic matter, and the evapotranspiration is the main dynamic force of crops for realizing moisture transmission and organic matter distribution. Leaves’ photosynthesis and evapotranspiration are the two gas exchange processes that are happening in the same time, and are jointly regulated and controlled by leaf stomata. Besides, both of them are changing in almost the same way along with solar radiation, temperature, barometric pressure saturation deficit and other environmental factor changes, and they constitute the physiological basis of mutual coordination and coupling of photosynthesis and evapotranspiration process [9,10]. Since the physiological indicators are sensitive to water, higher or lower water level could result in changes of physiological processes [11,12].
Li [13] found that water-logging stress in late growth stages resulted in decreasing of photosynthetic rate (Pn), green leaves number of the main stem and thousand-grain weight. Hirano [14] found that after water-logging, the transportation of carbon to the top internodes was promoted, by adjusting the distribution of photosynthetic products to promote the growth of rice plant internodes. However, in the reproductive growth stage, much more dry matter could be accumulated for a light water-logging plant, thus the final rice production was promoted. Hu [15] found there was decreasing Pn in the drought stress condition and the “noon break” at noon, and further considered that evapotranspiration rate (Tr) got a straight-line decrease as stomatal conductance (Gs) decreases, Pn decreased slowly when there was less water stress, but rapidly decreased when reaching to a certain degree. Lv [16] found that moderate water deficit will not bring out the result of Pn obviously descending. Studies on Pn under drought or water stress have mostly focused on the decrease of Pn and the concurrent result of stomatal limitation and non-stomatal limitation. However, there is no clear boundary between the stomatal limitation and non-stomatal limitation, both of them are co-existing and are influencing each other [17,18]. Zhang [19] found that the limitation of stomatal and non-stomatal was different with different drought degrees, where in the moderate drought stress, the cell metabolism was normal, and stomatal limitation was a key factor for photosynthesis rate descending. As the drought degree increased, the metabolism of plant was disturbed, therefore non-stomatal limitation became the main factor for photosynthesis rate descending. Ming [20] used polyethylene glycol (PEG6000) of different concentrations to simulate drought treatments in the 6-leaf stage of paddy rice. Results showed that Pn decreased obviously, Gs and intercellular CO2 concentration (Ci) increased and the non-stomatal factor limited photosynthesis rate under 10% polyethylene glycol treatment, but Pn continued to decrease, Gs and Ci kept decreasing, and stomatal conductance became the major limiting factor for photosynthesis rate under 15% PEG treatment.
The physiological response of rice water-saving irrigation mostly was based on a single irrigation or drainage. Water depth was as the irrigation upper limit, the soil moisture in root zone irrigation was as the lower limit. However, in the actual application, the soil moisture spatial variability is not easy to grasp [21,22]. The problem of irrigation and drainage of rice is actually how to control the change of water level in farmland, that is the regulation of farmland water level [23]. At the field scale, the spatial variability of farmland water level is very small and easy to observe. In this paper, a systematic study on stomatal regulation and photosynthetic-evapotranspiration coupling mechanism, as well as the effect of meteorological environmental factors on photosynthetic-evapotranspiration coupling mechanism of paddy rice in drought and flooding condition was conducted by taking water level as regulation indicator of paddy rice’s irrigation and drainage, which could further disclose the responding mechanism of paddy rice’s water level regulation (i.e., the physiological indicator of paddy rice), and thereby has important scientific value and practical significance.
2. Methods
2.1. Experimental Site
This study was carried out at the Key Laboratory of Efficient Irrigation-Drainage and Agricultural Soil-Water Environment in Southern China, Ministry of Education in 2011 and 2012. The region has a subtropical humid monsoon climate, with an average annual evaporation of 900 mm, annual average temperature of 15.4 °C, maximum and minimum air temperatures of 43.0 °C and −14.0 °C, mean annual rainfall is 1041 mm, and there are 220 frost-free days per year. The soil in the area is loamy clay. The area adopts a five-year rice-wheat rotation system. There are 32 fixed lysimeter plots (28 with closed bottom and 4 without) with the specifications of 2.5 m length, 2 m width, and 2 m depth. The lysimeter layout is divided into two groups, with each group containing 16 plots. The underground corridors and underground equipment rooms are built between the two groups. The irrigation system is an automatic irrigation system controlled by the host-electromagnetic valve. The topsoil (0–30 cm) with pH value of 6.97 in the lysimeter contained 2.40% soil organic matter, 0.9048 g·kg−1 of total nitrogen, 27.65 mg·kg−1 of available nitrogen, 0.32 g·kg−1 of total phosphorus, and 12.5 mg·kg−1 of available phosphorus.
2.2. Experimental Design
The paper conducted a series of experiments in paddy fields between 2011 and 2012 with the combination of water level regulation and water control duration, as is shown in Table 1. It was only considered as the “flood suffered” when there was deep flooding of rice and a certain leakage intensity was maintained. Two kinds of leakage intensity (2 mm/day and 4 mm/day) were designed in 2-years experiments. At the tillering stage, rice plant was short, and the flooding water level was designed for 120 mm, while flooding water level was 250 mm at the jointing to milky stage. The flooding duration was kept for 10 days at all growth stages without water supply even when water level decreased. This process was a simulation of dynamics of paddy field water levels after a short-term heavy rainfall. The groundwater depth was taken as the controlled water level during drought test, and two water levels were designed at each growth stage. For the tillering stage, the water level was respectively −300 mm and −500 mm, while for jointing to milky stage, the water level was −400 mm and −700 mm, respectively.
2.3. Method
At each growth stage, 4 and 3 representative plants were chosen and labeled for each treatment, and the Pn, Tr, Gs were measured. The measuring interval was one time before water control, and twice between water control period, then measured every 2 or 3 days after water level returning to normal, with measuring time at 9:30 am to 10:30 am. Photosynthetic day change was measured every 2 h within 1 to 2 days after the end of water control at each growth stage from 8:00 a.m. to 18:00 p.m. Leaf photosynthetic parameters were measured by Li-6400 portable photosynthetic instrument and light-emitting diode (LED) red/blue light source (LI-COR, Lincoln, NE, USA). Through gas exchange method, the Pn, Tr, Gs were analyzed and calculated according to the parameters (CO2, H2O concentration, gas flow rate, leaf area, temperature and pressure, etc.) of the reference chamber and sample chamber. At the same time, some important environmental parameters such as light intensity, temperature and humidity were recorded. Simple data calculation and diagramming was completed by Excel 2010. Correlation analysis and regression analysis was carried out by IBM SPSS Statistics 19.
3. Results and Discussion
3.1. Collaborative Analysis on Change in Intercellular CO2 Concentration (Ci) and Stomatal/Non-Stomatal Limitation of Paddy Rice under Water Level Control
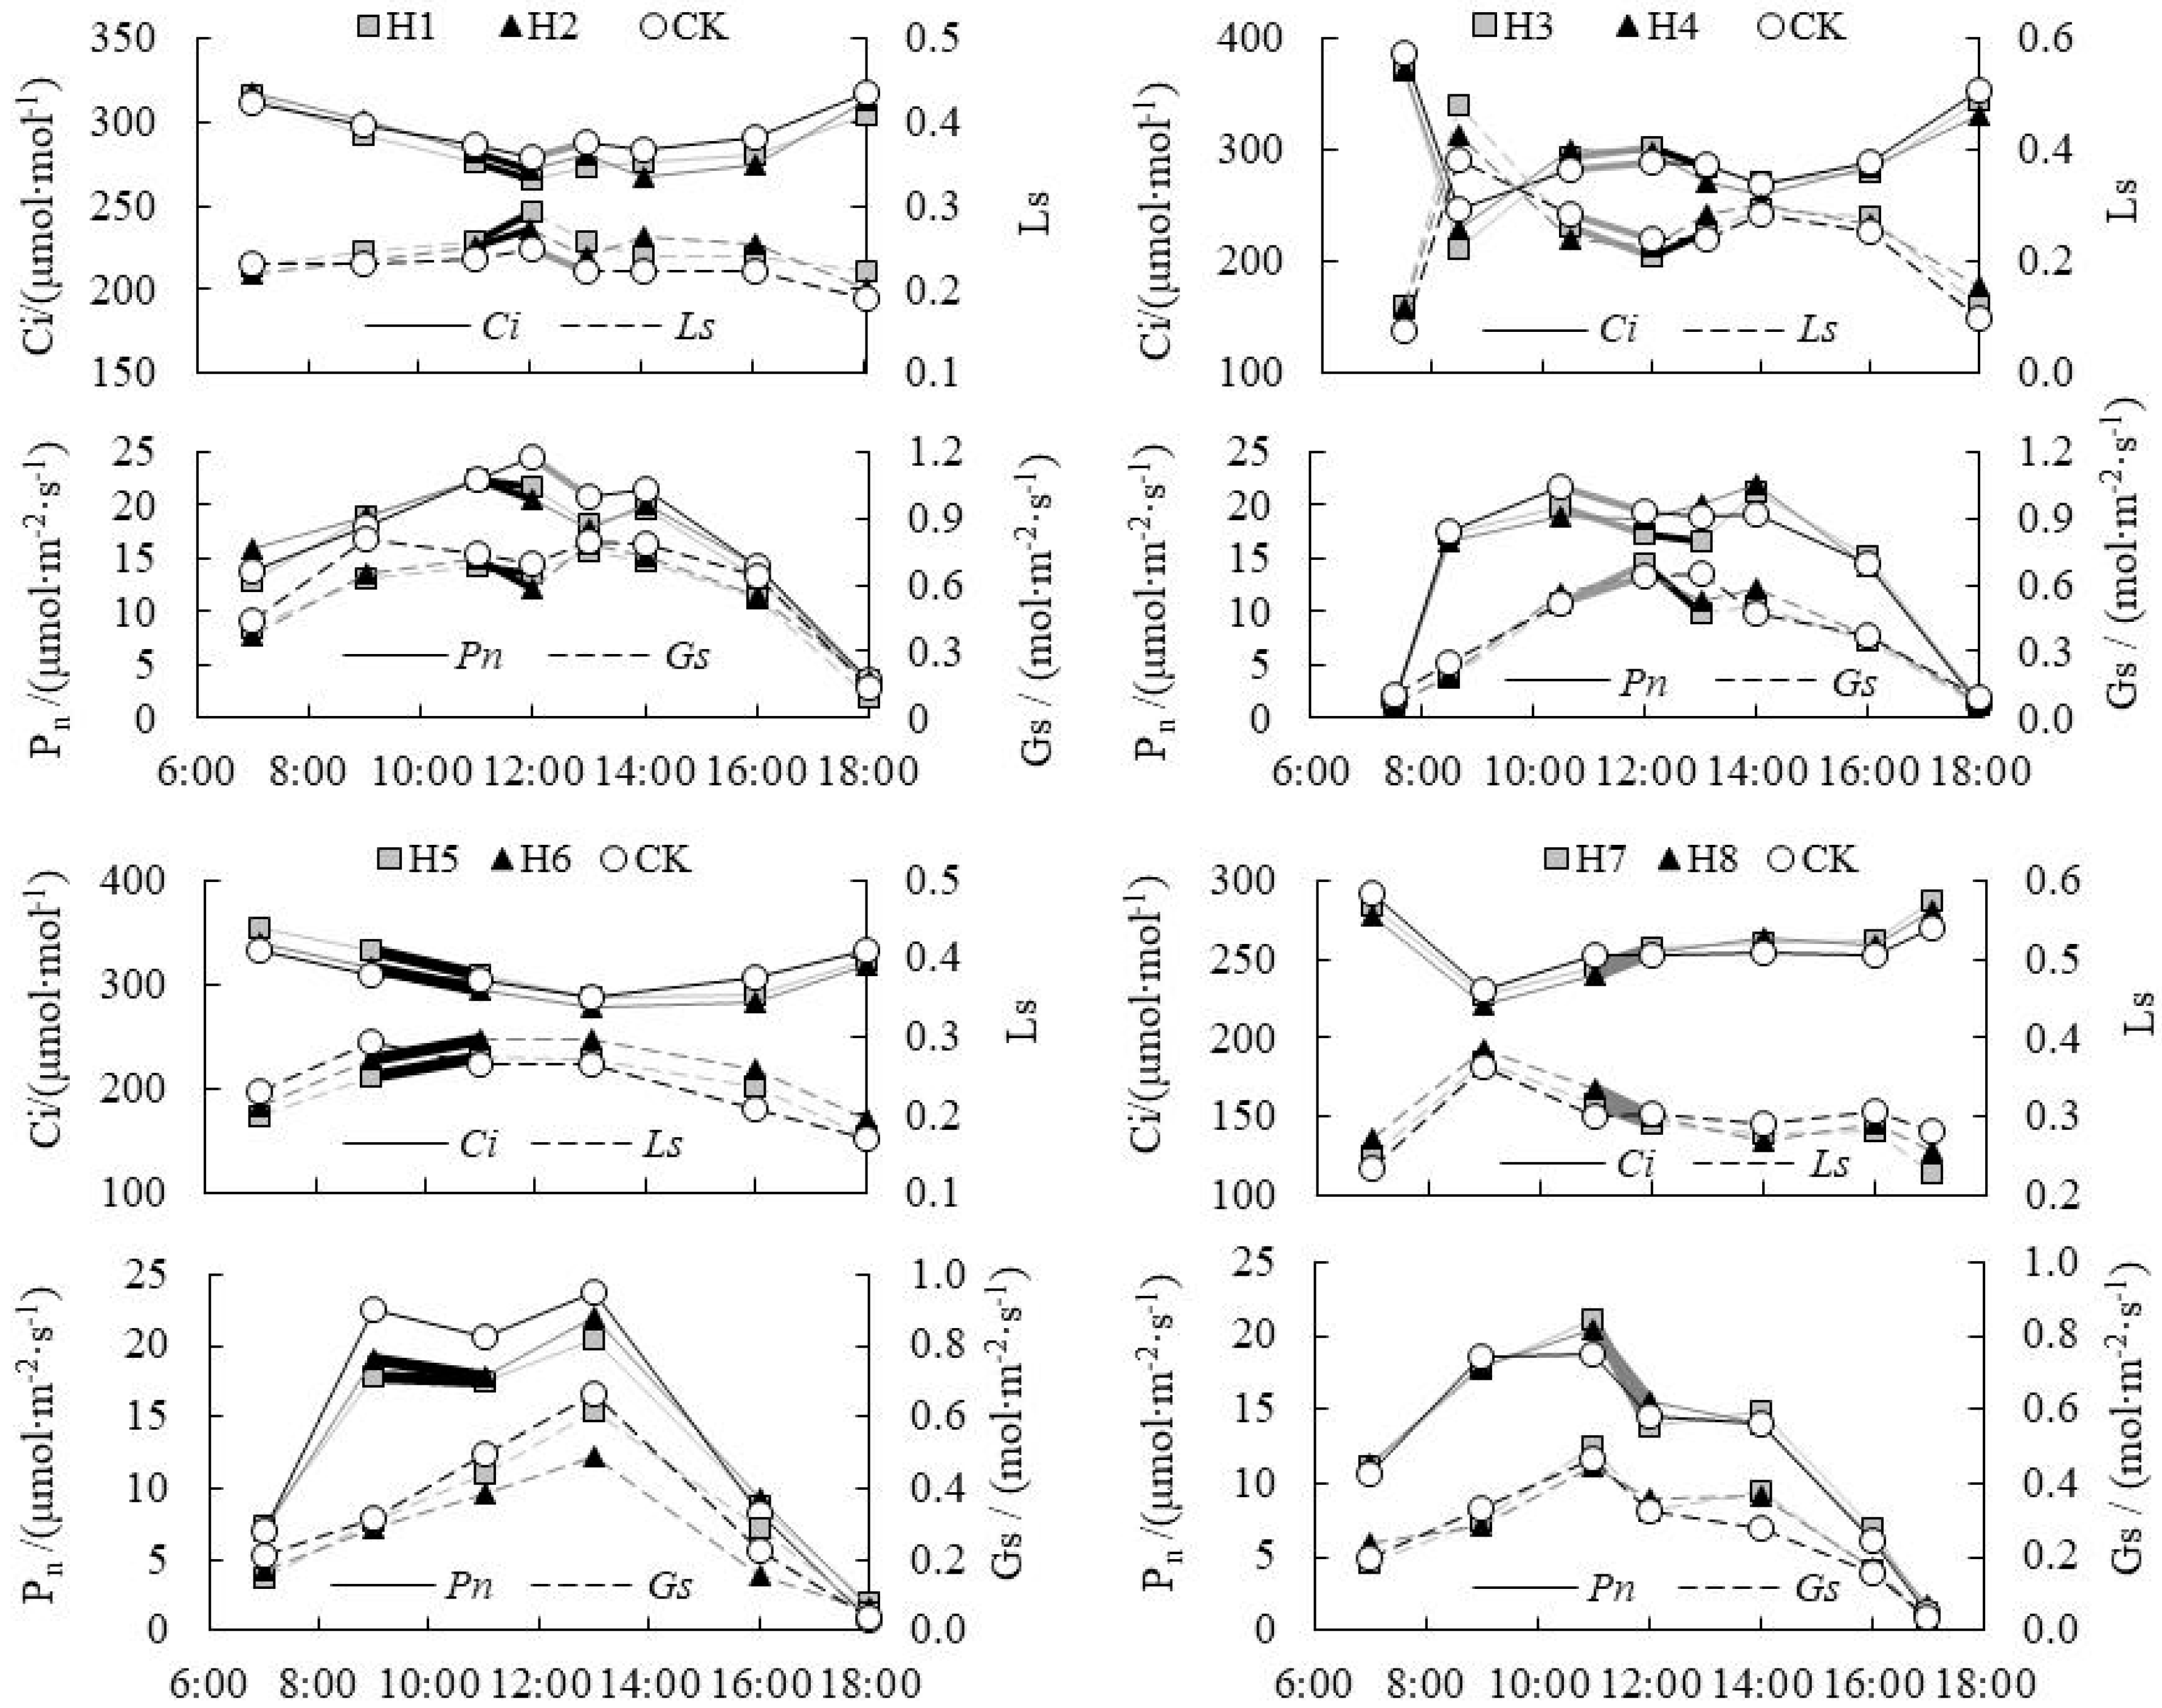
The synchronous day change law between CO2 concentration (Ci) and stomatal limitation value (Ls), net photosynthetic rate (Pn) and stomatal conductance (Gs) of paddy rice in drought condition was shown in Figure 1. It showed that Pn and Gs in H1 and H2 decreased from 11:00 a.m. to 12:00 p.m. at tillering stage, and Ci decreased too, but Ls increased, which illustrated that Gs reduction was the reason why photosynthetic rate decreased. As for contrast treatment (CK) treatment, Pn decreased from 12:00 p.m. to 13:00 p.m., and the corresponding Ci was tended to increase. Ci increase was the result of Pn decrease, i.e., non-stomatal limitation was dominant. The above results showed that drought stress aggravated the photosynthetic stomatal limitation in rice leaves at noon, and partial closure of the stomata was the main reason resulting in the decrease of photosynthetic rate of drought paddy rice at noon. At jointing-booting stage, Pn decreased from 10:30 to 12:00 in H3 and CK treatment, while Gs, Ci and Ls all increased, which illustrated Pn decrease was caused by non-stomatal factors. From 12:00 to 13:00, Pn in H3 continued to decrease, and Gs and Ci changed from the increasing trend to the decreasing trend, while the increase of Ls showed that stomatal factor was the main reason for Pn decrease. Thus the factors causing decrease to Pn at noon were not constant, but were caused by the mutual action of stomatal limitation factors and non-stomatal limitation factors, and both of them interacted with each other, where one factor dominated at a certain time.
At heading-flowering stage, Pn and Ci decreased from 9:00 to 11:00 for H5 and H6, whereas Gs and Ls increased; certainly it can be judged that the main reason causing Pn decrease was the stomatal factors. It illustrated that stomatal limitations could happen when Gs increased. Under this condition, the diffusion rate of CO2 from leaf pores into leaf cells was the consumption rate of cell’s photosynthetic reaction, therefore Ci kept decreasing and stomata was still the limiting factor of Pn decrease. As for CK, Pn decreased from 9:00 to 11:00. Ci was basically constant, although Ls value decreased. Thus, it was difficult to judge whether it was a stomatal limitation or non-stomatal limitation. At milky stage, Pn and Gs in H7 and H8 decreased simultaneously from 11:00 to 12:00, Ci and Ls decreased, which showed non-stomatal factors were the main reason of Pn decreasing. Referring to the judgment basis for stomatal and non-stomatal limitations of photosynthesis, Huang [24] found that the change trend of Ci and Ls were two essential reliable criterions. Ci decreasing and Ls increasing showed the stomatal conductance was the main reason, while Ci increasing and Ls decreasing showed the non-stomatal factor was the main reason, which was consistent with the conclusions in this paper.
3.2. Response Relationship between Ci and Influencing Factors of Paddy Rice under Water Level Control
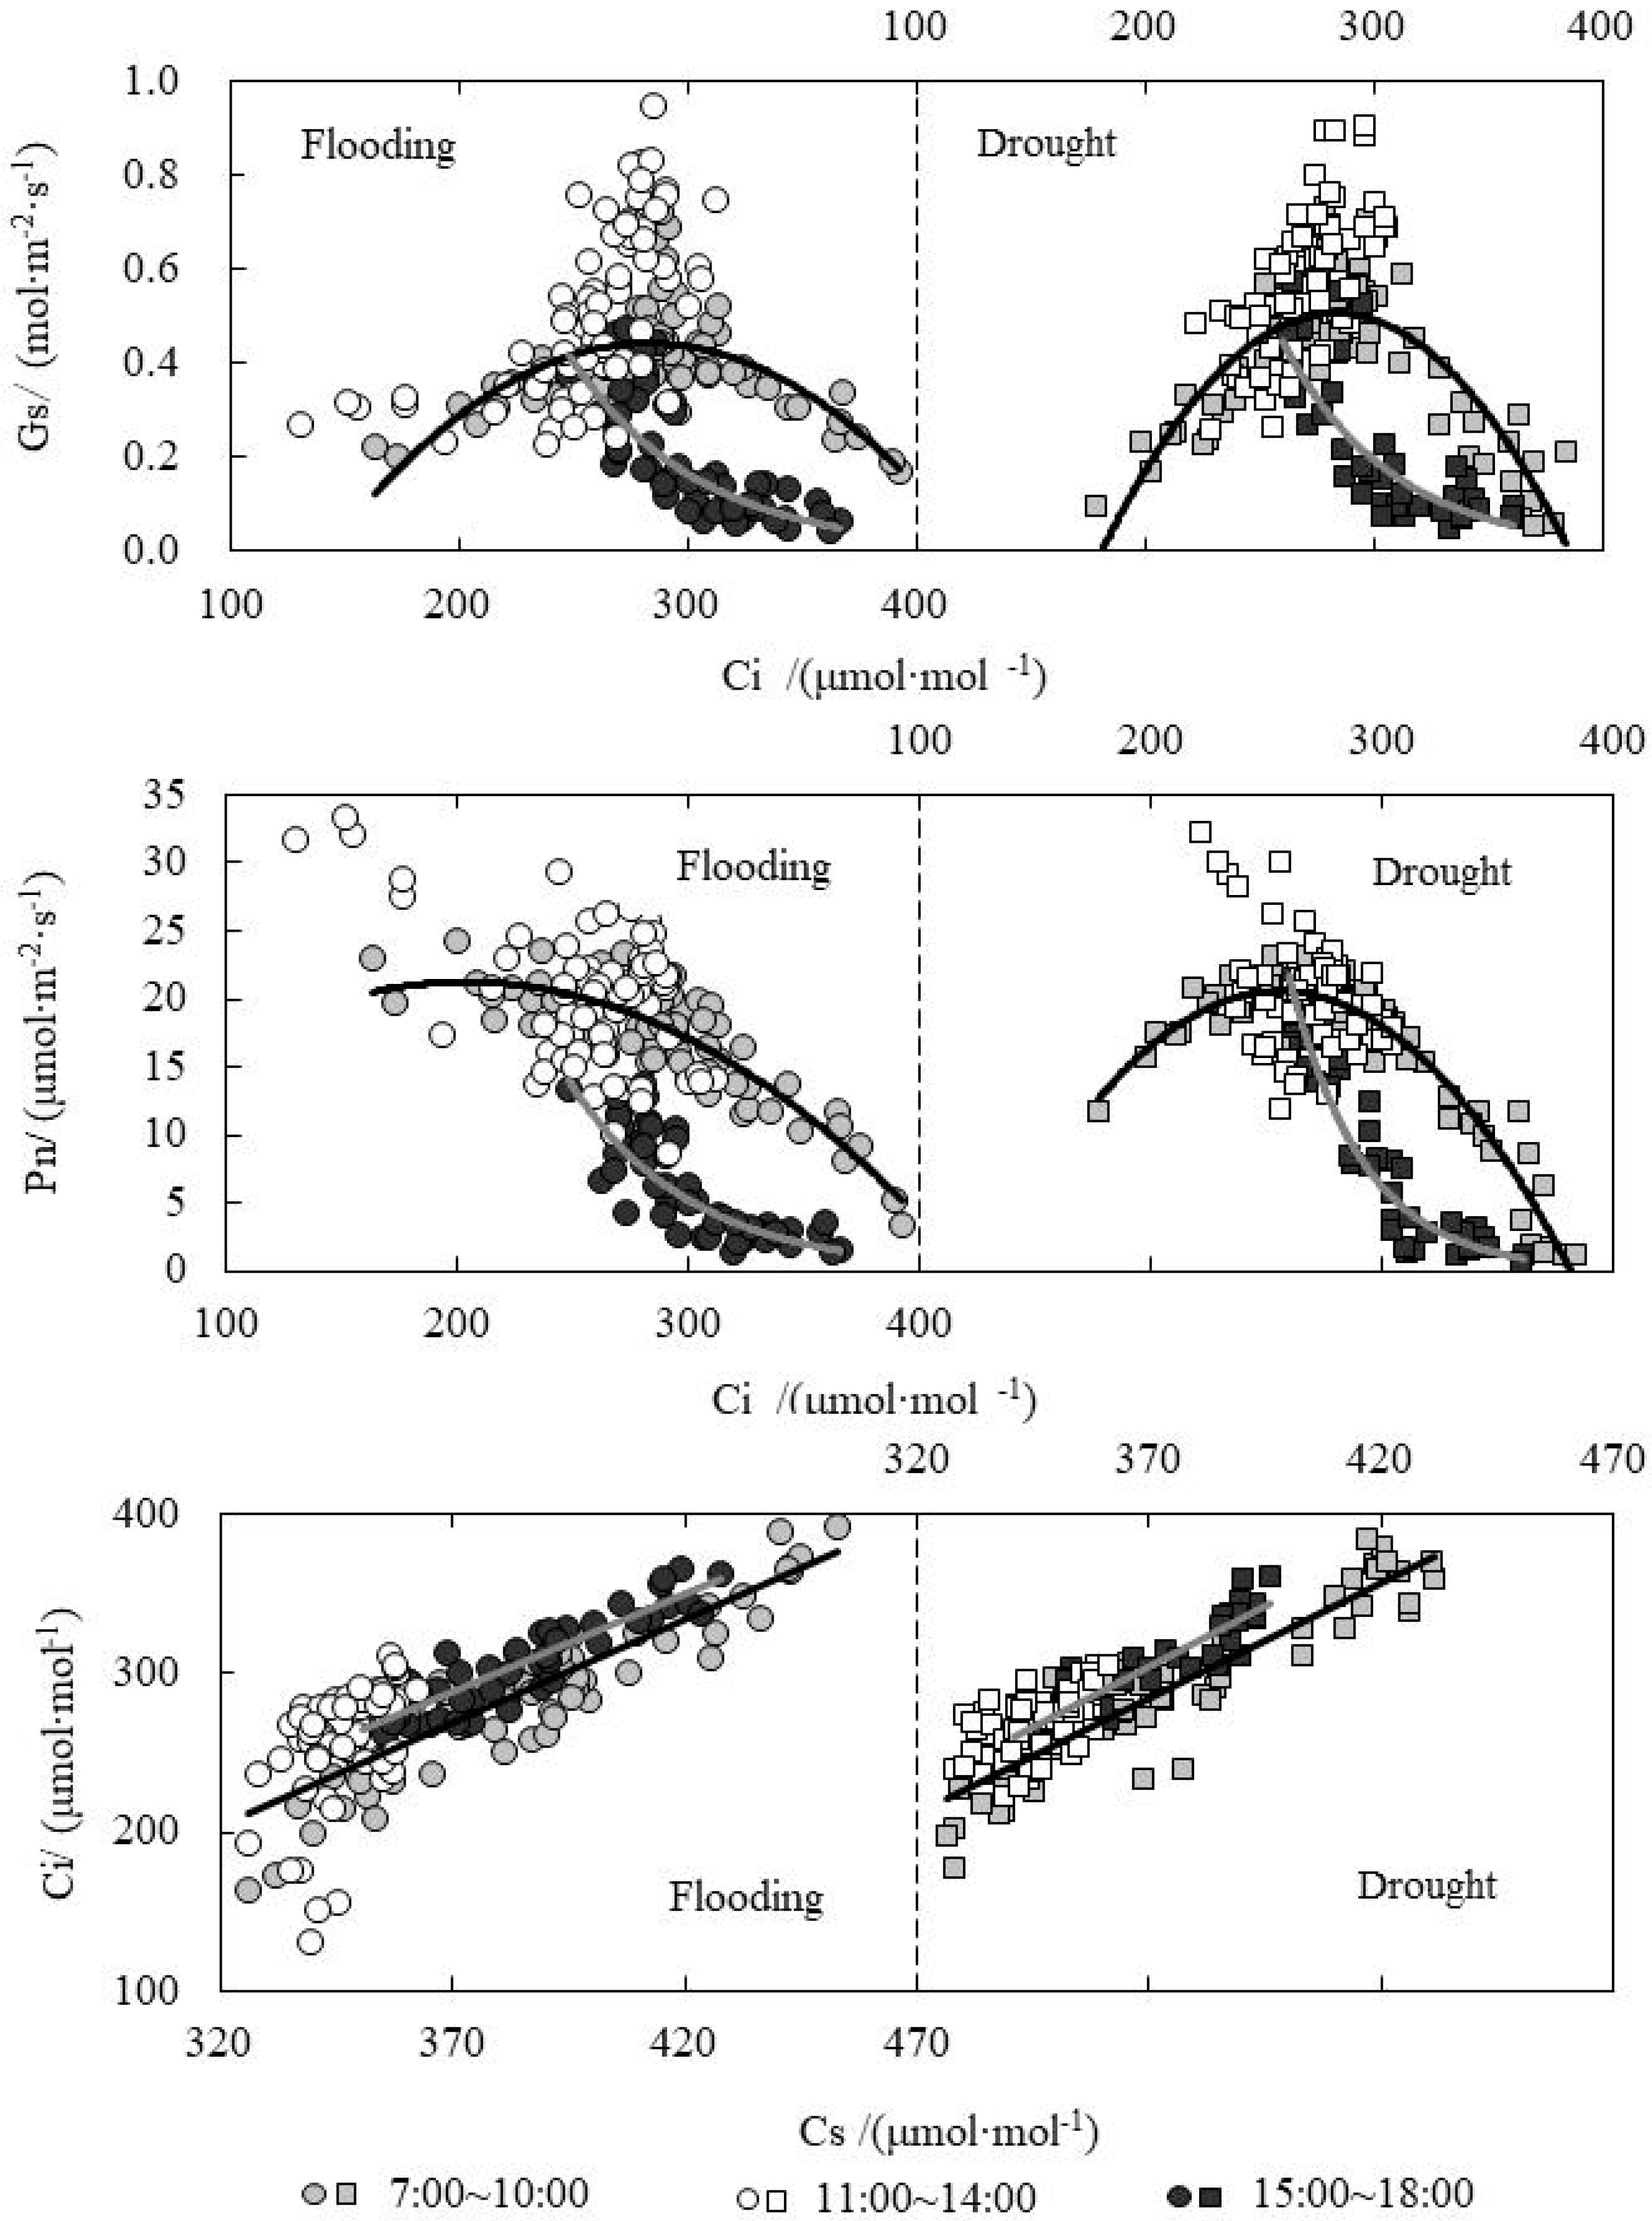
The relationships between Ci and Gs, Pn and Cs (CO2 concentration around the leaves) were shown in Figure 2. It was clear that Ci distribution was widest in the morning, ranging from 200 to 400 μmol·mol−1. Gs increased first and then decreased as Ci decreased under drought and flooding treatments in the morning. Gs reached peak in the morning; the one of drought treatment was slightly higher than that of flooding treatment when Ci was 270~300 μmol·mol−1. Pn also increased first and then decreased with Ci decreasing for drought treatment, while it increased with Ci decreasing for flooding treatment and did not decrease after reaching peak. Pn reached the peak when Ci was 200 and 250 μmol·mol−1 for flooding and drought treatments, respectively. At 11:00~14:00, Ci ranged from 200 to 300 μmol·mol−1, and the corresponding Gs and Pn values were higher. In the afternoon, Ci mainly ranged from 250 to 350 μmol·mol−1 and it decreased as Gs and Pn decreased. Ci increased as Cs increased both in the morning and afternoon. Where Cs ranged from 330 to 370 μmol·mol−1, and Ci ranged from 200 to 300 μmol·mol−1 from at noon, certainly there was no obvious difference between drought and flooding treatments. When Cs is same, Ci in the afternoon was slightly higher than the one in the morning.
3.3. Analysis on Daily Change Law of Temperature Difference (ΔT) and Tr under Water Level Control
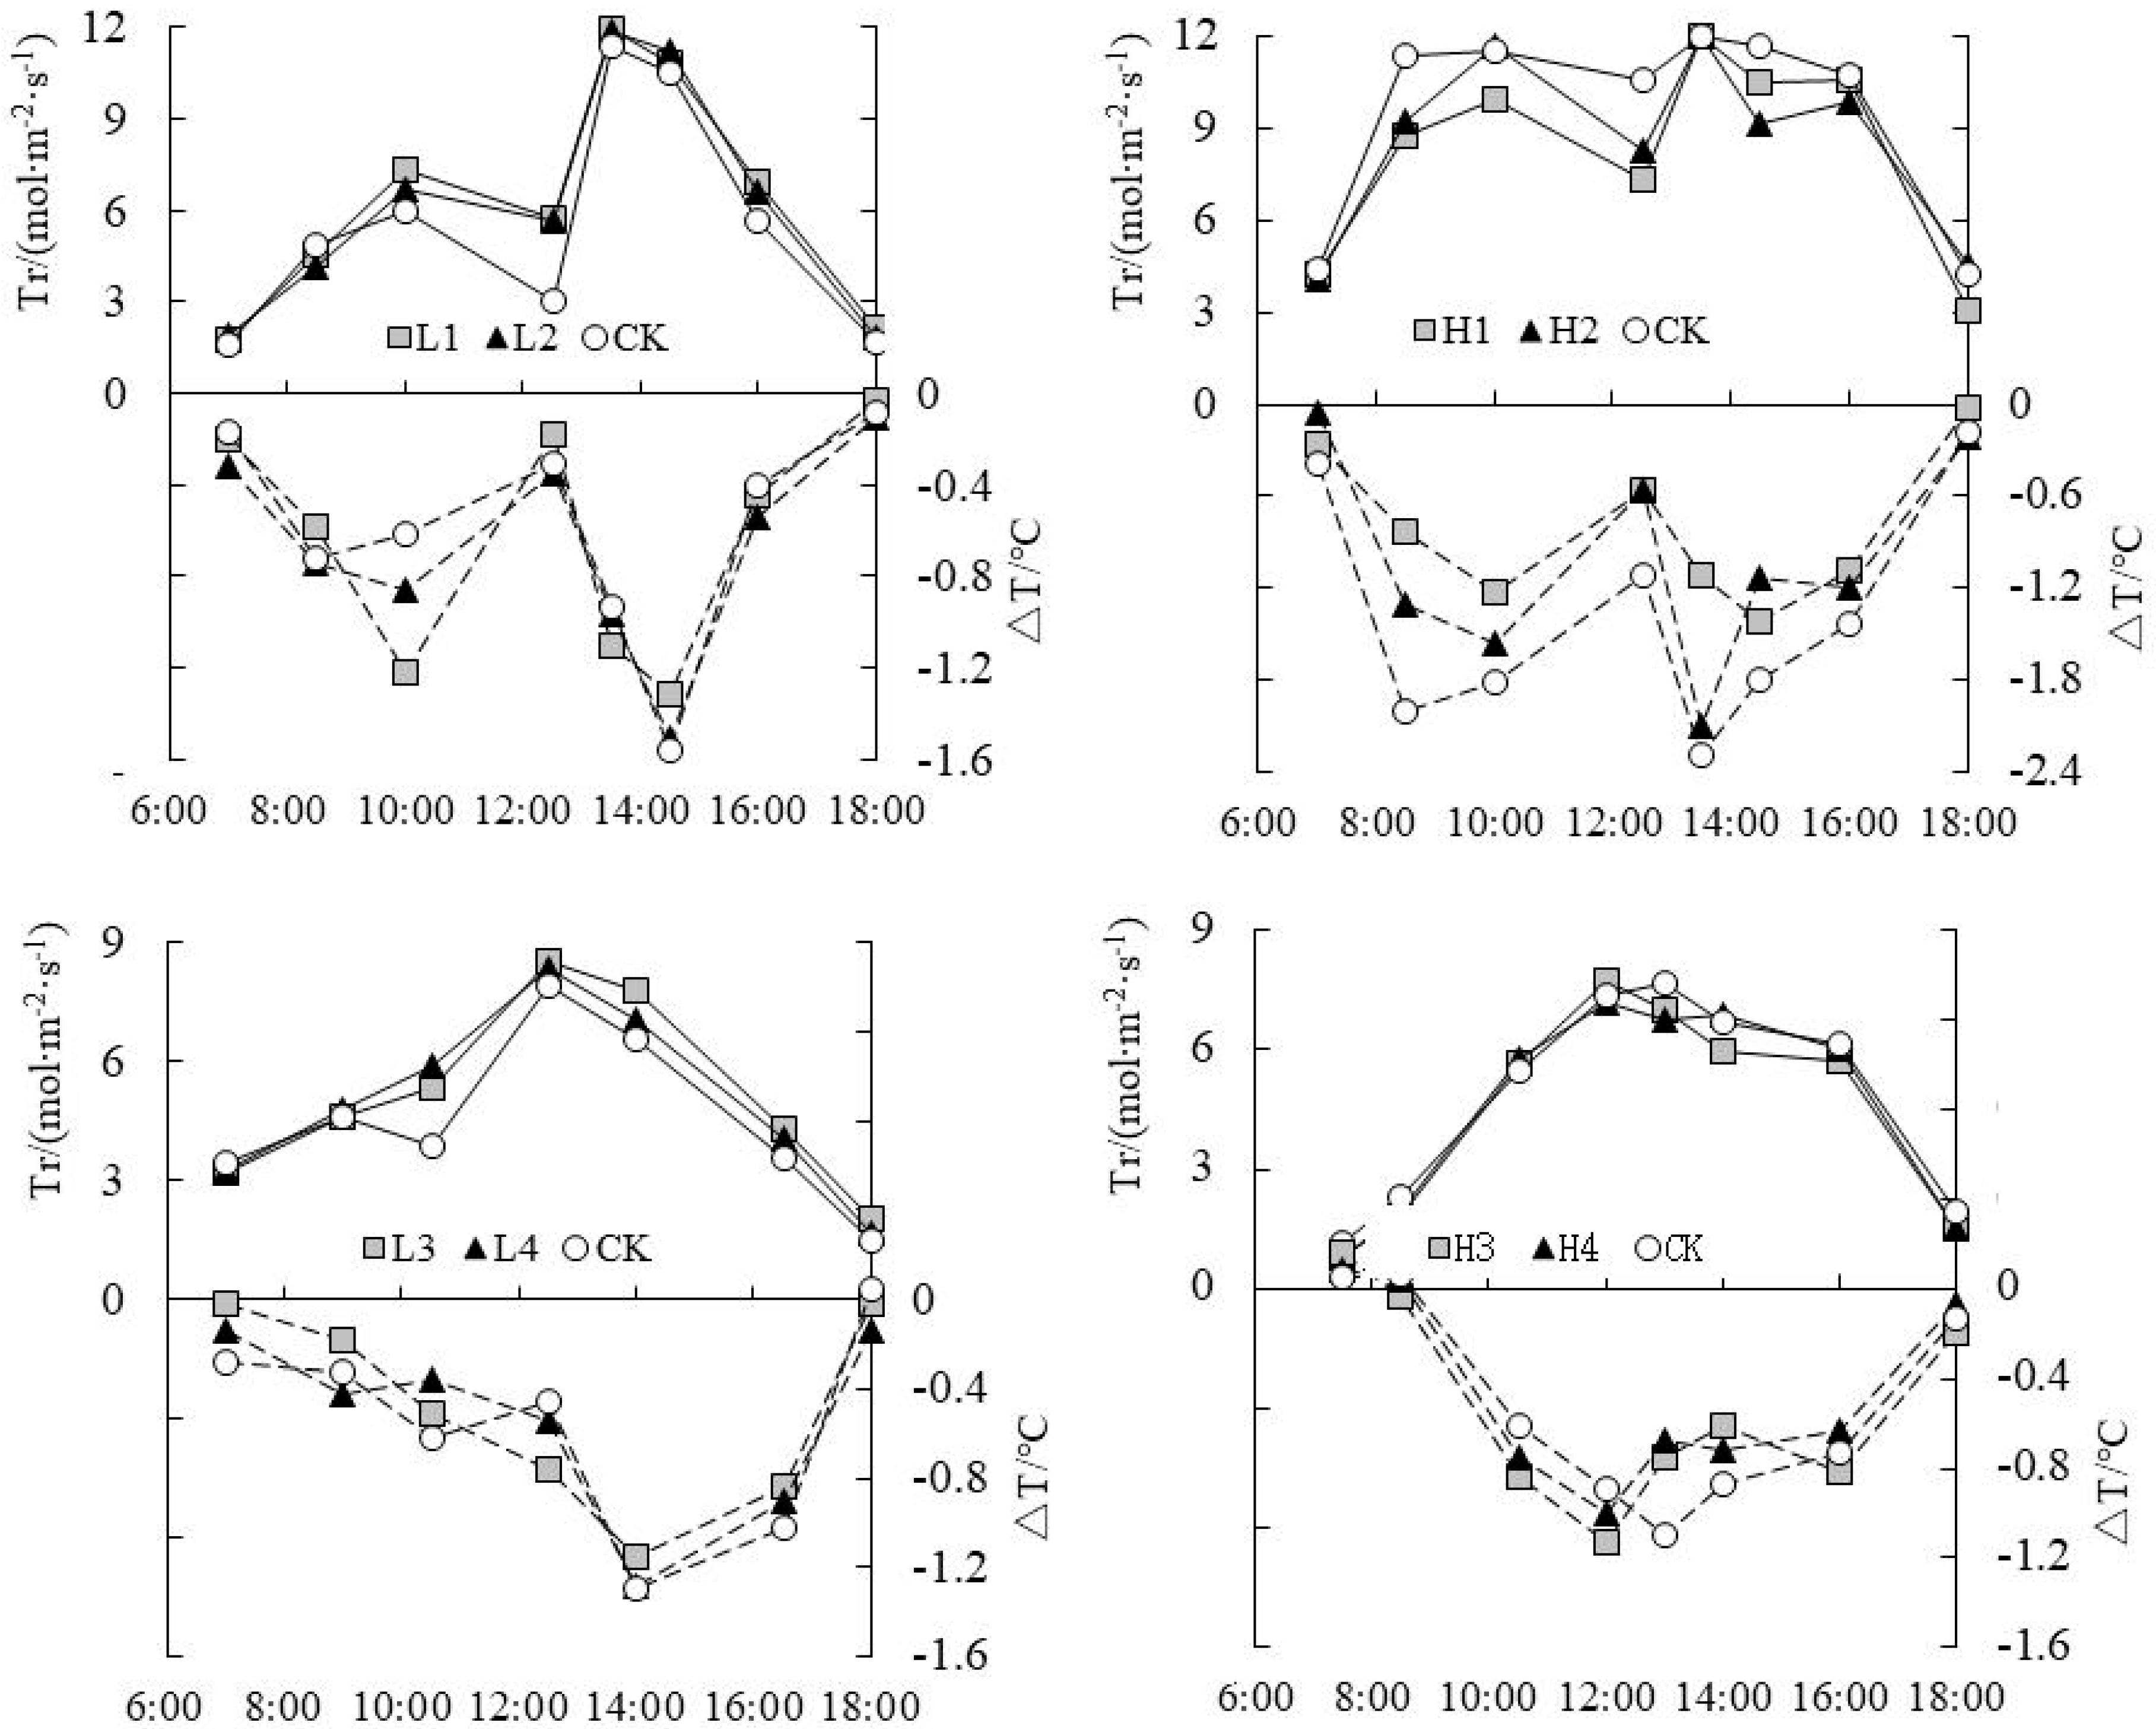
The daily change of ΔT and Tr was shown in Figure 3. It could be seen that ΔT was basically negative in the daytime, and its change curve showed W type or V type, which was opposite to the change curve of Tr. When Tr was higher, |ΔT| was also higher. Tr reached the lowest level around 12:00 at noon for rice under water level control at tillering stage, while ΔT reached the peak value. This was mainly because stomata were partially closed to avoid excessive loss of leaf moisture due to the high temperature and high light intensity at noon, which resulted in a temporary phenomenon of “noon break” to Pn of paddy rice [25]. At this time the leaf temperature would be increasing quickly as ΔT decreased significantly, namely the |ΔT| decreased. At jointing-booting stage, Tr was not at the lowest value at noon, but there was no significant difference in Tr at the end of drought and flooding treatment; it was mainly caused by the cloudy weather by that time. At tillering and jointing-booting stages, the time with the lowest value of ΔT at the end of flooding treatment was delayed by 1~1.5 h more than the time with Tr peak value, signifying that ΔT had a certain hysteresis in response to transpiration.
3.4. Response Relationship between ΔT and Influencing Factors under Water Level Control
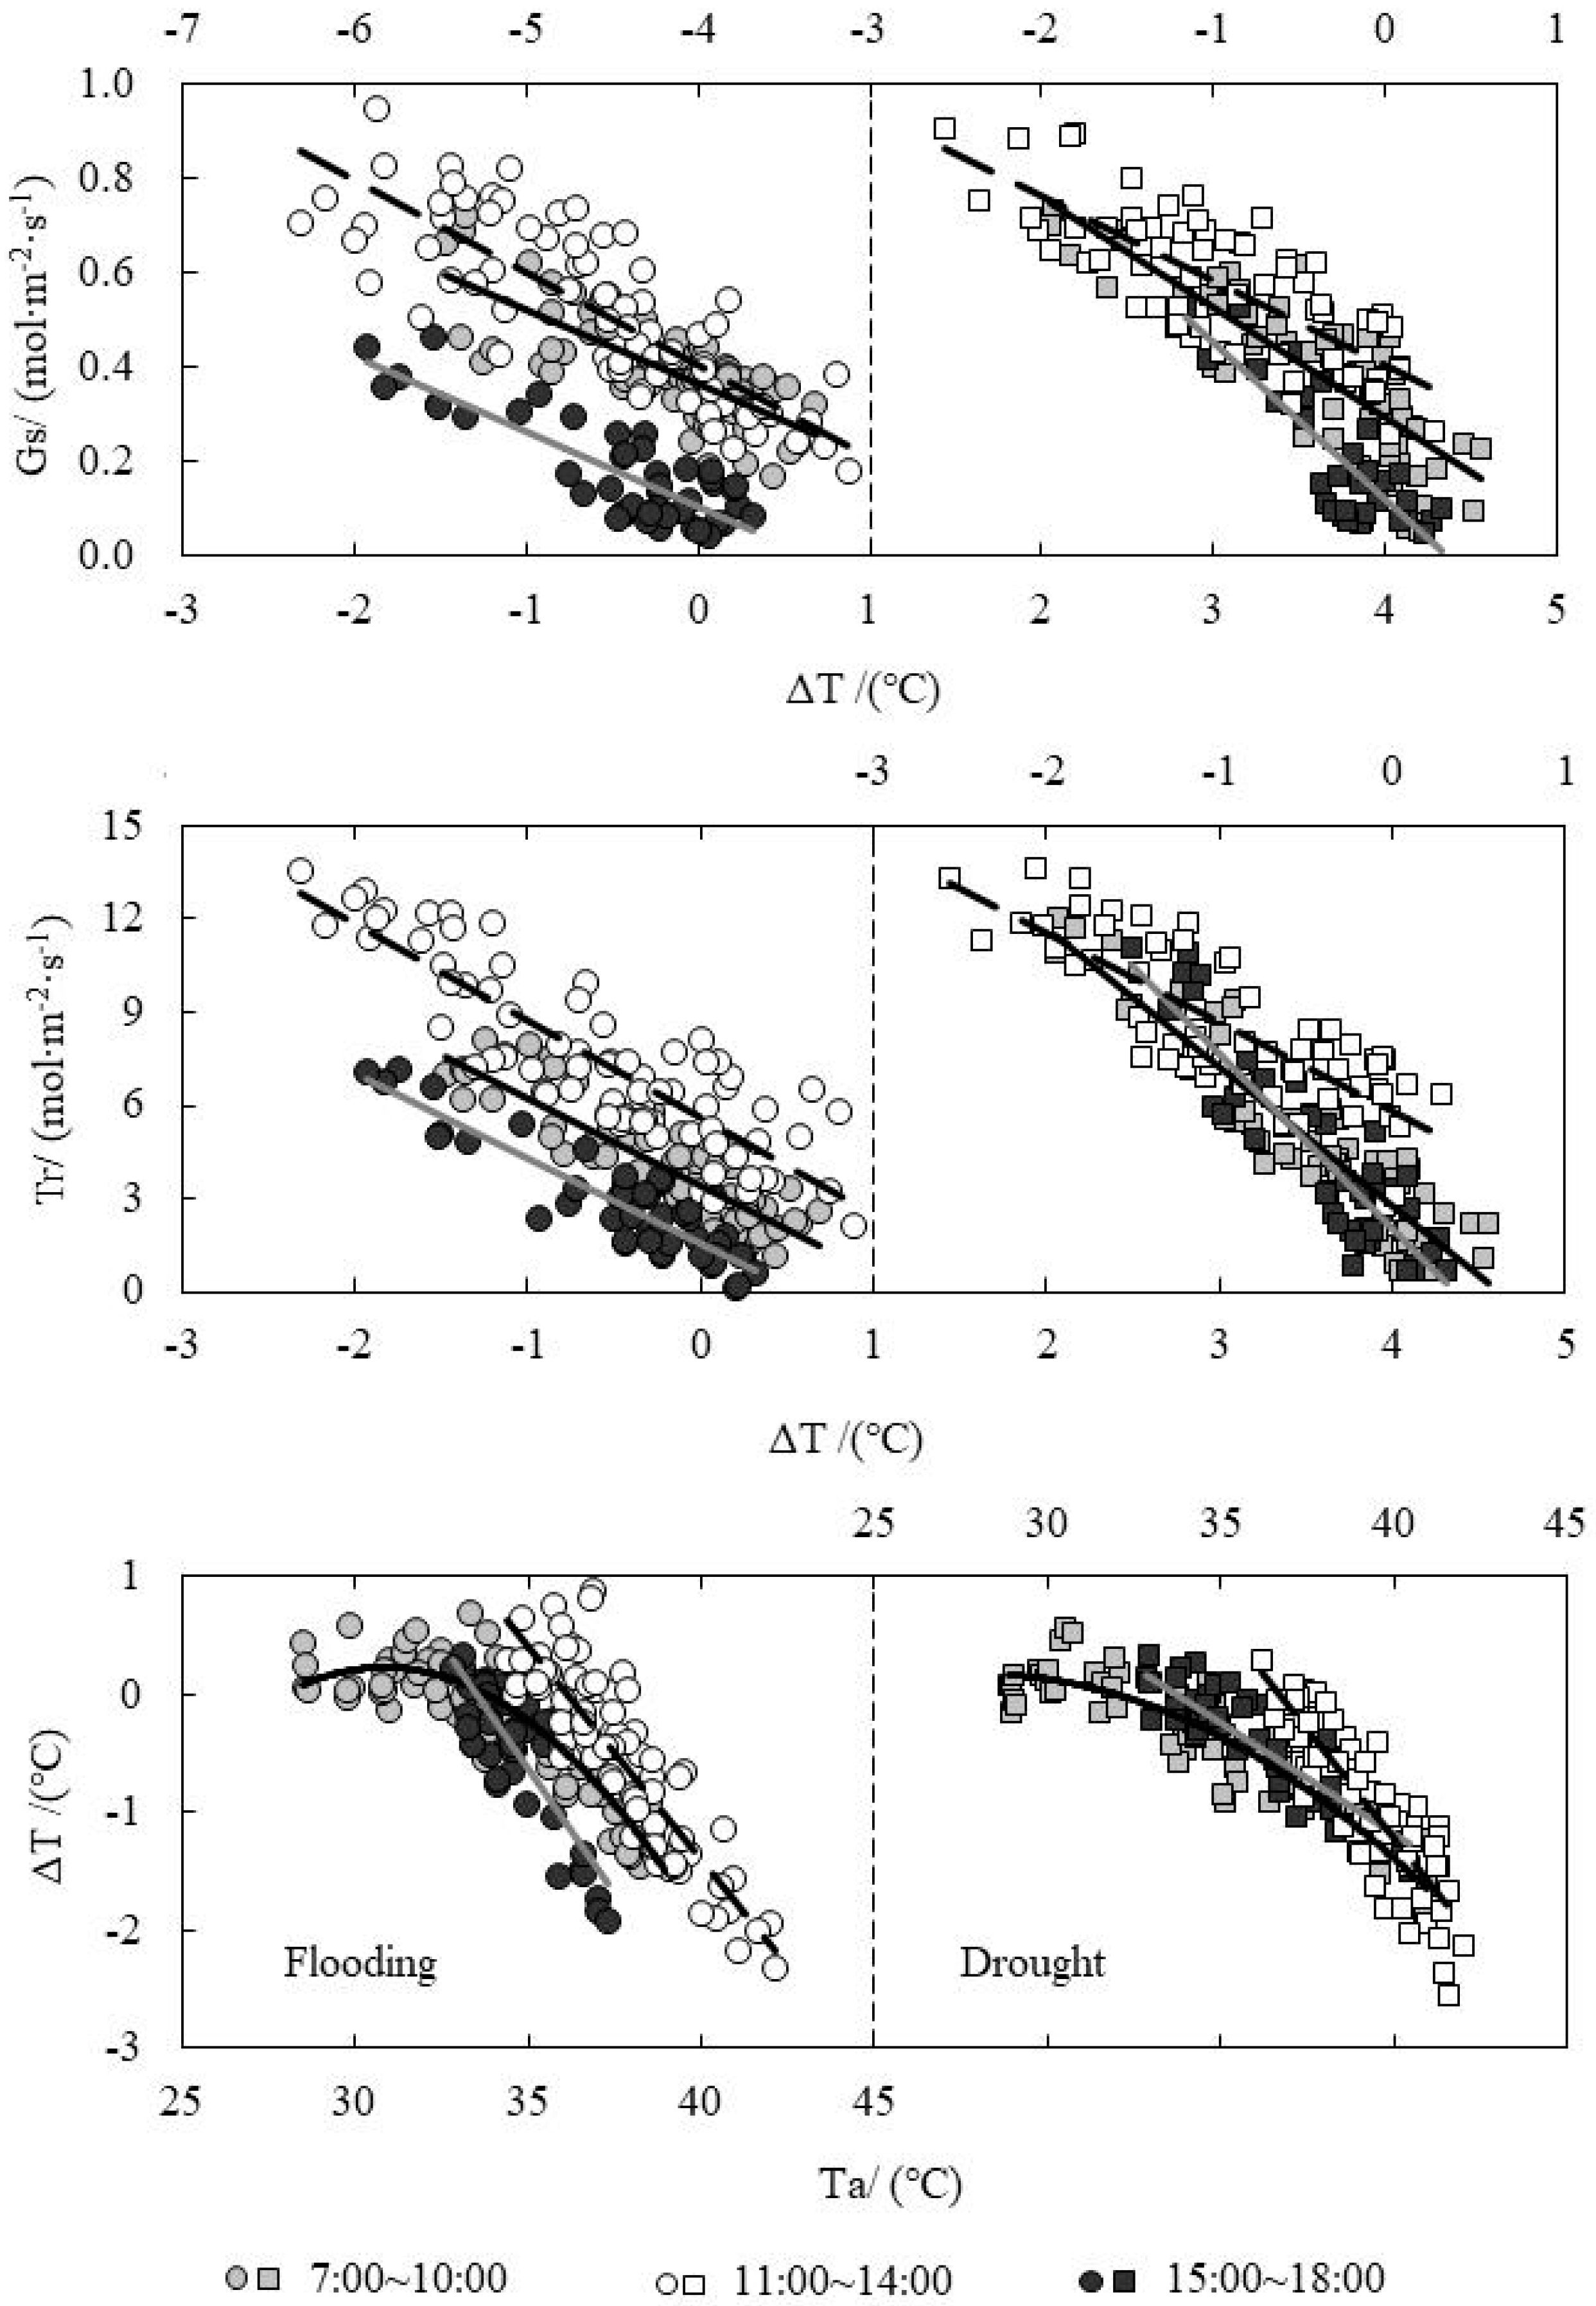
The relationships between ΔT and Gs, Tr and Ta (air temperature) of paddy rice’s leaf under water level control were shown in Figure 4. It showed that the response of Gs and Tr to ΔT were slightly different in the two conditions of drought and flooding treatments. The distribution of Gs and Tr was more distinct for flooding treatment, while it was concentrated for drought treatment in three time sections. For flooding treatment with the same ΔT, Gs and Tr reached the highest at noon, followed by the morning, while it was lowest in the afternoon. As for drought treatment, the smaller |ΔT|, the closer the Gs and Tr values in three time sections. The leaf temperature was a bit higher than Ta when the Ta was lower in the morning (27~33 °C), and ΔT was positive (0~1 °C). As the Ta raised, the leaf evapotranspiration accelerated, and |ΔT| gradually increased. When the Ta was at 35~37 °C at noon, the ΔT was positive for flooding treatment. This was because of weaker evapotranspiration for partially closed stomata and which prevented excessive water loss of leaves. The leaf temperature was higher than Ta at this time. ΔT was not positive at noon for drought treatment, which was mainly because of the weather conditions. When the Ta exceeded 37 °C, in order to prevent leaves from being burnt by high temperature, the stomata would open again to increase evapotranspiration and lower the leaf temperature, and |ΔT| increased at this moment. In the afternoon, |ΔT| gradually became zero with the temperature dropping. The reduction rate of |ΔT| for flooding treatment was faster than that for drought treatment, and the Ta range for drought treatment in the afternoon was 33~40 °C, which was wider than that for flooding treatment (33~37 °C). From the results above, the soil surface temperature was very high for drought condition, resulting in the higher temperature inside the rice canopy. The leaves could maintain the high evapotranspiration for a longer time and |ΔT| decreased slowly finally.
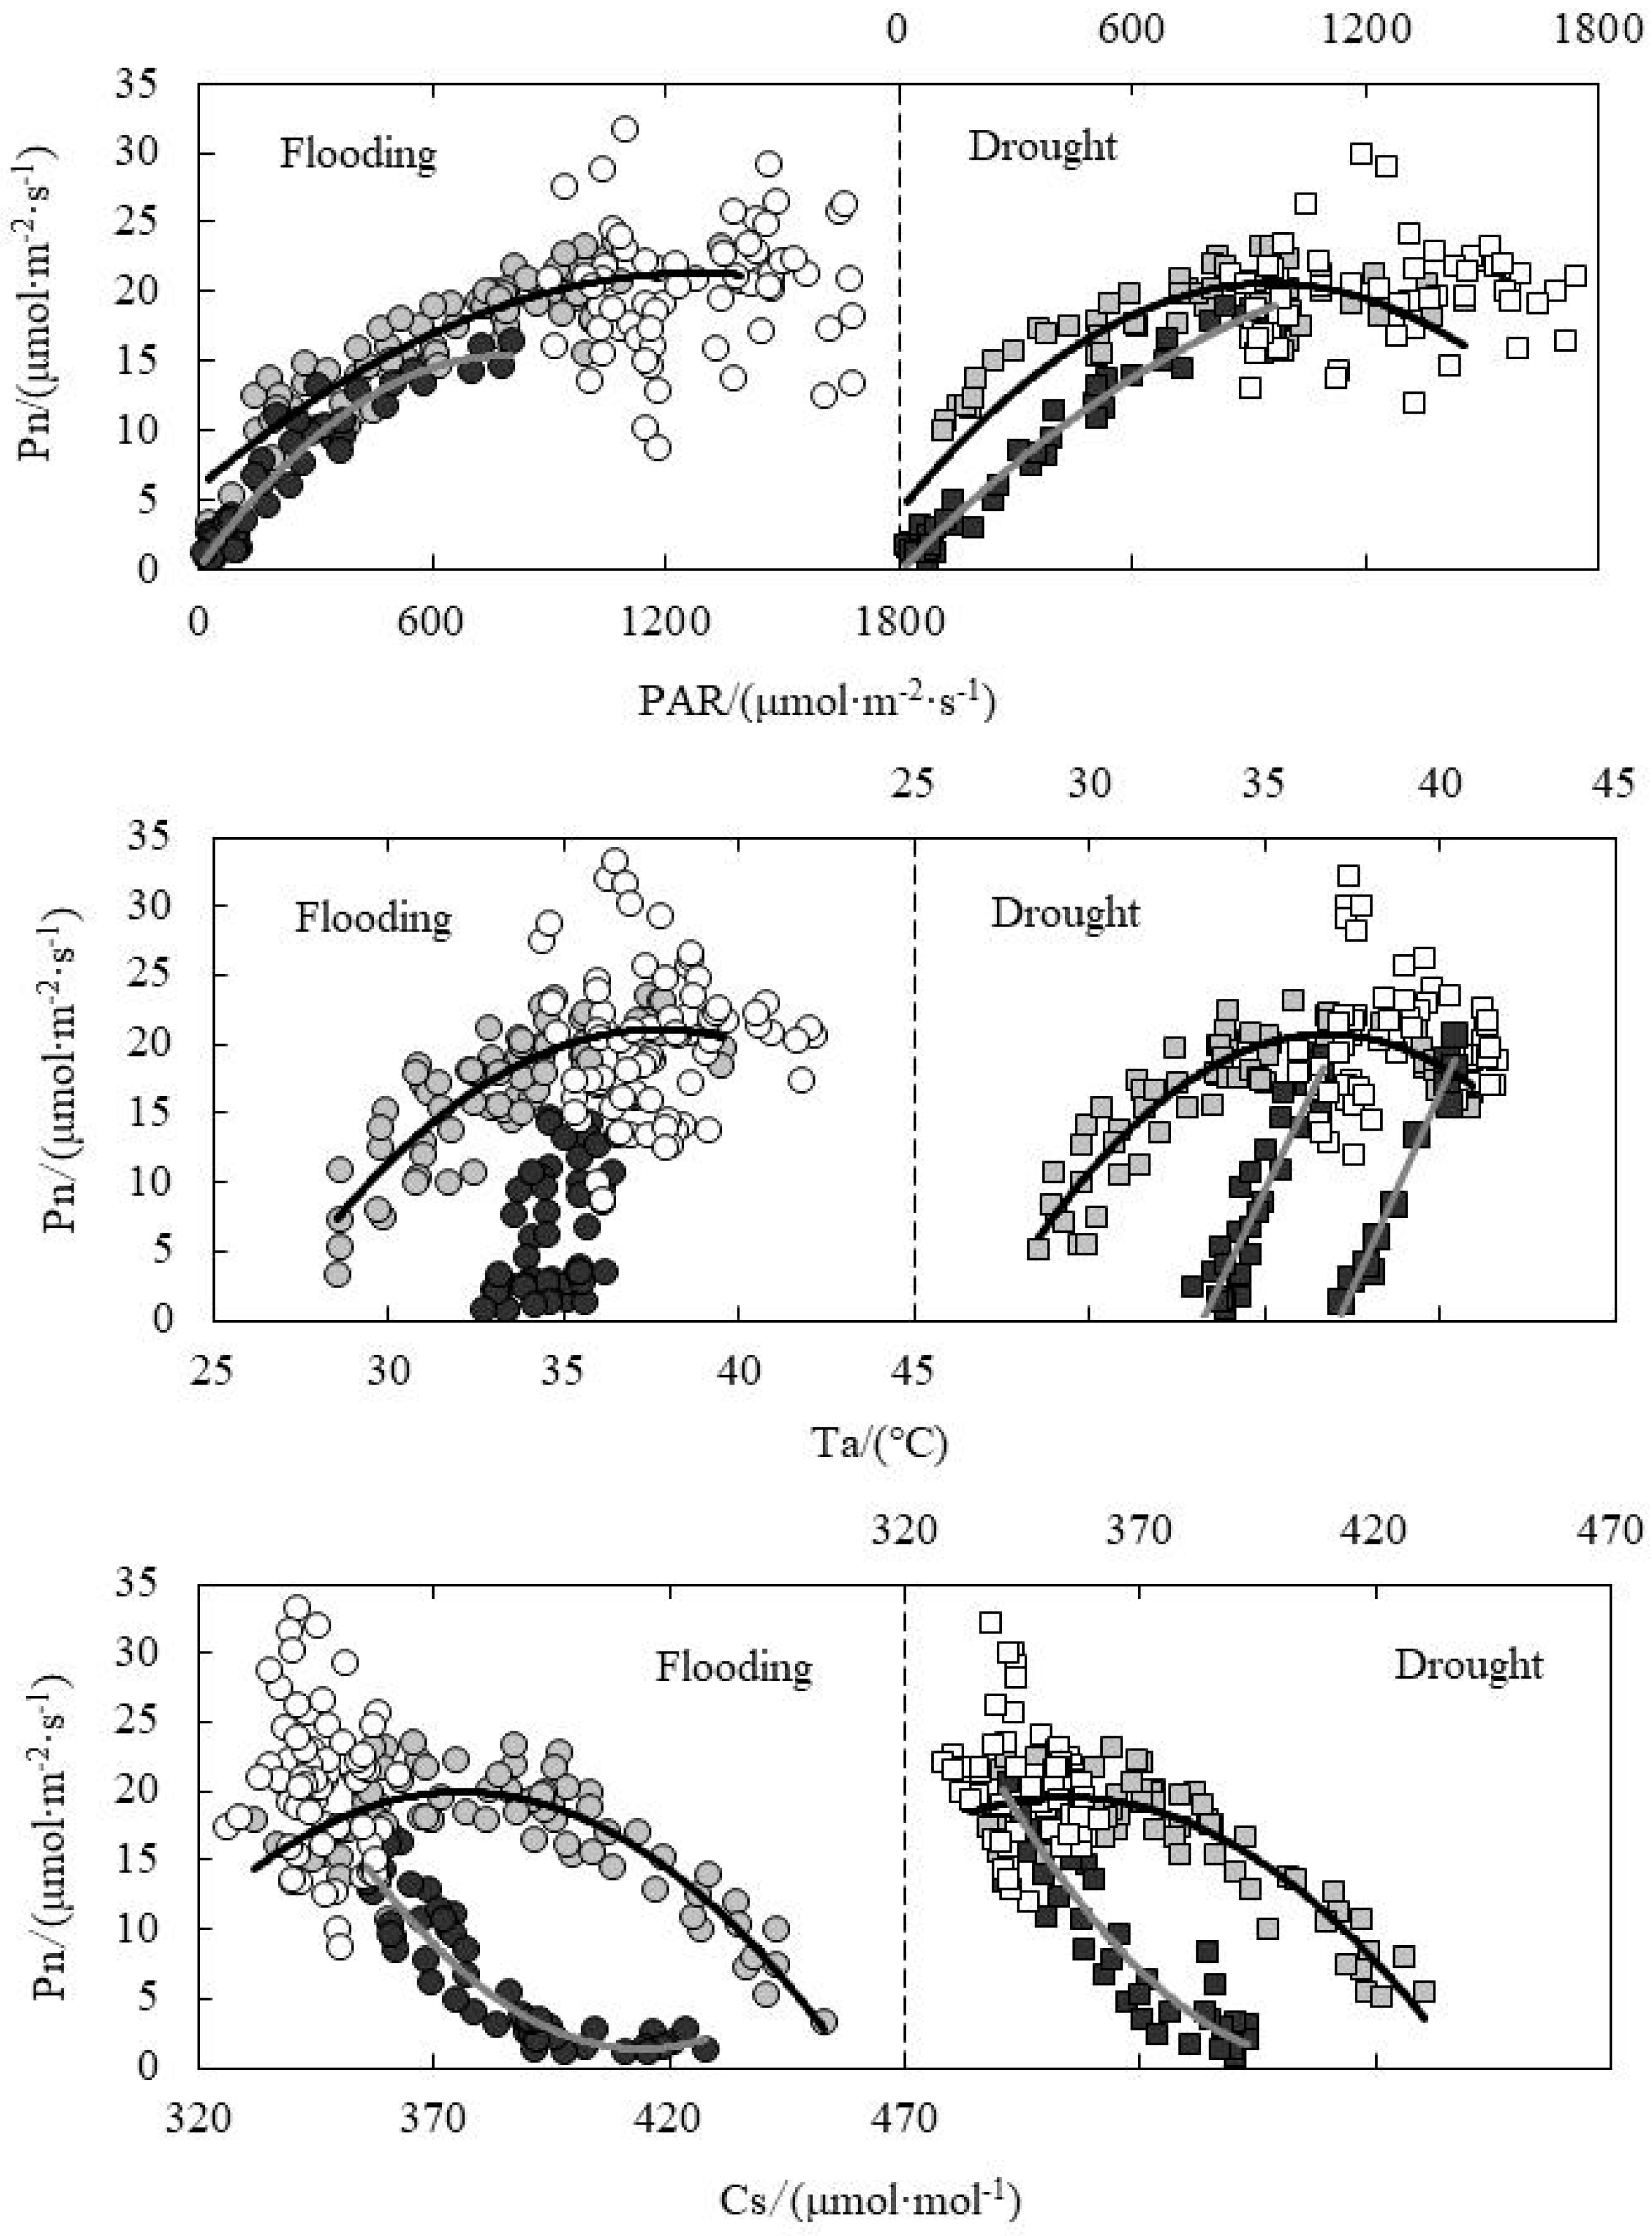
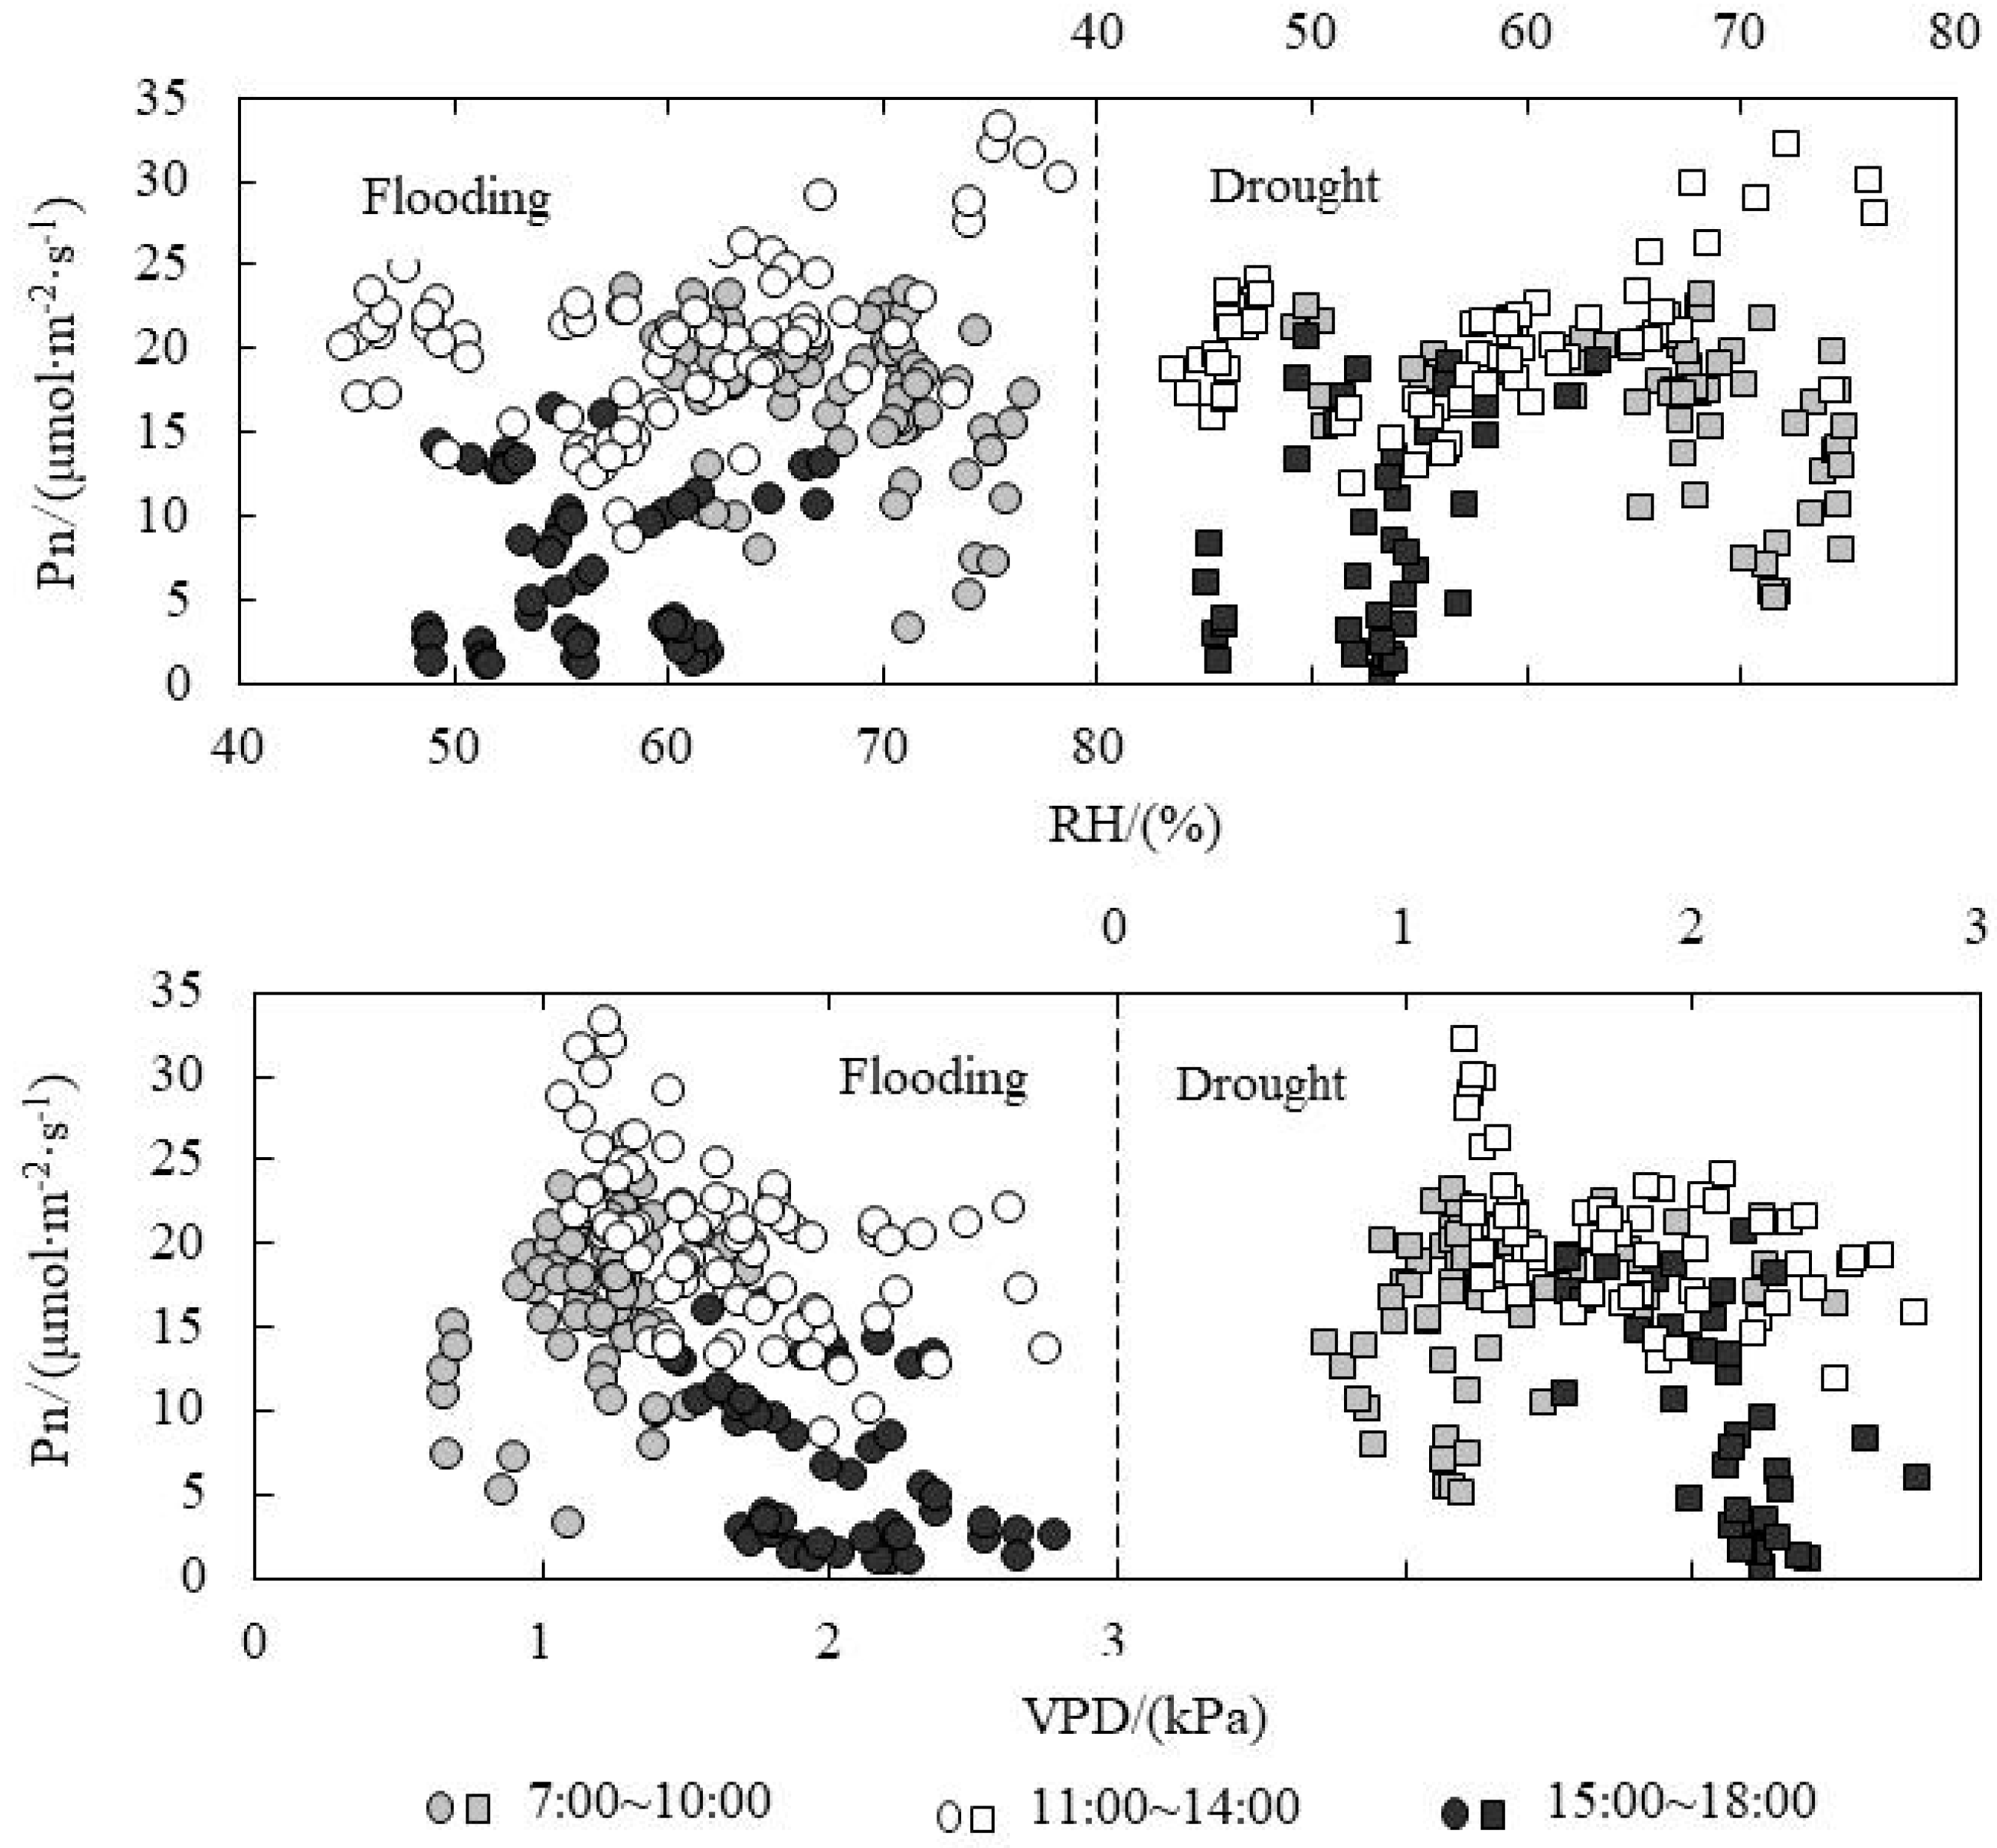
3.5. Response of Pn to Environmental Factors under Paddy Field Water Level Control
As shown in Figure 5, the Pn value in the morning was higher than that in the afternoon under the same photosynthetically active radiation (PAR). Compared to flooding treatment, the Pn value decreased obviously in the morning for drought treatment, reaching the peak value at the PAR of around 900 μmol·m−2·mol−1. At the noon, the PAR value concentrated in the range of 900~1800 μmol·m−2·mol−1 for both flooding and drought treatments. Also, the change of Pn value for flooding treatment (10~25 μmol·m−2·mol−1) was greater than that for drought treatment (15~25 μmol·m−2·mol−1). Ta is a major factor for photosynthesis process and the physical exchange of CO2 and water vapor between leaves and air. It could also affect the Pn level according to the effect on enzyme activity. The Pn value reached the peak at the temperature of 37 °C and 35 °C respectively for flooding and drought treatments in the morning. The Ta at the noon ranged from 35 °C to 42 °C, and the Pn ranged from 15 to 35 μmol·m−2·mol−1. The Pn in the afternoon was lower than that in the morning under the same Ta. CO2 is the raw material for photosynthesis. The Pn values for flooding and drought treatments reached the peak in the morning when the Ci levels were 380 and 350 μmol·mol−1, respectively. When the Ci ranged from 330 to 360 μmol·mol−1 at the noon, the Pn value ranged from 15 to 35 μmol·m−2·mol−1. At the same Ci value, the Pn value in the afternoon was lower than that in the morning. Relative humidity (RH) and vapor pressure difference (VPD) could affect Pn according to the effect on Gs and Tr. Moreover, the Pn change trend was not clear at the three periods; however, the distribution area of scatter points was obviously divided in each time interval. Xia found that PAR was the most important ecological factor affecting Pn, followed by air CO2 concentration; with the intensification of water stress, the Ta evidently restrained Pn by using path analysis [26]. The relative water content regimes were different to our study.
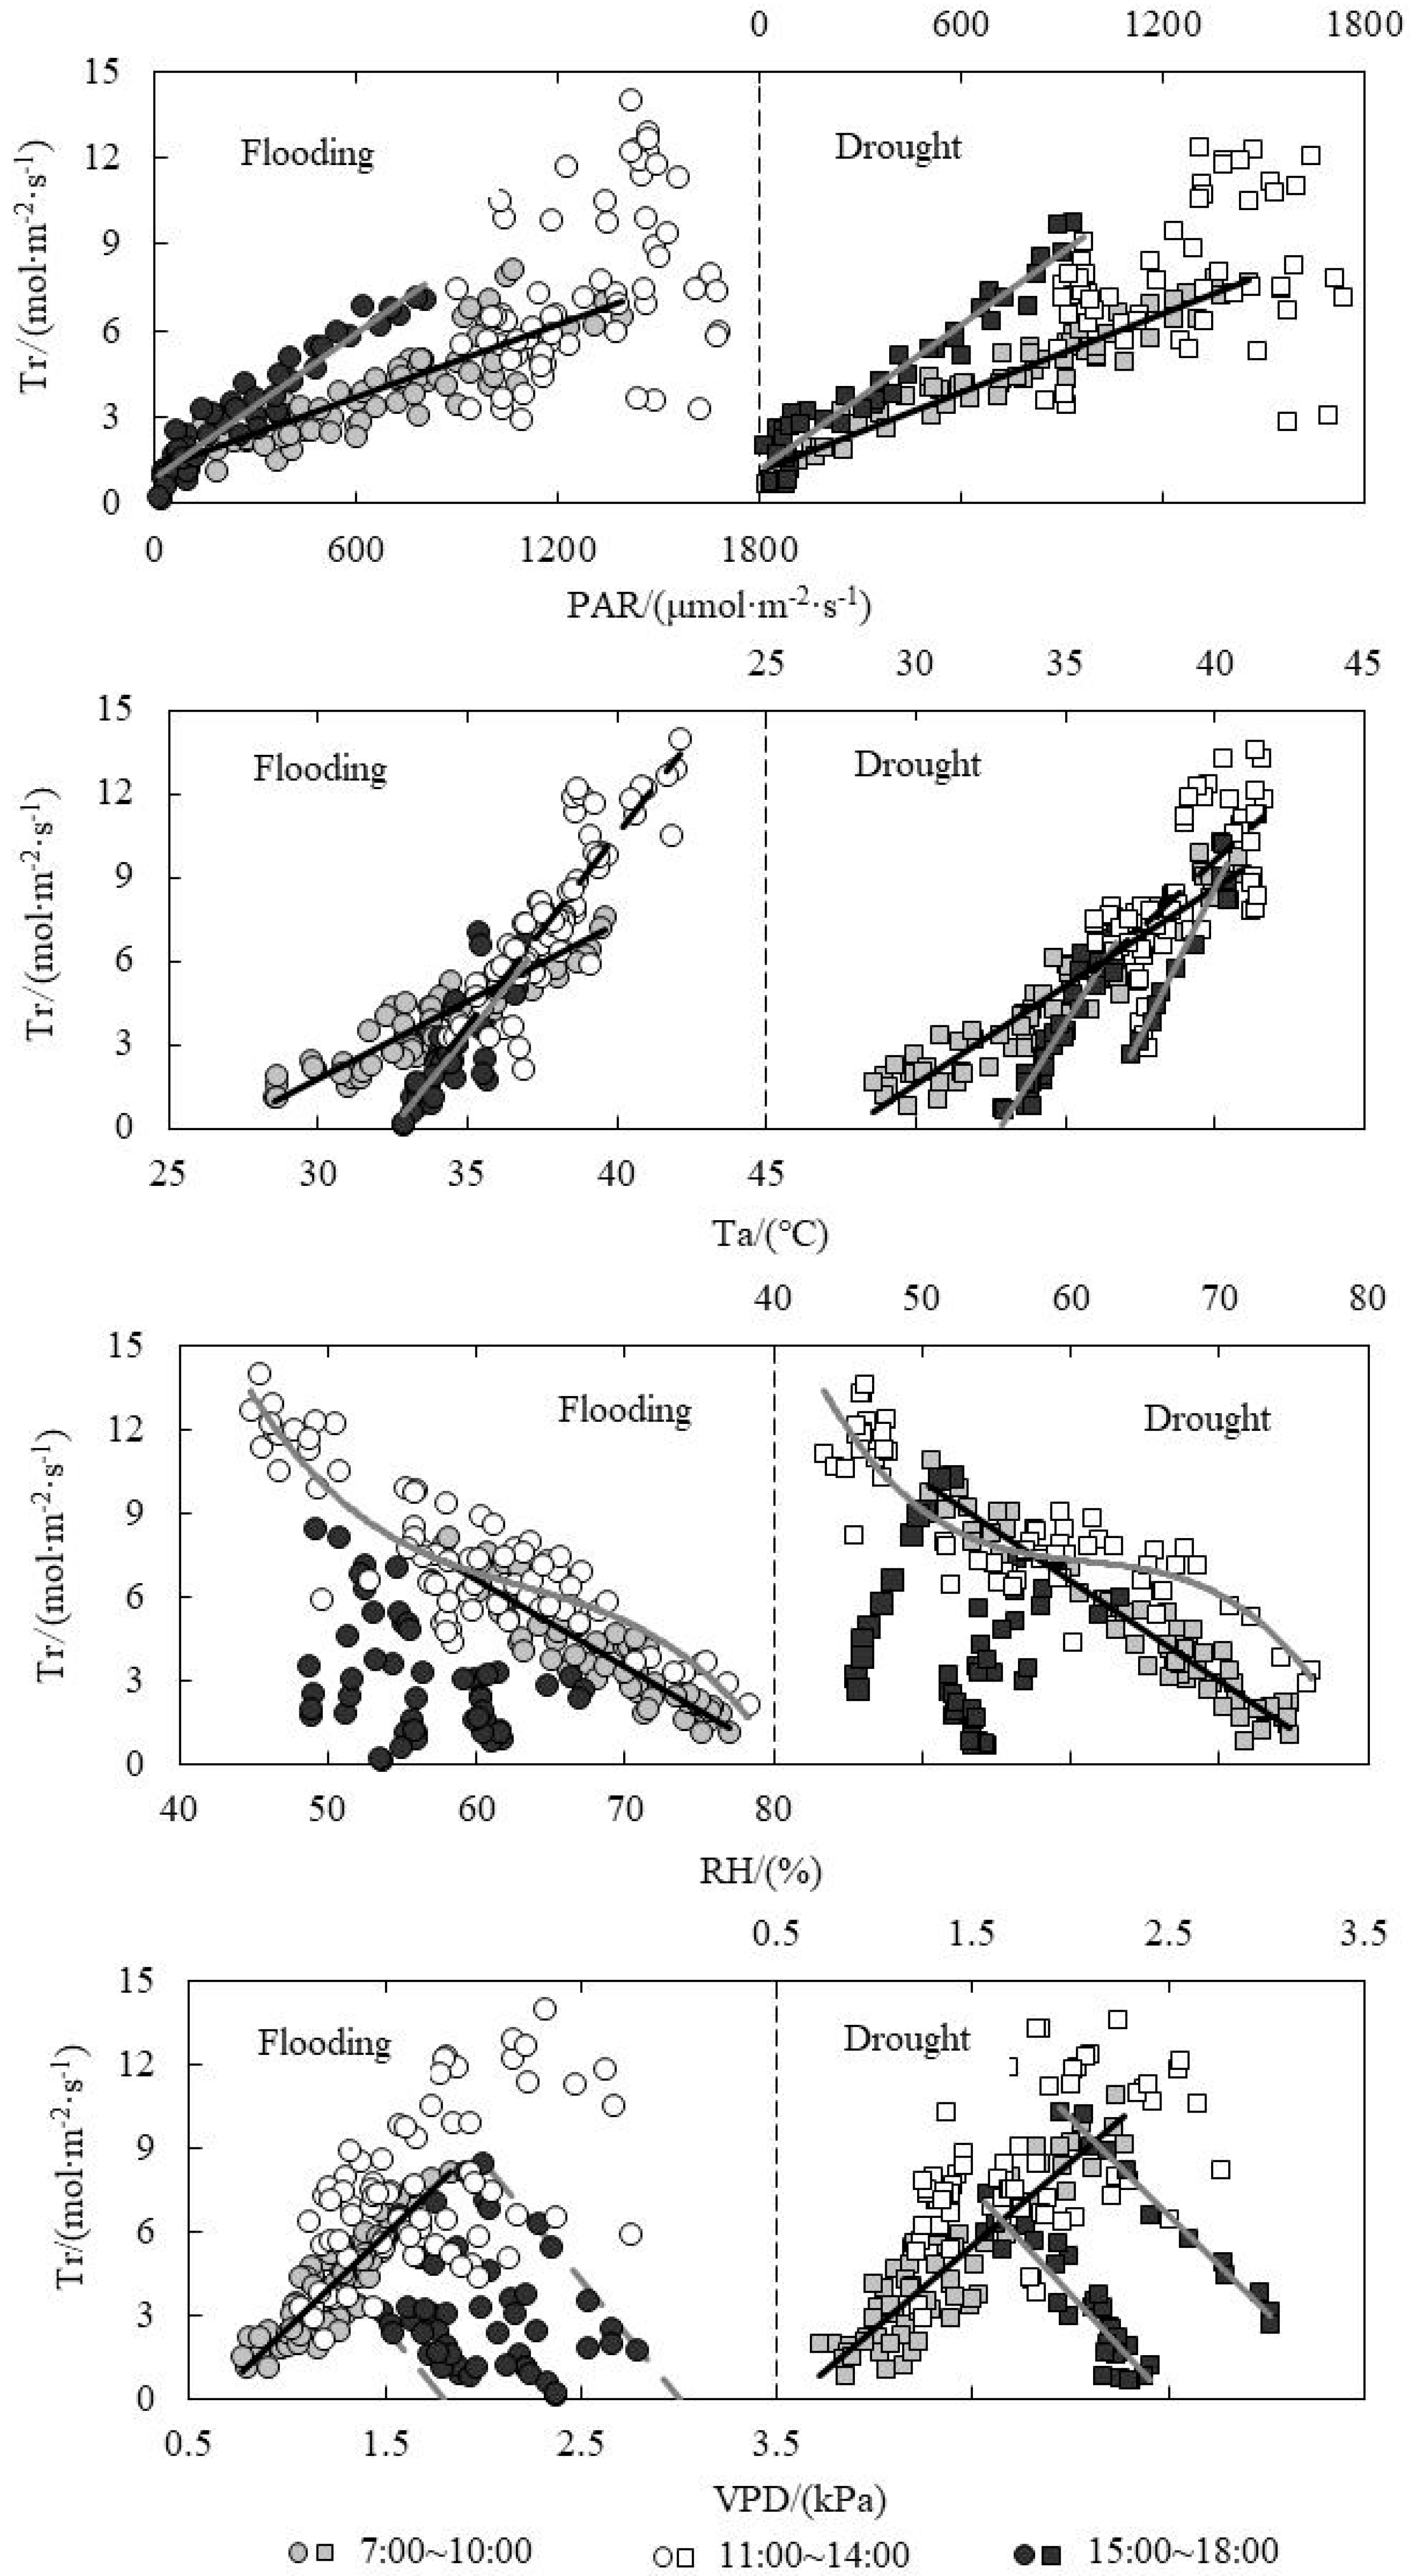
3.6. Response of Tr to Environmental Factors under Paddy Field Water Level Control
The relationship between Tr and environmental factors under water level control was shown in Figure 6. Under the same PAR condition, Tr was higher in the afternoon compared to the morning, which was mainly because of the higher accumulated temperature after the noon. The leaf stomata need to enhance evapotranspiration to avoid being burnt. The highest Tr value in the afternoon for drought treatment was obviously higher than that for flooding treatment, while the highest Tr value at noon for flooding treatment was higher. This explained the hysteresis effect of Tr on light intensity for drought treatment, which was mainly related to the micro-environment of the farmland formed under two conditions. The effect of temperature on evapotranspiration was achieved by affecting the water vapor pressure difference between inside and outside the leaves. Leaf temperature increased with Ta increasing, resulting in much more water vapor concentration increasing of stomata rather than the air [27]. The water vapor pressure difference inside and outside the leaves also increased, and Tr accelerated. The RH could affect crop Tr through affecting the evapotranspiration capacity of atmosphere. The more humid the air, the smaller the difference in vapor pressure between the inside and outside of the leaf, which is more detrimental to the evapotranspiration of the leaves. The RH, VPD and Tr showed a good linear relationship in the morning. The Tr increased with the RH decreasing or VPD increasing in the morning, while it decreased with RH increasing.
3.7. Regression Analysis between Physiological Indicators and Environmental Factors under Water Level Control
The regression analysis between physiological indicators and environmental factors under water level control was shown in Table 2. The absolute value of the slope of fitting line for flooding treatment was less than that for the drought treatment, which explained that the responding rate of Gs and Tr on ΔT for drought treatment was higher under the same leaf temperature difference condition. ΔT and Ta had quadratic and linear relationships in the morning and afternoon, respectively. For flooding and drought treatments, Pn and PAR had quadratic relationships both in the morning and afternoon. Pn and Ta had quadratic and linear relationships in the morning and afternoon, respectively. Pn and Cs also had quadratic relationships both in the morning and afternoon. Under the water level control, Tr showed good linear relationships with PAR and Ta both in the morning and afternoon, while the slope of the fitting line of Tr and Ta was larger in the afternoon, explaining that the responding rate of Tr on Ta was higher in the afternoon. Tr had good linear relationships with RH and VPD in the morning, while it was much more distributed at noon and in the afternoon.
4. Conclusions
In this paper, an analysis on the difference in physiological response of photosynthetic physiology and stomatal regulation to micro-meteorological environmental factors of paddy fields in the two water level regulation conditions of drought season and flood season was conducted on the systematic theory of soil-plant-atmosphere continuum (SPAC). The results showed that: (1) The responding range of Gs for drought was less than that for flooding. Pn and Gs had a quadratic relationship, Tr and Gs showed a linear relationship, and the response of Pn to Gs was not fully synchronous to the response of Pn to Tr. (2) Drought stress aggravated the photosynthetic stomatal limitation of rice leaves at noon, and partial closure of stomata was the main reason causing Pn decrease for drought at noon. The factors leading to Pn decreasing was not constant, and it was the results of the combined action of stomatal and non-stomatal limitation factors, and one of the factors dominated in a certain time.
(3) Daily change curve of ΔT showed a W or V type, which was opposite to Tr change. The time with the lowest ΔT value at the end of flooding treatment at tillering and jointing-booting stages was delayed by 1~1.5 h more than the time with the peak Tr, signifying the certain hysteresis to the response of leaf temperature difference to strong evapotranspiration.
(4) Pn had quadratic relationships with PAR and Cs respectively in the morning and afternoon, namely Pn and Ta had a quadratic and linear relationship in the morning, but a linear relationship in the afternoon, respectively. Pn for drought treatment reached its peak value in the morning when PAR was about 900 μmol·m−2·mol−1, and for flooding and drought treatments it reached the peak when Cs reached 380 and 350 μmol·mol−1 in the morning. Under the same PAR or Cs or Ta condition, the Pn value was lower in the afternoon than that in the morning, showing a certain hysteresis.
(5) Tr showed good linear relationships with PAR and Ta both in the morning and in the afternoon. Tr in the afternoon was higher than that in the morning. Tr had good linear relationships with RH and VPD in the morning, while it was much more distributed at noon and in the afternoon.
Author Contributions
M.X., Y.L., and B.L. conceived and designed the research, performed the analysis, analyzed the data, produced the tables and wrote the paper. M.X. and B.L. collected the data. M.X., Y.L. and Z.M. all read and made improvements to the manuscript.
Funding
Our research was financially supported by the National Natural Science Foundation of China (No. 51679108), Key Laboratory of Efficient Irrigation-Drainage and Agricultural Soil-Water Environment in Southern China (Hohai University), Ministry of Education (2017B20414-2), and the High-level Talent Research Project of North China University of Water Resources and Electric Power (No. 201705017).
Acknowledgments
Moreover, we would like to thank the assistant editor and the anonymous reviewers for their appreciated work, helpful suggestions and corrections.
Conflicts of Interest
The authors declare no conflict of interest.
References
- Mao, Z. Water Saving Irrigation for Rice and Its Effect on Environment. Eng. Sci. 2002, 4, 8–16. [Google Scholar]
- Xu, J.Z.; Peng, S.Z.; Yang, S.H.; Wang, W.G. Ammonia volatilization losses from a rice paddy with different irrigation and nitrogen managements. Agric. Water Manag. 2012, 104, 184–192. [Google Scholar] [CrossRef]
- Tan, X.; Shao, D.; Liu, H.; Yang, F.; Xiao, C.; Yang, H. Effects of alternate wetting and drying irrigation on percolation and nitrogen leaching in paddy fields. Paddy Water Environ. 2013, 11, 381–395. [Google Scholar] [CrossRef]
- Wang, S.L.; Wang, X.G.; Brown, L.C.; Qu, X. Current status and prospects of agricultural drainage in China. Irrig. Drain. 2010, 56, 47–58. [Google Scholar]
- Tian, S.; Youssef, M.A.; Skaggs, R.W.; Amatya, D.M.; Chescheir, G.M. Drainmod-forest: Integrated modeling of hydrology, soil carbon and nitrogen dynamics, and plant growth for drained forests. J. Environ. Qual. 2012, 41, 764. [Google Scholar] [CrossRef] [PubMed]
- Yu, S.E.; Miao, Z.M.; Xing, W.G.; Shao, G.C.; Jiang, Y.X. Research advance on irrigation and drainage for rice by using water level as regulation index. J. Irrig. Drain. 2010, 29, 134–136. [Google Scholar]
- Xiao, M.H.; Yu, S.E.; She, D.; Hu, X.J.; Chu, L.L. Nitrogen and phosphorus loss and optimal drainage time of paddy field under controlled drainage condition. Arab. J. Geosci. 2015, 8, 4411–4420. [Google Scholar] [CrossRef]
- Xiao, M.H.; Miao, Z.M.; Li, Y.Y. Changes of root-zone soil environment in flooded paddy field under controlled drainage conditions. Pol. J. Environ. Stud. 2017, 2, 881–892. [Google Scholar] [CrossRef]
- Jiang, Q.; Roche, D.; Monaco, T.A.; Durham, S. Gas exchange, chlorophyll fluorescence parameters and carbon isotope discrimination of 14 barley genetic lines in response to salinity. Field Crops Res. 2006, 96, 269–278. [Google Scholar] [CrossRef]
- Kiani-Pouya, A. Changes in activities of antioxidant enzymes and photosynthetic attributes in triticale (Triticosecale, Wittmack) genotypes in response to long-term salt stress at two distinct growth stages. Acta Physiol. Plant. 2015, 37, 1–11. [Google Scholar] [CrossRef]
- Miao, Z.M.; Yu, S.E.; Lu, B.; Ding, J.H.; Yu, Z.H. Relationships of water requirement photosynthesis production for paddy rice using structural equation modeling. Trans. Chin. Soc. Agric. Eng. 2013, 29, 91–98. [Google Scholar]
- Wang, W.; Xia, M.X.; Chen, J.; Yuan, R.; Deng, F.N.; Shen, F.F. Gene expression characteristics and regulation mechanisms of superoxide dismutase and its physiological roles in plants under stress. Biochemistry 2016, 81, 465–480. [Google Scholar] [CrossRef] [PubMed]
- Li, Y.S.; Li, S.S. Effect of submergence stress on the distribution of starch granules in leaf sheath and leaf of rice. J. Wuhan Bot. Res. 2000, 18, 528–530. [Google Scholar]
- Hirano, T.; Uchida, N.; Azuma, T.; Yasuda, T. Effect of submergence on distribution of photoassimilates and activities of sucrose metabolizing enzymes in sink organs of floating rice. Jpn. J. Crop Sci. 2008, 65, 540–548. [Google Scholar] [CrossRef]
- Hu, J.; Cao, W.; Jiang, D.; Luo, W. Quantification of water stress factor for crop growth simulation I. Effects of drought and waterlogging stress on photosynthesis, transpiration and dry matter partitioning in winter wheat. Acta Agron. Sin. 2004, 30, 315–320. [Google Scholar]
- Lv, J.; Li, C.; Zhang, J.; Li, F. Effect of drought on distribution of carbon assimilation in different genotypes of spring wheat. Agric. Res. Arid Areas 2005, 21, 77–81. [Google Scholar]
- Zeppel, M.J.B.; Lewis, J.D.; Chaszar, B.; Smith, R.A.; Medlyn, B.E.; Huxman, T.E. Nocturnal stomatal conductance responses to rising [CO2], temperature and drought. New Phytol. 2012, 193, 929–938. [Google Scholar] [CrossRef]
- Wu, X.H.; Wang, W.; Xie, X.L.; Yin, C.M.; Xie, K.J. Photosynthetic and yield responses of rice (Oryza sativa, L.) to different water management strategies in subtropical China. Photosynthetica 2018, 1, 1–8. [Google Scholar] [CrossRef]
- Zhang, L.X.; Peng, L.W.; Lin, R.C.; Lu, C.M.; Kuang, T.Y. Advances and Prospects of Photosynthesis Research. China Basic Sci. 2016, 1, 13–20. [Google Scholar]
- Ming, D.F.; Pei, Z.F.; Naeem, M.S.; Gong, H.J.; Zhou, W.J. Silicon alleviates PEG-induced water-deficit stress in upland rice seedlings by enhancing osmotic adjustment. J. Agron. Crop Sci. 2012, 198, 14–26. [Google Scholar] [CrossRef]
- Wang, J.Y.; Jia, J.X.; Xiong, Z.Q.; Khalil, M.A.K.; Xing, G.X. Water regime–nitrogen fertilizer–straw incorporation interaction: Field study on nitrous oxide emissions from a rice agroecosystem in Nanjing, China. Agric. Ecosyst. Environ. 2011, 141, 437–446. [Google Scholar] [CrossRef]
- Tan, X.; Shao, D.; Gu, W.; Liu, H. Field analysis of water and nitrogen fate in lowland paddy fields under different water managements using HYDRUS–D. Agric. Water Manag. 2015, 150, 67–80. [Google Scholar] [CrossRef]
- He, Y.; Zhang, J.; Xu, J.; Hong, D.; Yang, S. Regulation and control of water transformation through coupling irrigation and drainage in paddy field. Trans. Chin. Soc. Agric. Eng. 2016, 32, 144–149. [Google Scholar]
- Huang, M.; Shan, S.L.; Zhou, X.F.; Chen, J.; Cao, F.B.; Jiang, L.G.; Zou, Y.B. Leaf photosynthetic performance related to higher radiation use efficiency and grain yield in hybrid rice. Field Crops Res. 2016, 193, 87–93. [Google Scholar] [CrossRef]
- Xu, J.Z.; Lv, Y.; Liu, X.; Dalson, T.; Yang, S.; Wu, J. Diagnosing crop water stress of rice using infrared thermal imager under water deficit condition. Int. J. Agric. Biol. 2016, 18, 565–572. [Google Scholar] [CrossRef]
- Xia, J.; Zhang, S.; Guo, J.; Rong, Q.; Zhang, G. Critical effects of gas exchange parameters in Tamarix Chinensis, Lour on soil water and its relevant environmental factors on a shell ridge island in China’s Yellow River Delta. Ecol. Eng. 2015, 76, 36–46. [Google Scholar] [CrossRef]
- Lima Neto, M.C.; Martins, M.D.O.; Ferreirasilva, S.L.; Silveira, J.A.G. Jatropha curcas and Ricinus communis display contrasting photosynthetic mechanisms in response to environmental conditions. Sci. Agric. 2015, 72, 260–269. [Google Scholar] [CrossRef]
Figure 1.
Stomatal and non-stomatal limitations relations on photosynthetic rate (Pn) under the drought condition.
Figure 1.
Stomatal and non-stomatal limitations relations on photosynthetic rate (Pn) under the drought condition.

Figure 2.
Relations between intercellular CO2 concentration (Ci) and stomatal conductance (Gs), photosynthetic rate (Pn) and CO2 concentration (Cs) under water level control.
Figure 2.
Relations between intercellular CO2 concentration (Ci) and stomatal conductance (Gs), photosynthetic rate (Pn) and CO2 concentration (Cs) under water level control.

Figure 3.
Daily change of temperature difference (ΔT) and evapotranspiration rate (Tr) under water level control.
Figure 3.
Daily change of temperature difference (ΔT) and evapotranspiration rate (Tr) under water level control.

Figure 4.
Relationship between temperature difference (ΔT) and stomatal conductance (Gs), evapotranspiration rate (Tr), and air temperature (Ta) under water level control.
Figure 4.
Relationship between temperature difference (ΔT) and stomatal conductance (Gs), evapotranspiration rate (Tr), and air temperature (Ta) under water level control.

Figure 5.
Response of photosynthetic rate (Pn) to environmental factors under water level control in paddy field.
Figure 5.
Response of photosynthetic rate (Pn) to environmental factors under water level control in paddy field.


Figure 6.
Response of evapotranspiration rate (Tr) to environmental factors under paddy field water level regulation.
Figure 6.
Response of evapotranspiration rate (Tr) to environmental factors under paddy field water level regulation.


Table 1.
Water level regulation scheme and water control stages division in 2011 and 2012.
| Treatments | Tillering | Jointing-Booting | Heading-Flowering | Milky | Starting/ Ending Time | |
|---|---|---|---|---|---|---|
| (07.05~08.05) | (08.06~08.26) | (08.27~09.09) | (09.10~10.10) | |||
| Water flooding | L1 | 120 mm/2 mm/day | −300~30 mm | −300~30 mm | 300~30 mm | 07.19~07.28 |
| L2 | 120 mm/4 mm/day | −300~30 mm | −300~30 mm | 300~30 mm | ||
| L3 | −200~20 mm | 250 mm/2 mm/day | −300~30 mm | 300~30 mm | 08.14~08.23 | |
| L4 | −200~20 mm | 250 mm/4 mm/day | −300~30 mm | 300~30 mm | ||
| L5 | −200~20 mm | −300~30 mm | 250 mm/2 mm/day | 300~30 mm | 08.30~09.08 | |
| L6 | −200~20 mm | −300~30 mm | 250 mm/4 mm/day | 300~30 mm | ||
| L7 | −200~20 mm | −300~30 mm | −300~30 mm | 250 mm/2 mm/day | 09.12~09.21 | |
| L8 | −200~20 mm | −300~30 mm | −300~30 mm | 250 mm/2 mm/day | ||
| Water drought | H1 | −300 mm | −300~30 mm | −300~30 mm | −300~30 mm | 07.19~ |
| H2 | −500 mm | −300~30 mm | −300~30 mm | −300~30 mm | ||
| H3 | −200~20 mm | −400 mm | −300~30 mm | −300~30 mm | 08.14~ | |
| H4 | −200~20 mm | −700 mm | −300~30 mm | −300~30 mm | ||
| H5 | −200~20 mm | −300~30 mm | −400 mm | −300~30 mm | 08.30~ | |
| H6 | −200~20 mm | −300~30 mm | −700 mm | −300~30 mm | ||
| H7 | −200~20 mm | −300~30 mm | −300~30 mm | −400 mm | 09.12~ | |
| H8 | −200~20 mm | −300~30 mm | −300~30 mm | −700 mm | ||
| Contrast treatment | CK | −300~30 mm | −300~30 mm | −300~30 mm | −300~30 mm | |
Notes: (1) During the water control period, water level and duration was controlled according to Table 1. After that, water level was recovered to reasonable upper water level limit. (2) Water flooding test lasted for 10 days, and it was controlled according to the preset leakage amount. At other stages, the leakage amount was set at 2 mm·day−1 when there was a water layer, while it was 0 mm/d when there was no water layer. At water control stage, there was no water supplement when water table was decreasing. (3) Starting time for water flooding and drought at each growing stage was same. As for water drought test, it covered the one from no water layer decreasing to the set value. According to the water controlling days, once to twice drought was carried out at each growing stage.
Table 2.
Regression analysis between rice physiological indicators and environmental factors under paddy field’s water level control.
Table 2.
Regression analysis between rice physiological indicators and environmental factors under paddy field’s water level control.
| Relationship | Treatment | Time | Fitting Formula | R2 | F | p |
|---|---|---|---|---|---|---|
| Relationship between Gs and Ci | Flooding | A.M. | y = −2 × 10−5x2 + 0.0126x − 1.3325 | 0.46 | 29.383 | <0.001 |
| P.M. | y = 35.813e−0.018x | 0.6479 | 92.013 | <0.001 | ||
| Drought | A.M. | y = −5 × 10−5x2 + 0.0281x − 3.4711 | 0.7378 | 74.416 | <0.001 | |
| P.M. | y = 99.209e−0.0208x | 0.7006 | 100.643 | <0.001 | ||
| Relationship between Pn and Ci | Flooding | A.M. | y = −0.0005x2 + 0.1841x + 2.4961 | 0.6772 | 72.362 | <0.001 |
| P.M. | y = 1981.8e−0.0197x | 0.73 | 119.998 | <0.001 | ||
| Drought | A.M. | y = −0.0013x2 + 0.6602x − 63.89 | 0.8893 | 245.122 | <0.001 | |
| P.M. | y = 65729e−0.0308x | 0.851 | 241.335 | <0.001 | ||
| Relationship between Cs and Ci | Flooding | A.M. | y = 1.3025x − 212.41 | 0.7598 | 221.447 | <0.001 |
| P.M. | y = 1.2263x − 165.55 | 0.8077 | 210.064 | <0.001 | ||
| Drought | A.M. | y = 1.4527x − 252.94 | 0.8248 | 291.951 | <0.001 | |
| P.M. | y = 1.5296x − 261.17 | 0.8484 | 218.588 | <0.001 | ||
| Relationship between Gs and ΔT | Flooding | A.M. | y = −0.1557x + 0.3665 | 0.5753 | 94.831 | <0.001 |
| P.M. | y = −0.1596x + 0.1036 | 0.7219 | 112.732 | <0.001 | ||
| Drought | A.M. | y = −0.233x + 0.2943 | 0.702 | 146.03 | <0.001 | |
| P.M. | y = −0.3347x + 0.1182 | 0.7189 | 79.273 | <0.001 | ||
| Relationship between Tr and ΔT | Flooding | A.M. | y = −2.837x + 3.3961 | 0.7076 | 169.394 | <0.001 |
| P.M. | y = −2.7517x + 1.5614 | 0.8123 | 199.008 | <0.001 | ||
| Drought | A.M. | y = −4.4699x + 2.7667 | 0.8357 | 315.382 | <0.001 | |
| P.M | y = −5.6112x + 2.0958 | 0.8182 | 193.488 | <0.001 | ||
| Relationship between Ta and ΔT | Flooding | A.M. | y = −0.0262x2 + 1.6172x − 24.73 | 0.7504 | 103.715 | <0.001 |
| P.M | y = −0.4235x + 14.177 | 0.7206 | 118.612 | <0.001 | ||
| Drought | A.M. | y = −0.0108x2 + 0.6023x − 8.2518 | 0.8446 | 165.825 | <0.001 | |
| P.M | y = −0.1878x + 6.3287 | 0.8092 | 182.344 | <0.001 | ||
| Relationship between Pn and PAR | Flooding | A.M. | y = −9 × 10−6x2 + 0.0240x + 5.9349 | 0.8053 | 142.733 | <0.001 |
| P.M. | y = −3 × 10−5x2 + 0.0426x + 0.0023 | 0.9101 | 280.226 | <0.001 | ||
| Drought | A.M. | y = −2 × 10−5x2 + 0.0346x + 4.0830 | 0.8302 | 149.14 | <0.001 | |
| P.M. | y = −9 × 10−6x2 + 0.0287x − 0.1358 | 0.9684 | 643.306 | <0.001 | ||
| Relationship between Pn and Ta | Flooding | A.M. | y = −0.1648x2 + 12.414x − 212.73 | 0.7026 | 81.496 | <0.001 |
| P.M. | y = 2.4912x − 80.012 | 0.3081 | 22.26 | <0.001 | ||
| Drought | A.M. | y = −0.2178x2 + 16.019x − 273.79 | 0.8019 | 123.476 | <0.001 | |
| P.M. | y = 6.7255x − 252.53 | 0.971 | 309.36 | <0.001 | ||
| Relationship between Pn and Cs | Flooding | A.M. | y = −0.0029x2 + 2.1674x − 387.24 | 0.7322 | 94.308 | <0.001 |
| P.M. | y = 0.0039x2 − 3.2062x + 665.26 | 0.8504 | 139.257 | <0.001 | ||
| Drought | A.M. | y = −0.0028x2 + 1.9558x − 326.94 | 0.8036 | 124.807 | <0.001 | |
| P.M. | y = 0.004x2 − 3.3269x + 683.67 | 0.8392 | 109.567 | <0.001 | ||
| Relationship between Tr and PAR | Flooding | A.M. | y = 0.0042x + 1.1463 | 0.7271 | 186.521 | <0.001 |
| P.M. | y = 0.0084x + 0.9127 | 0.9188 | 565.615 | <0.001 | ||
| Drought | A.M. | y = 0.0046x + 1.0649 | 0.9396 | 964.164 | <0.001 | |
| P.M. | y = 0.0084x + 1.1153 | 0.9452 | 741.373 | <0.001 | ||
| Relationship between Tr and Ta | Flooding | A.M. | y = 0.5614x − 15.064 | 0.8208 | 320.659 | <0.001 |
| P.M. | y = 1.3036x − 42.231 | 0.7071 | 111.074 | <0.001 | ||
| Drought | A.M. | y = 0.7032x − 19.464 | 0.8986 | 549.549 | <0.001 | |
| P.M. | y = 2.1467x − 77.274 | 0.9396 | 155.531 | <0.001 | ||
| Relationship between Tr and RH | Flooding | A.M. | y = −0.314x + 25.466 | 0.8291 | 339.604 | <0.001 |
| P.M. | y = −0.0007x3 + 0.1317x2 − 8.4573x + 190.44 | 0.7841 | 113.719 | <0.001 | ||
| Drought | A.M. | y = −0.3563x + 27.942 | 0.9402 | 974.249 | <0.001 | |
| P.M. | y = −0.0009x3 + 0.1736x2 − 10.642x + 225.78 | 0.7801 | 83.152 | <0.001 | ||
| Relationship between Tr and VPD | Flooding | A.M. | y = 6.6981x − 4.1526 | 0.747 | 206.728 | <0.001 |
| Drought | A.M. | y = 5.9954x − 3.5076 | 0.8193 | 281.098 | <0.001 | |
| P.M. | y = −7.6055x + 18.933 | 0.8481 | 173.092 | <0.001 | ||
| y = −6.8669x + 23.748 (Tillering) | 0.9831 | 583.217 | <0.001 |
© 2018 by the authors. Licensee MDPI, Basel, Switzerland. This article is an open access article distributed under the terms and conditions of the Creative Commons Attribution (CC BY) license (http://creativecommons.org/licenses/by/4.0/).
Share and Cite
MDPI and ACS Style
Xiao, M.; Li, Y.; Lu, B.; Miao, Z. Response of Physiological Indicators to Environmental Factors under Water Level Regulation of Paddy Fields in Southern China. Water 2018, 10, 1772. https://doi.org/10.3390/w10121772
AMA Style
Xiao M, Li Y, Lu B, Miao Z. Response of Physiological Indicators to Environmental Factors under Water Level Regulation of Paddy Fields in Southern China. Water. 2018; 10(12):1772. https://doi.org/10.3390/w10121772
Chicago/Turabian StyleXiao, Menghua, Yuanyuan Li, Bin Lu, and Zimei Miao. 2018. "Response of Physiological Indicators to Environmental Factors under Water Level Regulation of Paddy Fields in Southern China" Water 10, no. 12: 1772. https://doi.org/10.3390/w10121772
Note that from the first issue of 2016, this journal uses article numbers instead of page numbers. See further details here.