Identifying the Key Information and Land Management Plans for Water Conservation under Dry Weather Conditions in the Border Areas of the Syr Darya River in Kazakhstan

 , ,
, ,  , , ,
, , ,  and
and 
Abstract
:1. Introduction
2. Materials and Methods
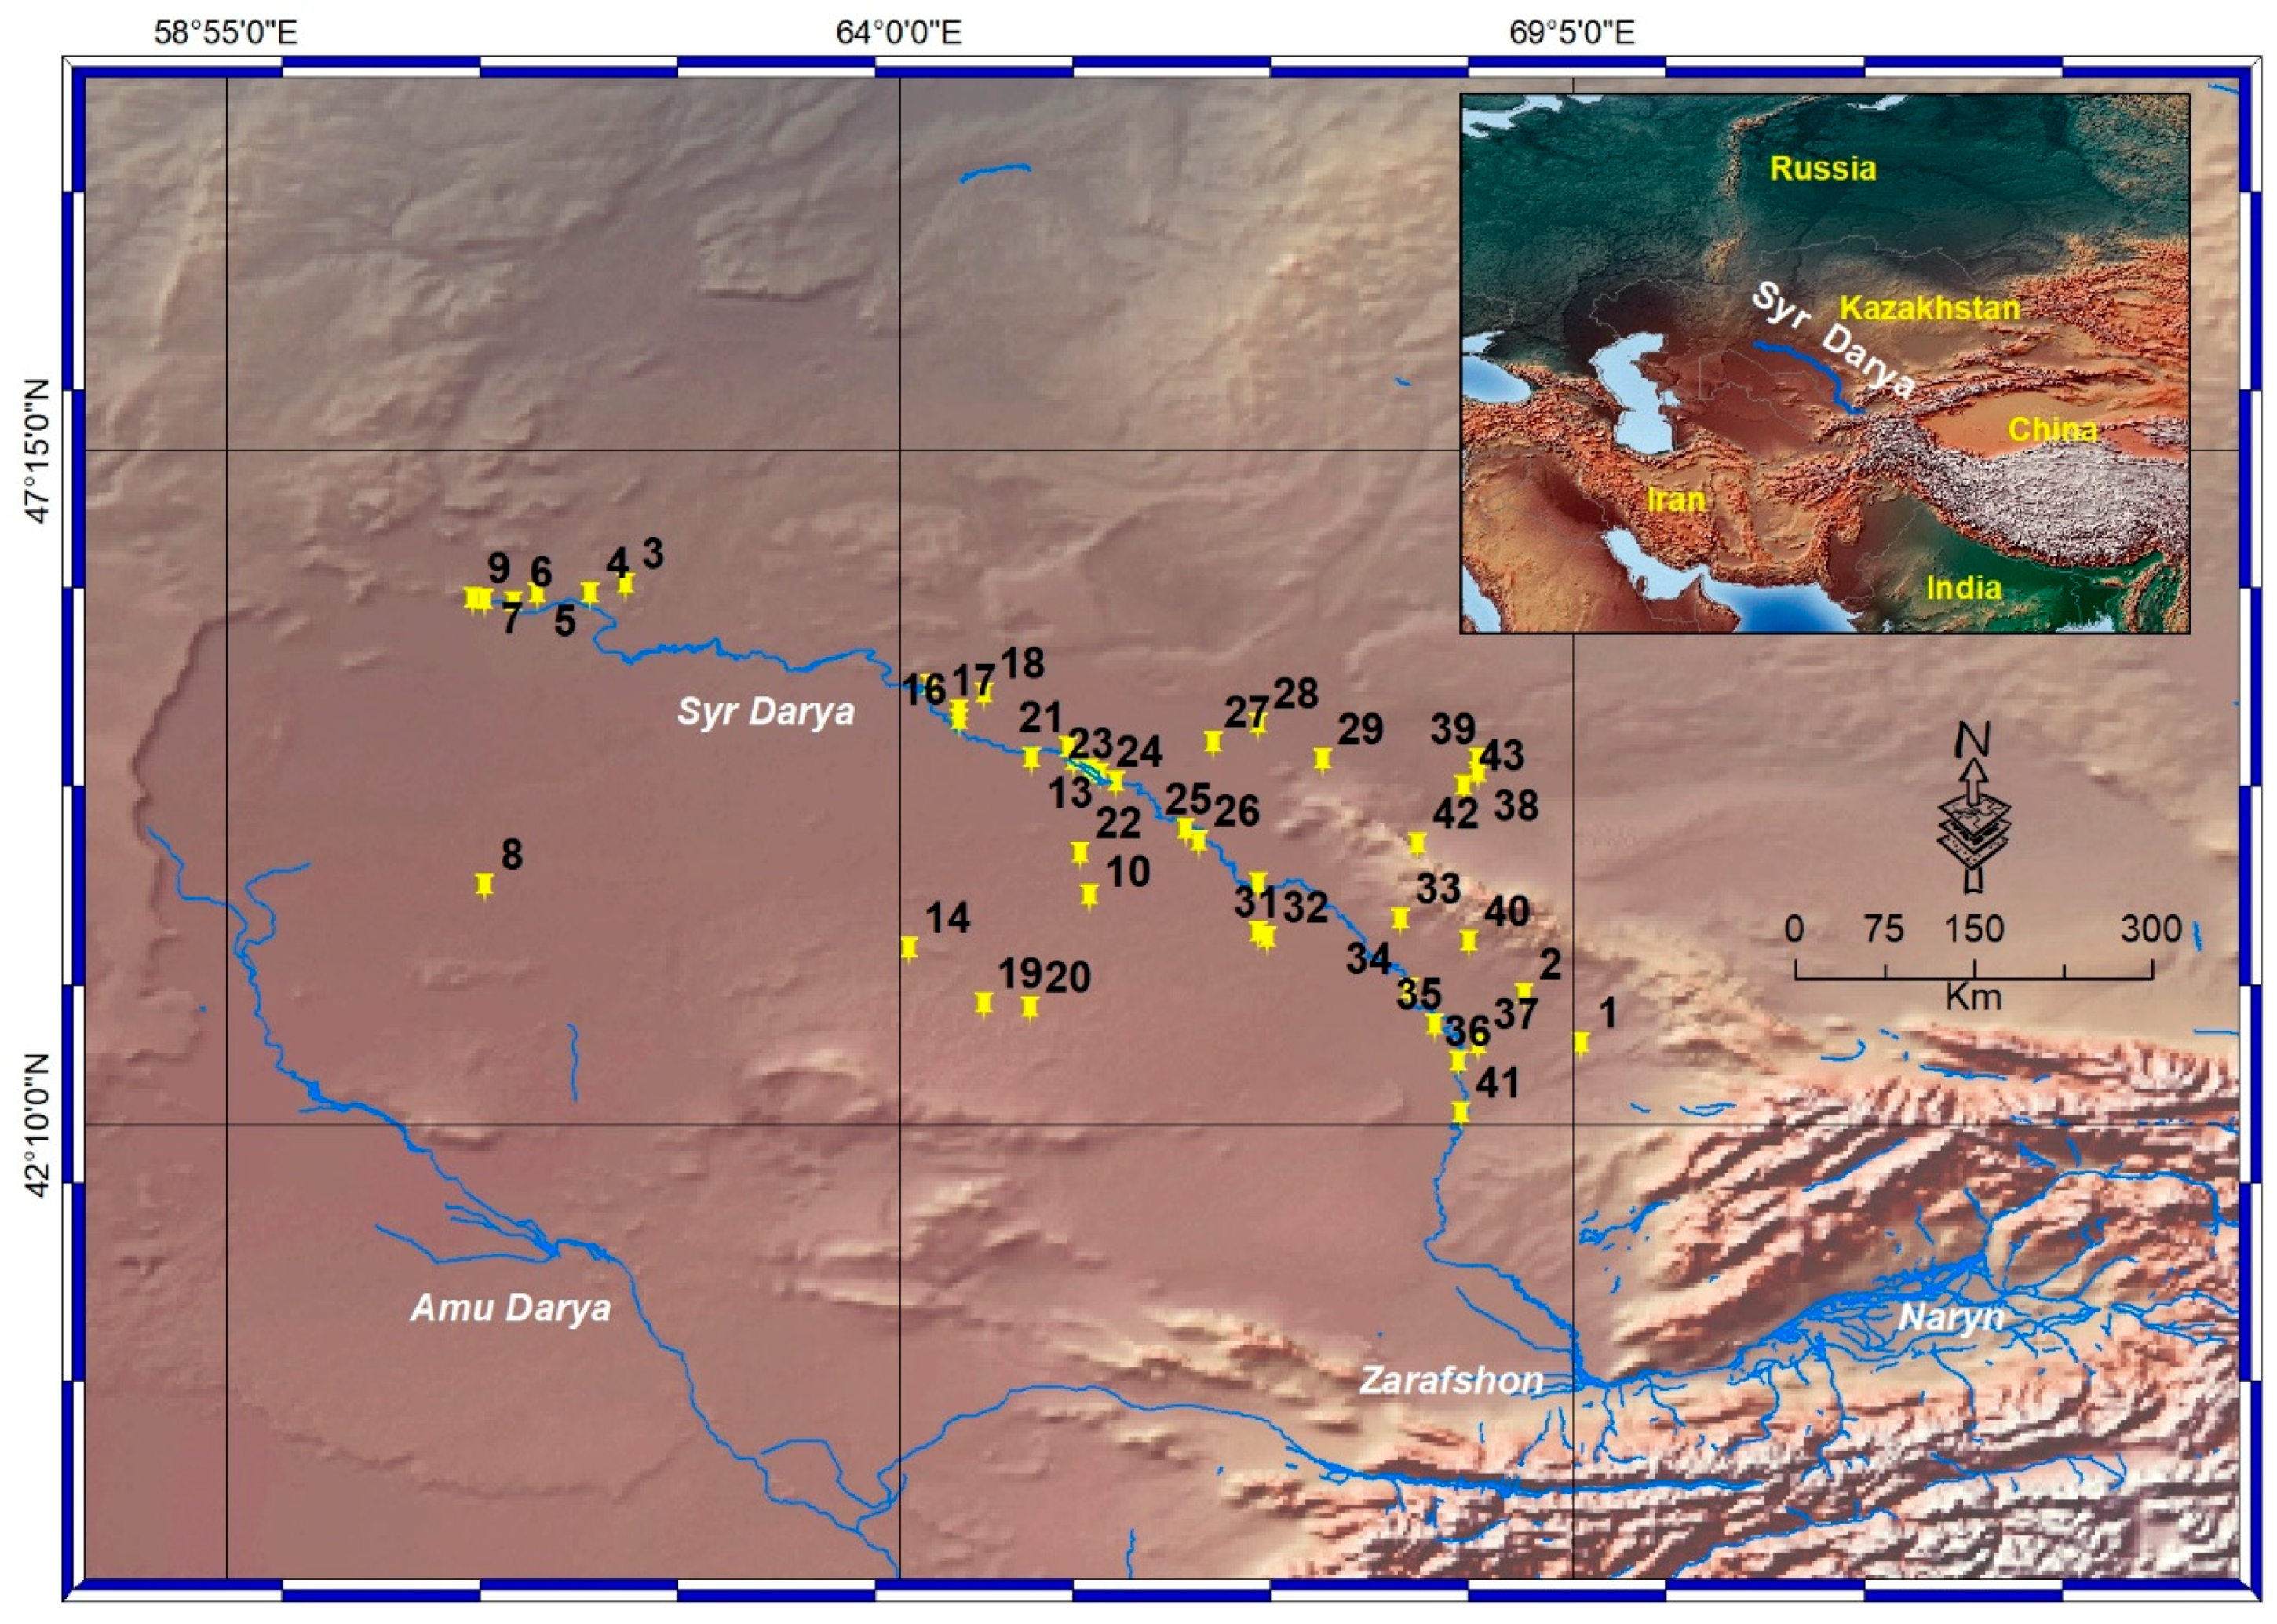
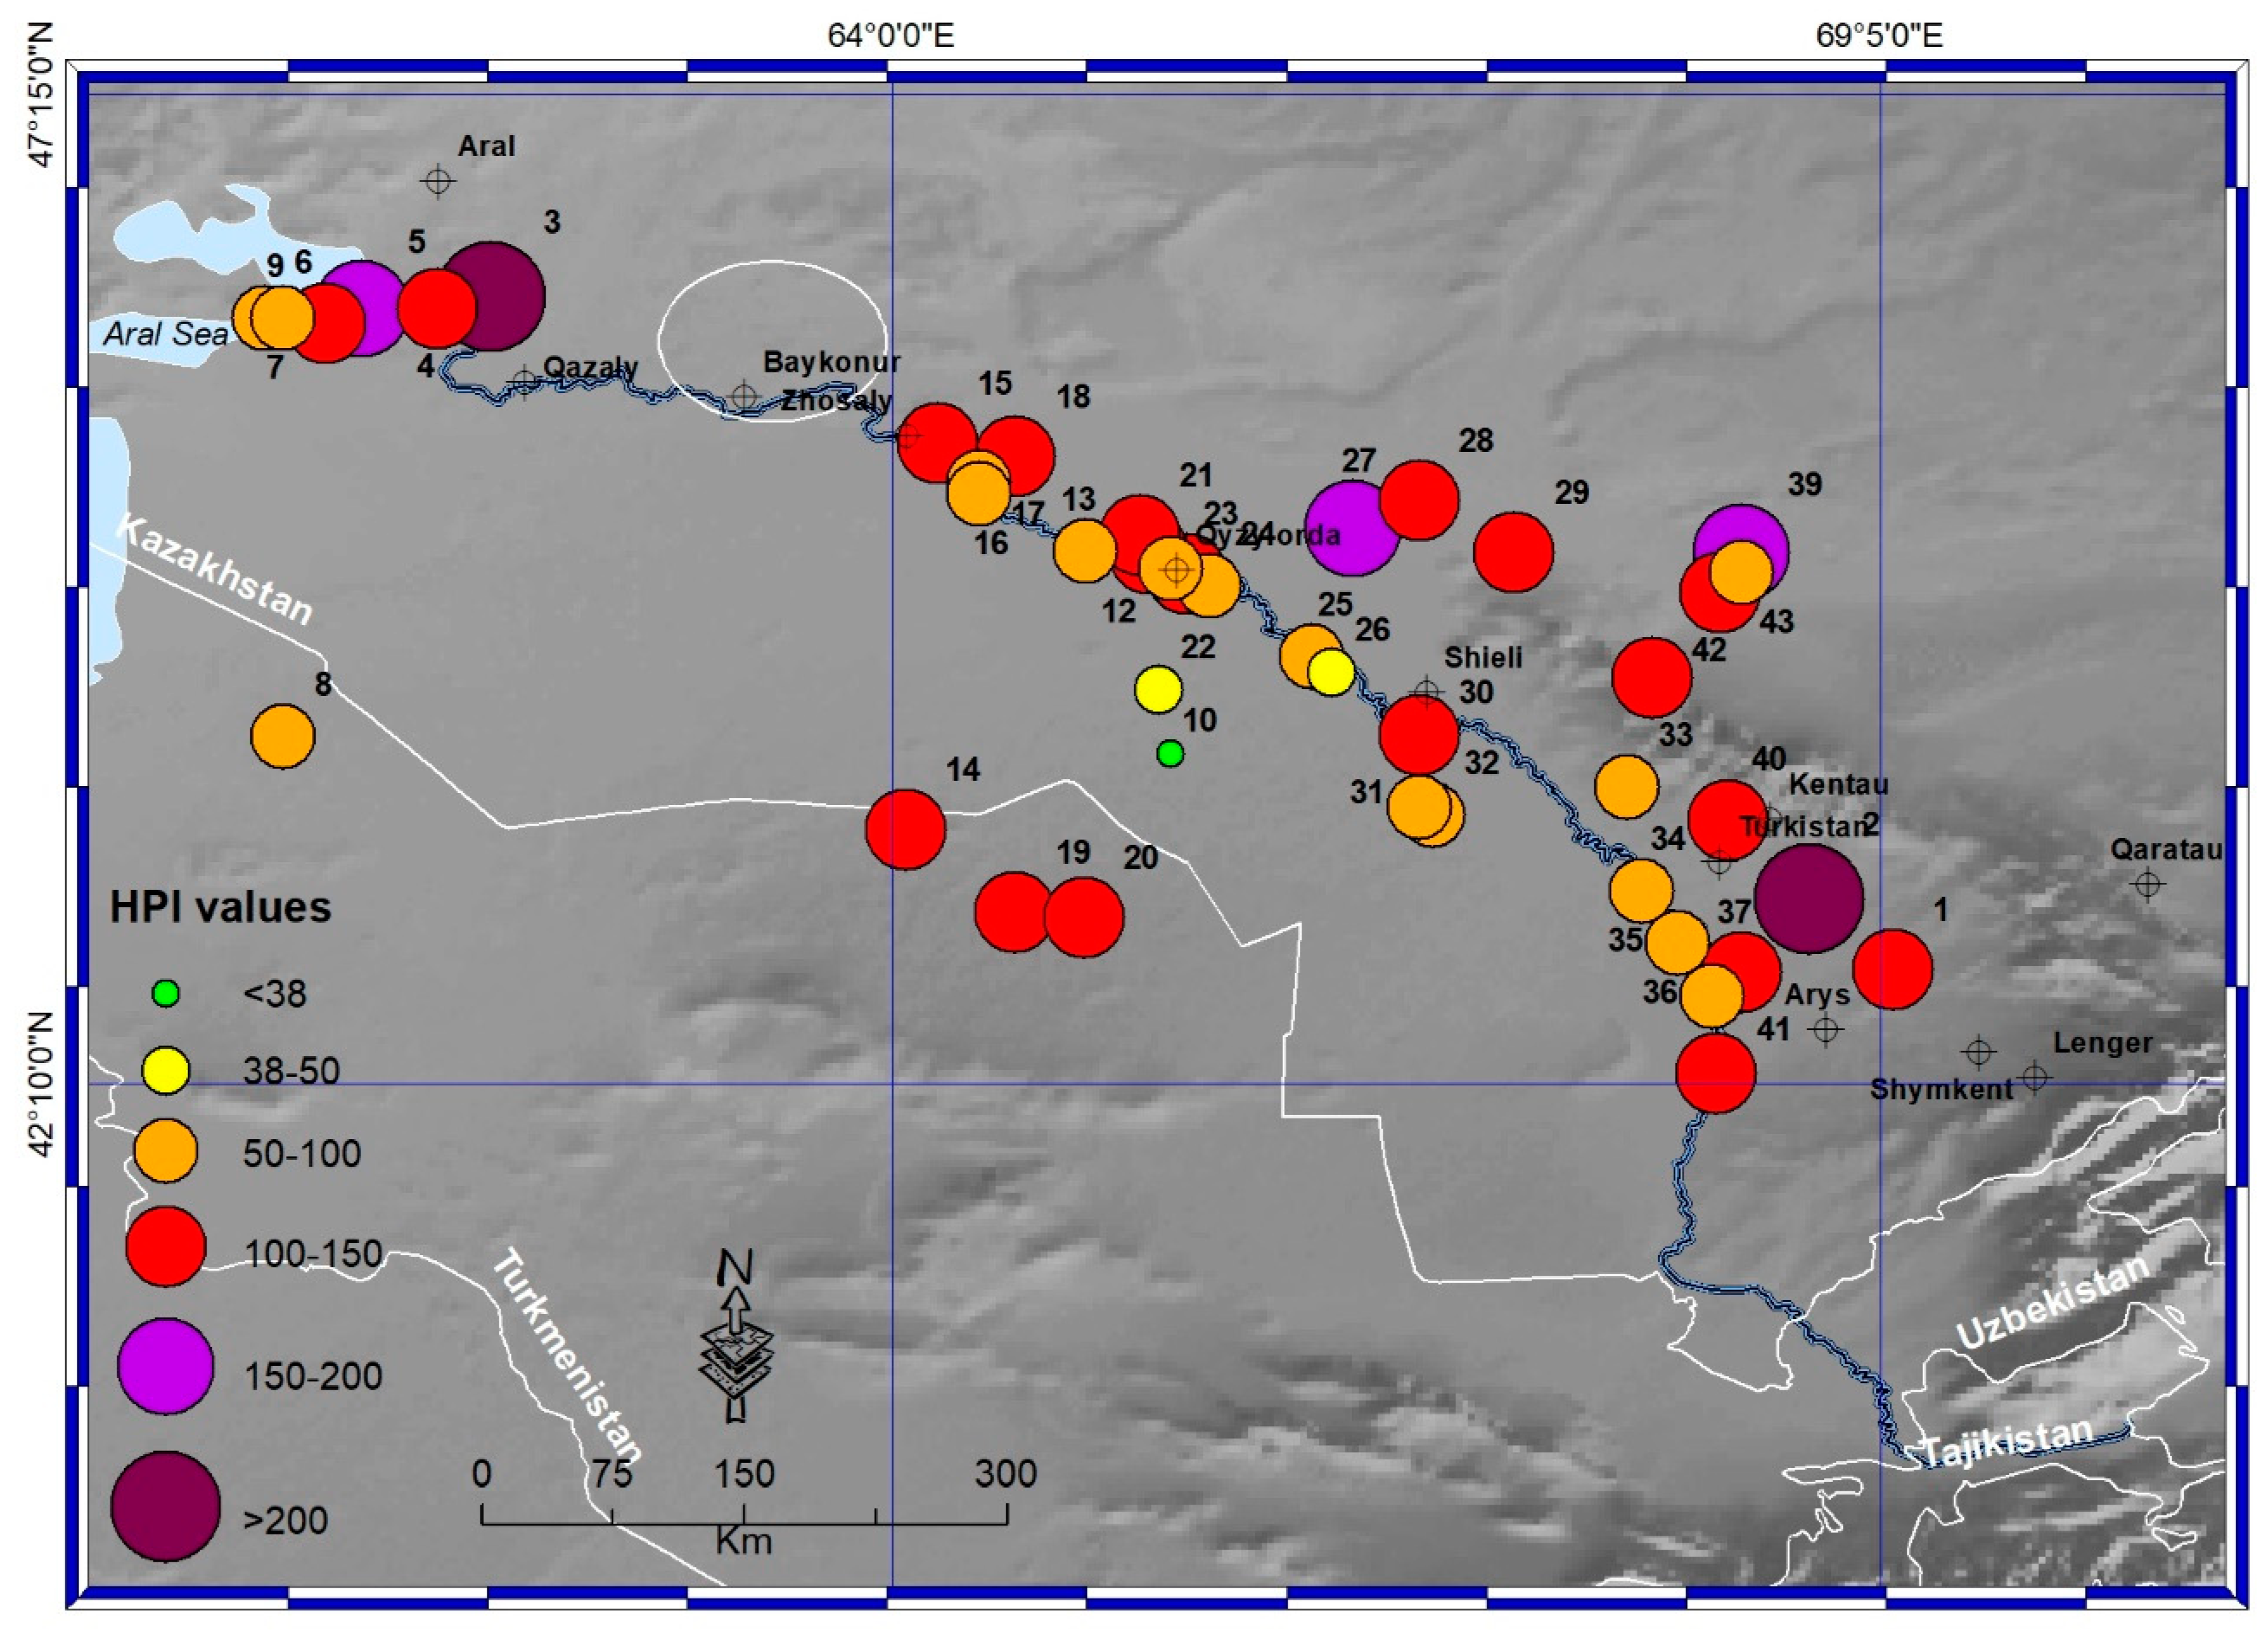
2.1. Study Area
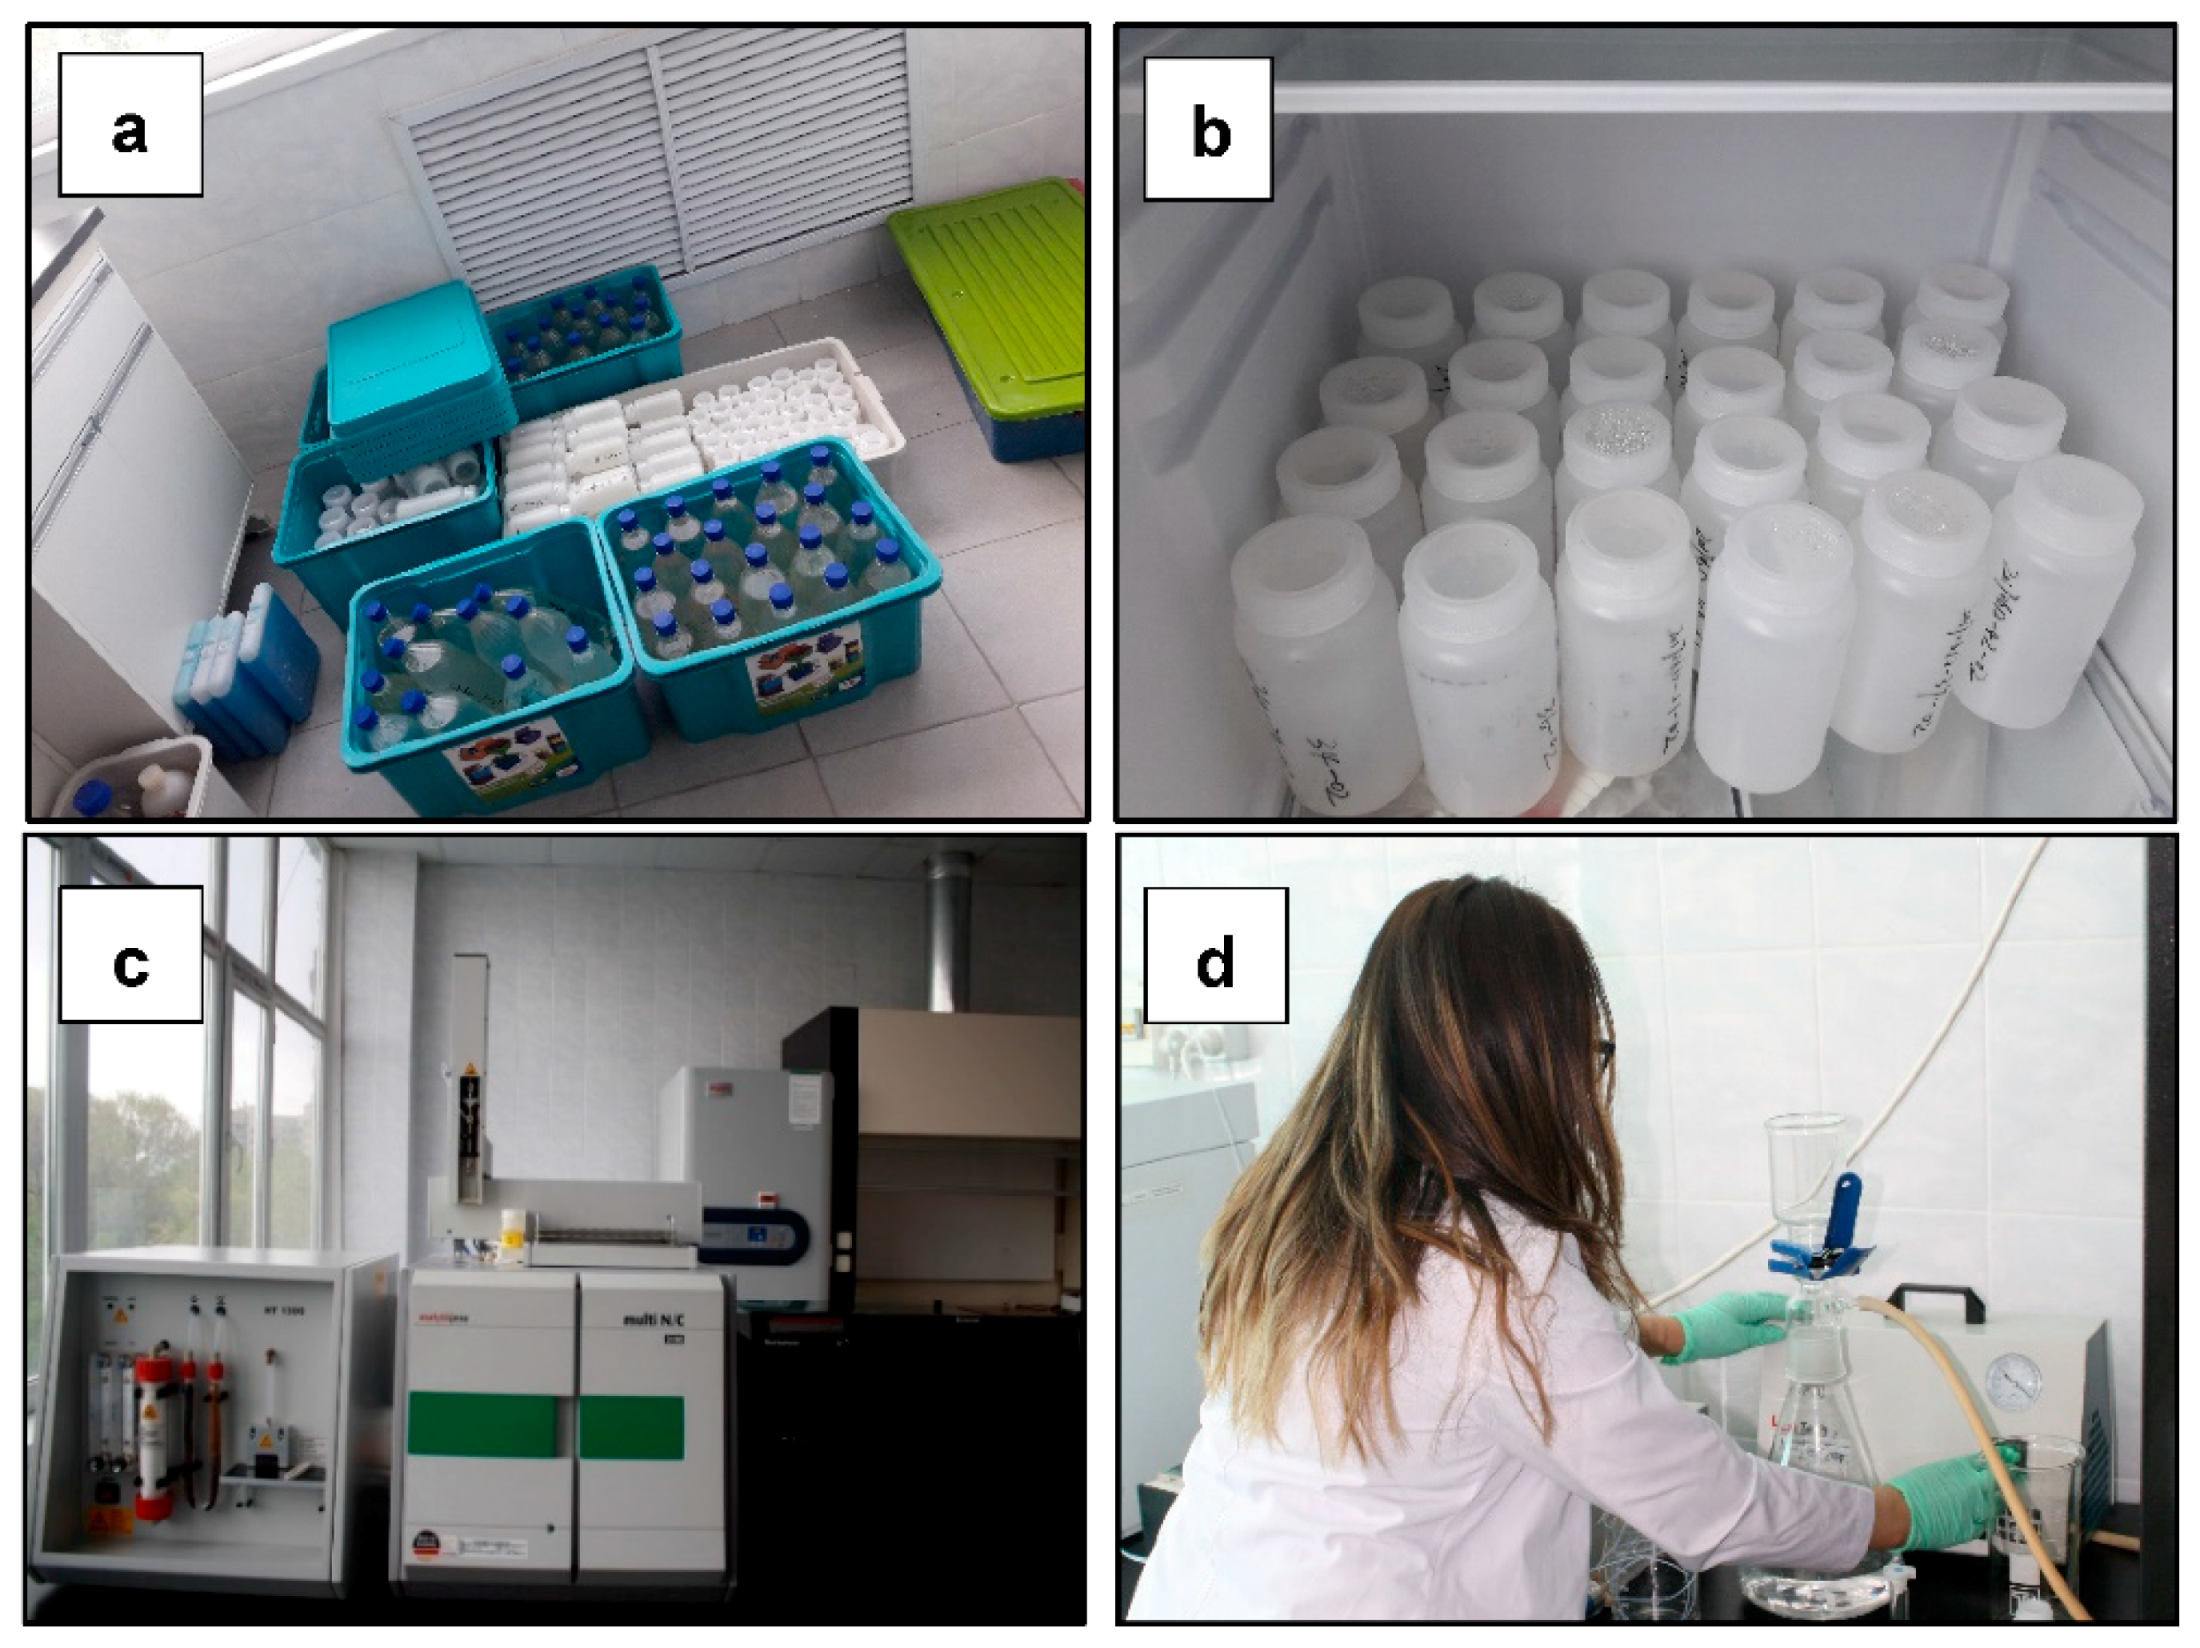
2.2. Water Sampling
2.3. Laboratory Analysis Procedures
2.4. Statistical Analysis
2.4.1. Descriptive Analysis and Multivariate Analyses
2.4.2. Heavy Metal Pollution Index (HPI)
3. Results
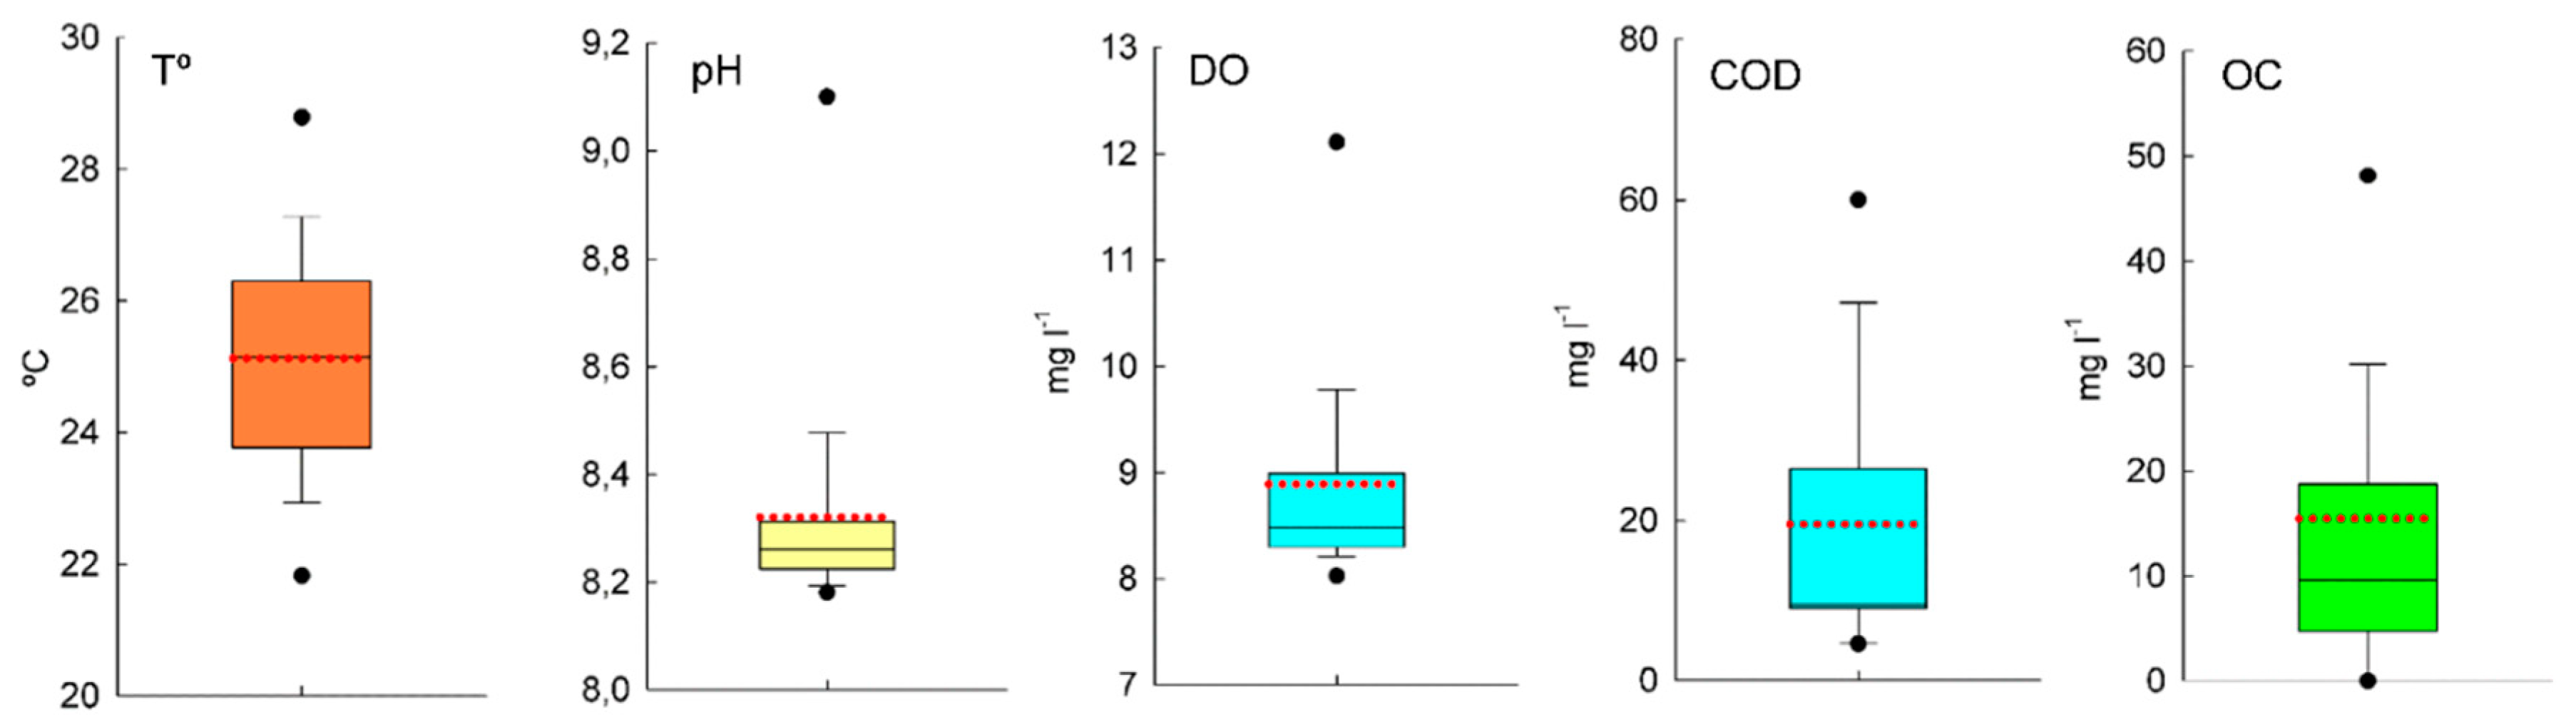
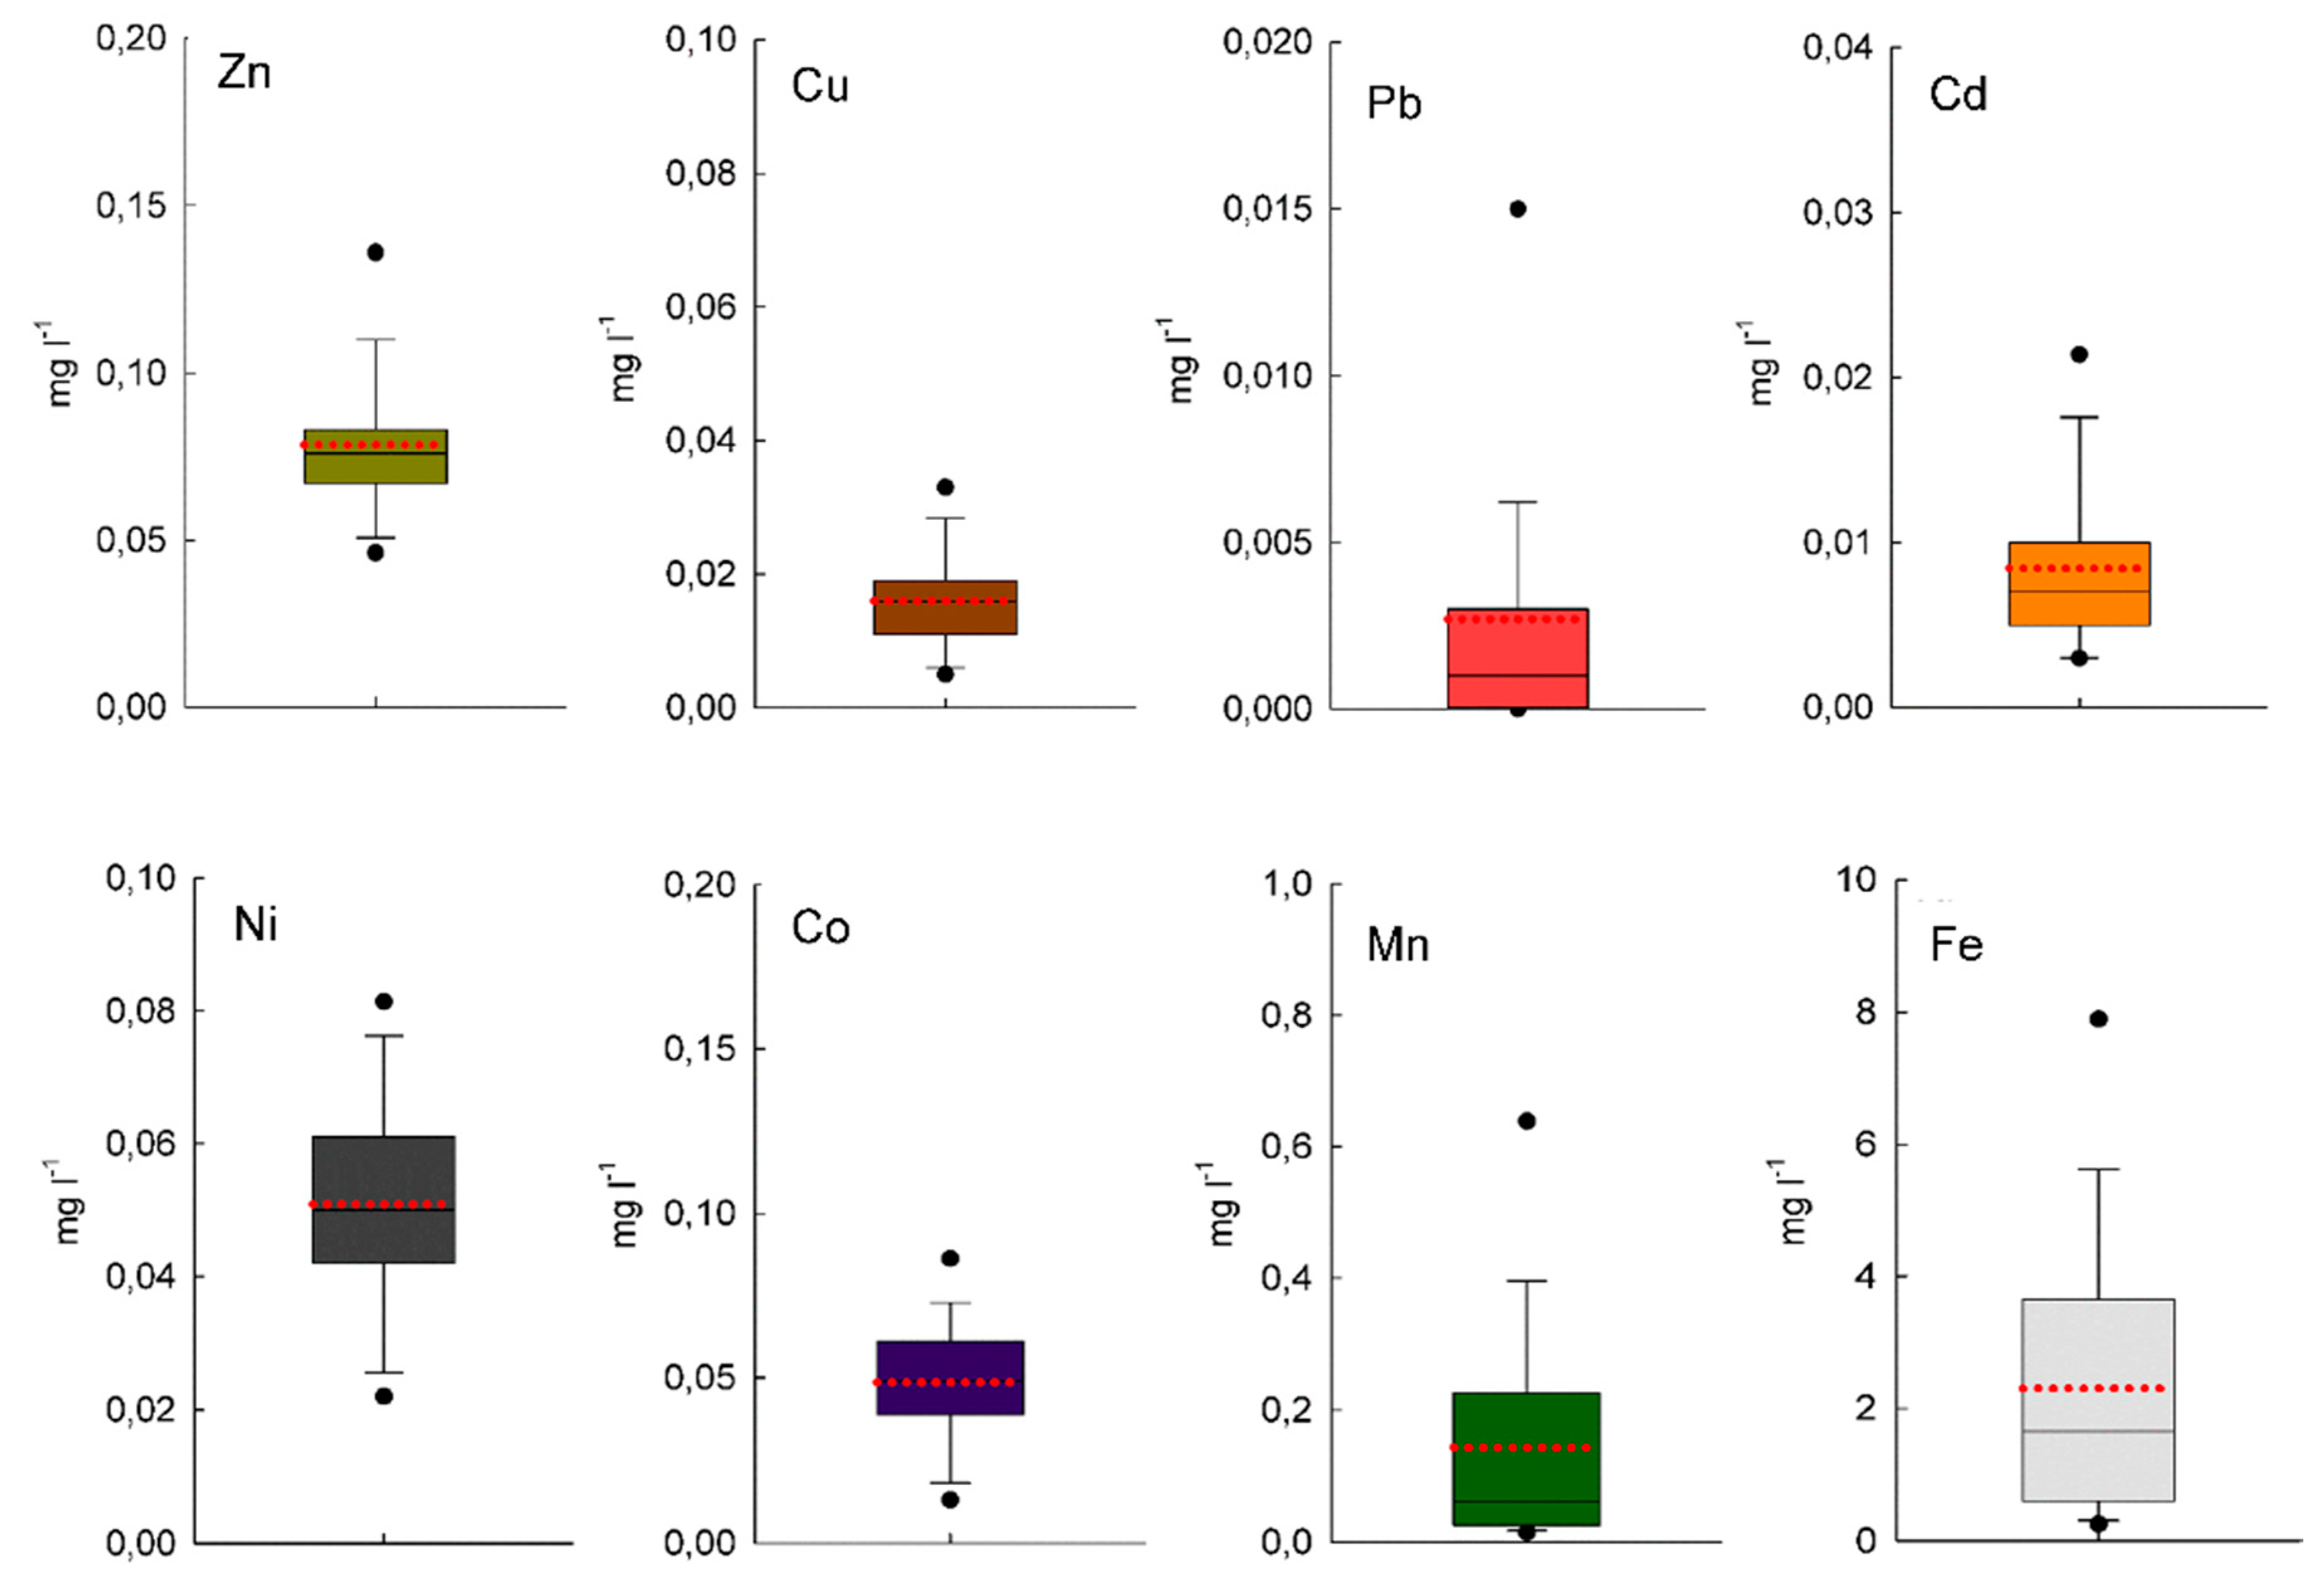
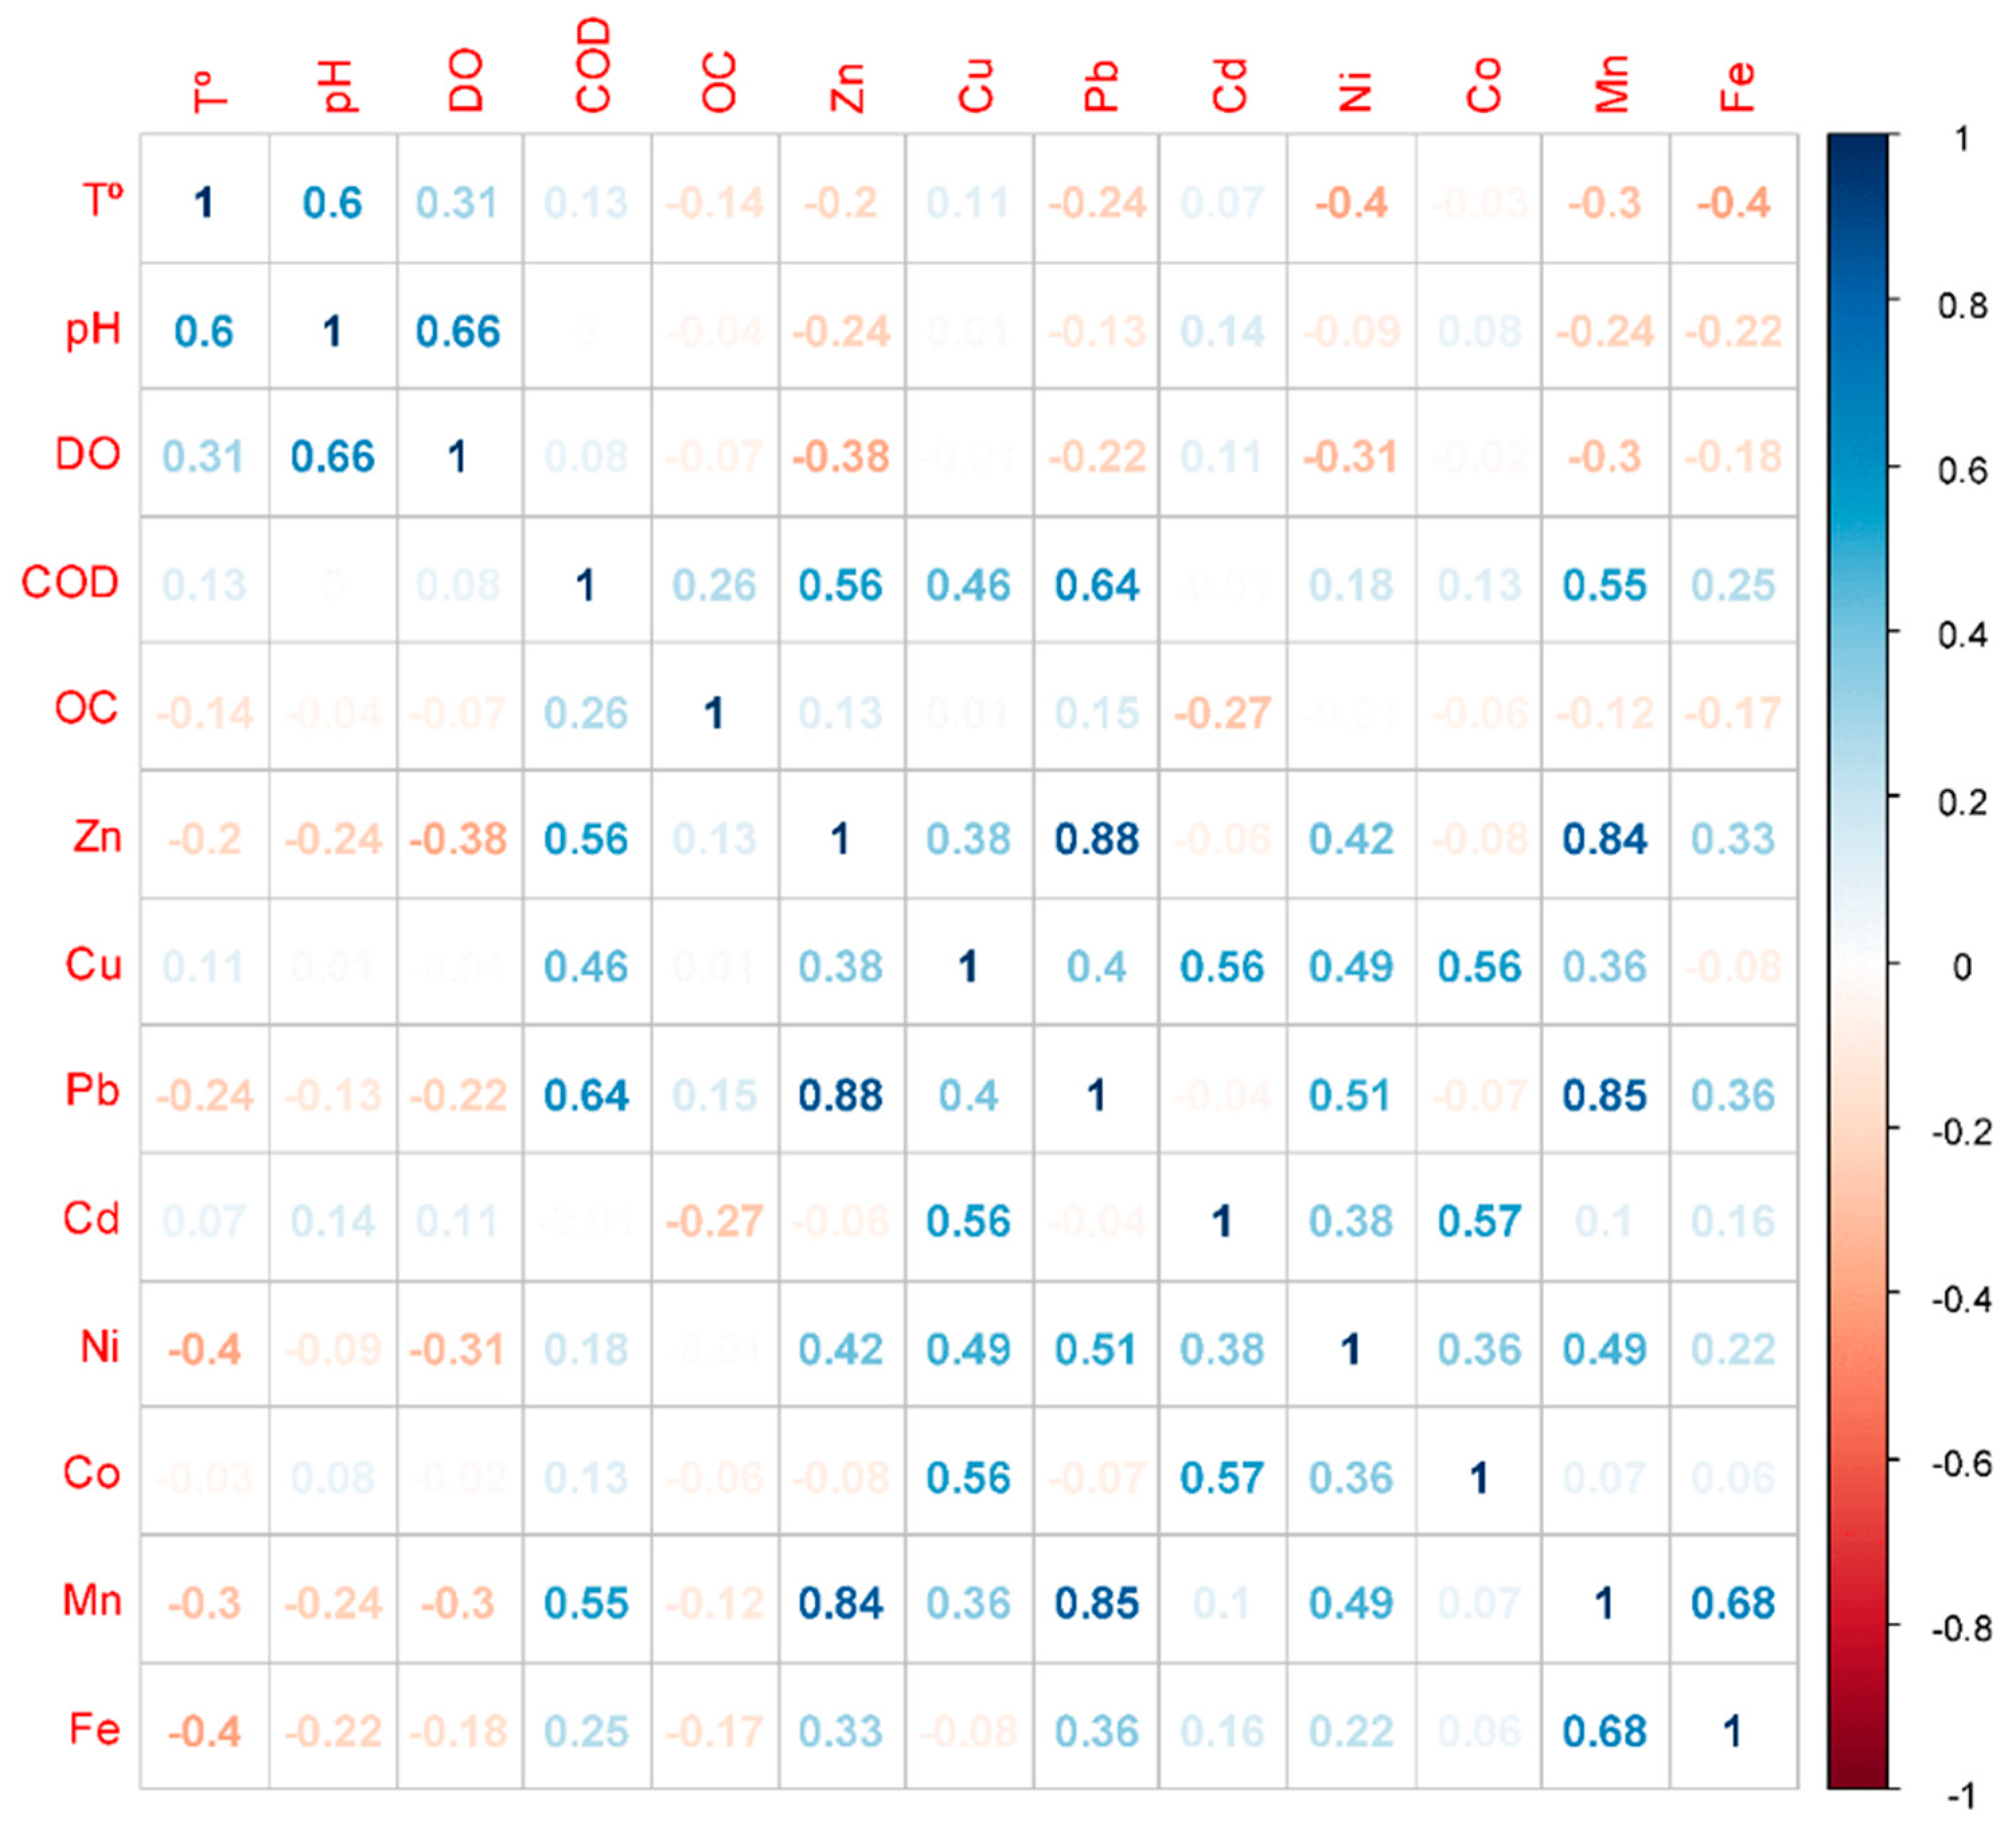
3.1. Descriptive Statistics of Physicochemical Parameters, Minerals and Heavy Metals
3.2. Locating the Hotspots of Water Pollution along the Syr Darya River in Kazakhstan
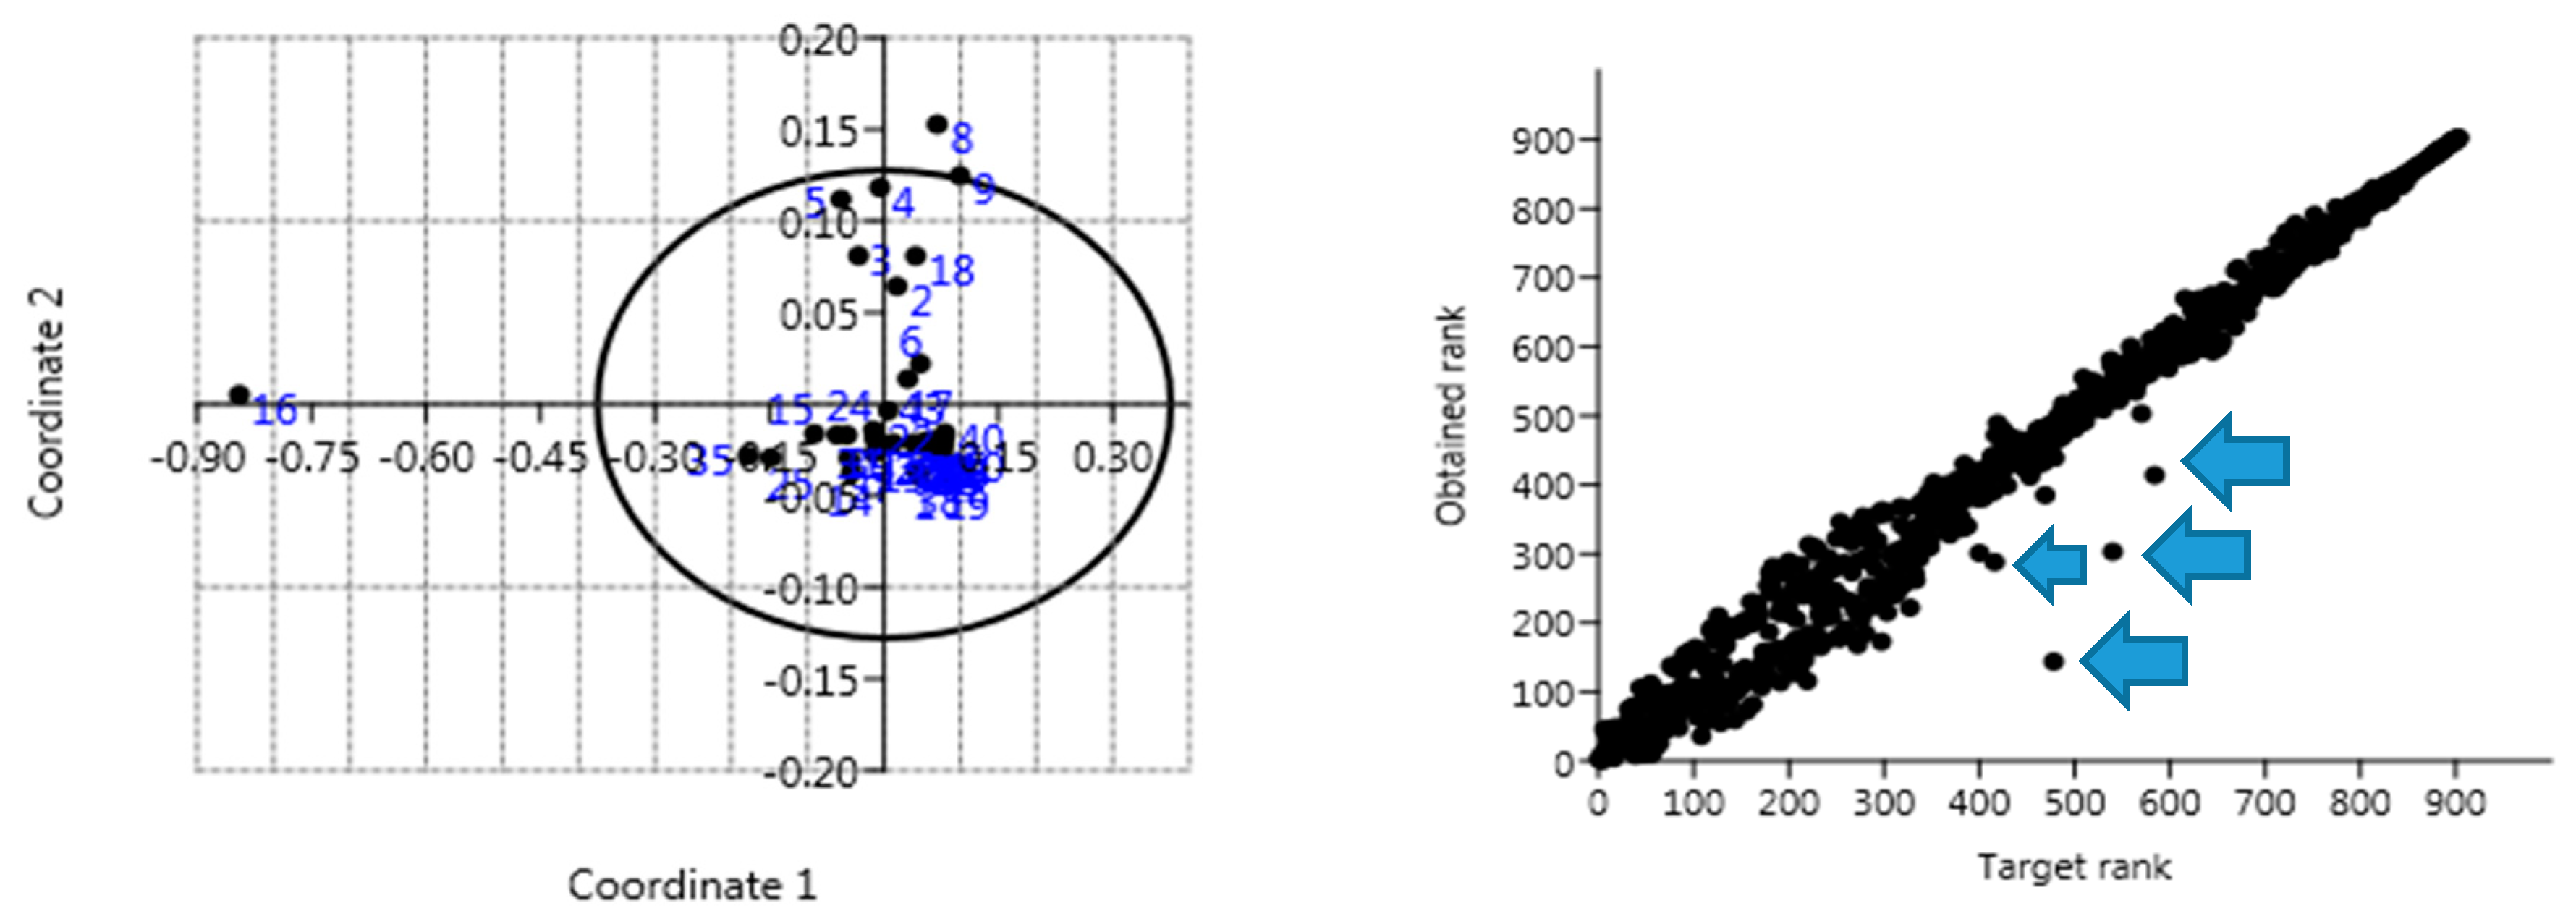
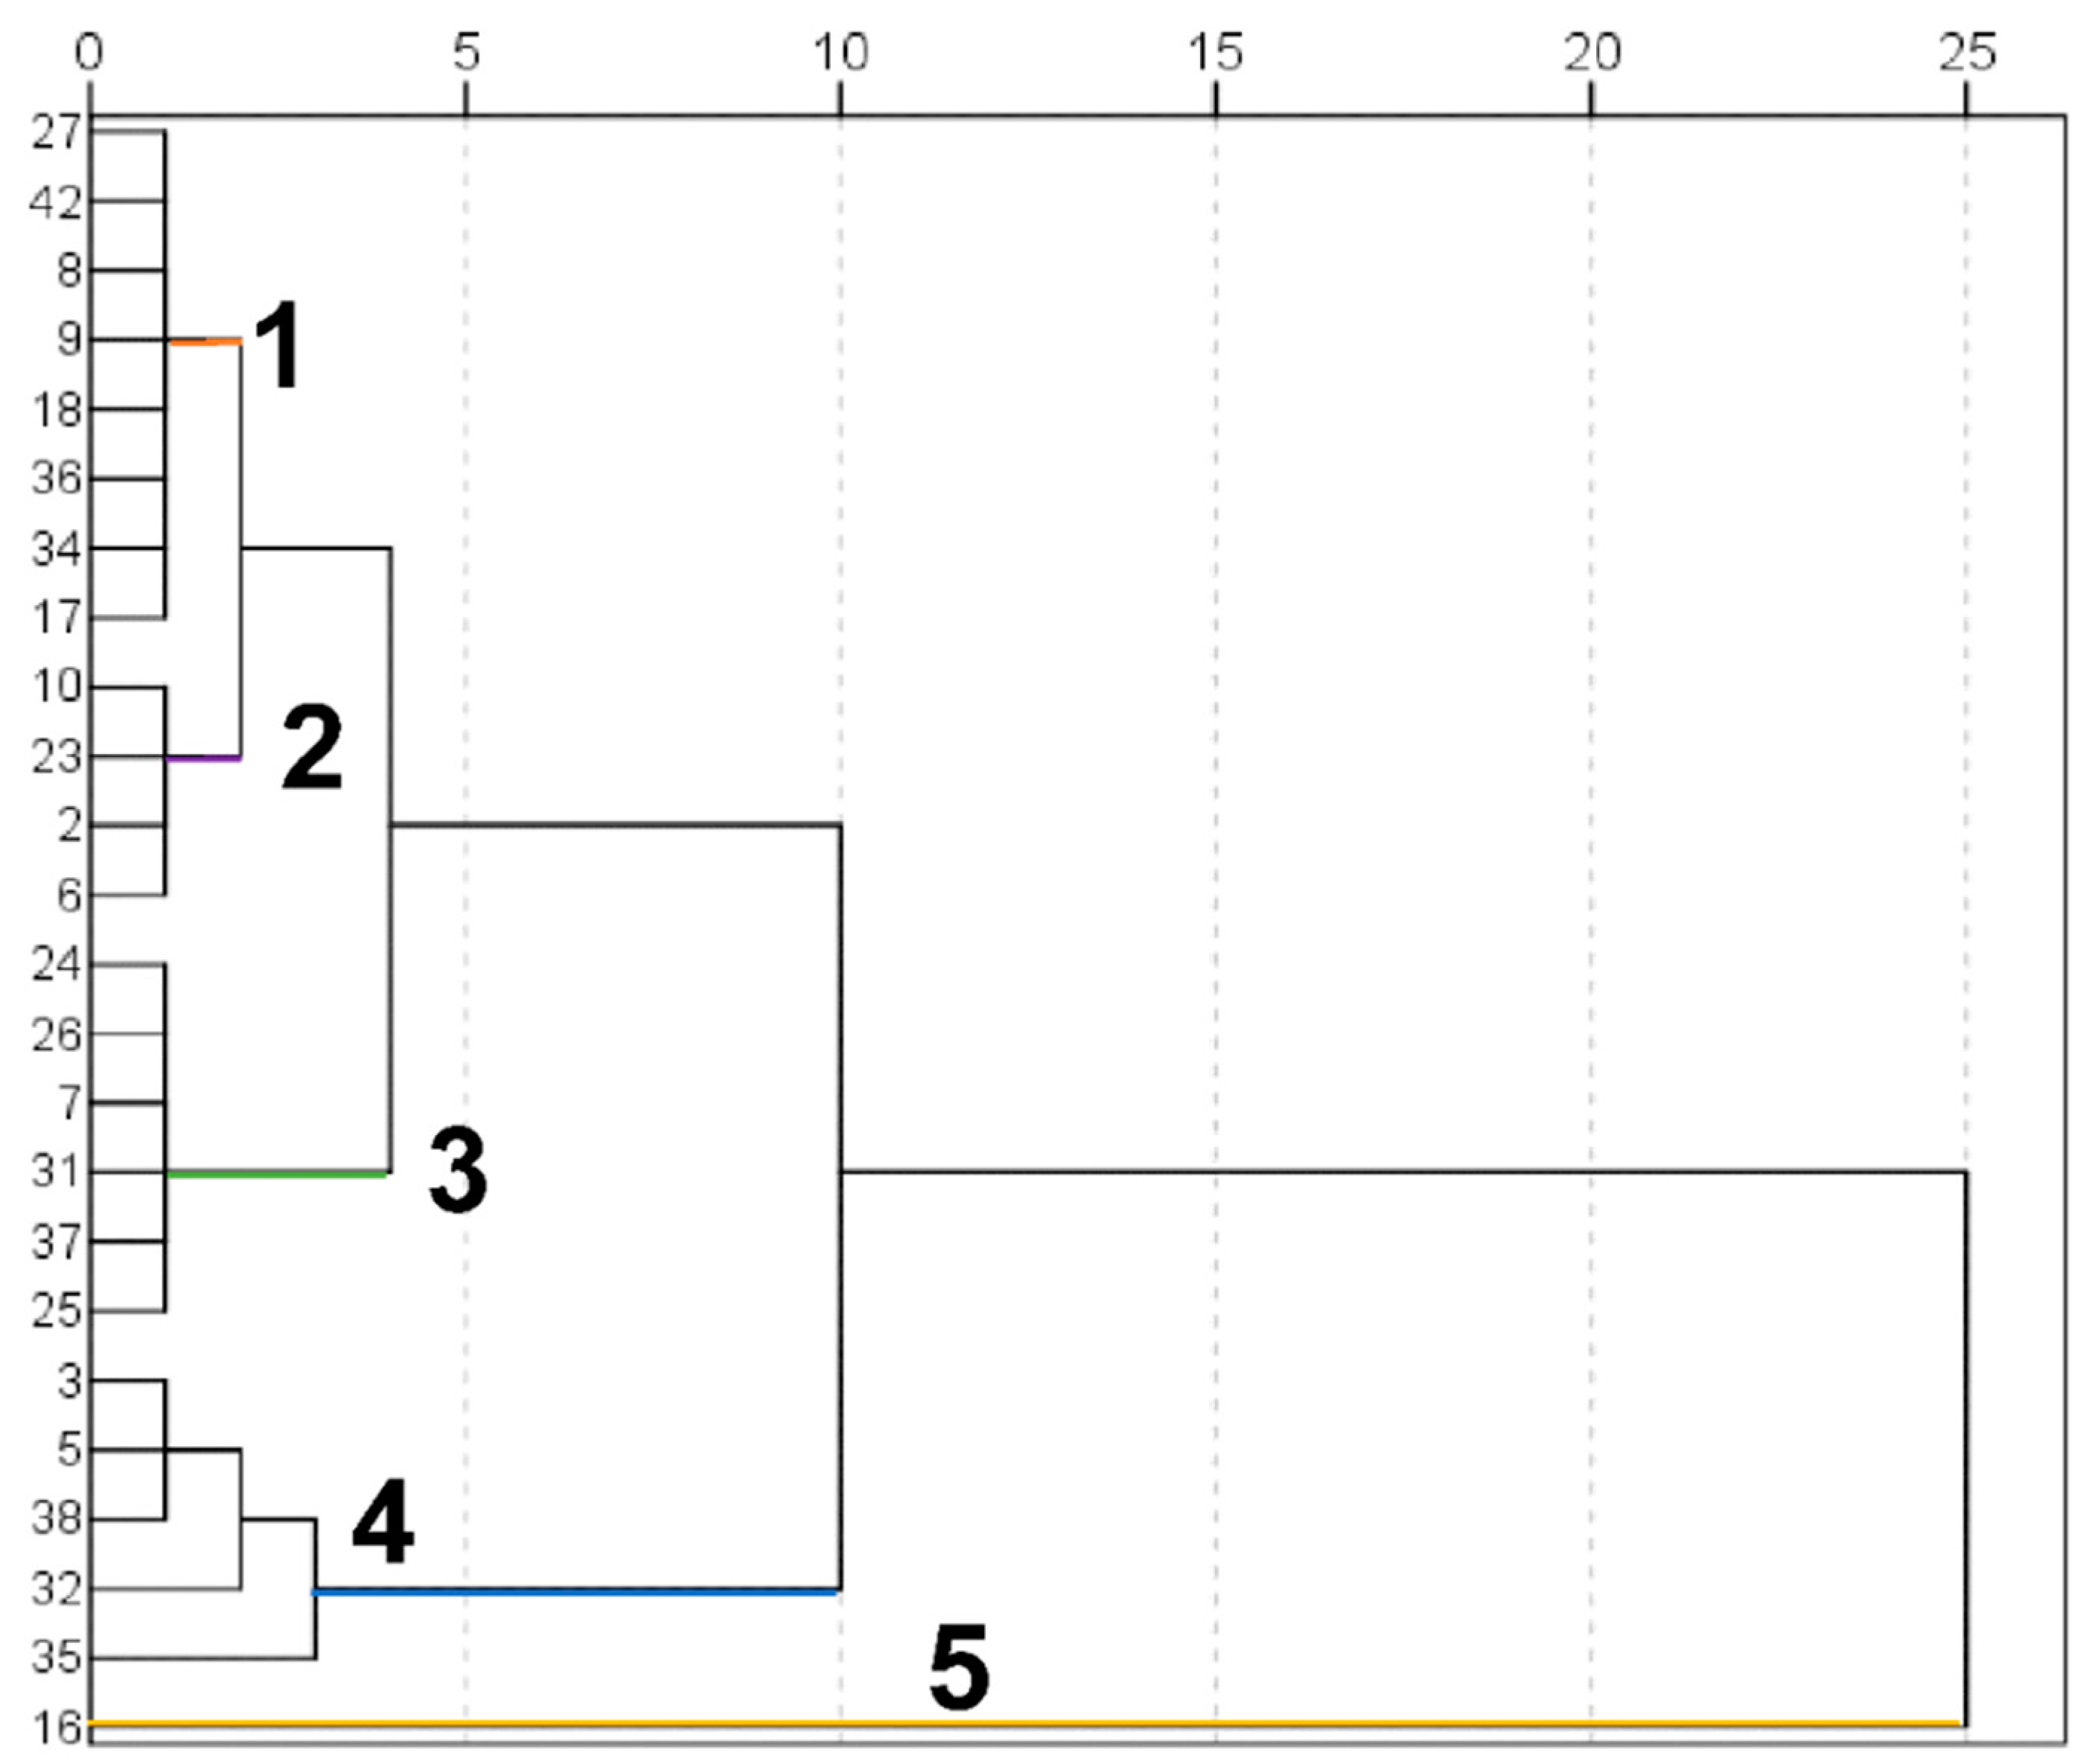
3.2.1. Non-Metric Multidimensional Scaling (NDMS) and Cluster Analysis (CA)
3.2.2. Heavy Metal Pollution Index (HPI)
3.3. Key Factors Affecting the Water Quality in the Syr Darya River
4. Discussion
5. Conclusions
Author Contributions
Funding
Acknowledgments
Conflicts of Interest
References
- Ahearn, D.S.; Sheibley, R.W.; Dahlgren, R.A.; Anderson, M.; Johnson, J.; Tate, K.W. Land use and land cover influence on water quality in the last free-flowing river draining the western Sierra Nevada, California. J. Hydrol. 2005, 313, 234–247. [Google Scholar] [CrossRef]
- Cosgrove, W.J.; Loucks, D.P. Water management: Current and future challenges and research directions. Water Resour. Res. 2015, 51, 4823–4839. [Google Scholar] [CrossRef] [Green Version]
- Godheja, J.; Sk, S.; Siddiqui, S.A.; Dr, M. Xenobiotic compounds present in soil and water: A review on remediation strategies. J. Environ. Anal. Toxicol. 2016, 6, 1–18. [Google Scholar] [CrossRef]
- Tepe, N.; Romero, M.; Bau, M. High-technology metals as emerging contaminants: Strong increase of anthropogenic gadolinium levels in tap water of Berlin, Germany, from 2009 to 2012. Appl. Geochem. 2014, 45, 191–197. [Google Scholar] [CrossRef]
- Ríos, J.M.; Lana, N.B.; Ciocco, N.F.; Covaci, A.; Barrera-Oro, E.; Moreira, E.; Altamirano, J.C. Implications of biological factors on accumulation of persistent organic pollutants in Antarctic notothenioid fish. Ecotoxicol. Environ. Saf. 2017, 145, 630–639. [Google Scholar] [CrossRef] [PubMed]
- Keesstra, S.; Geissen, V.; Mosse, K.; Piiranen, S.; Scudiero, E.; Leistra, M.; van Schaik, L. Soil as a filter for groundwater quality. Curr. Opin. Environ. Sustain. 2012, 4, 507–516. [Google Scholar] [CrossRef]
- Bean, T.G.; Rattner, B.A.; Lazarus, R.S.; Day, D.D.; Burket, S.R.; Brooks, B.W.; Haddad, S.P.; Bowerman, W.W. Pharmaceuticals in water, fish and osprey nestlings in Delaware River and Bay. Environ. Pollut. 2018, 232, 533–545. [Google Scholar] [CrossRef] [PubMed]
- Favas, P.J.C.; Pratas, J.; Rodrigues, N.; D’Souza, R.; Varun, M.; Paul, M.S. Metal(loid) accumulation in aquatic plants of a mining area: Potential for water quality biomonitoring and biogeochemical prospecting. Chemosphere 2018, 194, 158–170. [Google Scholar] [CrossRef] [PubMed]
- Ponsadailakshmi, S.; Sankari, S.G.; Prasanna, S.M.; Madhurambal, G. Evaluation of water quality suitability for drinking using drinking water quality index in Nagapattinam district, Tamil Nadu in Southern India. Groundw. Sustain. Dev. 2018, 6, 43–49. [Google Scholar] [CrossRef]
- Tao, Y.; Yu, J.; Liu, X.; Xue, B.; Wang, S. Factors affecting annual occurrence, bioaccumulation, and biomagnification of polycyclic aromatic hydrocarbons in plankton food webs of subtropical eutrophic lakes. Water Res. 2018, 132, 1–11. [Google Scholar] [CrossRef] [PubMed]
- Romero-Romero, S.; Herrero, L.; Fernández, M.; Gómara, B.; Acuña, J.L. Biomagnification of persistent organic pollutants in a deep-sea, temperate food web. Sci. Total Environ. 2017, 605–606, 589–597. [Google Scholar] [CrossRef] [PubMed]
- Cheng, Z.; Chen, L.-J.; Li, H.-H.; Lin, J.-Q.; Yang, Z.-B.; Yang, Y.-X.; Xu, X.-X.; Xian, J.-R.; Shao, J.-R.; Zhu, X.-M. Characteristics and health risk assessment of heavy metals exposure via household dust from urban area in Chengdu, China. Sci. Total Environ. 2018, 619–620, 621–629. [Google Scholar] [CrossRef] [PubMed]
- Wijesiri, B.; Deilami, K.; McGree, J.; Goonetilleke, A. Use of surrogate indicators for the evaluation of potential health risks due to poor urban water quality: A Bayesian Network approach. Environ. Pollut. 2018, 233, 655–661. [Google Scholar] [CrossRef] [PubMed]
- Mishra, B.K.; Regmi, R.K.; Masago, Y.; Fukushi, K.; Kumar, P.; Saraswat, C. Assessment of Bagmati river pollution in Kathmandu Valley: Scenario-based modeling and analysis for sustainable urban development. Sustain. Water Qual. Ecol. 2017, 9–10, 67–77. [Google Scholar] [CrossRef]
- Abdollahi, Z.; Kavian, A.; Sadeghi, S.H.R. Spatio-temporal changes of water quality variables in a highly disturbed river. Glob. J. Environ. Sci. Manag. 2017, 3, 243–256. [Google Scholar] [CrossRef]
- Angrill, S.; Petit-Boix, A.; Morales-Pinzón, T.; Josa, A.; Rieradevall, J.; Gabarrell, X. Urban rainwater runoff quantity and quality—A potential endogenous resource in cities? J. Environ. Manag. 2017, 189, 14–21. [Google Scholar] [CrossRef] [PubMed]
- Miller, J.D.; Hutchins, M. The impacts of urbanisation and climate change on urban flooding and urban water quality: A review of the evidence concerning the United Kingdom. J. Hydrol. Reg. Stud. 2017, 12, 345–362. [Google Scholar] [CrossRef]
- Kazhydromet (Казгидромет). Available online: https://kazhydromet.kz/kk (accessed on 3 September 2018).
- Ilyas, T. The Syr Darya River—New ecological disaster in Central Asia. Acta Sci. Pol. Hortorum Cultus 2015, 14, 135–140. [Google Scholar] [CrossRef]
- Wegerich, K.; Van Rooijen, D.; Soliev, I.; Mukhamedova, N.; Wegerich, K.; Van Rooijen, D.; Soliev, I.; Mukhamedova, N. Water security in the Syr Darya Basin. Water 2015, 7, 4657–4684. [Google Scholar] [CrossRef]
- Bekturganov, Z.; Tussupova, K.; Berndtsson, R.; Sharapatova, N.; Aryngazin, K.; Zhanasova, M.; Bekturganov, Z.; Tussupova, K.; Berndtsson, R.; Sharapatova, N.; et al. Water related health problems in Central Asia—A review. Water 2016, 8, 219. [Google Scholar] [CrossRef]
- Dukhovny, V.; Litvak, L. Effect of irrigation on Syr Darya water regime and water quality. In Arid Land Irrigation in Developing Countries; Worthington, E.B., Ed.; Elsevier Ltd.: Pergamon, Turkey, 1977; pp. 265–275. ISBN 978-0-08-021588-4. [Google Scholar]
- Soliev, I.; Wegerich, K.; Kazbekov, J.; Soliev, I.; Wegerich, K.; Kazbekov, J. The costs of benefit sharing: Historical and institutional analysis of shared water development in the Ferghana Valley, the Syr Darya Basin. Water 2015, 7, 2728–2752. [Google Scholar] [CrossRef]
- Sorg, A.; Mosello, B.; Shalpykova, G.; Allan, A.; Hill Clarvis, M.; Stoffel, M. Coping with changing water resources: The case of the Syr Darya river basin in Central Asia. Environ. Sci. Policy 2014, 43, 68–77. [Google Scholar] [CrossRef]
- Popov, Y.M.; Pavlichenko, L.M.; Bogachev, V.P. Investigation of river pollution Syr Darya for the construction of a comprehensive water quality assessment. Hydrometeorol. Ecol. 1996, 2, 207–223. [Google Scholar]
- Carral, E.; Villares, R.; Puente, X.; Carballeira, A. Influence of watershed lithology on heavy metal levels in estuarine sediments and organisms in Galicia (North-West Spain). Mar. Pollut. Bull. 1995, 30, 604–608. [Google Scholar] [CrossRef]
- Conversi, A.; McGowan, J.A. Variability of water column transparency, volume flow and suspended solids near San Diego sewage outfall (California): 15 years of data. Chem. Ecol. 1992, 6, 133–147. [Google Scholar] [CrossRef]
- Shrestha, N.K.; Leta, O.T.; Bauwens, W. Development of RWQM1-based integrated water quality model in OpenMI with application to the River Zenne, Belgium. Hydrol. Sci. J. 2017, 62, 774–799. [Google Scholar] [CrossRef]
- Van Griensven, A.; Vandenberghe, V.; Bols, J.; De Pauw, N.; Goethals, P.; Meirlaen, J.; Vanrolleghem, P.A.; Van Vooren, L.; Bauwens, W. Experience and organisation of automated measuring stations for river water quality monitoring. In Proceedings of the 1st World Congress of the International Water Association, Paris, France, 3–7 July 2000. [Google Scholar]
- Abou Zakhem, B.; Hafez, R. Heavy metal pollution index for groundwater quality assessment in Damascus Oasis, Syria. Environ. Earth Sci 2015, 73, 6591–6600. [Google Scholar] [CrossRef]
- Reza, R.; Singh, G. Heavy metal contamination and its indexing approach for river water. Int. J. Environ. Sci. Technol. 2010, 7, 785–792. [Google Scholar] [CrossRef] [Green Version]
- WHO. Guidelines for Drinkingwater Quality; World Health Organisation: Geneva, Switzerland, 2011; p. 564. [Google Scholar]
- Arable Land (Hectares per Person) Data. Available online: https://data.worldbank.org/indicator/AG.LND.ARBL.HA.PC (accessed on 14 September 2018).
- Żelazny, M.; Rajwa-Kuligiewicz, A.; Bojarczuk, A.; Pęksa, Ł. Water temperature fluctuation patterns in surface waters of the Tatra Mts., Poland. J. Hydrol. 2018, 564, 824–835. [Google Scholar] [CrossRef]
- Ouellet-Proulx, S.; Chimi Chiadjeu, O.; Boucher, M.-A.; St-Hilaire, A. Assimilation of water temperature and discharge data for ensemble water temperature forecasting. J. Hydrol. 2017, 554, 342–359. [Google Scholar] [CrossRef]
- Vliet, M.T.H.; van Ludwig, F.; Zwolsman, J.J.G.; Weedon, G.P.; Kabat, P. Global river temperatures and sensitivity to atmospheric warming and changes in river flow. Water Resour. Res. 2011, 47. [Google Scholar] [CrossRef] [Green Version]
- Pierre, S.; Tarnowska, K.; Hachfi, L.; Coupé, S.; Simide, R.; Couvray, S.; Garnier, C.; Grimaldi, M.; Richard, S.; Gaillard, S. Effects of water temperature increase and heavy metals contamination on WAP65 gene expression in sea bass (Dicentrarchus labrax) liver. Cell. Mol. Biol. 2011, 57, 1614–1622. [Google Scholar]
- Li, H.; Shi, A.; Li, M.; Zhang, X. Effect of pH, Temperature, Dissolved Oxygen, and Flow Rate of Overlying Water on Heavy Metals Release from Storm Sewer Sediments. Available online: https://www.hindawi.com/journals/jchem/2013/434012/ (accessed on 14 September 2018).
- Fritioff, A.; Kautsky, L.; Greger, M. Influence of temperature and salinity on heavy metal uptake by submersed plants. Environ. Pollut. 2005, 133, 265–274. [Google Scholar] [CrossRef] [PubMed]
- Andersson, J.; Oudin, A.; Sundström, A.; Forsberg, B.; Adolfsson, R.; Nordin, M. Road traffic noise, air pollution, and risk of dementia—Results from the Betula project. Environ. Res. 2018, 166, 334–339. [Google Scholar] [CrossRef] [PubMed]
- Ermolin, M.S.; Fedotov, P.S.; Ivaneev, A.I.; Karandashev, V.K.; Fedyunina, N.N.; Burmistrov, A.A. A contribution of nanoscale particles of road-deposited sediments to the pollution of urban runoff by heavy metals. Chemosphere 2018, 210, 65–75. [Google Scholar] [CrossRef] [PubMed]
- Kudaibergenova, D.T. “My Silk Road to You”: Re-imagining routes, roads, and geography in contemporary art of “Central Asia”. J. Eurasian Stud. 2017, 8, 31–43. [Google Scholar] [CrossRef]
- Costa, S.P.F.; Pereira, S.A.P.; Pinto, P.C.A.G.; Araujo, A.R.T.S.; Passos, M.L.C.; Saraiva, M.L.M.F.S. Environmental impact of ionic liquids: Automated evaluation of the chemical oxygen demand of photochemically degraded compounds. Chemphyschem 2017, 18, 1351–1357. [Google Scholar] [CrossRef] [PubMed]
- Van den Brand, T.P.H.; Roest, K.; Chen, G.-H.; Brdjanovic, D.; van Loosdrecht, M.C.M. Effects of chemical oxygen demand, nutrients and salinity on sulfate-reducing bacteria. Environ. Eng. Sci. 2015, 32, 858–864. [Google Scholar] [CrossRef]
- Erdinger, L.; Hollert, H.; Eckl, P. Aral Sea: An ecological disaster zone with impact on human health. In Encyclopedia of Environmental Health; Nriagu, J.O., Ed.; Elsevier: Burlington, ON, Canada, 2011; pp. 136–144. ISBN 978-0-444-52272-6. [Google Scholar]
- Indoitu, R.; Kozhoridze, G.; Batyrbaeva, M.; Vitkovskaya, I.; Orlovsky, N.; Blumberg, D.; Orlovsky, L. Dust emission and environmental changes in the dried bottom of the Aral Sea. Aeolian Res. 2015, 17, 101–115. [Google Scholar] [CrossRef]
- Jensen, S.; Mazhitova, Z.; Zetterström, R. Environmental pollution and child health in the Aral Sea region in Kazakhstan. Sci. Total Environ. 1997, 206, 187–193. [Google Scholar] [CrossRef]
- McDermid, S.S.; Winter, J. Anthropogenic forcings on the climate of the Aral Sea: A regional modeling perspective. Anthropocene 2017, 20, 48–60. [Google Scholar] [CrossRef]
- Lathuillière, M.; Coe, M.; Castanho, A.; Graesser, J.; Johnson, M.; Lathuillière, M.J.; Coe, M.T.; Castanho, A.; Graesser, J.; Johnson, M.S. Evaluating water use for agricultural intensification in southern Amazonia using the water footprint sustainability assessment. Water 2018, 10, 349. [Google Scholar] [CrossRef]
- Pulido, M.; Barrena-González, J.; Badgery, W.; Rodrigo-Comino, J.; Cerdà, A. Sustainable grazing. Curr. Opin. Environ. Sci. Health 2018, 5, 42–46. [Google Scholar] [CrossRef]
- Nicu, I.; Nicu, I.C. Is overgrazing really influencing soil erosion? Water 2018, 10, 1077. [Google Scholar] [CrossRef]
- Rakkar, M.K.; Blanco-Canqui, H.; Drijber, R.A.; Drewnoski, M.E.; MacDonald, J.C.; Klopfenstein, T. Impacts of cattle grazing of corn residues on soil properties after 16 years. Soil Sci. Soc. Am. J. 2017, 81, 414–424. [Google Scholar] [CrossRef]
- Roche, L.M.; Kromschroeder, L.; Atwill, E.R.; Dahlgren, R.A.; Tate, K.W. Water quality conditions associated with cattle grazing and recreation on national forest lands. PLoS ONE 2013, 8, e68127. [Google Scholar] [CrossRef] [PubMed]
- Hubbard, R.K.; Newton, G.L.; Hill, G.M. Water quality and the grazing animal. J. Anim. Sci. 2004, 82 E-Suppl, E255–E263. [Google Scholar] [CrossRef]
- Gholizadeh, M.H.; Melesse, A.M.; Reddi, L. A comprehensive review on water quality parameters estimation using remote sensing techniques. Sensors 2016, 16, 1298. [Google Scholar] [CrossRef] [PubMed]
- Populus, J.; Hastuti, W.; Martin, J.-L.M.; Guelorget, O.; Sumartono, B.; Wibowo, A. Remote sensing as a tool for diagnosis of water quality in Indonesian seas. Ocean Coast. Manag. 1995, 27, 197–215. [Google Scholar] [CrossRef]
- Basatnia, N.; Hossein, S.A.; Rodrigo-Comino, J.; Khaledian, Y.; Brevik, E.C.; Aitkenhead-Peterson, J.; Natesan, U. Assessment of temporal and spatial water quality in international Gomishan Lagoon, Iran, using multivariate analysis. Environ. Monit Assess 2018, 190, 314. [Google Scholar] [CrossRef] [PubMed]
- Turnbull, L.; Hütt, M.-T.; Ioannides, A.A.; Kininmonth, S.; Poeppl, R.; Tockner, K.; Bracken, L.J.; Keesstra, S.; Liu, L.; Masselink, R.; et al. Connectivity and complex systems: Learning from a multi-disciplinary perspective. Appl. Netw. Sci. 2018, 3, 11. [Google Scholar] [CrossRef]
- Calijuri, M.L.; Castro, J.d.S.; Costa, L.S.; Assemany, P.P.; Alves, J.E.M. Impact of land use/land cover changes on water quality and hydrological behavior of an agricultural subwatershed. Environ. Earth Sci 2015, 74, 5373–5382. [Google Scholar] [CrossRef]
- Huang, J.; Zhan, J.; Yan, H.; Wu, F.; Deng, X. Evaluation of the Impacts of Land Use on Water Quality: A Case Study in The Chaohu Lake Basin. Available online: https://www.hindawi.com/journals/tswj/2013/329187/ (accessed on 14 September 2018).
- Kumar, V.; Sharma, A.; Kumar, R.; Bhardwaj, R.; Thukral, A.K.; Rodrigo-Comino, J. Assessment of heavy-metal pollution in three different Indian water bodies by combination of multivariate analysis and water pollution indices. Hum. Ecol. Risk Assess Int. J. 2018, 1–16. [Google Scholar] [CrossRef]


| Parameters | Units | Preservative Used | Sampling Volume | Place of Determination | Analytical Method |
|---|---|---|---|---|---|
| pH | pH unit | NA | 1 L | Field determination | pH meter |
| DO * | mg/L | NA | 1 L | Field determination | Winkler’s Method |
| Temperature | °C | NA | 1 L | Field determination | Thermometer |
| COD * and OC * | mg/L | 25% H2SO4 pH > 2 | 500 mL | Cryopreservation | Dichromate reflux method |
| Heavy metals | mg/L | 50% HNO3 pH > 2 | 125 mL | Cryopreservation | Atomic absorption spectrometer |
| Heavy Metals (µg/L) | Mean Values (Mi) | Highest Permitted Value for Drinking Water (Si) | Desirable Maximum Value (Ii) | Sub-Index (Qi) | Unit Weight (Wi = K/Si) | Wi × Qi |
|---|---|---|---|---|---|---|
| Zn | 78.47 | 4000 | - | 1.96 | 6.25 × 10⁻⁸ | 1.22602 × 10⁻⁸ |
| Cu | 16.0 | 2000 | 50 | 1.74 | 2.5 × 10⁻⁷ | 4.35897 × 10⁻⁷ |
| Pb | 2.70 | 50 | 20 | 57.67 | 4 × 10⁻⁴ | 2.3 × 10⁻² |
| Cd | 8.44 | 3 | - | 281.3 | 1.2 × 10⁻¹ | 31.26 |
| Ni | 50.91 | 70 | - | 72.72 | 2 × 10⁻⁴ | 1.4 × 10⁻² |
| Co | 48.65 | 100 | 40 | 14.41 | 1 × 10⁻⁴ | 1.4 × 10⁻³ |
| Mn | 144.21 | 400 | - | 36.05 | 6 × 10⁻⁶ | 2 × 10⁻⁴ |
| Fe | 2303.5 | 1000 | 100 | 244.8 | 1 × 10⁻⁶ | 2.4 × 10⁻⁴ |
| ΣWi = 0.12; ΣWi × Qi = 31.03 and HPI = 279.9 | ||||||
| Components | Initial Auto-Values | Rotated Values | ||||
|---|---|---|---|---|---|---|
| Total | Variance (%) | Accumulated (%) | Total | Variance (%) | Accumulated (%) | |
| 1 | 4.3 | 32.8 | 32.8 | 3.5 | 26.9 | 26.9 |
| 2 | 2.4 | 18.5 | 51.3 | 2.4 | 18.1 | 45.0 |
| 3 | 1.9 | 14.5 | 65.8 | 2.1 | 16.5 | 61.5 |
| 4 | 1.3 | 10.2 | 76.0 | 1.4 | 11.0 | 72.5 |
| 5 | 1.0 | 7.4 | 83.4 | 1.4 | 10.8 | 83.4 |
| Parameters | Components | ||||
|---|---|---|---|---|---|
| 1 | 2 | 3 | 4 | 5 | |
| T | −0.01 | −0.04 | 0.64 | −0.59 | −0.12 |
| pH | −0.06 | 0.07 | 0.85 | −0.16 | −0.02 |
| DO | −0.20 | 0.01 | 0.85 | 0.08 | 0.01 |
| COD | 0.71 | 0.12 | 0.23 | 0.05 | 0.50 |
| OC | −0.01 | −0.09 | −0.08 | −0.04 | 0.93 |
| Zn | 0.92 | −0.01 | −0.24 | 0.03 | 0.02 |
| Cu | 0.44 | 0.76 | 0.03 | −0.28 | 0.17 |
| Pb | 0.94 | 0.04 | −0.11 | 0.12 | −0.01 |
| Cd | −0.03 | 0.79 | 0.16 | 0.10 | −0.38 |
| Ni | 0.42 | 0.57 | −0.32 | 0.11 | −0.25 |
| Co | −0.10 | 0.88 | 0.02 | 0.08 | 0.10 |
| Mn | 0.86 | 0.13 | −0.15 | 0.40 | −0.15 |
| Fe | 0.33 | 0.03 | −0.06 | 0.87 | −0.08 |
© 2018 by the authors. Licensee MDPI, Basel, Switzerland. This article is an open access article distributed under the terms and conditions of the Creative Commons Attribution (CC BY) license (http://creativecommons.org/licenses/by/4.0/).
Share and Cite
Yegemova, S.; Kumar, R.; Abuduwaili, J.; Ma, L.; Samat, A.; Issanova, G.; Ge, Y.; Kumar, V.; Keshavarzi, A.; Rodrigo-Comino, J. Identifying the Key Information and Land Management Plans for Water Conservation under Dry Weather Conditions in the Border Areas of the Syr Darya River in Kazakhstan. Water 2018, 10, 1754. https://doi.org/10.3390/w10121754
Yegemova S, Kumar R, Abuduwaili J, Ma L, Samat A, Issanova G, Ge Y, Kumar V, Keshavarzi A, Rodrigo-Comino J. Identifying the Key Information and Land Management Plans for Water Conservation under Dry Weather Conditions in the Border Areas of the Syr Darya River in Kazakhstan. Water. 2018; 10(12):1754. https://doi.org/10.3390/w10121754
Chicago/Turabian StyleYegemova, Saltanat, Rajeev Kumar, Jilili Abuduwaili, Long Ma, Alim Samat, Gulnura Issanova, Yongxiao Ge, Vinod Kumar, Ali Keshavarzi, and Jesús Rodrigo-Comino. 2018. "Identifying the Key Information and Land Management Plans for Water Conservation under Dry Weather Conditions in the Border Areas of the Syr Darya River in Kazakhstan" Water 10, no. 12: 1754. https://doi.org/10.3390/w10121754