The Role of CO2 Storage
Exploring Clean Energy Pathways
About this report
Highlights
Limiting the availability of CO2 storage would increase the cost of the energy transition. The emissions reduction pathway of the Clean Technology Scenario (CTS) assumes that CO2 storage is widely available to meet globally-agreed climate goals. It requires an additional investment of USD 9.7 trillion in the power, industrial and fuel transformation sectors, relative to a scenario that includes only current national commitments. Limiting CO2 storage results in an increase of these additional investments by 40%, to USD 13.7 trillion, relying on more expensive and nascent technologies.
Demand for decarbonised power would expand even further. In the Limited CO2 Storage scenario variant (LCS), electricity generation would increase by 13% in 2060, or 6 130 TWh, relative to the CTS. This would require additional low-carbon generation capacity of 3 325 GW in 2060, which is nearly half of the total installed global capacity in 2017. In locations where a rapid scale-up of wind and solar capacity are constrained due to land use or other factors, imported hydrogen may become an important alternative.
Alternative processes and novel technologies would be required in industry. In the LCS, the production of iron and steel and chemicals would shift more strongly towards non-fossil-fuel-based routes. In 2060, 25% of liquid steel, around 5% of ammonia and 25% of methanol production would use electrolytic hydrogen. The marginal abatement cost to industry in 2060 would double to around USD 500/tCO2, relative to the CTS. This would shift abatement efforts towards other sectors and increase industrial emissions by 4.8 Gt CO2.
Cement production has limited alternatives to carbon capture, utilisation and storage (CCUS). Two-thirds of emissions from cement production are process emissions and the lack of competitive alternatives to CCUS means that this sector would absorb almost half of the available CO2 storage capacity in the LCS. The use of CO2 storage in this sector would be around 15% (0.7 Gt CO2) lower than in the CTS to 2060, and emissions would increase concomitantly.
Synthetic hydrocarbon fuels would become a more important emissions reduction strategy. In the LCS, synthetic hydrocarbon fuels based on biogenic CO2 would need to become viable as an alternative to bioenergy with carbon capture and storage. These fuels would require around 4 700 TWh of electricity, replacing 9% of global primary oil and 2% of natural gas demand. Electrolyser capacity additions would average 40 GW per year from today to 2060 in the LCS, which is much higher than the 0.015 GW of new capacity installed in 2018.
Carbon capture would retain a role, with increased use of CO2 in industry and fuel transformation. CO2 use would grow by 77% in the LCS relative to the CTS, but remain relatively small. In the LCS, 13.7 Gt CO2 would be used to 2060 for the production of synthetic fuels, methanol and urea, with close to one-third of the CO2 used from biogenic sources.
A dual challenge would emerge for a net zero emissions energy system. Limited availability of CO2 storage would increase the challenge of direct abatement in key sectors and, in parallel, constrain the possibility for carbon dioxide removal or “negative emission” technologies. In a carbon-neutral energy system, these technologies can compensate for residual emissions that are difficult to abate directly.
Executive summary
Carbon capture, storage and utilisation play a critical role in achieving climate goals
Carbon capture, utilisation and storage (CCUS) technologies offer an important opportunity to achieve deep carbon dioxide (CO2) emissions reductions in key industrial processes and in the use of fossil fuels in the power sector. CCUS can also enable new clean energy pathways, including low-carbon hydrogen production, while providing a foundation for many carbon dioxide removal (CDR) technologies.
In the Clean Technology Scenario (CTS), the central decarbonisation scenario in this analysis, CCUS deployment reaches 115 gigatonnes of CO2 (Gt CO2) by 2060, with 93% of the captured CO2 permanently stored. The level of deployment in the CTS would require a substantial and rapid scale-up of CCUS from today’s levels, with 18 large-scale projects currently capturing around 33 million tonnes of CO2 (Mt CO2) each year.
Limiting the availability of CO2 storage would increase the cost and complexity of the energy transition
CO2 storage is a critical component of the CCUS opportunity. To better understand the value of CCUS as part of a portfolio of climate mitigation technologies, a variant of the CTS was developed that limits CO2 storage availability to 10 Gt CO2 in the period to 2060 – the Limited CO2 Storage scenario variant (LCS). This increases the cost and complexity of achieving the same emissions reductions as the CTS, particularly for key industrial sectors such as cement production. At USD 13.7 trillion (United States dollars), the additional investment needs of the power, fuel transformation and industrial sectors in the LCS would be 40% (USD 4 trillion) higher than the additional investments needed to achieve the CTS, relative to the baseline Reference Technology Scenario (RTS).
Limiting the availability of CO2 storage would result in the marginal abatement costs for the industrial sector doubling in 2060 relative to the CTS, from around USD 250 per tonne of CO2 (tCO2) to USD 500/tCO2, due to reliance on more expensive and novel technology options. In the power sector, the marginal abatement costs in 2060 would increase from around
USD 250/tCO2 in the CTS to USD 450/tCO2.
The effects would be felt across the energy system
The higher marginal abatement costs in the sectors directly reliant on CCUS would result in a shift of mitigation activity across the energy system. In the LCS, the cumulative CO2 emissions from the fuel transformation sector would increase by 55% (17 Gt CO2) relative to the CTS, in industry by 2% (4.8 Gt CO2) and in the power sector by 2% (5.7 Gt CO2). This would require additional efforts to reduce emissions in the buildings and transport sectors, with emissions 15% and 6% lower respectively, relative to the CTS.
In the buildings sector, these efforts would include a further acceleration of the phase-down of fossil-based heating technologies. Aggressive deployment of very high-efficiency technologies (light-emitting diodes, heat pumps and air conditioners) would need to start immediately and scale-up faster than in the CTS. In the transport sector, behaviour changes and a major policy push would be needed for a 8% increase in rail activity and a 16% increase in bus activity in 2060 (in vehicle kilometres travelled) relative to the CTS, alongside increased electrification and reduced activity from smaller passenger light-duty vehicles. Freight truck activity would also be 9% lower in 2060.
Limiting CO2 storage would drive new power demand
Even with strong efficiency measures, significant new investment would be required in the power sector in the LCS, with an additional 6 130 terawatt hours (TWh) of electricity generated in 2060 relative to the CTS (a 13% increase). This would require additional generation capacity of 3 325 gigawatts (GW), which is nearly half of the installed global capacity in 2017. Almost all of this additional capacity would be wind and solar photovoltaics (PV), with 25% higher capacity in 2060 in the LCS. Such a rapid and widespread scale-up of these technologies may have implications for land use, permitting, and infrastructure development in some regions. For example, approximately 173 000 additional onshore wind turbines would be required (assuming an average size of 5 MW) in the LCS compared with the CTS. Where domestic renewable capacity is constrained, importing hydrogen-based fuels may be a viable alternative.
Most of the increase in power demand in the LCS would be driven by the industrial and fuel transformation sectors, in particular due to greater reliance on electrolytic hydrogen. In 2060 in the LCS, around 9% of global electricity generation would be used for the production of synthetic hydrocarbon fuels, supported by dedicated, off-grid renewable electricity generation. This would require a massive scale-up in the production of hydrogen and the related infrastructure for hydrogen transport or further conversion in synthetic hydrocarbon fuels or ammonia.
Limiting availability of CO2 storage means that power generation with CO2 capture would almost vanish in the LCS relative to the CTS, which has around 615 GW of CCUS capacity attached to coal, gas and biomass facilities in 2060. Coal-fired power plants would be phased out more rapidly in the LCS, at an average of 60 GW of capacity per year in the period 2025–40 compared with an average of 45 GW per year in the CTS. The earlier retirements would result in lost revenue of around USD 1.8 trillion between 2017 and 2060.
Major technology shifts would be needed in industry
In the LCS, the production of iron and steel and chemicals would shift more significantly towards non-fossil fuel-based routes and more novel technology options. In 2060, 25% of liquid steel, around 5% of ammonia and 25% of methanol production would rely on electrolytic hydrogen. In the case of steel, this process is yet to be tested at scale, although pilot trials are planned.
Two-thirds of emissions from cement production are process emissions, and the lack of competitive alternatives to CCUS would see this sector absorb almost half of the available CO2 storage capacity in the LCS. Relative to the CTS, the use of CO2 storage in this sector would be reduced by around 15% (0.7 Gt CO2) in the period to 2060, and the emissions from the cement sector would increase concomitantly (a 1% cumulative increase in cement emissions).
Synthetic hydrocarbon fuels would make inroads
CCUS is a lower-cost emissions reduction option in the fuel transformation sector and contributes almost half of the emissions reductions achieved in the sector in the CTS. This includes supporting the sector to become net carbon negative by 2060 through the deployment of bioenergy with carbon capture and storage (BECCS). With limited CO2 storage, synthetic hydrocarbon fuels based on biogenic CO2 would be required at greater scale as an alternative to BECCS. In the LCS, these fuels would require around 4 700 TWh of electricity and replace 9% of global fossil primary oil demand and 2% of natural gas demand.
Achieving net zero emissions would become more challenging
Limiting the availability of CO2 storage would increase the challenge of direct abatement in key sectors, such as cement production, and in parallel would constrain the deployment of CDR or “negative emission” technologies. In a carbon-neutral energy system, these technologies are needed to compensate for residual emissions that are difficult or too expensive to abate directly. In many pathways that limit future temperatures to 1.5°C, global emissions become net negative in the second half of the century and this will rely on significant deployment of CDR technologies and CO2 storage. An ongoing constraint on CO2 storage beyond 2060 is therefore unlikely to be consistent with long-term climate goals.
Key findings
Policy recommendations
- Support the development and deployment of carbon capture, utilisation and storage (CCUS) as part of a least-cost portfolio of technologies needed to achieve climate and energy goals.
- Accelerate pre-competitive exploration and assessment of CO2 storage facilities in key regions to ensure future availability of storage.
- Establish policy and regulatory frameworks for CO2 storage that provide certainty and transparency for investors and the broader community.
- Facilitate planning and investment for multi-user CO2 transport and storage infrastructure capable of servicing a range of industrial and power facilities.
- Support research, development and demonstration to improve the performance and cost-competitiveness of technologies that may be important where CO2 storage availability is limited, including CO2 use, electrolytic hydrogen and synthetic hydro-carbon fuels produced from hydrogen.
CCUS technologies play a critical role in achieving climate goals
Achieving climate goals will require a transformation of global energy systems of unprecedented scope, speed and ambition. CCUS technologies are expected to play a critical role in supporting this transformation as part of a least-cost portfolio of technologies and measures (Figure 1). CCUS offers a solution for deep emissions reductions from key industrial processes, including the production of iron and steel, cement and chemicals, which remain the building blocks of modern societies. In the power sector, CCUS can provide greater diversity in generation options and address the potential for “lock-in” of emissions from existing infrastructure. CCUS can also enable new clean energy pathways, including low-carbon hydrogen production from fossil fuels for heating, transport and power generation. Virtually all hydrogen production today is from fossil fuels, primarily natural gas, and around 1 800 MW of production is equipped with CCUS. 1 Critically, CCUS also provides the infrastructure and knowhow to accelerate the deployment of CO2 removal technologies, such as bioenergy with carbon capture and storage (BECCS) and direct air capture.
In the Clean Technology Scenario (CTS), CCUS technologies contribute 13% of the cumulative emissions reductions needed to 2060, relative to the baseline Reference Technology Scenario. This makes CCUS the third-largest contribution, behind energy efficiency (39%) and renewables (36%). Nuclear and fuel switching account for 5% and 7% respectively.
Between 2018 and 2060, a total of 115 gigatonnes of CO2 (Gt CO2) are captured from the power sector (49% of the total CO2 captured), industrial processes (25%) and upstream transformation and processing (27%). Of the captured CO2, 35 Gt (30%) are from the processing and combustion of biomass, creating negative emissions that offset emissions in other sectors that are more difficult or costly to abate directly. In the CTS, 93% of the captured CO2 is permanently stored in geological formations and the remainder (7.9 Gt CO2) is used in processes such as methanol production.
In the CTS, CCUS delivers 13% of the cumulative emissions reductions to 2060
Figure 1. Global CO2 emissions reductions by technology area and sector, RTS to CTS

Note: Analysis above uses the Energy Technology Perspectives modelling framework. IEA 2019. All rights reserved.
The implications of limiting CO2 storage would be felt across all sectors
The deployment of CCUS in the CTS would require a rapid scale-up from today’s levels, with only around 33 million tonnes of CO2 (Mt CO2) currently captured each year for storage or use in enhanced oil recovery (CO2-EOR). While there is a high degree of confidence that global CO2 storage resources are well in excess of future requirements, including those modelled in the CTS, failure to assess and develop these resources in a timely manner could act as a brake on CCUS deployment.
The Limited CO2 Storage scenario variant (LCS) considers the implications for the global energy system if the required investment in CO2 storage is not undertaken. In the LCS, CO2 storage availability is limited to 10 Gt CO2 over the scenario period, equivalent to the level of CO2 storage developed in the Reference Technology Scenario (RTS), which considers only existing commitments and trends. The LCS is designed to achieve the same level of emissions reductions as the CTS, so as to explore the implications of limiting the availability of CO2 storage on energy sector as a whole (Figure 2). Nonetheless, the LCS would still deliver a 15-fold increase in annual CO2 storage rates from today’s levels.
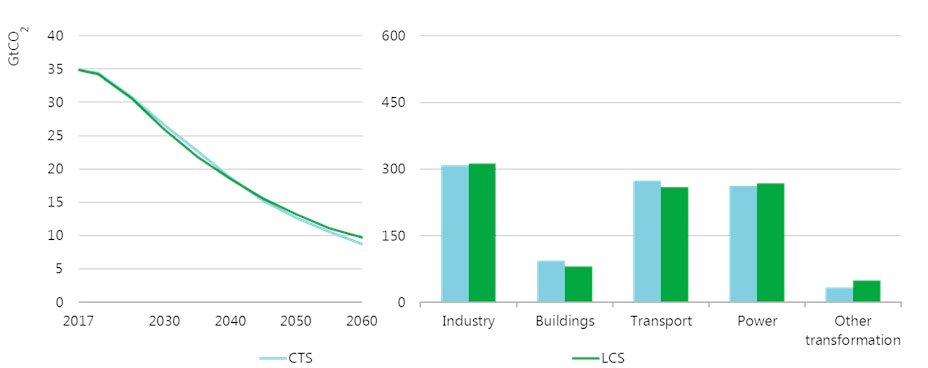
With limited availability of storage, the cumulative CO2 emissions from the sectors reliant on CCUS would increase relative to the CTS, by 55% (17 Gt CO2) in fuel transformation, 2% in industry (4.8 Gt CO2) and 2% (5.7 Gt CO2) in the power sector. This would require additional efforts to reduce emissions in the buildings and transport sectors, by 15% and 6% respectively, relative to the CTS.
In the buildings sector, the limited availability of CO2 storage would require an even more accelerated phase-down of fossil-based heating technologies than in the CTS, with a strategic shift to more efficient electricity-driven technologies, district energy and renewables (solar thermal and modern solid biomass). The market share of coal- and oil-fired heating equipment would drop to only 5% in 2030 globally, and the combined sales share of coal-, oil- and gas-fired technologies in 2060 would be further reduced by nearly half. Over the 2018-60 period, fossil fuel-related emissions would be reduced by 15% relative to the CTS. In parallel, the deployment of very high-efficiency technologies (light-emitting diodes, heat pumps and air conditioners) would need to be start immediately, even more quickly than in the CTS. Additional energy efficiency measures in the buildings sector would generate close to 1 700 terawatt hours (TWh) of electricity savings annually by 2060 and reduce overall power demand in the sector by nearly 10% compared with the CTS.
In the transport sector, behavioural changes and a major policy push would be needed to support greater electrification of road modes and to shift passenger transport to buses and rail. The share of electric passenger light-duty vehicles (PLDVs) in the total fleet would increase from 62% in 2060 in the CTS to 70% in the LCS, from less than 1% today, while PLDV activity would (measured in vehicle kilometre miles [vkm]) decline by a further 2% in the LCS relative to the CTS. Passenger rail activity (in vkm) would increase by 8% in 2060 relative to the CTS and bus activity by 16%, with a range of measures required to support this shift to public transport, including fiscal incentives, regulations and additional investment in public transport networks. Freight truck activity would also be 9% lower in 2060.
In the LCS, additional efforts would be required in the buildings and transport sectors to compensate for higher emissions from industry, power and fuel transformation
Figure 2. Global CO2 emissions by scenario and cumulative emissions to 2060 by sector and scenario
Note: Analysis above uses the Energy Technology Perspectives modelling framework. IEA 2019. All rights reserved.
The cost of the transition would increase
Achieving the ambitious emissions reductions of the CTS would require an additional USD 9.7 trillion (United States dollars) in investment in power generation, transformation and industry, above that of the RTS. To achieve the same CO2 emissions with limited availability of CO2 storage, this additional investment would need to increase by 40%, to USD 13.7 trillion.
Most of the additional investment in the LCS relative to the CTS would be in power generation, with an additional USD 3.1 trillion needed to accommodate the increased electricity demand from the industrial sector and for the production of synthetic hydrocarbon fuels from electrolytic hydrogen. An additional USD 0.9 trillion in investment would flow directly into the industrial and fuel transformation sectors. These investment figures do not account for the economic losses associated with early retirement of existing assets, including an estimated additional USD 1.8 trillion in lost revenue (on an undiscounted basis) from coal-fired power generation retirement in the LCS compared with the CTS.
With limited availability of CO2 storage, the marginal CO2 abatement cost in the power, industrial and fuel transformation sectors would increase significantly compared with the CTS. By 2060, the marginal abatement cost in the power sector and in fuel transformation would approach USD 450/tCO2, compared with USD 250/tCO2 in the CTS. For industry, the marginal abatement cost would double to around USD 500/tCO2 in 2060 compared with USD 250/tCO2 in the CTS. The higher marginal abatement costs in industry and fuel transformation would shift mitigation efforts to other parts of the energy system.
Demand for decarbonised power would grow
The CTS involves a major shift towards electrification of end-use sectors that would need to be pushed even further if the availability of CO2 storage were limited. In the CTS, electricity becomes the largest end-use fuel, reaching a share of 36% (from 18% today) with absolute electricity consumption nearly doubling between 2017 and 2060. In parallel, global power generation is virtually decarbonised, with the average CO2 intensity falling from 530 grams of carbon dioxide per kilowatt hour (g CO2/kWh) in 2017 to 4 g CO2/kW in 2060.
In the LCS, electricity generation in 2060 would be 13% or 6 130 TWh higher than the CTS, equivalent to approximately twice the electricity generated in the European Union in 2017 (Figure 3). The increased demand for electricity would be led by industry and fuel transformation, in particular for electrolytic hydrogen. This increase in demand would be larger if not for higher costs for residential and commercial customers in the LCS, which would trigger additional efficiency measures and a 9% reduction in electricity demand from the buildings sector.
The LCS would require the installation of 3 325 gigawatts (GW) of additional generation capacity, primarily solar and wind (Figure 4), which is nearly half of total global generation capacity in 2017. In particular, an additional 1 966 GW of solar would be installed over and above the 7 600 GW installed in the CTS in 2060, from a level of around 400 GW today. This expansion may have implications for land use and infrastructure development, with a 1oo-MW solar installation requiring around 100 hectares of land. Further, an additional 864 GW of onshore wind capacity would be built in the LCS, implying approximately 173 000 additional wind turbines (assuming an average size of 5 MW).
Without the option of CCUS, coal-fired generation would need to be phased out more rapidly, with an average of 60 GW of early retirements each year between 2025 and 2040 in the LCS, compared with an average of 45 GW in the CTS for the same period.
With limited CO2 storage, electrification would become even more important to reduce emissions in industry and transport
Figure 3. Global final energy demand changes in the LCS relative to the CTS, 2060

Notes: EJ = exajoule. Analysis above uses the Energy Technology Perspectives modelling framework. IEA 2019. All rights reserved.
Solar and wind would account for much of the additional generation capacity needed with limited availability of CO2 storage
Figure 4. Changes in global installed power generation capacity by fuel in the LCS relative to the CTS

Note: Analysis above uses the Energy Technology Perspectives modelling framework. IEA 2019. All rights reserved.
Major technology shifts would be needed in industry
CCUS plays an important role in industry in the CTS (Figure 5), particularly as a solution for process-related emissions, delivering around 15% of the cumulative emissions reductions needed to 2060. Limiting the deployment of CO2 storage would require greater deployment of alternative emission reduction strategies and technologies, many of which are at a very early stage of development today. With best available technologies widely deployed and cost-effective process integration improvements pursued significantly in the CTS, the focus in the LCS would shift towards material efficiency and new renewables-based processes, including those that rely on low-carbon electricity such as electrolytic hydrogen.
Around 20% of direct industrial CO2 emissions generated are captured either for storage or use in 2060 in the CTS
Figure 5. Captured CO2 for storage by industrial sub-sector and for utilisation in the CTS

Notes: CO2 utilisation refers to its application for the production of urea and methanol. Analysis above uses the Energy Technology Perspectives modelling framework. IEA 2019. All rights reserved.
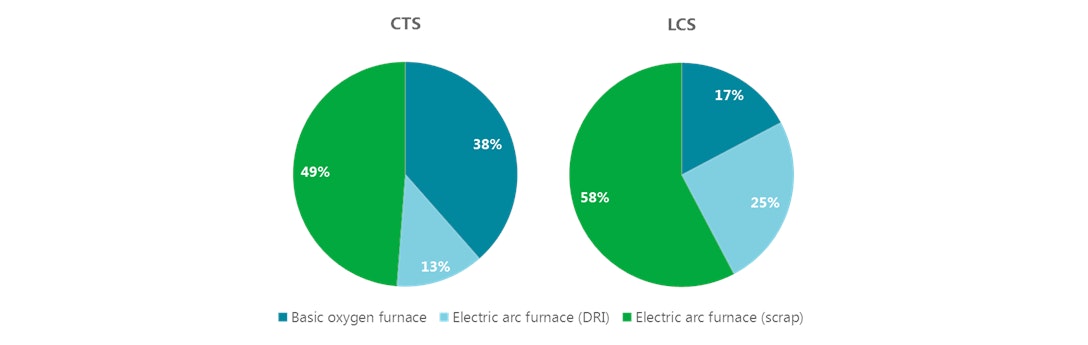
In the iron and steel sector, up to 10 Gt CO2 is captured and stored cumulatively in the CTS, with around 44% of the sector’s emissions captured in 2060. In the LCS, material efficiency and scrap-based electric arc furnace production would be increased relative to the CTS and more innovative processes would be deployed, particularly hydrogen-based direct reduced iron (DRI) (Figure 6). Hydrogen-based DRI would dominate the DRI production route by 2060 and contribute to the sector’s demand for electricity increasing by 2.5 times relative to the CTS in 2060. This process is yet to be tested at scale, with pilot trials planned to commence in 2021. As such, the deployment in the LCS would be limited in the period to 2040, but significantly increased thereafter.
In the cement sector, around 5 Gt CO2 is captured and stored cumulatively to 2060 in the CTS, with around 20% of the sector’s emissions captured in 2060. Two-thirds of the emissions from the cement sector are process emissions, attributable to the decomposition of limestone (calcium carbonate) when producing clinker, the main substance found in cement. In the LCS, advances to reduce the clinker-to-cement ratio and material efficiency strategies would become more important, but the lack of alternatives to CO2 storage for direct emissions means that reliance on CCUS would be reduced by only 15% relative to the CTS. Around 4 Gt CO2 would be captured in the LCS, with the cement sector absorbing almost half of the limited CO2 storage allocation in the period to 2060.
In the LCS, DRI- and scrap-based routes would increase at the expense of primary production using a basic oxygen furnace
Figure 6. Liquid steel production by process route and scenario in 2060
Note: Analysis above uses the Energy Technology Perspectives modelling framework. IEA 2019. All rights reserved.
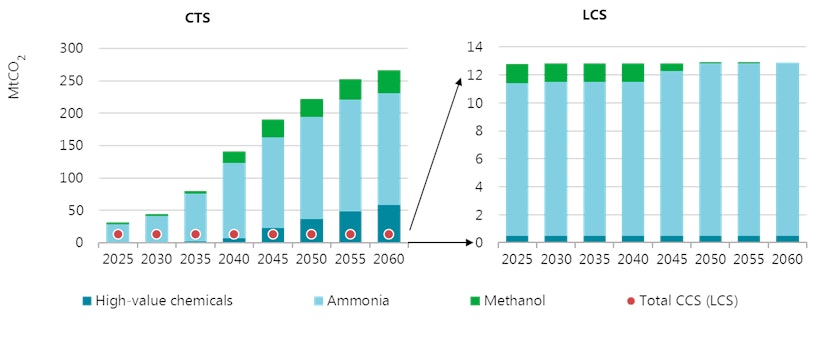
When limiting CO2 storage, most of the capture applications in the chemical sector would be concentrated in ammonia production
Figure 7. Captured CO2 for storage in the chemicals sector by scenario
Note: Analysis above uses the Energy Technology Perspectives modelling framework. IEA 2019. All rights reserved.
In the chemicals sector, 6 Gt CO2 is captured and stored cumulatively in the CTS, with around 25% of the sector’s annual emissions captured and stored in 2060. CCUS is a cost-effective emissions reduction strategy in chemicals, particularly in processes where the CO2 is already inherently separated and/or where concentrated CO2 streams are produced, such as ammonia production. Limiting CO2 storage availability result in a combined increase of 2.5 times in ammonia and methanol production using electrolysis by 2060, relative to the CTS. As a result, the electricity demand for these two chemicals would nearly double in 2060 relative to the CTS. The increase in methanol production based on electrolytic hydrogen would also result in a fivefold increase in CO2 use relative to the CTS, to 60 Mt CO2 in 2060. In the LCS, CO2 storage for the chemicals sector would be reduced by 90% and, of this, around 90% of the stored CO2 would be captured from ammonia production (Figure 7).
Synthetic hydrocarbon fuels would make inroads
CCUS contributes approximately half of the emissions reductions achieved in the CTS in the fuel transformation sector, which includes energy use for oil and gas production and refining. In the CTS, 31 Gt CO2 of the sector’s emissions are permanently stored and the uptake of BECCS sees emissions from fuel transformation become net negative by 2060.
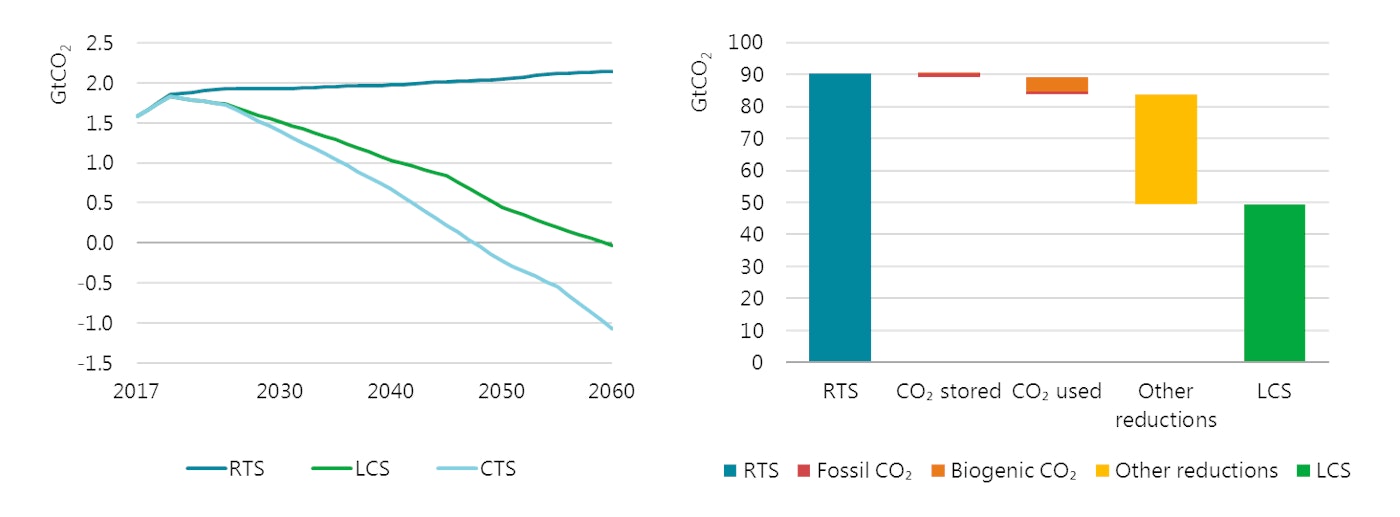
With limited CO2 storage, the option of using captured CO2 in combination with electrolytic hydrogen would become more important for the production of synthetic liquid or gaseous hydrocarbon fuels (power-to-liquids [PtL] and power-to-gas [PtG]). These synthetic fuels can substitute for fossil fuels and, where the CO2 used is sourced from bioenergy, they can support similar emissions reductions, such as applying BECCS to offset the equivalent use of fossil fuels. Hence, while the cumulative emissions from the fuel transformation sector would be 17 Gt CO2 higher in the LCS relative to the CTS, the net emissions from the sector would still become marginally negative by 2060 (Figure 8).
CCUS would account for a sixth of the cumulative CO2 emissions reductions in the fuel transformation sector in the LCS, largely from CO2 use
Figure 8. Annual CO2 emissions from fuel transformation and cumulative CO2 reductions in the LCS
Note: Analysis above uses the Energy Technology Perspectives modelling framework. IEA 2019. All rights reserved.
In the LCS, 4.4 Gt CO2 of emissions from fuel transformation would be stored in the period to 2060 and 3.1 Gt CO2 would be used, with 50% of this from biogenic sources. The reliance on synthetic hydrocarbon fuels from electrolytic hydrogen would be associated with a very large increase in electricity demand, with an additional 4 700 TWh of electricity required in 2060 to produce 2 400 TWh (8.5 EJ) of synthetic fuels (Figure 9). The additional power need for these synthetic fuels in 2060 is equivalent to almost 20% of global electricity demand in 2017, or more than the total electricity generated in the United States in 2017.
The LCS requires a rapid and sustained scale-up of electrolyser capacity, reaching 1 750 GW (at 2 700 full load hours) in 2060 or an average of 40 GW per year over the next four decades. By means of comparison, in 2018, 0.015 GW of electrolyser capacity was added for energy purposes (IEA, 2019).
CO2 use options in the LCS would produce 2 400 TWh (8.5 EJ) of synthetic fuels in 2060, which would require 4 700 TWh of electricity generation and 620 Mt CO2
Figure 9. Fuel production, electricity demand and CO2 use in the LCS
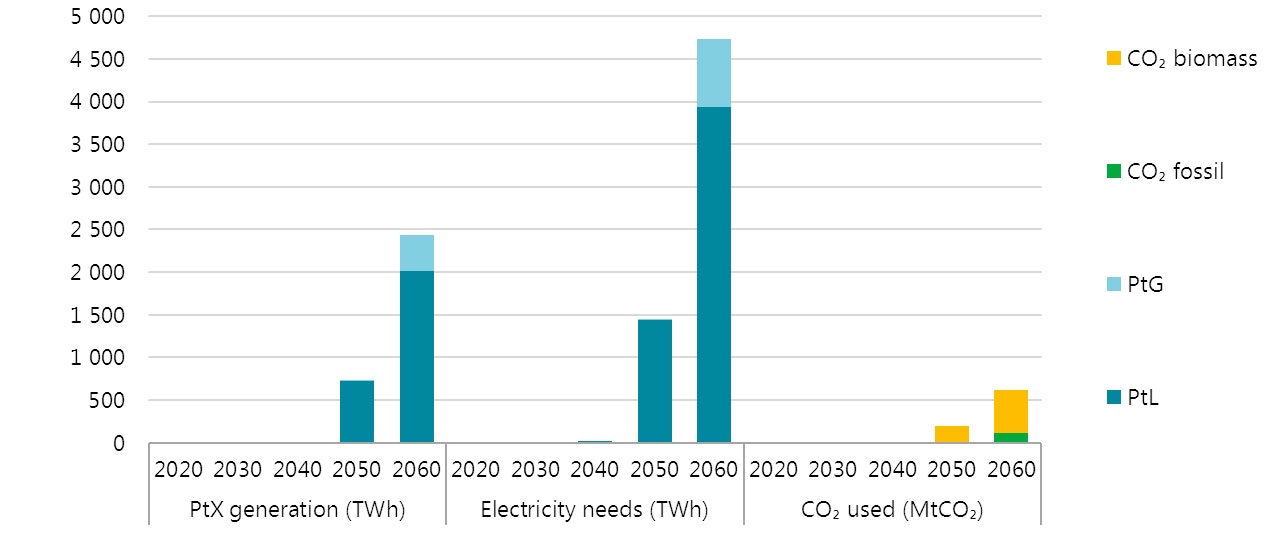
Notes: PtX = power-to-X, which includes PtG and PtL. Analysis above uses the Energy Technology Perspectives modelling framework. IEA 2019. All rights reserved.
Carbon capture would retain a role with increased CO2 use
In the LCS, almost 24 Gt CO2 would be captured from industry, fuel transformation and power generation for storage and use in the period to 2060, representing around 20% of the cumulative CO2 capture rate in the CTS. CO2 use would grow by 77% in the LCS relative to the CTS, with 13.7 Gt CO2 used cumulatively for the production of methanol, urea and synthetic hydrocarbon fuels. The use of CO2 in the LCS would be less than 13% of the CO2 stored in the CTS.
References
IEA (International Energy Agency) (2019), The Future of Hydrogen: Seizing Today’s Opportunities, IEA, Paris, www.iea.org/hydrogen2019/.
Reference 1
IEA (International Energy Agency) (2019), The Future of Hydrogen: Seizing Today’s Opportunities, IEA, Paris, www.iea.org/hydrogen2019/.