Greenhouse gas emissions by country and sector (infographic)
Check out our infographics to discover greenhouse gas emissions by country and by sector in the EU as well as the world's top emitters.
Greenhouse gas emissions contribute to accelerating climate change. Who are the biggest emitters? What sector produces the most emissions?
Amount of greenhouse gas emissions per year in the EU

As the infographic above shows, CO2 is the greenhouse gas that is emitted the most. It is commonly produced by human activities. Other greenhouse gases are emitted in smaller quantities, but they trap heat far more effectively than CO2. For example, methane is more than 80 times more potent than CO2 over a 20-year period
Find out more about the different greenhouse gases, their origins and warming potentials
Greenhouse gas emissions by sector in the EU

According to the sixth assessment report by the Intergovernmental Panel on Climate Change (IPCC), emissions of greenhouse gases from human activities are responsible for about 1.1°C of warming since the beginning of the 20th century. These activities include for example the burning of coal, oil and gas, deforestation and farming.
The diagram above shows greenhouse gas emissions in the EU in 2019 broken down by main source sectors. Energy is responsible for 77.01% of greenhouse gas emissions in 2019, of which transport accounts for about a third. Greenhouse gas emissions from agriculture contribute with 10.55%, industrial processes and product use with 9.10% and the management of waste with 3.32%.
Find out more about EU targets and measures to reduce greenhouse gas emissions
Greenhouse gases emissions in the EU and in the world
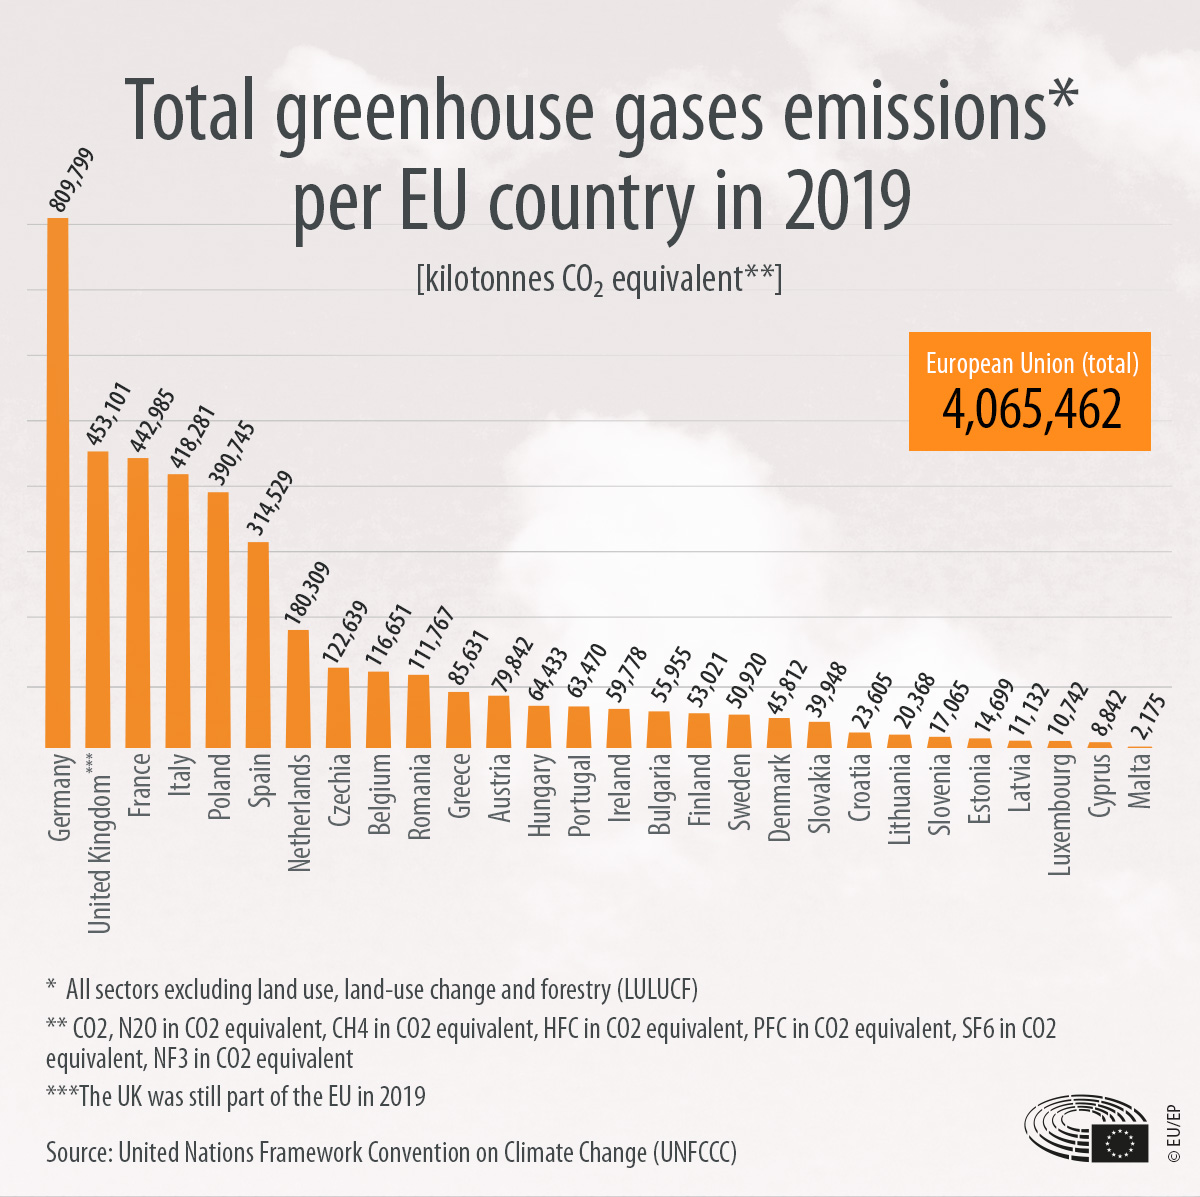
The charts above list EU countries by total greenhouse gas (GHG) emissions in 2019 and the infographic below shows the world's top greenhouse gas emitters in 2015. The EU is the third biggest emitter behind China and the United State and followed by India and Russia.
Greenhouse gases remain in the atmosphere for periods ranging from a few years to thousands of years. As such, they have a worldwide impact, no matter where they were first emitted.

What are greenhouse gases?
- Greenhouse gases are gases in the atmosphere that act similarly to the glass in a greenhouse: it absorbs the sun’s energy and heat that is radiated from the Earth’s surface, trap it in the atmosphere and prevent it from escaping into space.
- This process is the main reason for greenhouse effect that keeps the Earth’s temperature warmer than it would otherwise be, allowing life on Earth to exist
- Many greenhouse gases occur naturally in the atmosphere, but human activity adds enormous amounts, boosting the greenhouse effect that is contributing to global warming