Special report: TPG's best US airlines of 2022


There are a lot of ways to measure an airline's success. On-time performance, reliable scheduling, the affordability of airfares, excellent elite perks and the scope of a frequent flyer program are all metrics you might take into account.
But what does it mean to truly be the "best" U.S. airline?
Well, every year here at The Points Guy, we take a look at all of these factors (among others) to compare the major airlines. The goal is simple: Use objective data to identify just how well airlines are serving customers. And today, we're out with our annual special report based on each airline's performance over the previous year.
Here's a look at the best U.S. airlines of 2022.
Best US airlines of 2022
- Delta Air Lines.
- Southwest Airlines.
- United Airlines.
- American Airlines.
- Alaska Airlines.
- Hawaiian Airlines.
- JetBlue Airways.
- Frontier Airlines.
- Allegiant Air.
- Spirit Airlines.
Keep reading for a full breakdown of the data that — for the fourth year in a row — took Delta to the top of the heap.
Sign-up for the TPG daily newsletter to get stories like this delivered to your inbox.
Overall ranking and scores
As a starting point, here's a summary table that breaks down this year's rankings. We've included where each carrier fell in 2021 (in parentheses), and we've highlighted where each airline excelled and where it fell short compared to the others.
| Airline (2021 rank) | Total score (out of 100)* | Top-performing areas | Lowest-performing areas |
|---|---|---|---|
| 1. Delta (1) | 70.43 | Involuntary bumps, lounges, customer satisfaction | Affordability |
| 2. Southwest (2) | 60.95 | Bag/change fees, award availability, customer satisfaction | Timeliness, cancellations |
| 3. United (3) | 60.54 | Route network, frequent flyer program | Affordability, cancellations |
| 4. American (5) | 58.49 | Family, route network | Baggage, affordability |
| 5. Alaska (4) | 57.97 | Involuntary bumps, customer satisfaction | Baggage |
| 6. Hawaiian (7) | 57.40 | Timeliness, cancellations, involuntary bumps | Route network, frequent flyer program |
| 7. JetBlue (6) | 49.51 | Cabin features, award availability | Timeliness, baggage, wheelchairs/scooters, customer satisfaction |
| 8. Frontier (9) | 35.87 | Affordability | Involuntary bumps, bag/change fees, award availability |
| 9. Allegiant (10) | 33.21 | Involuntary bumps, baggage, wheelchairs/scooters | Timeliness, cancellations, cabin features, family, frequent flyer program |
| 10. Spirit (8) | 30.89 | Affordability | Cancellations, wheelchairs/scooters, customer satisfaction |
* All data was based on the 12-month period from Jan. 1, 2021, through Dec. 31, 2021.
As you can see, there wasn't a ton of change from last year's list. In fact, the top three carriers retained their respective spots, and the only airline that moved by more than one spot was Spirit, which dropped from eighth to last.

There's a lot to unpack here, so let's take a closer look at each broad category of data (the full methodology is available at the end of the report).
With the free TPG app, you can track your progress toward your next trip, and get spending recommendations to help you reach your travel goals.
Best airlines for reliability
Perks like airport lounges and first-class upgrades can be great (and make for some terrific fodder on social media). However, many travelers simply want to maximize their chances of having a trip go smoothly. If an airline is consistently reliable, you're that much more likely to book said airline again.
In rating the 10 airlines for reliability (which made up a total of 30% of the analysis), we looked at five different factors:
- Timeliness: How frequently a flight on the airline was delayed.
- Cancellations: How frequently a flight on the airline was canceled.
- Bumps/involuntarily denied boardings: How frequently an airline bumped a traveler against their will on an oversold flight.
- Baggage: How frequently an airline mishandled a piece of checked luggage.
- Wheelchairs/scooters: How frequently an airline mishandled a mobility device.
For the second straight year, Hawaiian Airlines came out on top in this category, notching the lowest percentage of delays and cancellations. Just over 90% of Hawaiian's flights arrived on time (within 15 minutes of the scheduled arrival time), and only 264 of the airline's 60,000-plus scheduled flights were canceled. It also bumped exactly zero passengers.
Delta was nipping at Hawaiian's heels in reliability, as the Atlanta-based carrier had the second-lowest percentage of delayed and canceled flights. It did bump two passengers during the 12-month period that began Jan. 1, 2021. But when you consider that over 127 million passengers flew Delta during that time frame, this percentage is effectively zero as well.
And then there's Allegiant.
If you wanted to take the airline that would be least likely to mishandle your checked bag, Allegiant was it. The same holds true for mobility devices and involuntary bumps (its zero involuntarily denied boardings tied with Hawaiian and effectively tied with Delta).
However, Allegiant came in dead last for both delays and cancellations. Nearly 30% of its flights were delayed by at least 15 minutes, and roughly 1 out of every 30 flights it scheduled was canceled.
Meanwhile, American Airlines had the distinction of being the worst airline for checked bags for the second straight year, as the carrier mishandled about 1 in every 131 items it checked — a rate more than four times higher than Allegiant's.
Related: 7 steps to take when an airline loses your luggage
Finally, Frontier was the most likely to deny a passenger boarding against their will — though even that happened to fewer than 10 out of every 100,000 passengers that flew the low-cost carrier.
Best airlines for the travel experience
Operational reliability — or how well an airline gets you to your destination without issues — is just one aspect of why a traveler might select a specific airline. The actual experience of flying with a given airline (think seat comfort, inflight amenities and services for families) also plays an important role in this decision. It's why you see airlines touting things like "the most legroom in coach" (JetBlue) or "an elevated main cabin experience" (Delta) to woo travelers.
The passenger experience made up 25% of our analysis, and it featured four key factors:
- Cabin features: What you'll experience on board, including Wi-Fi, seat pitch/width and inflight entertainment.
- Lounges: How widespread (and numerous) an airline's lounges are, and how affordable it is to access them.
- Family: How well an airline caters to families traveling with children.
- Customer satisfaction: How frequently customers complain to the U.S. Department of Transportation about the carrier.
For the second year in a row, JetBlue ran away with the highest score for cabin features. The airline offers complimentary Wi-Fi and seatback TV screens to every single passenger. There's no need to download an app to watch content or purchase a costly internet subscription plan to stay connected. All travelers enjoy those features when flying JetBlue.
When it comes to lounge access, Alaska and Delta took high marks thanks to the wide variety of locations across the U.S. (Alaska Lounge members can also access American Airlines' Admirals Clubs when flying on an eligible flight). Meanwhile, American was the top performer in the family category, mainly due to the fact that lounge access, preferred seating and checked bag benefits extend to multiple family members on the same reservation.
And then there's customer satisfaction.
This was a major pain point for airlines in our 2021 best airlines report, as we considered DOT complaints from April 1, 2020, through March 31, 2021. In other words, this captured customer sentiment in the 12 months immediately following the onset of the COVID-19 pandemic — when refund issues were at their peak.
The difference is stark.
In last year's report, the 10 airlines (together) saw 12.49 complaints per 100,000 passengers, with the worst offenders being Hawaiian (103.61), Frontier (51.76) and United (27.27). The best-performing airline was Southwest, with 3.17 complaints per 100,000 passengers.
But over the 12 months of 2021, the total complaints across the airlines were just 3.14 per 100,000 passengers.
Spirit fared the worst, with just over 12 per 100,000, while Delta performed the best — with just 1.25 complaints for every 100,000 passengers it flew.
Best airlines for cost and reach
While the overall experience of flying is important, there are two critical questions that could prevent a traveler from ever booking a flight on a given airline. First, can a carrier get me where I need to be? And if so, how much will it affect my wallet?
That's where our third category comes into play. The "cost and reach" aspect of our analysis combines the prices you'll pay for both airfare and common extras (like bags and changes) along with how widespread an airline's route network is. This made up 20% of our data, broken into the following three elements:
- Route network: How many domestic airports an airline serves.
- Affordability: How far (in distance) you can fly for the money you're paying, based on financial data from the Bureau of Transportation Statistics.
- Ancillary fees: How much a typical passenger pays in bag and change/cancellation fees.
As in previous years, the major airlines shined with their broad route networks. United offered the most extensive service — to over 231 domestic airports (we took the average from individual monthly data points reported to the DOT). American was just behind at 227, while Delta came in at just under 208.
Hawaiian was last here, with an average of just under 15 destinations — not at all surprising given its concentration in a single state.
It was an entirely different story in the affordability metric, as the three legacy carriers came in eighth (American), ninth (United) and last (Delta).
Instead, this was where the low-cost carriers stood out, as Spirit came out on top, followed by Frontier and Allegiant.
Spirit took in just $98.70 in revenue for every 1,000 flown passenger miles, and Frontier was just behind (at $101.86). Meanwhile, Delta clocked in as the most expensive, with a whopping $260.93 per 1,000 miles — over 2 1/2 times above Spirit's number.
However, the tables were turned when looking at ancillary fees. Baggage data along with change and cancellation fees reporting from the DOT put Frontier in last place, with an average of $26.95 per passenger. Spirit was a close second at $23.88 — followed by Allegiant at $23.39.
Southwest excelled in this category thanks largely to the fact that it imposes no change or cancellation fees and allows all flyers to check two bags for free. It charged an average of just 47 cents per passenger (owing to checked bag fees beyond the carrier's published weight, size and quantity limits).
Best airlines for loyalty
Our final broad category was loyalty — a critical topic here at The Points Guy. This made up 25% of our overall data and was broken down into two elements:
- Frequent flyer program: How rewarding an airline's loyalty program is, including TPG's valuations, elite status, cobranded credit cards, partner airlines and expiration policies.
- Award availability: How easy and valuable it is to redeem your rewards across popular travel times.
For the second year running, United took the top spot for rewarding frequent flyers, as it offers the widest number of partner airlines, four personal credit card options and no mileage expiration. Delta came in second, with a similar number of cards but fewer partners, and it just edged out American (which notably is the largest U.S. airline in terms of flights operated and passengers flown — but still allows miles to expire for members 21 and older).
Meanwhile, Southwest was the top performer in award availability. Not only could you use your Rapid Rewards points on every flight and date we checked, you also had the best overall value (1.44 cents per point). American and Delta were in a virtual tie for second here, separated by just 16 thousandths of a cent.
(Note that the award availability portion of the analysis is different from our monthly valuations, which include other factors like partner airline awards and stopover policies. For this calculation, we focused solely on the availability and redemption value on a common set of travel dates.)
Frontier was the lowest-performing airline in loyalty, largely thanks to several dates where award flights simply weren't available. Meanwhile, Allegiant came in ninth here because of its limited options for earning and redeeming Allways Rewards points.
Methodology
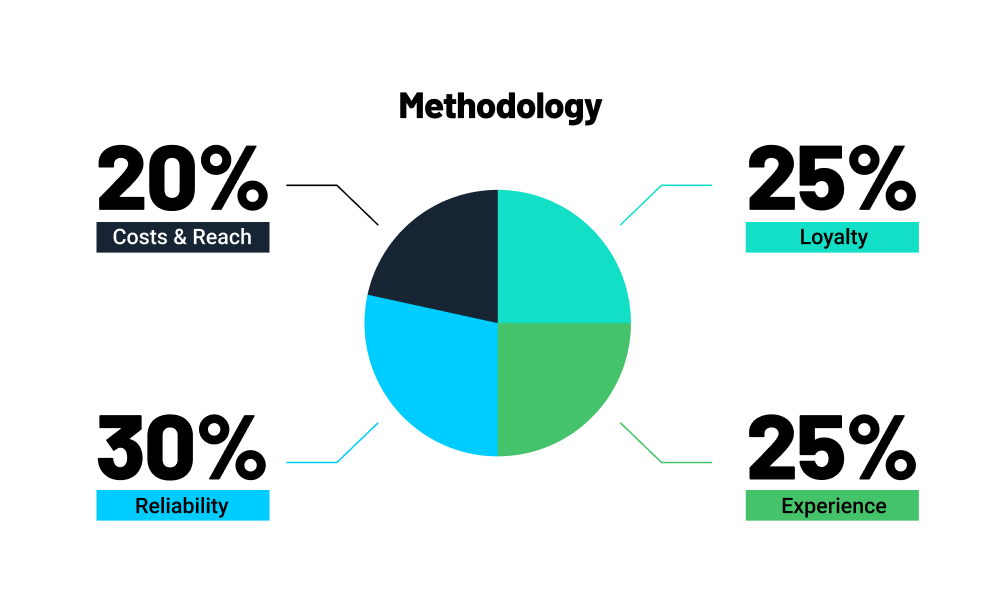
As noted above, there were four broad sections in this analysis, each of which consisted of multiple criteria. All data was based on flights operated during the 12-month period that ran from Jan. 1 through Dec. 31, 2021.
Here's a full breakdown of the methodology and the data used for each:
- Reliability (30%).
- Timeliness (using data on delayed flights from the DOT).
- Cancellations (using data on canceled flights from the DOT).
- Involuntary bumps (using data on involuntary denied boardings from the DOT).
- Baggage (using data on mishandled baggage from the DOT).
- Wheelchairs/scooters (using data on mishandled baggage from the DOT).
- Experience (25%).
- Cabin features (using data from SeatGuru and inflight amenity offerings from each carrier's website).
- Lounges (using data on the number of lounges, number of cities and price of membership for each applicable lounge network).
- Family (using a 0-to-5 score based on boarding, perks and food/entertainment on board).
- Customer satisfaction (using data on customer complaints from the DOT).
- Costs and reach (20%).
- Route network (using the monthly average of domestic cities served by each airline from the DOT).
- Affordability (using financial data from the BTS).
- Bag/change fees (using financial data from the BTS).
- Loyalty (25%).
- Frequent flyer (using data from our monthly valuations, elite status reports and each carrier's website).
- Award availability (using real-time award inventory for popular domestic routes across three distinct time periods).
For all criteria, the raw scores from the data were converted into a scaled score from zero to 10. In most cases, a score of zero was assigned to the lowest-performing carrier, and where possible, a score of 10 was assigned to a "perfect" airline — for example, Allegiant, Delta and Hawaiian all scored a 10 on involuntary bumps, since they had zero (or effectively zero) last year.
However, when there was no clear way to determine perfection, a 10 was given to the highest-performing airline.
By using scaled scores (rather than a simple ranking system), we essentially "graded" each airline relative to the others. The score for each airline on each individual element was thus a numerical reflection of how much better said airline did compared to the lowest-scoring carrier.
As an example, Delta just edged out Southwest in the lowest number of DOT complaints (1.25 per 100,00 passengers versus 1.37). We normalized these numbers by comparing them to the lowest-performing airline (Spirit, with 12.08 per 100,000) and the highest possible score (0 per 100,000), and the resulting scaled score conversion gave Delta a "grade" of 8.96 out of 10 and Southwest an 8.87 out of 10.
Then, each individual score was weighted using the above percentages to arrive at the final, cumulative score included in the table.
Final thoughts
There's a lot to consider when choosing an airline for your next trip — including price, operational efficiency, travel experience and loyalty. And while there's no single carrier that's ideal for every traveler, Delta Air Lines once again rose to the top of the list, earning the title of TPG's best U.S. airline for the fourth straight year.
That said, no airline is perfect — and even Delta's composite score of 70.43 shows room for improvement. The carrier also saw some significant operational troubles this year, so only time will tell if it can retain its top ranking next year.
Additional reporting and data collection by Zach Griff, Ethan Klapper and Kyle Olsen.