Article

Ordered Mesoporous Carbons for Adsorption of Paracetamol and Non-Steroidal Anti-Inflammatory Drugs: Ibuprofen and Naproxen from Aqueous Solutions

Institute of Chemistry, Jan Kochanowski University, 25-406 Kielce, Poland
*
Author to whom correspondence should be addressed.
Water 2019, 11(5), 1099; https://doi.org/10.3390/w11051099
Submission received: 18 April 2019 / Revised: 21 May 2019 / Accepted: 22 May 2019 / Published: 25 May 2019
(This article belongs to the Section Wastewater Treatment and Reuse)

Abstract

:
The adsorption of paracetamol and non-steroidal anti-inflammatory drugs (ibuprofen and naproxen) on ordered mesoporous carbons (OMC) and, for comparison, on commercial activated carbon, were investigated in this work. OMC adsorbents were obtained by the soft-templating method and were characterized by low-temperature nitrogen adsorption and scanning electron microscopy (SEM). The effects of contact time and initial concentration of organic adsorbates on the adsorption were studied. The contact time to reach equilibrium for maximum adsorption was 360 min for all the studied adsorbates. The adsorption mechanism was found to fit pseudo-second-order and intra particle-diffusion models. Freundlich, Langmuir and Langmuir-Freundlich isotherm models were used to analyze equilibrium adsorption data. Based on the obtained experimental data, the adsorption isotherm in the applied concentration range for all the studied adsorbates was well represented by the Freundlich-Langmuir model. The adsorption ability of ordered mesoporous carbon materials was much higher for paracetamol and naproxen in comparison to commercial activated carbon. The removal efficiency for ibuprofen was significantly lower than for other studied pharmaceuticals and comparable for all adsorbents. Theoretical calculations made it possible to obtain optimized chemical structures of (S)-naproxen, ibuprofen, and paracetamol molecules. Knowledge of charge distributions of these adsorbate molecules can be helpful to explain why paracetamol and naproxen can react more strongly with the surface of adsorbents with a large numbers of acidic groups compared to ibuprofen facilitating more efficient adsorption of these pharmaceuticals on ordered mesoporous carbons.

1. Introduction

Pharmaceuticals belong to the most significant groups of emerging pollutants to have been recognized in water resources. Non-steroidal anti-inflammatory drugs (NSAIDs) represent one of the most widely used pharmaceutical products available without prescription. The production and consumption of NSAIDs have increased in recent years, introducing quantities amount of these substances into the environment in an unutilized or metabolized form [1]. The most prominent members of this group of drugs, i.e., ketoprofen, diclofenac, naproxen, ibuprofen and salicylic acid, show analgesic, anti-inflammatory, and antipyretic effects on humans [2,3]. NSAIDs are frequently detected in effluents, surface waters and seawater [4]. Industrial and municipal wastewaters are among their main sources and they may pollute groundwater supplies [5,6]. NSAID compounds have a weak acid character and a low tendency to adsorb into the sludge [3,7]. Ibuprofen is extensively metabolized in the liver and its metabolites show biochemical activity and toxicity, especially on invertebrates and algae [7]. Conventional wastewater treatments are not sufficient to eliminate or degrade the majority of these compounds, and they are only partially removed. The residues of NSAIDs remain in the treated water, and have been found to accumulate in drinking water [5,8]. Although their concentrations are generally at trace levels (ng/L to μg/L) in the environment, this amount may induce toxic effects [9]. They may influence the metabolism and synthesis of natural hormones in human body, even at very low concentration [6,9]. Hence, it is necessary to develop several techniques to remove these compounds from water. The elimination of NSAIDs has been reported through various techniques like adsorption, oxidation, heterogeneous photocatalysis, and combined membrane as well as electrochemical degradation [10,11,12,13,14,15,16,17,18].
Among the methods applied for the treatment of NSAIDs pollutants, adsorption is a low-cost process showing very high removal efficiency [2]. Activated carbon with hydrophobicity, surface functionality, pore structure, high surface area, and high adsorptive capacity is applied as an efficient adsorbent for water treatment, especially for water remediation with low pollutant concentration [2,5]. Antibiotics are the most studied pharmaceutical pollutants due to their relatively high concentrations in wastewaters [2,19,20]. Rare studies on NSAID removal from the aqueous phase on activated carbon can be found in the literature. Baccar et al. [9] investigated the adsorption of ibuprofen, ketoprofen, naproxen and diclofenac onto a low-cost activated carbon, prepared from olive-waste cakes. Low-cost carbonaceous materials such as carbon blacks were used as adsorbents for naproxen and ketoprofen [21]. The adsorption of salicylic acid, acetylsalicylic acid and diclofenac-Na on activated carbons was reported by Rakic et al. [22]. Bhadra et al. [23] studied adsorption of diclofenac sodium from aqueous solutions using surface-modified/oxidized activated carbons. Powdered activated carbon and activated carbon prepared from olive stones were used as adsorbents of diclofenac from the aqueous phase [24]. Chemically-activated carbon materials prepared from pine sawdust-Onopordum acanthiumL. were studied for the removal of diclofenac and naproxen from aqueous solutions [25]. A novel mesoporous activated carbon from an invasive weed, powdered activated carbons prepared from cork waste, chemically-surface-modified activated carbon cloths and a commercial microporous–mesoporous granular activated carbon modified by oxidation were used as adsorbents for removing ibuprofen from the aqueous phase [4,26,27,28]. Álvarez-Torrellas et al. [7] investigated the adsorption of ibuprofen onto a commercial granular activated carbon, multi-walled carbon nanotubes and two low-cost activated carbons (obtained from peach stones and rice husk).
Ordered mesoporous carbons (OMCs) with uniform mesopores, high pore volume and good chemical inertness display excellent adsorption properties [29]. OMCs were mainly obtained by a hard and soft-templating strategy [30]. Soft-templating is an effective and simple method for controlling the mesoporous structure of carbons (pH of the synthesis mixture influences the average pore size of the resulting carbons). Initial synthesis conditions, acidic or basic, affect average pore size, cross-linking and thickness of pore walls that determine chemical, mechanical and thermal stability of the resulting carbons [30,31,32].
In this work, new ordered mesoporous carbon materials ST-A-P, ST-A-P-CO2 and, for comparison, commercial activated carbon WG-15, were studied for the removal of ibuprofen, paracetamol and naproxen from aqueous solutions. In order to obtain ordered carbon materials with better surface and textural properties, ST-A-P carbon was activated with CO2. Surface properties of applied adsorbents were characterized by the following methods: nitrogen adsorption isotherms and scanning electron microscopy (SEM). The analysis of kinetic and equilibrium adsorption data was performed for all the studied adsorbents.

2. Materials and Methods

2.1. Materials and Reagents

Poly(ethylene oxide)-poly(propylene oxide)-poly(ethylene oxide) triblock copolymer, Pluronic F127 and resorcinol were purchased from Sigma-Aldrich, Hamburg, Germany, while ethanol (96%), methanol (98%), hydrochloric acid (35–38%) and formaldehyde from Chempur, Piekary Slaskie, Poland. Commercial active carbon (WG-15) was purchased from GRYFSKAND, Hajnówka, Poland. Paracetamol (N-(4-hydroxyphenyl)acetamide, 99%), ibuprofen (4-isobutyl-alpha-methyl-phenyl-ace-tic acid, 98%), naproxen ((S)-(+)-2-(6-Methoxy-2-naphthyl) propionic acid, 99%) were acquired from Alfa Aesar, Steinheim, Germany. The selected physicochemical properties of the adsorbates are presented in Table 1.

2.2. Preparation of Adsorbents

2.2.1. Synthesis Procedure

Mesoporous carbons were prepared by the soft-templating method according to a slightly modified recipe presented in the work of Choma et al. [34]. In a typical synthesis, 7.5 g of resorcinol and 7.5 g of Pluronic F127 triblock copolymer were dissolved in 35.7 cm3 of ethanol and 19.8 cm3 of water. After complete dissolution the reaction mixture was supplied with 2.2 cm3 of 37% hydrochloric acid as a catalyst and stirred for additional 30 min. Next, 7.5 cm3 of 37% formaldehyde was added into the synthesis mixture and stirred until it turned cloudy. It was then left to separate into two layers. The polymer-rich bottom layer was spread onto quartz boats and transferred to an oven at 100 °C for 24 h. Thermal treatment and carbonization of the resulting film were performed in the tube furnace under nitrogen flow using temperature program: 1 °C/min up to 400 °C, then 5 °C/min up to 850 °C and held for 2 h. The samples were labelled according to the formula ST-A-P.

2.2.2. Activation of Mesoporous Carbon

The obtained ST-A-P material was activated with CO2, according to a slightly modified recipe of Wickramaratne and Jaroniec [35]. Post-synthesis activation of mesoporous carbon (ST-A-P) was performed by placing a quartz boat with 3 g of ST-A-P in a ceramic tube furnace under flowing nitrogen with a heating rate of 10 °C/min up to 850 °C. After reaching this temperature, the activating gas was introduced to the tube furnace (50 cm3/min) for 8 h, and then switched back to nitrogen to prevent further activation during the cooling process. The selection of activation conditions was based on previous studies (activation time 4–8 h). Taking into account the structural parameters, the optimal activation time was 8 h. The obtained activated materials are denoted as ST-A-P-CO2.

2.3. Characterization of the Adsorbents

Porous structures of adsorbents were characterized using the methods of low-temperature nitrogen adsorption-desorption isotherms (−196 °C) on a volumetric adsorption analyzer ASAP 2020 by Micromeritics (Norcross, GA, USA) (Structural Research Laboratory of Jan Kochanowski University in Kielce). Before adsorptive measurements, all the samples were degassed at a temperature of 200 °C for 2 h. On the basis of experimental low-temperature nitrogen adsorption isotherms for the investigated adsorbents, standard parameters of the porous structure were determined [36,37,38,39,40,41]. The specific surface area of investigated carbon materials was determined with the Brunauer-Emmett-Teller (BET) method. SBET was determined in the range of relative pressure from 0.05 to 0.2, considering the surface occupied by a single molecule of nitrogen in an adsorptive monolayer (cross-sectional area equal 0.162 nm2) [36]. Total pore volume (Vt), being the sum of micropores volume (Vmi) and mesopores (Vme) was determined from one point of nitrogen adsorption isotherm, corresponding to the relative pressure p/p0 equal 0.99 [37].
Images of investigated materials were obtained by the SEM Zeiss mod. Ultra Plus, EDS Bruker Quantax 400. Voltage applied during the measurements was 2 kV.
Functional groups on the surface of ST-A-P, ST-A-P-CO2, and WG-15 adsorbents were identified using Boehm’s titration method [42,43]. The procedure was as follows: 0.2 g of carbon adsorbents was dispersed in solution of sodium bicarbonate, sodium carbonate, sodium hydroxide, sodium ethoxide, and hydrochloric acid, and then shaken for 48 h at room temperature. Next, the adsorbent was filtered and 10 cm3 of filtrate were titrated with 0.1 mol dm−3 HCl in order to determine acidic groups, together with 0.05 mol dm−3 NaOH to determine total basic groups [44]. The identified functional groups were calculated as mmol/g.

2.4. Adsorption Studies from Aqueous Solutions

For adsorption studies, ordered mesoporous carbon materials were applied, with grain sizes ranging from 0.2 to 0.8 mm. Before proceeding into the proper experiments, the carbon was dried in the laboratory dryer at a temperature of 100 °C until a constant mass of adsorbents was obtained. Due to the large adsorptive capacity of carbon adsorbents, the used adsorbent mass was determined experimentally to minimize errors in weighing at an optimal value 0.01 g for a range of adsorbates concentrations used in adsorption experiments.
Concentrations of paracetamol, ibuprofen, and naproxen in solutions before and after the adsorption were determined with the spectrophotometric method, using a UV spectrophotometer Shimadzu UV-1800. The wavelengths used for determination of studied adsorbates concentrations were specified from their absorption spectra: 243 nm (paracetamol), 221 nm (ibuprofen), and 273 nm (naproxen). Adsorption studies were carried out in 100 cm3 Erlenmeyer’s flask. 0.01 g of mesoporous carbon was added to each flask and then 10 cm3 of pharmaceuticals solution, with defined concentration. Then the flasks with all adsorbents and adsorbates solutions were transferred into the incubator for a defined period of time: 30, 60, 120, 240, 300, 360, and 1440 min.
The measurements were carried out at a constant temperature of 25 °C, at pH 6, and mixing rate 150 rpm. After removing samples from the incubator, carbon was separated from paracetamol and NSAID with the cup-type centrifuge. Next, the absorbance of the pharmaceuticals was measured with the spectrophotometer at a proper wavelength.
Kinetic data ST-A-P, ST-A-P-CO2 and WG-15 for paracetamol, ibuprofen, naproxen adsorption on all the studied adsorbents was determined for initial concentration 300 mg dm−3.
On the basis of calibration, curve concentrations of adsorbates (before and after adsorption) were calculated. Consequently, the value of adsorption qt (mg g−1) was calculated from the formula given below:
q t   =   ( C 0     C t ) V m
where C0—concentration of adsorbate in solution before adsorption (mg dm−3); Ct—concentration of adsorbate in solution after adsorption, after time t (mg dm−3); V—volume of the solution used for adsorption (dm3); m—adsorbent mass (g).
Adsorption measurements in equilibration conditions: adsorption isotherms were determined for initial concentrations of paracetamol, ibuprofen and naproxen: 50, 100, 200, 300, 400, 500, 700 mg dm−3.
The prepared Erlenmeyer’s flask with the studied adsorbent was filled with 10 cm3 of adsorbate (with appropriate concentration) and placed in the incubator for 360 min. Time of measurements was a result of previous kinetic investigations.
The amount of adsorbate at equilibrium and the percentage of pharmaceuticals removal with the adsorbent were calculated by applying Equations (2) and (3):
q e   =   ( C 0     C e ) V m
% Removal   =   ( C 0     C e ) C 0 × 100
where Ce—equilibrium concentration (mg dm−3).

3. Results and Discussion

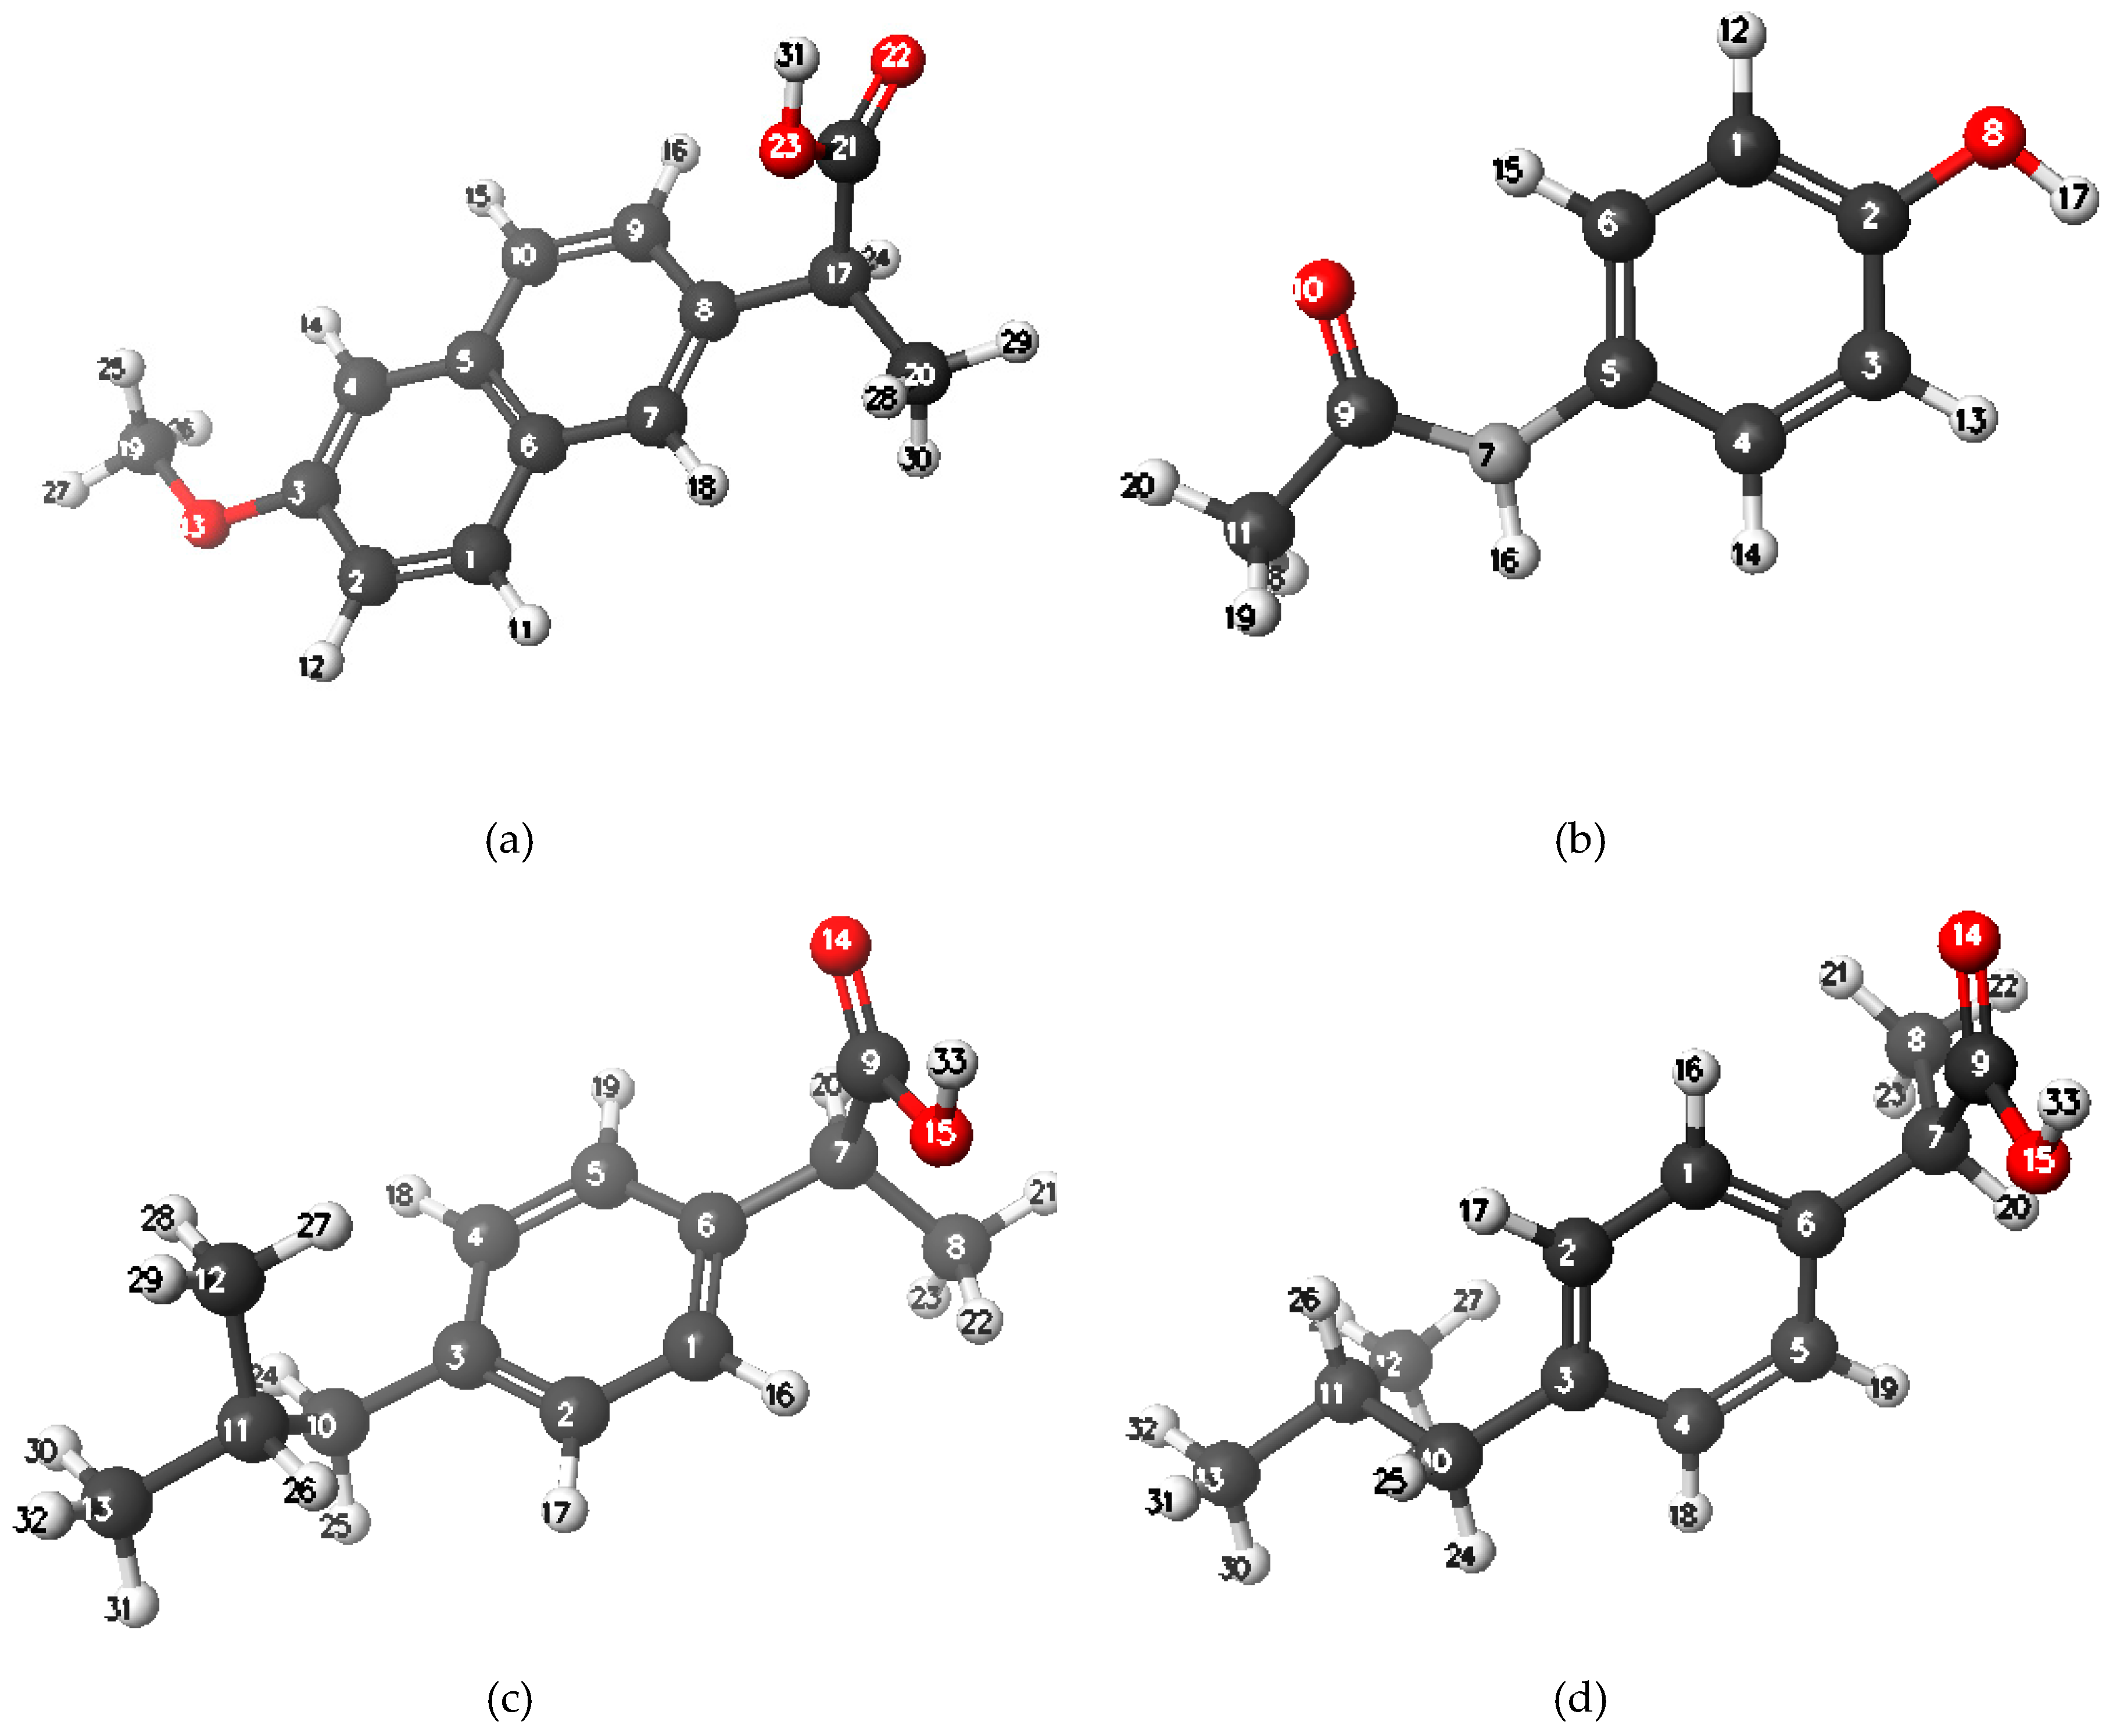
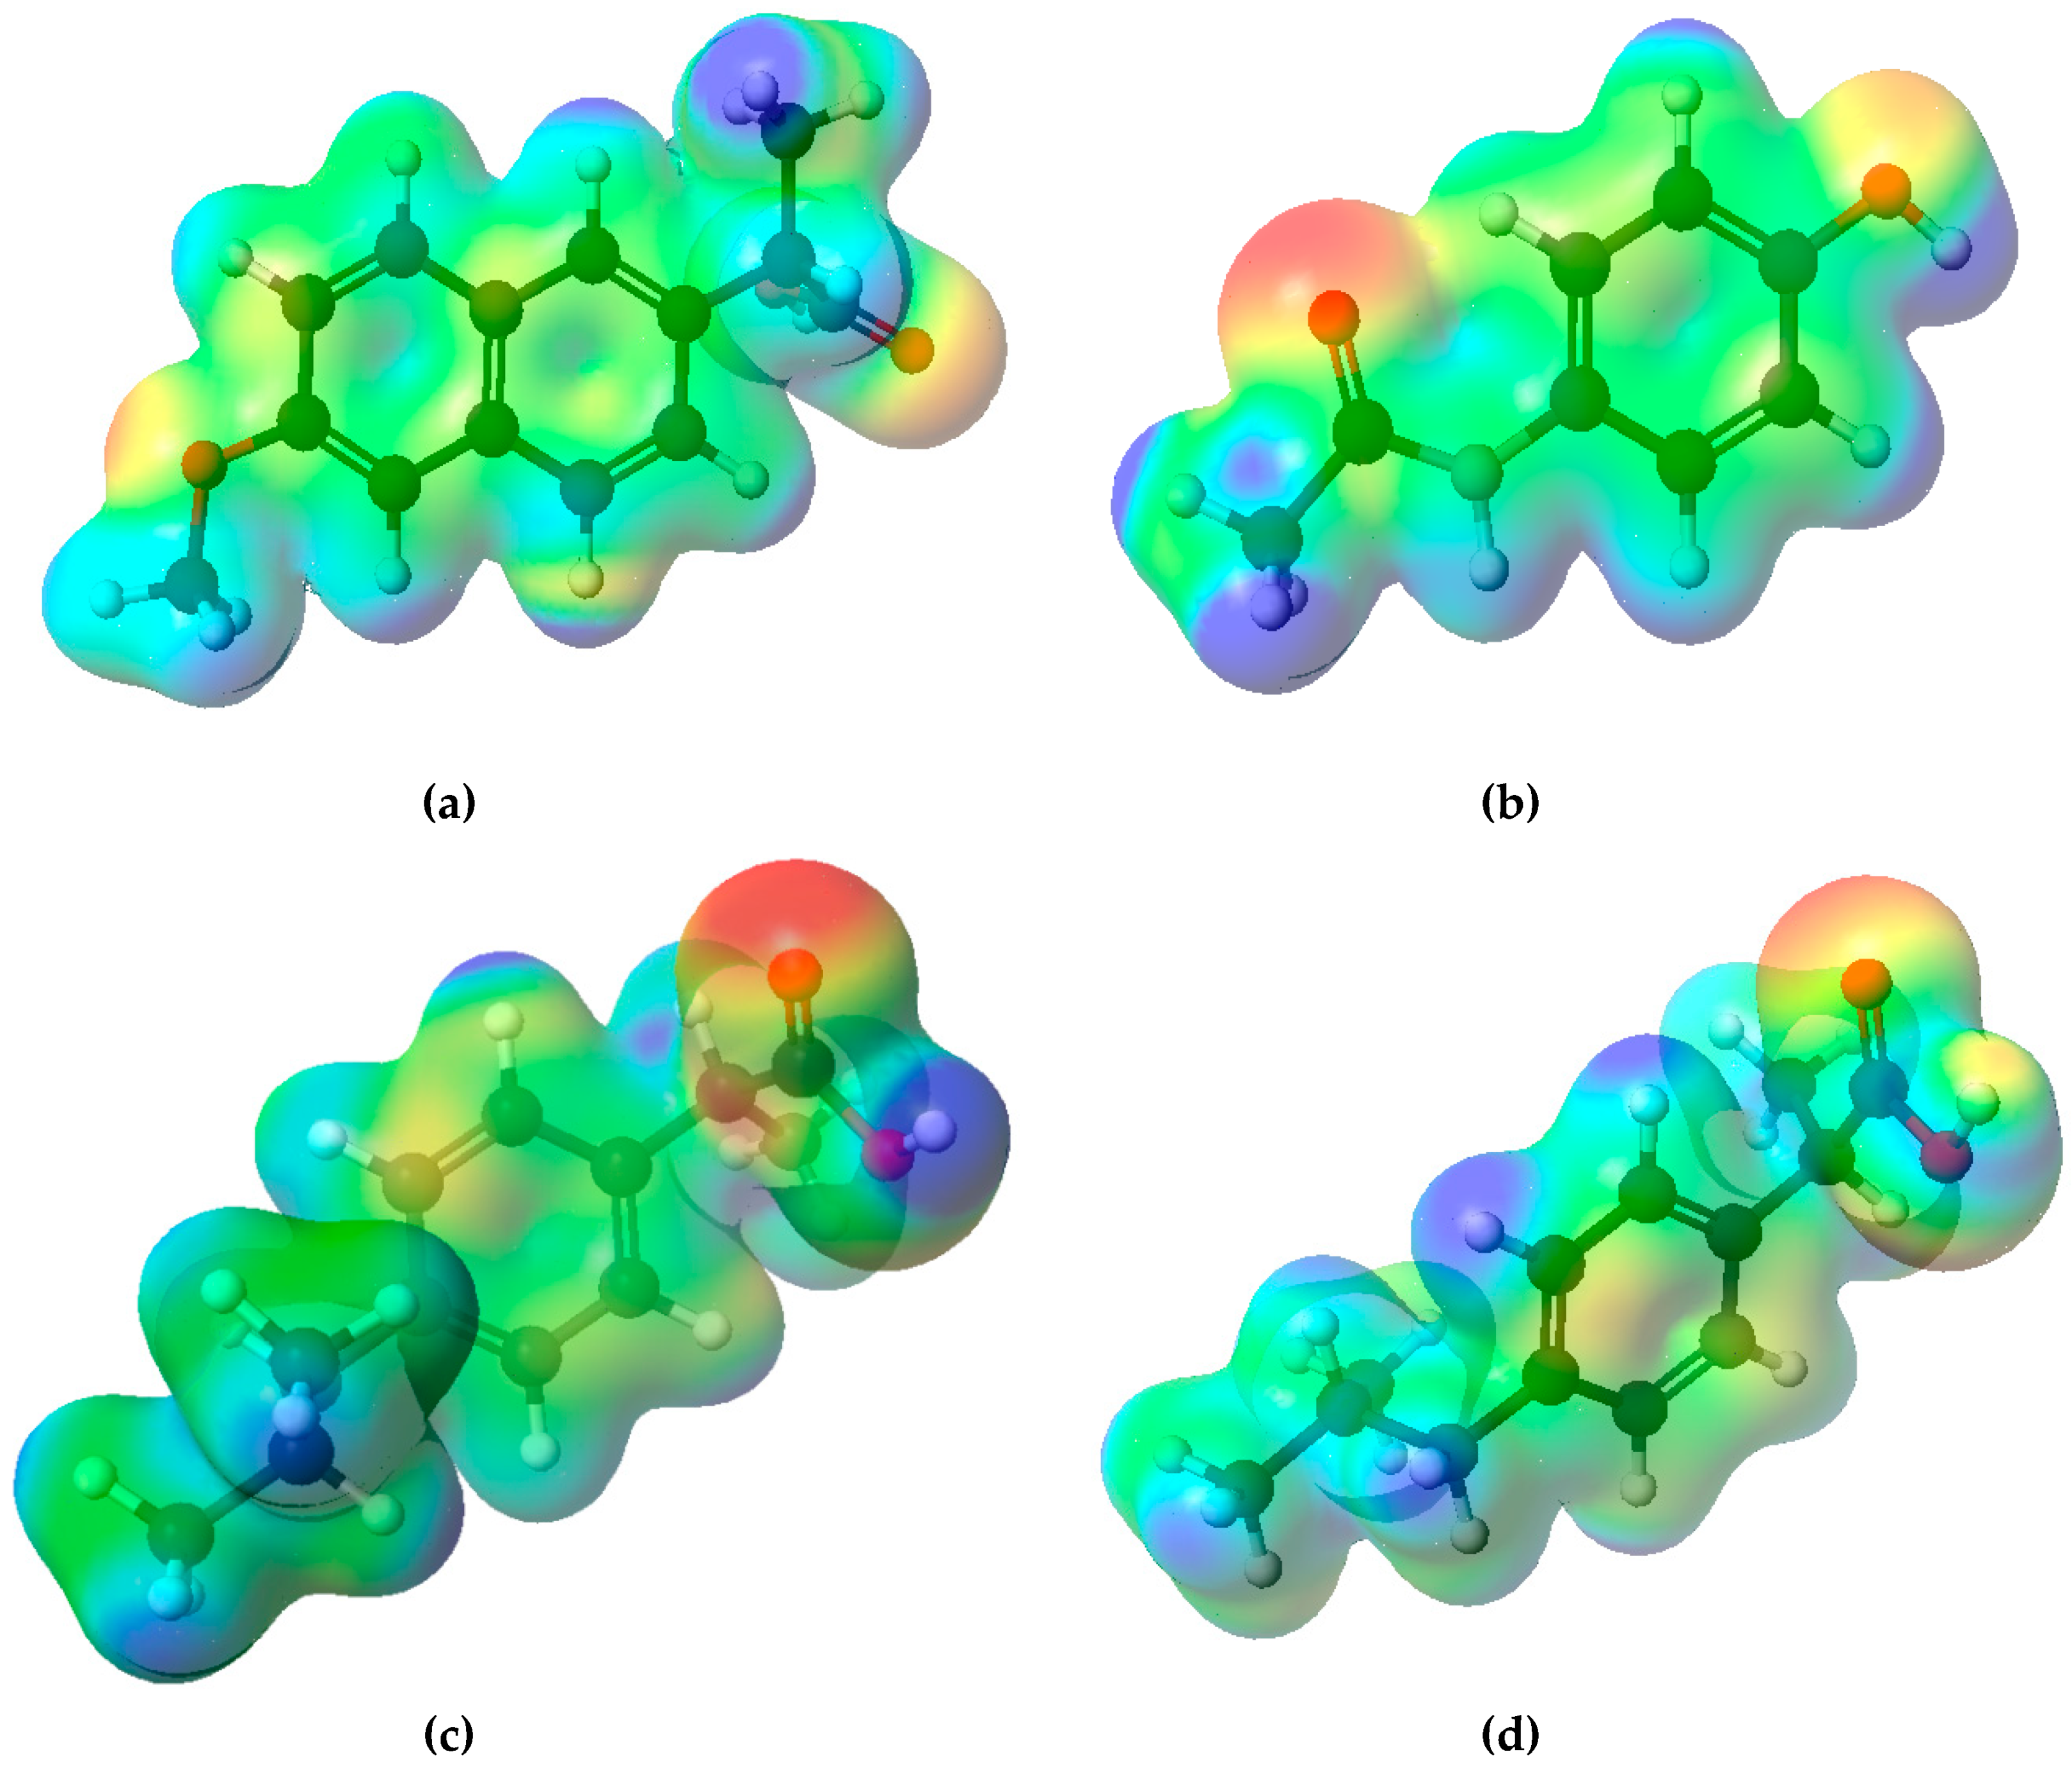
3.1. Computational Calculation

Computational Methodology

The commercial SCIGRESS program in version FJ 2.7 was used to perform theoretical calculation. Geometry optimization of molecules was made using the DFT method with the B88-LYP GGA functional and the DZVP basis set.

Calculations

The optimized chemical structures of (S)-naproxen, paracetamol, (S)-ibuprofen and (R)-ibuprofen are shown in Figure 1. This is confirmed by the drawing of the electrostatic potential energy maps presented in Figure 2. These maps show charge distributions in molecules three-dimensionally, and make it possible to visualize the differently charged regions of a molecule. Knowledge of charge distributions can be helpful to explain how molecules interact with the surface of adsorbent containing different functional groups. Although DFT methods such as GGA do not fully include van der Waals interactions [45,46,47,48], they make it possible to show the differences between molecules. Possible changes in the distribution of electron density (under the influence of weak distance-dependent forces) were taken into account, but as these forces would work on all molecules, this calculation is sufficient for comparing their electronic structures. A strong negative potential occurs around -C=O group, but also around -OH group, present in molecule of paracetamol (Table 2). These two areas are in opposition to the remaining slightly positive part of the molecule. Similar distribution of charges is for (S)-naproxen. In this molecule, there are also two separate areas where the negative charge is accumulated. Ibuprofen has one clearly visible center with negative potential (Figure 2, Table 2).

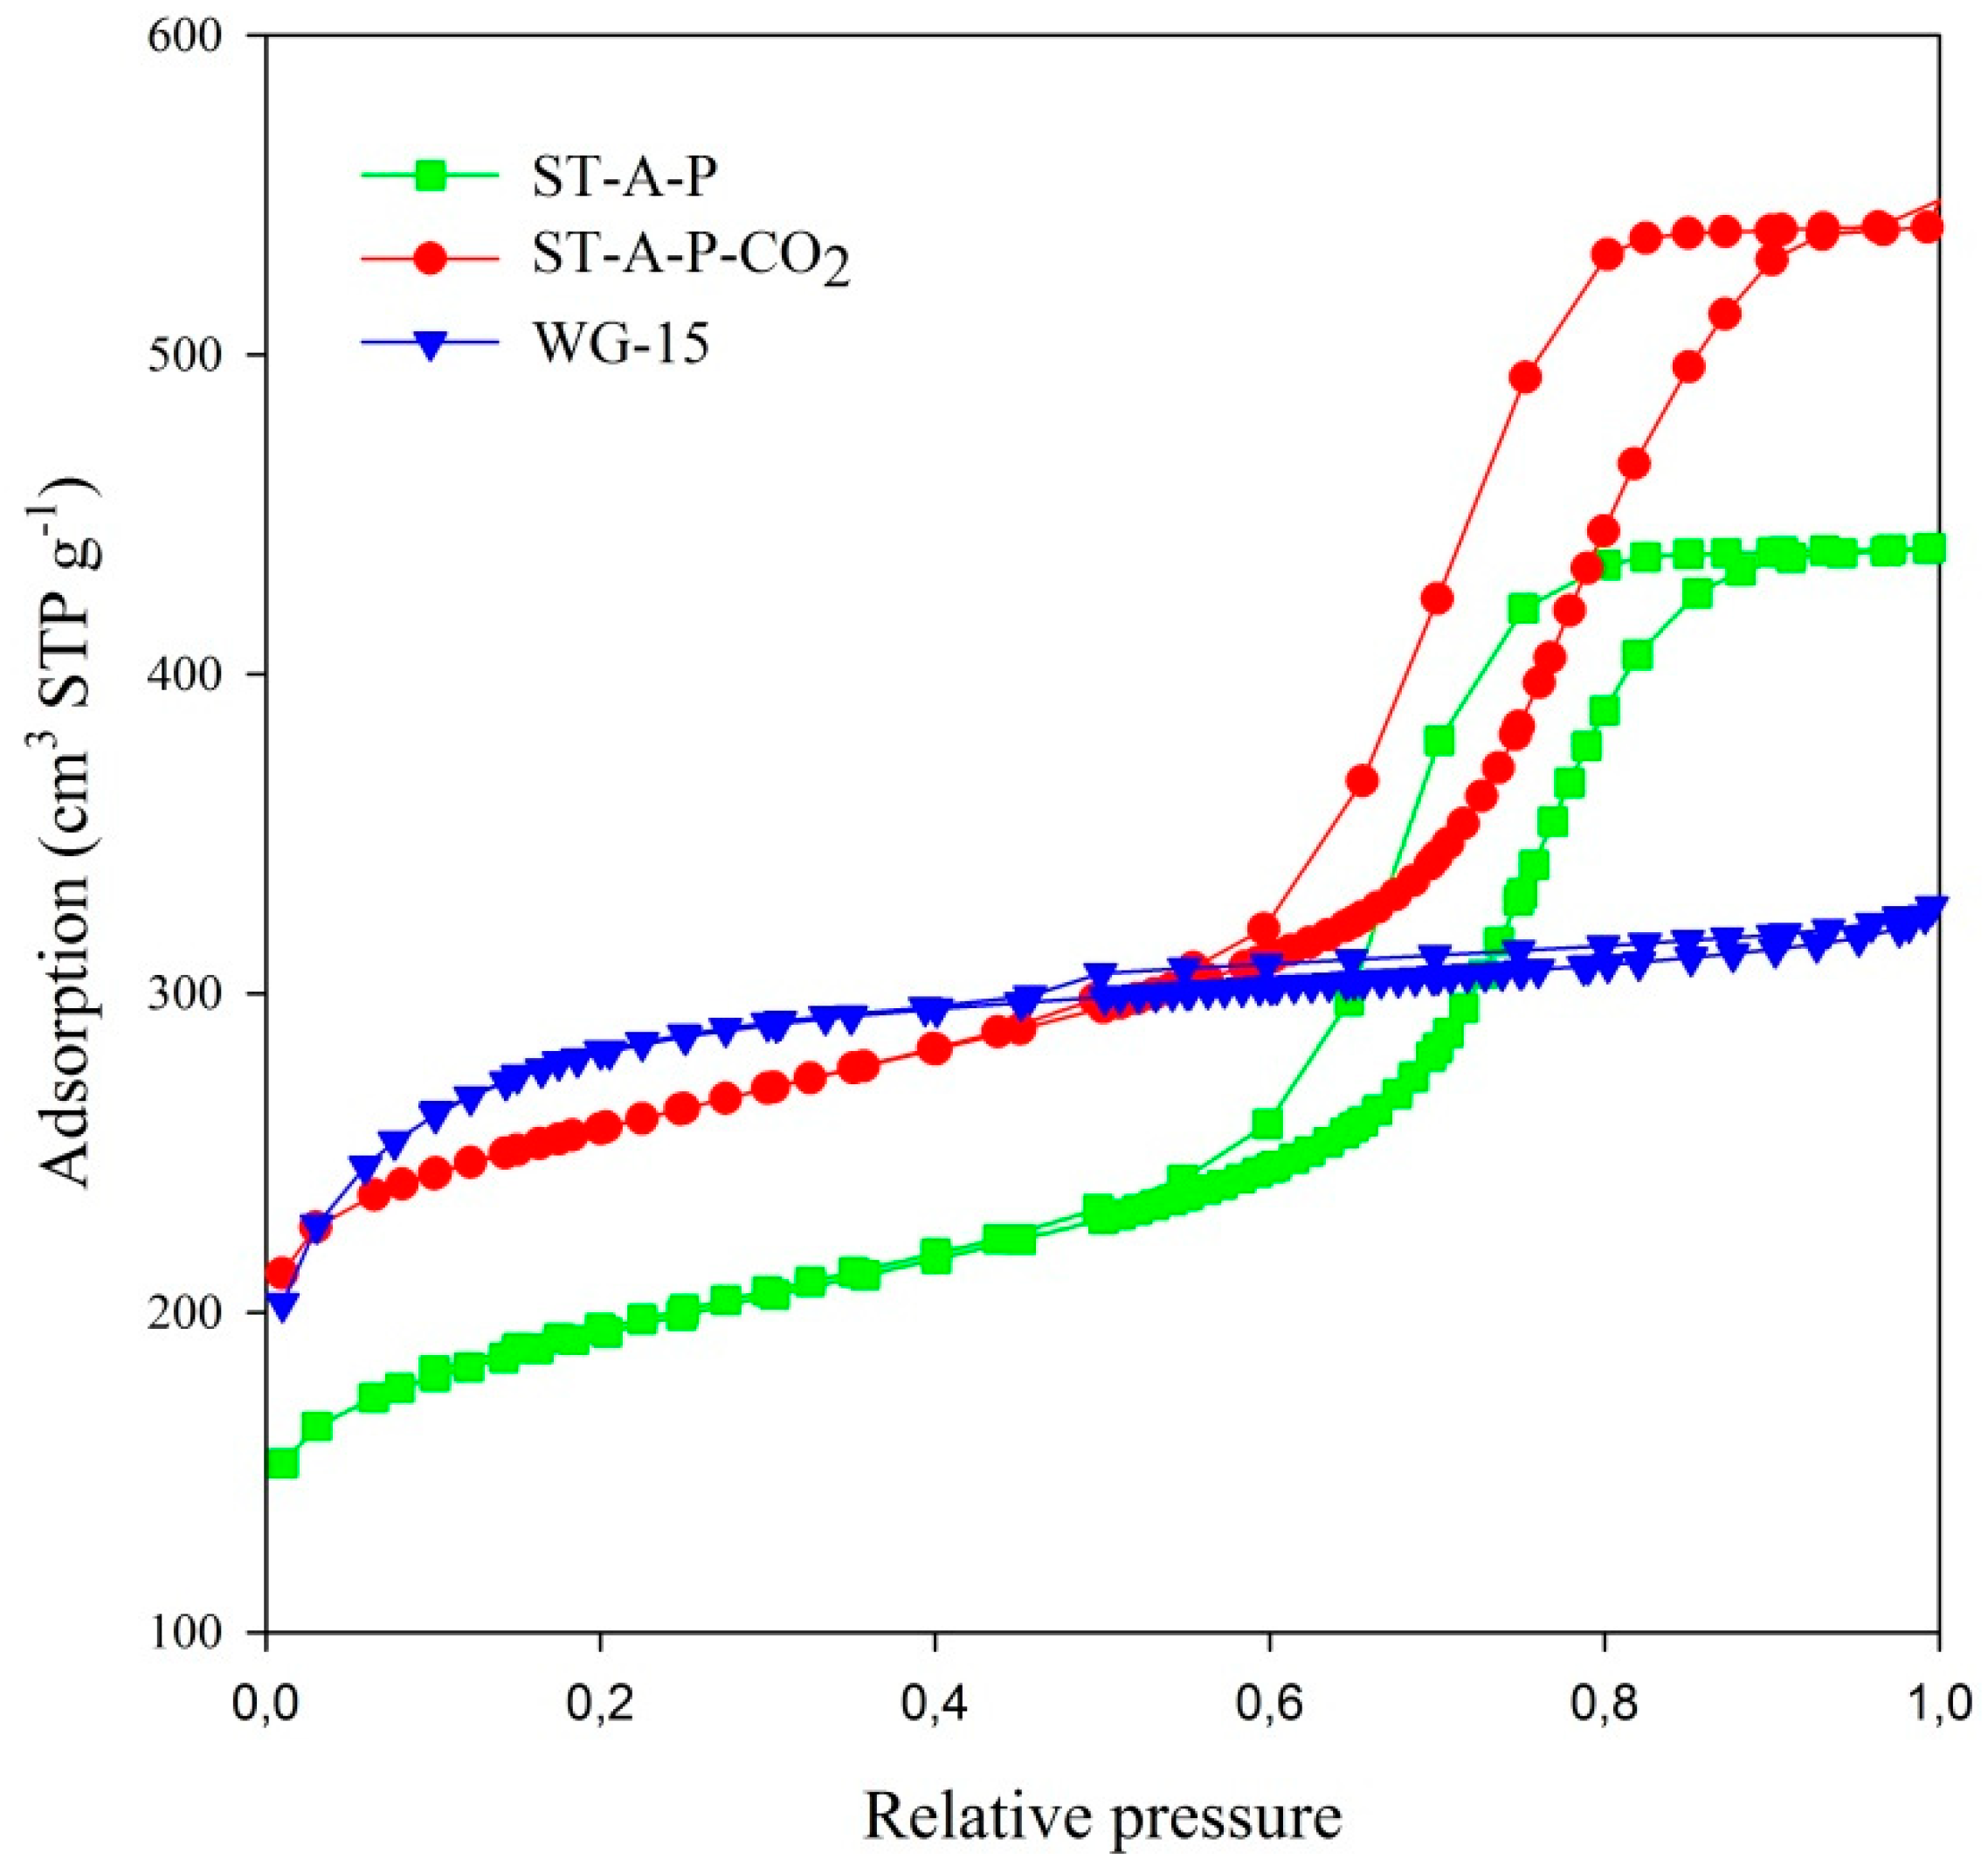
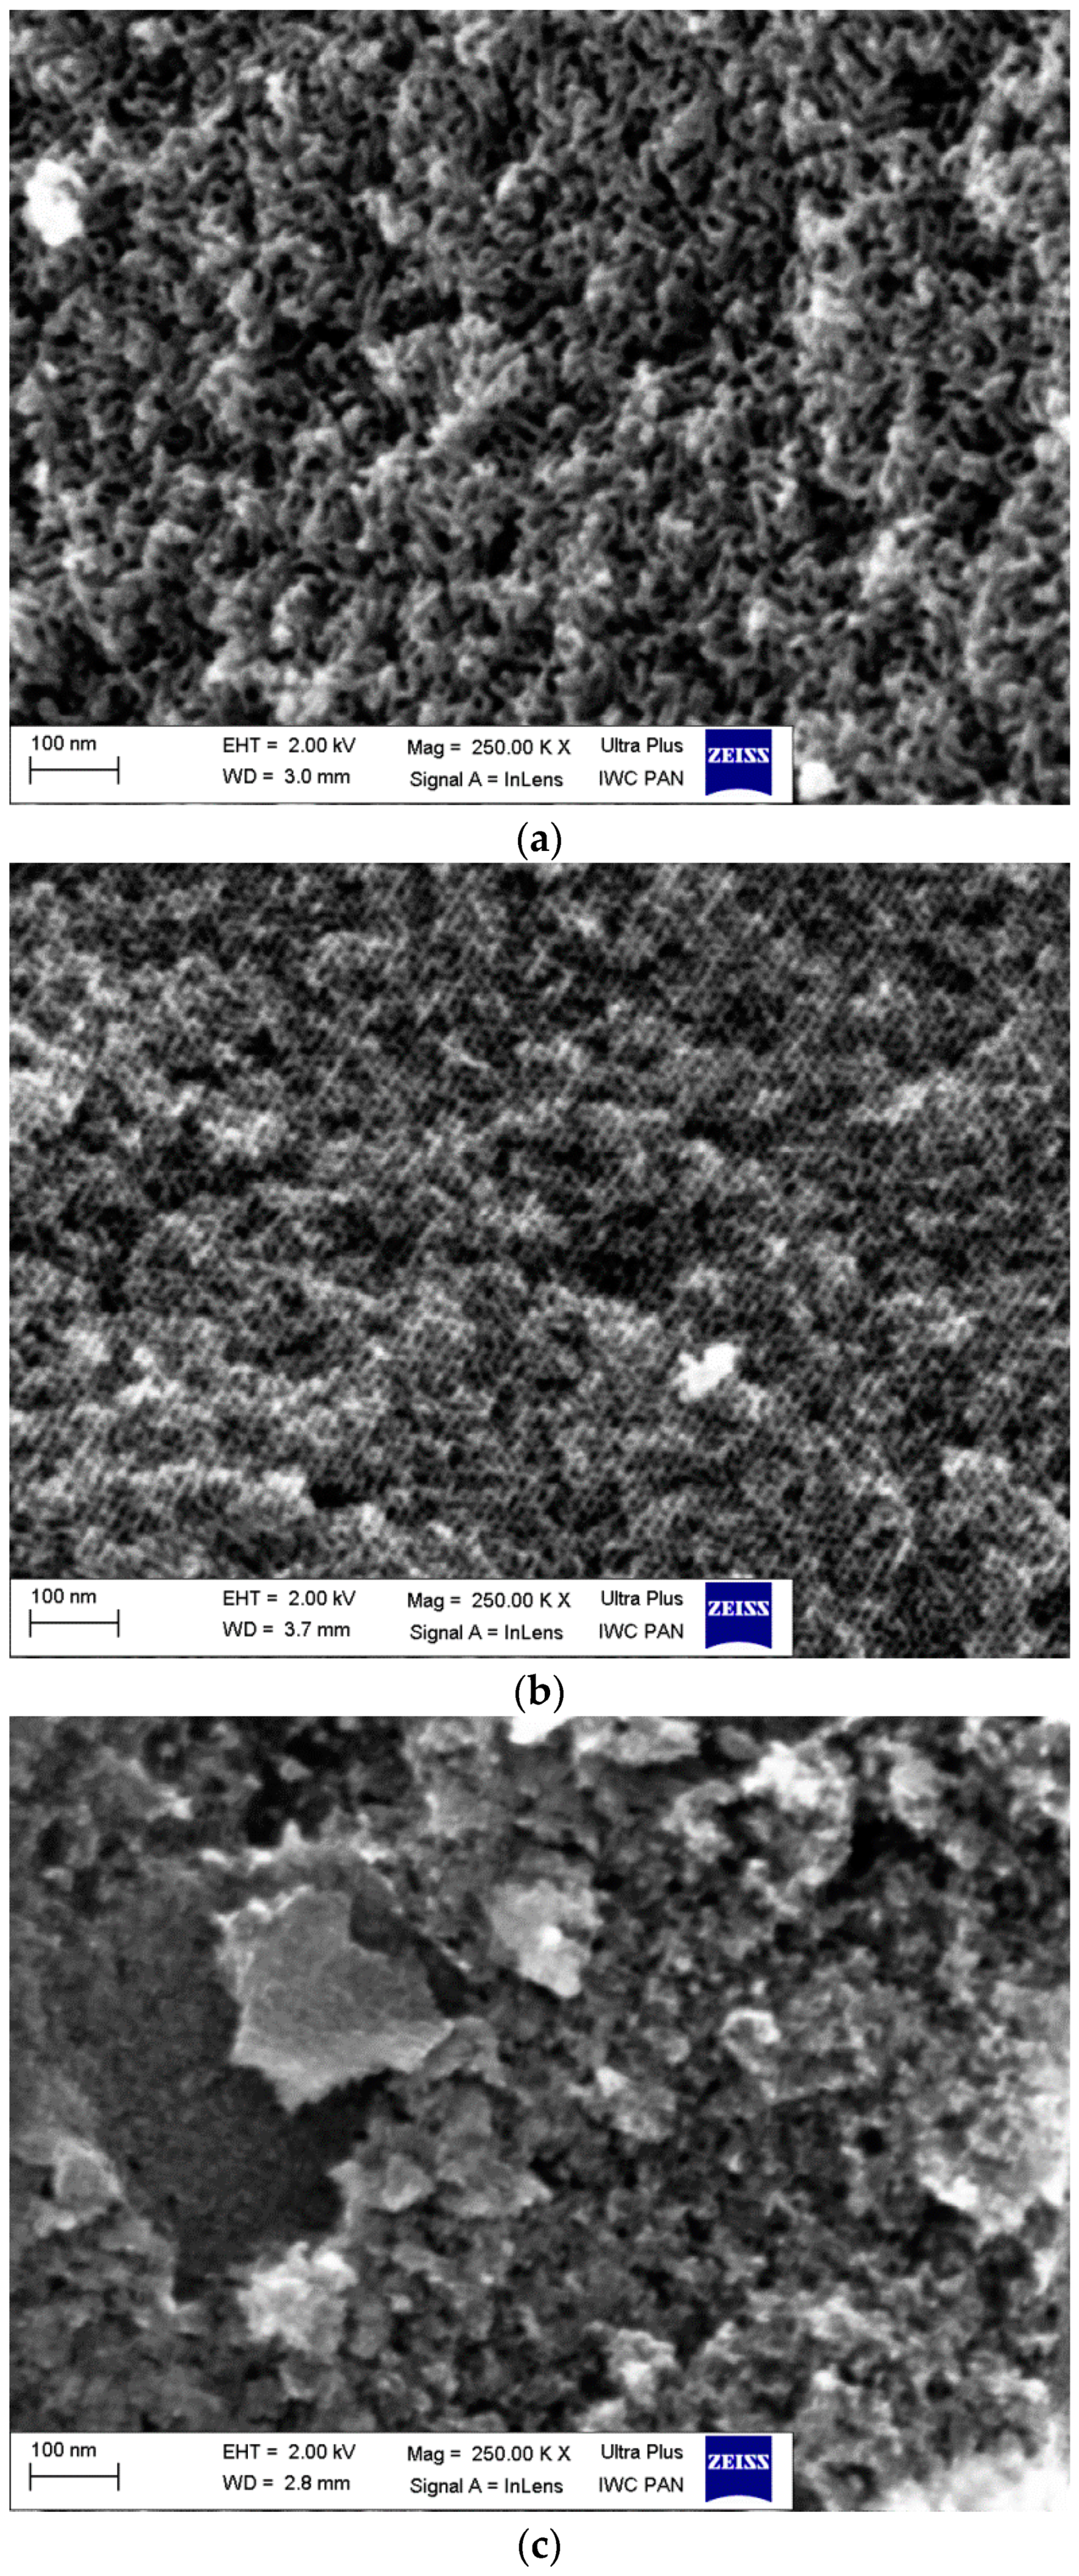
3.2. Characterization of Adsorbents

Nitrogen adsorption isotherms measured at −196 °C are presented in Figure 3. According to IUPAC classification of adsorption isotherms [49], experimental isotherms for the materials studied (ST-A-P and ST-A-P-CO2) are type-IV, which is characteristic of mesoporous solids. H1 hysteresis loops confirm the presence of accessible mesopores. Isotherm for the WG-15 carbon is type I, according to IUPAC classification of adsorption isotherms [49]. The type-I isotherm indicates high adsorption in the range of low relative pressures, i.e., refers to adsorbents with the highly developed microporosity (porosity, which forms pores with linear dimensions less than 2 nm). In the area of medium and high relative pressures, the isotherm for WG-15 carbon has a course almost parallel to the abscissae axis, which indicates that mesoporosity (pores with dimensions of 2 to 50 nm) is poorly developed [50]. The type-H4 hysteresis loop for WG-15 carbon is associated with narrow slit pores, but now includes pores in the micropore region.
Structural parameters calculated from adsorption isotherms are presented in Table 3.
The adsorbents ST-A-P-CO2 and WG-15 have comparable values of specific surface area. Mesoporosity is clearly higher for ST-A-P and ST-A-P-CO2 materials in comparison to commercial activated carbon WG-15. This means that the studied ordered carbons are in fact mesoporous, with the significant advantage of mesoporosity over microporosity.
The ST-A-P sample presented interesting a mesoporous structure with visible canals of mesopores (Figure 4a). After CO2 activation, the adsorbent structure is changed (ST-A-P-CO2 sample) and the ordered microporous-mesoporous structure of this material which is “similar to honeycomb” (Figure 4b) can be observed. WG-15 sample shows a non-ordered structure as compared to ST-A-P and ST-A-P-CO2 samples (Figure 4c).

Functional Groups on the Adsorbents Surface

Due to the presence of heteroatoms in the carbon precursor structure, and the reaction of carbonization product with the ingredients of atmosphere during the synthesis of carbonaceous materials, groups having the character of functional groups with acid-base or redox character are formed on their surface [51].
The results obtained for determining surface groups using the Boehm method are collected in Table 4. Acidic to basic groups ratio is approximately 3:1 for ST-A-P, 1.5:1 for ST-A-P-CO2, and 1:3.6 for WG-15. Phenolic and carboxyl groups are identified on the ST-A-P and STA-P-CO2 adsorbents. In the case of commercial activated carbon, only carbonyl group are present, but in higher amounts in comparison to those it mesoporous carbon materials ST-A-P and ST-A-P-CO2.

3.3. Adsorption Study

Removal efficiencies of paracetamol, ibuprofen, and naproxen by adsorbents ST-A-P, ST-A-P-CO2, and WG-15 are presented in Figure 5. The results show that new mesoporous carbon materials ST-A-P and ST-A-P-CO2 adsorb paracetamol and naproxen better than adsorbent WG-15 from aqueous solutions. The removal efficiency is 95% and 98% for paracetamol and naproxen, respectively, i.e., for adsorption on adsorbents activated by CO2. The adsorption of ibuprofen is comparable or weaker for ST-A-P, ST-A-P-CO2, and WG-15 adsorbents. The best results are obtained for adsorption on all the studied adsorbents for naproxen (82% ST-A-P, 98% ST-A-P-CO2, 63% WG-15).
Charge distributions of the studied adsorbate molecules (Table 2) confirmed the presence of two areas with strong negative potential around –C=O and –OH groups for the molecule of paracetamol and (S)-naproxen. Ibuprofen has only one center with negative potential in its molecule. This knowledge of charge distributions can be helpful to explain why paracetamol and naproxen can react stronger with adsorbent surface with a large number of acidic groups (ST-A-P and ST-A-P-CO2) in comparison to ibuprofen facilitating more efficient adsorption of these pharmaceuticals on the ordered mesoporous carbons. Basic groups are dominant on the surface of WG-15, pointing to the different chemical and structural properties of this adsorbent compared with ST-A-P and ST-A-P-CO2 materials. This fact suggests that the presence of acidic groups promotes adsorption of paracetamol and naproxen more strongly than the presence of basic groups on the surface of adsorbent. The molecules of adsorbates occur mainly in neutral forms under used experimental conditions during our research. According to literature data [52], three different mechanisms of adsorption of aromatic compounds on carbonaceous materials are possible: dispersive interactions by π electrons, donor-acceptor electron complexes, and hydrogen bond formation. The mechanism of paracetamol adsorption on the surface of activated carbon containing mainly oxygen functional groups occurs through π electron interactions because the possibility of forming Lewis acid-base complexes or hydrogen bonds [52]. Acidic groups containing oxygen atoms are predominant on the surface of ST-A-P and ST-A-P-CO2 adsorbents, so one can expect that the interactions between paracetamol and naproxen molecules with the surface of these adsorbents can be similar. Comparable adsorption efficiency on ST-A-P and WG-15 adsorbents for ibuprofen suggests that the adsorption mechanism is also influenced by other factors (Figure 5). More detailed explanations of why ibuprofen adsorption presents the opposite trend compared to paracetamol and naproxen adsorption require further studies.

3.3.1. Kinetic Models

When designing adsorption experiments, knowledge about the kinetics of adsorption is of great importance because it can be used to determine adsorption process rate of a solute on the adsorbent surface [26]. Pseudo-first-order kinetic model [53], pseudo-second-order kinetic model [54], fractal-like kinetic models [55,56,57,58] and intra-particle diffusion model [59] were investigated for the adsorption of paracetamol, ibuprofen, and naproxen on ST-A, ST-A-CO2 and WG-15 adsorbents.
The linear form pseudo-first-order kinetic model is as follows:
ln ( q e q t )   =   lnq e k 1 t
where k1—pseudo-first order rate constants (min−1); t—time of contact between the adsorbent and adsorbate (min); qe—amount of adsorbate at equilibrium (mg g−1); qt—amount of adsorbate at time t (mg g−1).
The linear form pseudo-second-order kinetic model found below is:
t q t   =   1 k 2 q e 2 + t q e
where k2—pseudo-second order rate constants (g mg−1 min−1).
The fractal-like pseudo-first-order and fractal-like pseudo-second-order kinetic equations are as follows [58]:
q   =   q e [ 1     exp ( k 1 , 0 t α ) ]
q   =   k 2 , 0 q e 2 t α 1 +   k 2 , 0 q e t α
where k1,0′, k2,0′ are the rate coefficients of fractal-like pseudo-first-order and fractal-like pseudo-second-order equations; kn,0′(n = 1,2) = kn,0/α, and α = 1 − h, h is a constant parameter (0 ≤ h ≤ 1).
Adsorption kinetics for paracetamol, ibuprofen, and naproxen on ST-A-P, ST-A-P-CO2, WG-15 are shown in Figure 6a–c. The adsorption equilibrium was settled after 360 min for all the studied pharmaceuticals.
The pseudo-first order and pseudo-second order rate constants, k1 and k2, calculated and experimental adsorption capacities, qe, as well as values of correlation coefficients (R2) are collected in Table 5. Fractal-like pseudo-first order and fractal-like pseudo-second order rate constants, k1,0′ and k2,0′, values of α and correlation coefficients (R2) are collected in Table 6. Correlation coefficients obtained when the pseudo-first-order kinetic model, fractal-like pseudo-first order and fractal-like pseudo-second order models were applied are lower for all the investigated adsorbates than the values obtained for the pseudo-second order model. Also, qe values calculated for the pseudo-first-order kinetic model show great differences against experimental values. The values of R2 are clearly higher when pseudo-second order model was applied. Moreover, the calculated and experimental adsorption capacities are the most compatible. For this reason, we concluded that adsorption of the studied compounds on carbon adsorbents adsorption obey the pseudo-second-order kinetic model, suggesting the chemisorption as adsorption process.
Weber-Morris diffusion model was used in order to investigate adsorption mechanism of the studied compounds on the applied adsorbents. The diffusion model is presented by the following equation:
q t   =   k id   t 1 / 2 + c
where kid—intra-particle diffusion rate constant (mg g−1 min−1/2) and c—intercept, which represents the thickness of the boundary layer (mg g−1).
The values of kid1, kid2 and c1, c2 determined from the slopes and intercepts of the first and second linear part of graph (Figure 6d–f) are given in Table 7. Constant values kd1 decrease in the following order: paracetamol > ibuprofen > naproxen for ST-A-P and ST-A-P-CO2 adsorbents. For WG-15 adsorbent, the following range was obtained: paracetamol ≈ ibuprofen > naproxen. In turn, for all the studied adsorbents, the rate of diffusion is the smallest for naproxen, i.e., for the adsorbate of the highest molecular weight.
If the adsorption that occurred was only due to intra-particle diffusion, then the dependency qt vs. t1/2 would be rectilinear in the whole range. In addition, the curve would pass through the origin of the graph. Multi-linear plot (broken line on the graph) indicates that in the adsorption process several steps take part, not just intra-particle diffusion. The first section on the graph corresponds to the faster step, which could be attributed to the diffusion of adsorbate molecules from the aqueous phase to adsorbent outer surface. The second part of the graph reflects slower adsorption, where intra-particle diffusion is a controlling step of the whole adsorption process. As shown in Figure 6d–f, none of the curves crossed through the origin of the plot, which suggests that intra-particle diffusion is not the only limiting step in adsorption of the studied pharmaceuticals from aqueous solutions. What is more, the plot qt vs. t1/2 clearly indicates that the adsorption rate depends not only on intra-particle diffusion [60].

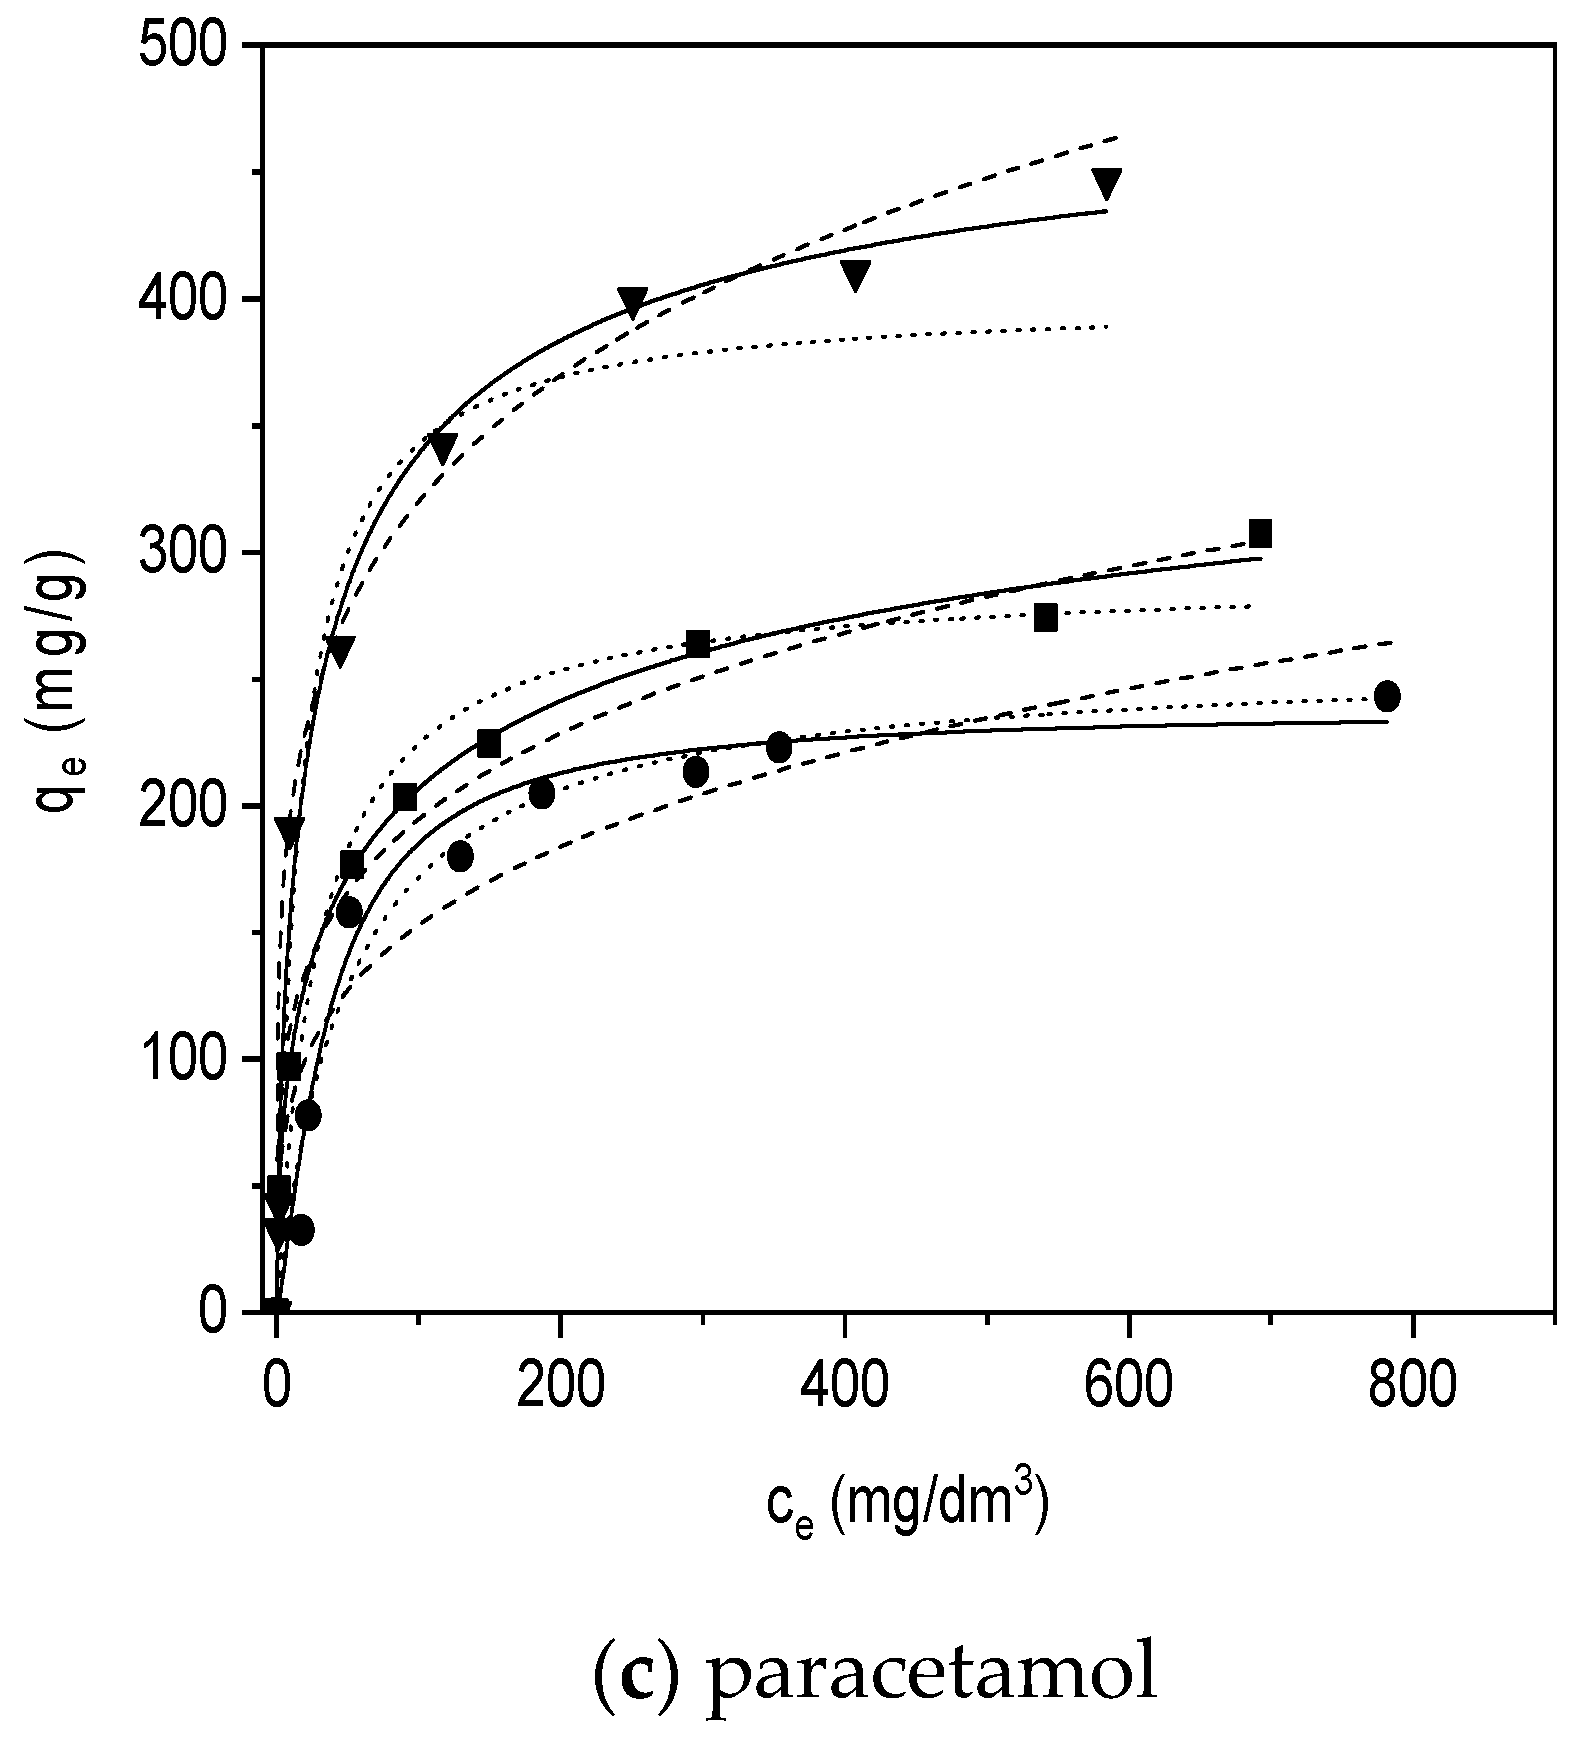
3.3.2. Adsorption Isotherms

Equilibrium study on adsorption provides information about a distribution of adsorbate molecules between the liquid and the solid phases [9]. Several mathematical models were used to describe experimental data of adsorption isotherms. The most widely used adsorption isotherm models for adsorption of NSAIDs on carbonaceous materials are: Langmuir isotherm [61,62,63], Freundlich isotherm [62,64,65], Langmuir-Freundlich, and Temkin models [66,67,68].
Freundlich, Langmuir, and Langmuir-Freundlich models were employed to analysis adsorption data obtained in experiments. Temkin isotherm model, taking into consideration the effects of indirect adsorbate/adsorbate interactions during the adsorption process, assumes that adsorption heat of all molecules in the adsorption layer decreases linearly with increasing coverage of adsorption surface only for an intermediate range of concentrations [69,70,71]. Adsorption isotherms were determined for initial concentrations of paracetamol, ibuprofen and naproxen from 50 to 700 mg dm−3. That is why it was decided that the Temkin model is not suitable for our experimental conditions.

Langmuir Model

The Langmuir model is widely used for the adsorption of different compounds from aqueous solutions, assuming that adsorbate molecules form a monolayer on the adsorbent surface which contains a specific number of identical sites [61]. This model is the most common model used to quantify the amount of adsorbate on an adsorbent as a function of concentration at a given temperature. Langmuir equation is expressed by relation (9):
q e = q m K L C e 1 + K L C e
where Ce—equilibrium concentration of solute in aqueous solution (mg dm−3); qe—the amount of solute adsorbed per gram of the adsorbent at equilibrium (mg/g), qm—maximum monolayer coverage capacity (mg g−1); KL—Langmuir isotherm constant (dm3 g−1).

Freundlich Model

The Freundlich isotherm model is an empirical equation describing the adsorption on heterogeneous adsorbents [64]. This equation can be expressed as follows:
q e = K F C e 1 / n
where KF—Freundlich constant for a heterogeneous adsorbent (mg1−1/n (dm3)1/n g−1), 1/n—the heterogeneity factor (the smaller 1/n, the greater the expected heterogeneity).
The Freundlich isotherm constant is an approximate indicator of adsorption capacity, while 1/n is a function of the strength of adsorption in the adsorption process [64]. If the value 1/n satisfies the condition 1/n < 1, this indicates a favorable adsorption process [72].

Langmuir–Freundlich Model

The Langmuir–Freundlich isotherm (Sip’s equation) is represented by the expression that combines both Langmuir and Freundlich behaviors [66].
A general form of Langmuir–Freundlich isotherm equation is given below:
q e = q m ( K LF C e ) n 1 + ( K LF C e ) n
where Ce—equilibrium concentration of solute in an aqueous solution (mg dm−3); qe—the amount of solute adsorbed per gram of the adsorbent at equilibrium (mg/g), qm—maximum monolayer coverage capacity (mg g−1); KLF—Langmuir–Freundlich isotherm constant (dm3 g−1), n—heterogeneity index.
Fitting of the experimental data to the isotherm models described above was done using non-linear regression (Levenberg–Marquardt least square method with the Origin Microcal software); the results are shown in Figure 7. Langmuir, Freundlich, and Langmuir-Freundlich equations parameters as well as correlation coefficients R2 for the adsorption of paracetamol, ibuprofen and naproxen on non-activated as well as activated ordered mesoporous carbons (ST-A-P, ST-A-P-CO2), and activated carbon WG-15 are collected in Table 8, Table 9 and Table 10. The highest values of correlation coefficient (R2 ≥ 0.97) for paracetamol, ibuprofen and naproxen adsorption on all the studied adsorbents were obtained when the Freundlich-Langmuir model was applied to fit experimental data. The calculated value n is >1 for all adsorbates (with exception of paracetamol on WG-15), indicating that adsorption is a favorable process. The calculated values of qm parameter (maximum adsorption capacity) are higher for paracetamol and naproxen adsorption on the ordered mesoporous carbons (ST-A-P and ST-A-P-CO2) against adsorption on WG-15. The opposite result was obtained for the adsorption of ibuprofen.

4. Conclusions

The adsorption of paracetamol, ibuprofen, and naproxen from aqueous solution on new ordered mesoporous carbons (ST-A-P, ST-A-P-CO2) and commercial activated carbon (WG-15) was studied. The ability of adsorbing ordered mesoporous carbon materials was much higher for paracetamol and naproxen in comparison to commercial activated carbon. The removal efficiency of ibuprofen for all the studied adsorbents was significantly lower than for other studied pharmaceuticals.
The adsorption kinetics for paracetamol, ibuprofen, and naproxen on the studied carbon materials can be described with the pseudo second-order kinetic equation pseudo-second-order kinetic model, suggesting the chemisorption mechanism during the adsorption process. The intra particle-diffusion model describes well the adsorption mechanism for all the studied pharmaceuticals.
Acidic groups containing oxygen atoms are predominant on the surface of ST-A-P and ST-A-P-CO2 adsorbents, so one can expect that the interactions between paracetamol and naproxen molecules with the surface of these adsorbents can occur through π electron interactions because the possibility of forming Lewis acid-base complexes or hydrogen bonds. Comparable adsorption efficiency on ST-A-P and WG-15 adsorbents for ibuprofen suggests that the adsorption mechanism is also influenced by other factors.
The adsorption process of paracetamol, ibuprofen and naproxen on all investigated carbon adsorbents proceeded in compliance with Freundlich-Langmuir adsorption model. The obtained values of n factor indicated that adsorption process of the studied pharmaceuticals is spontaneous in nature.
The obtained results confirmed that new mesoporous carbon materials are suitable adsorbents for all the studied pharmaceuticals, and especially for paracetamol and naproxen removal from aqueous solutions.

Author Contributions

K.J. designed the conception; K.J. & B.S. wrote the manuscript and discussed the results; N.R. performed the experiments, assisted in discussing results; P.S. made calculations and plots using Origin Microcal 2018; A.K. prepared the computational calculation and discussion of this part of results; P.R. assisted during the experiments.

Funding

This work was found from resources of Ministry of Science and Higher Education as research project BS 612 490 and BS 612 458.

Conflicts of Interest

The authors declare no conflict of interest.

References

  1. Akhtar, J.; Aishah Saidina Amin, N.; Shahzad, K. A review on removal of pharmaceuticals from water by adsorption. Des. Water Treat. 2016, 57, 12842–12860. [Google Scholar] [CrossRef]
  2. Ahmed, M.J. Adsorption of non-steroidal anti-inflammatory drugs from aqueous solution using activated carbons. Review. J. Environ. Manag. 2017, 190, 274–282. [Google Scholar] [CrossRef] [PubMed]
  3. Pluciennik-Koropczuk, E. Non-steroidal anti-infflamatory drugs in municipal wastewater and surface waters. Civ. Environ. Eng. Rep. 2014, 14, 63–74. [Google Scholar] [CrossRef]
  4. Dubey, S.P.; Dwivedi, A.D.; Sillanpää, M.; Gopal, K. Artemisia vulgaris-derived mesoporous honeycomb-shaped activated carbon for ibuprofen adsorption. Chem. Eng. J. 2010, 165, 537–544. [Google Scholar] [CrossRef]
  5. Cabrita, I.; Ruiz, B.; Mestre, A.S.; Fonseca, I.M.; Carvalho, A.P.; Ania, C.O. Removal of an analgesic using activated carbons prepared from urban and industrial residues. Chem. Eng. J. 2010, 163, 249–255. [Google Scholar] [CrossRef] [Green Version]
  6. Weigel, S.; Kuhlmann, J.; Hühnerfuss, H. Drugs and personal care products as ubiquitous pollutants: Occurrence and distribution of clofibric acid, caffeine and DEET in the North Sea. Sci. Total Environ. 2002, 295, 131–141. [Google Scholar] [CrossRef]
  7. Álvarez-Torrellas, S.; Rodríguez, A.; Ovejero, G.; García, J. Comparative adsorption performance of ibuprofen and tetracycline from aqueous solution by carbonaceous materials. Chem. Eng. J. 2016, 283, 936–947. [Google Scholar] [CrossRef]
  8. Hernando, M.D.; Mezcua, M.; Fernandez-Alba, A.R.; Barceló, D. Environmental risk assessment of pharmaceutical residues in wastewater effluents, surface waters and sediments. Talanta 2006, 69, 334–342. [Google Scholar]
  9. Baccar, R.; Sarra, M.; Bouzid, J.; Feki, M.; Blánquez, P. Removal of pharmaceutical compounds by activated carbon prepared from agricultural by-product. Chem. Eng. J. 2012, 211, 310–317. [Google Scholar] [CrossRef]
  10. Iovino, P.; Chianese, S.; Canzano, S.; Prisciandaro, M.; Musmarra, D. Photodegradation of diclofenac in wastewaters. Desalin. Water Treat. 2017, 61, 293–297. [Google Scholar] [Green Version]
  11. Li, J.; Ma, L.-Y.; Li, L.-S.; Xu, L. Photodegradation kinetics, transformation, and toxicity prediction of ketoprofen, carprofen, and diclofenac acid in aqueous solutions. Environ. Toxicol. Chem. 2017, 36, 3232–3239. [Google Scholar] [CrossRef]
  12. Vijay, M.; Vulava, W.; Cory, C.; Murphey, V.L.; Ulmer, C.Z. Sorption, photodegradation, and chemical transformation of naproxen and ibuprofen in soils and water. Sci. Total Environ. 2016, 565, 1063–1070. [Google Scholar] [Green Version]
  13. Zhang, H.; Zhang, P.; Ji, Y.; Tian, J.; Du, Z. Photocatalytic degradation of four non-steroidal anti-inflammatory drugs in water under visible light by P25-TiO2/tetraethyl orthosilicate film and determination via ultra performance liquid chromatography electrospray tandem mass spectrometry. Chem. Eng. J. 2015, 262, 1108–1115. [Google Scholar] [CrossRef]
  14. Kezzim, A.; Boudjemaa, A.; Belhadi, A.; Trari, M. Photo-catalytic degradation of ibuprofen over the new semiconducting catalyst α-(Cu,Fe)2O3 prepared by hydrothermal route. Res. Chem. Intermed. 2017, 43, 3727–3743. [Google Scholar] [CrossRef]
  15. Sharma, V.K.; Mishra, S.K. Ferrate(VI) oxidation of ibuprofen: A kinetic study. Environ. Chem. Lett. 2006, 3, 182–185. [Google Scholar] [CrossRef]
  16. Molinari, R.; Pirillo, F.; Loddo, V.; Palmisano, L. Heterogeneous photocatalytic degradation of pharmaceuticals in water by using polycrystalline TiO2 and a nanofiltration membrane reactor. Catal. Today 2006, 118, 205–213. [Google Scholar] [CrossRef]
  17. Ciríaco, L.; Anjo, C.; Correia, J.; Pacheco, M.J.; Lopes, A. Electrochemical degradation of Ibuprofen on Ti/Pt/PbO2 and Si/BDD electrodes. Electrochim. Acta 2009, 54, 1464–1472. [Google Scholar] [CrossRef]
  18. Choina, J.; Kosslick, H.; Fischer, C.; Flechsig, G.-U.; Frunza, L.; Schulz, A. Photocatalytic decomposition of pharmaceutical ibuprofen pollutions in water over titania catalyst. Appl. Catal. B Environ. 2013, 129, 589–598. [Google Scholar] [CrossRef]
  19. Michael, I.; Rizzo, L.; McArdell, C.S.; Manaia, C.M.; Merlin, C.; Schwartz, T.; Dagot, C.; Fatta-Kassinos, D. Urban wastewater treatment plants as hotspots for the release of antibiotics in the environment: A review. Water Res. 2013, 47, 957–995. [Google Scholar] [CrossRef]
  20. Yu, F.; Li, Y.; Han, S.; Ma, J. Adsorptive removal of antibiotics from aqueous solution using carbon materials. Chemosphere 2016, 153, 365–385. [Google Scholar] [CrossRef]
  21. Cuerda-Correa, E.M.; Domínguez-Vargas, J.R.; Olivares-Marín, F.J.; de Heredia, J.B. On the use of carbon blacks as potential low-cost adsorbents for the removal of non-steroidal anti-inflammatory drugs from river water. J. Hazard. Mater. 2010, 177, 1046–1053. [Google Scholar] [CrossRef] [PubMed]
  22. Rakic, V.; Rac, V.; Krmar, M.; Otman, O.; Auroux, A. The adsorption of pharmaceutically active compounds from aqueous solutions onto activated carbons. J. Hazard. Mater. 2015, 282, 141–149. [Google Scholar] [CrossRef] [PubMed]
  23. Bhadra, B.N.; Seo, P.W.; Jhung, S.H. Adsorption of diclofenac sodium from water using oxidized activated carbon. Chem. Eng. J. 2016, 301, 27–34. [Google Scholar] [CrossRef]
  24. Larous, S.; Meniai, A.-H. Adsorption of Diclofenac from aqueous solution using activated carbon prepared from olive stones. Int. J. Hydrogen Energy 2016, 41, 10380–10390. [Google Scholar] [CrossRef]
  25. Alvarez-Torrellas, S.; Munoz, M.; Zazo, J.A.; Casas, J.A.; García, J. Synthesis of high surface area carbon adsorbents prepared from pine sawdust-Onopordum acanthium L. for nonsteroidal anti-inflammatory drugs adsorption. J. Environ. Manag. 2016, 183, 294–305. [Google Scholar] [CrossRef]
  26. Mestre, A.S.; Pires, J.; Nogueira, J.M.F.; Carvalho, A.P. Activated carbons for the adsorption of ibuprofen. Carbon 2007, 45, 1979–1988. [Google Scholar] [CrossRef]
  27. Guedidi, H.; Reinert, L.; Leveque, J.-M.; Soneda, Y.; Bellakhal, N.; Duclaux, L. The effects of the surface oxidation of activated carbon, the solution pH and the temperature on adsorption of ibuprofen. Carbon 2013, 54, 432–443. [Google Scholar] [CrossRef]
  28. Guedidi, H.; Reinert, L.; Soneda, Y.; Bellakhal, N.; Duclaux, L. Adsorption of ibuprofen from aqueous solution on chemically surface-modified activated carbon cloths. Arab. J. Chem. 2017, 10, 3584–3594. [Google Scholar] [CrossRef]
  29. Zhang, P.; Wang, L.; Yang, S.; Schott, J.A.; Liu, X.; Mahurin, S.M.; Huang, C.; Zhang, Y.; Fulvio, P.F.; Chisholm, M.F.; et al. Solid-state synthesis of ordered mesoporous carbon catalysts via a mechanochemical assembly through coordination cross-linking. Nat. Commun. 2017, 8, 15020. [Google Scholar] [CrossRef]
  30. Choma, J.; Jedynak, K.; Marszewski, M.; Jaroniec, M. Organic acid-assisted soft-templating synthesis of ordered mesoporous carbons. Adsorption 2013, 19, 563–569. [Google Scholar] [CrossRef]
  31. Meng, Y.; Gu, D.; Zhang, F.; Shi, Y.; Cheng, L.; Feng, D.; Wu, Z.; Chen, Z.; Wan, Y.; Stein, A.; et al. A family of highly ordered mesoporous polymer resin and carbon structures from organic–organic self-assembly. Chem. Mater. 2006, 18, 4447–4464. [Google Scholar] [CrossRef]
  32. Wang, X.; Liang, C.D.; Dai, S. Facile synthesis of ordered mesoporous carbons with high thermal stability by self-assembly of resorcinol−formaldehyde and block copolymers under highly acidic conditions. Langmiur 2008, 24, 7500–7505. [Google Scholar] [CrossRef] [PubMed]
  33. ChemIDplus A Toxnet Data Base. Available online: http//chem.nlm.nih.gov/chemidplus/ (accessed on 17 April 2019).
  34. Choma, J.; Kalinowska, A.; Jedynak, K.; Marszewski, M.; Jaroniec, M. Reproducibility of the synthesis and adsorption properties of ordered mesoporous carbons obtained by the soft-templating method. Ochrona Srodowiska 2012, 34, 3–10. [Google Scholar]
  35. Wickramaratne, N.P.; Jaroniec, M. Activated Carbon Spheres for CO2 Adsorption. ACS Appl. Mater. Interfaces 2013, 5, 1849–1855. [Google Scholar] [CrossRef] [PubMed]
  36. Brunauer, S.; Emmett, P.H.; Teller, E. Adsorption of gases in multimolecular layers. J. Am. Chem. Soc. 1938, 60, 309–319. [Google Scholar] [CrossRef]
  37. Gregg, S.J.; Sing, K.S.W. Adsorption. Surface Area and Porosity, 2nd ed.; Academic Press: London, UK, 1982. [Google Scholar]
  38. Jaroniec, M.; Kaneko, K. Physicochemical foundations for characterization of adsorbents by using high-resolution comparative plots. Langmuir 1997, 13, 6589–6596. [Google Scholar] [CrossRef]
  39. Choma, J.; Jaroniec, M. New methods enabling description of the porous structure of active carbons on the basis of adsorption data. Ochrona Srodowiska. 1999, 21, 13–17. [Google Scholar]
  40. Kruk, M.; Jaroniec, M.; Gadkaree, K.P. Nitrogen adsorption studies of novel synthetic active carbons. J. Colloid Interface Sci. 1997, 192, 250–256. [Google Scholar] [CrossRef] [PubMed]
  41. Barrett, E.P.; Joyner, L.G.; Halenda, P.P. The determination of pore volume and area distribution in porous substances. 1. Computations from nitrogen isotherms. J. Am. Chem. Soc. 1951, 73, 373–380. [Google Scholar] [CrossRef]
  42. Lim, C.K.; Bay, H.H.; Noeh, C.H.; Aris, A.; Majid, Z.A.; Ibrahim, Z. Application of zeolite-activated carbon macrocomposite for the adsorption of Acid Orange 7: Isotherm. kinetic and thermodynamic studies. Environ. Sci. Pollut. Res. 2013, 20, 7243–7255. [Google Scholar] [CrossRef] [PubMed]
  43. Rivera-Utrilla, J.; Bautista-Toledo, I.; Ferro-García, M.A.; Moreno-Castilla, C. Activated carbon surface modifications by adsorption of bacteria and their effect on aqueous lead adsorption. J. Chem. Technol. Biotechnol. 2001, 76, 1209–1215. [Google Scholar] [CrossRef] [Green Version]
  44. Jedynak, K.; Wideł, D.; Rędzia, N. Removal of rhodamine b (a basic dye) and acid yellow 17 (an acidic dye) from aqueous solutions by ordered mesoporous carbon and commercial activated carbon. Colloid Interface 2019, 3, 30. [Google Scholar] [CrossRef]
  45. Tamijani, A.A.; Salam, A.; de Lara-Castells, M.P. Adsorption of noble-gas atoms on the TiO2(110) surface: An ab initio-assisted study with van der waals-corrected DFT. J. Phys. Chem. C 2016, 120, 18126–18139. [Google Scholar] [CrossRef]
  46. Berland, K.; Cooper, V.R.; Lee, K.; Schröder, E.; Thonhauser, T.; Hyldgaard, P.; Lundqvist, B.I. Van der waals forces in density functional theory: A review of the vdW-DF method. Rep. Prog. Phys. 2015, 78, 066501. [Google Scholar] [CrossRef] [PubMed]
  47. Brauer, B.; Kesharwani, M.K.; Kozuchb, S.; Martin, J.M.L. The S66 × 8 benchmark for noncovalent interactions revisited: Explicitly correlated ab initio methods and density functional theory. Phys. Chem. Chem. Phys. 2016, 18, 20905–20925. [Google Scholar] [CrossRef] [PubMed]
  48. Vydrov, O.A.; Voorhis, T.V. Nonlocal van der Waals density functional: The simpler the better. J. Chem. Phys. 2010, 133, 244103. [Google Scholar] [CrossRef] [Green Version]
  49. Sing, K.S.W.; Everett, D.H.; Haul, R.A.W.; Moscou, L.; Pierotti, R.A.; Rouquerol, J.; Siemieniewska, T. Reporting physisorption data for gas/solid systems with special reference to the determination of surface area and porosity. Pure Appl. Chem. 1985, 57, 603–619. [Google Scholar] [CrossRef]
  50. Choma, J. Characterization of nanoporous active carbons by using gas adsorption isotherms. Wegiel Aktywny w Ochronie Srodowiska i Przemysle 2006, 9, 37. [Google Scholar]
  51. Boehm, H.P. Some aspects of the surface chemistry of carbon blacks and other carbons. Carbon 1994, 32, 759–769. [Google Scholar] [CrossRef]
  52. Bernal, V.; Erto, A.; Giraldo, L.; Moreno-Piraján, J.C. Effect of solution pH on the adsorption of paracetamol on chemically modified activated carbons. Molecules 2017, 22, 1032. [Google Scholar] [CrossRef]
  53. Lagregren, S. About the theory of so-called adsorption of soluble substances. Kungl. Sven. Veten. Akad. Handl. 1898, 24, 1–39. [Google Scholar]
  54. Ho, Y.S.; McKay, G. Pseudo-second-order model for sorption processes. Process Biochem. 1999, 34, 451–465. [Google Scholar] [CrossRef]
  55. Kopelman, R. Fractal Reaction Kinetics. Science 1988, 241, 1620–1626. [Google Scholar] [CrossRef] [PubMed]
  56. Balsamo, M.; Montagnaro, F. Fractal-like vermeulen kinetic equation for the description of diffusion-controlled adsorption dynamics. J. Phys. Chem. C 2015, 119, 8781–8785. [Google Scholar] [CrossRef]
  57. Montagnaro, F.; Balsamo, M. Modelling CO2 Adsorption Dynamics onto Amine-Functionalised Sorbents: A Fractal-like Kinetic Perspective. Chem. Eng. Sci. 2018, 192, 603–612. [Google Scholar] [CrossRef]
  58. Haerifar, M.; Azizian, S. Fractal-like Adsorption Kinetics at the Solid/Solution Interface. J. Phys. Chem. C 2012, 116, 13111–13119. [Google Scholar] [CrossRef]
  59. Weber, W.J.; Morris, J.C. Kinetics of adsorption on carbon solution. J. Sanit. Eng. Div. Am. Soc. Civ. Eng. 1963, 89, 31–59. [Google Scholar]
  60. Kusmierek, K.; Swiątkowski, A.; Kaminski, W. Adsorption of 4-chlorophenol from aqueous solutions on mixed adsorbents: Activated carbon and carbon nanotubes. Inzynieria i Ochrona Srodowiska 2015, 18, 373–383. [Google Scholar]
  61. Langmuir, I. Chemical reactions at low pressures. J. Am. Chem. Soc. 1915, 27, 1139–1143. [Google Scholar] [CrossRef]
  62. Jeppu, G.P.; Clement, T.P. A modified Langmuir-Freundlich isotherm model for simulating pH-dependent adsorption effects. J. Contam. Hydrol. 2012, 129, 46–53. [Google Scholar] [CrossRef]
  63. Thirunavukkarasu, O.S.; Viraraghavan, T.; Subramanian, K.S. Arsenic removal from drinking water using iron oxide-coated sand. Water Air Soil Pollut. 2003, 142, 95–111. [Google Scholar] [CrossRef]
  64. Freundlich, H.M.F. Uber die Adsorption in Losungen. J. Phys. Chem. 1906, 57, 385–470. [Google Scholar] [CrossRef]
  65. Lin, T.F.; Wu, J.K. Adsorption of arsenite and arsenatewithin activated alumina grains: Equilibrium and kinetics. Water Res. 2001, 35, 2049–2057. [Google Scholar] [CrossRef]
  66. Sips, R. Combined form of Langmuir and Freundlich equations. J. Chem. Phys. 1948, 16, 490–495. [Google Scholar] [CrossRef]
  67. Vadi, M.; Omidi, A. Comparative study of adsorption isotherms two nonsteroidal anti-inflammatory drugs(nsaids), acetaminophen and diclofenac on carbon nanotube. Oriental J. Chem. 2012, 28, 1325–1330. [Google Scholar] [CrossRef]
  68. Vadi, M. Adsorption isotherms of some non-steroidal drugs on single wall carbon nanotube. Asian J. Chem. 2013, 25, 3431–3433. [Google Scholar] [CrossRef]
  69. Shahbeig, H.; Bagheri, N.; Ghorbanian, S.A.; Hallajisani, A.; Poorkarimi, S. A new adsorption isotherm model of aqueous solutions on granular activated carbon. World J. Model. Simul. 2013, 9, 243–254. [Google Scholar]
  70. Dada, A.O.; Olalekan, A.P.; Olatunya, A.M.; Dada, O. Langmuir, freundlich, temkin and dubinin–radushkevich isotherms studies of equilibrium sorption of Zn2+ unto phosphoric acid modified rice husk. IOSR J. Appl. Chem. 2012, 3, 38–45. [Google Scholar]
  71. Tempkin, M.I.; Pyzhev, V. Kinetics of ammonia synthesis on promoted iron catalyst. Acta Phys. Chim. USSR 1940, 12, 327–356. [Google Scholar]
  72. Balhachemi, M.; Addoun, F. Comparative adsorption isotherms and modeling of methylene blue onto activated carbons. Appl. Water Sci. 2011, 1, 111–117. [Google Scholar] [CrossRef] [Green Version]
Figure 1. Optimized chemical structure of (a) (S)-naproxen, (b) paracetamol, (c) (S)-ibuprofen, (d) (R)-ibuprofen obtained by DFT calculation in Scigress program. Particular atoms were marked with colors: carbon—black, hydrogen—white, nitrogen—light gray, oxygen—red.
Water 11 01099 g001
Figure 2. Electrostatic potential energy maps for (a) (S)-naproxen, (b) paracetamol, (c) (S)-ibuprofen, (d) (R)-ibuprofen. Blue surface indicates positive value of electrostatic potential (localized positive charge) and the red one—negative value (localized negative charge). Electron density at the surface is 0.01 e/A3.
Water 11 01099 g002
Figure 3. Nitrogen adsorption isotherms for carbon materials studied.
Water 11 01099 g003
Figure 4. SEM images of samples: ST-A-P (a), ST-A-P-CO2 (b), WG-15 (c).
Water 11 01099 g004
Figure 5. Removal efficiency of paracetamol, ibuprofen, and naproxen for the studied carbon adsorbents (concentration of adsorbate solutions–300 mg dm−3, mass of adsorbent–0.01 g, temp. 20 °C).
Water 11 01099 g005
Figure 6. Kinetic adsorption curves (ac), Co 300 mg dm−3 and the intra-particle diffusion (df) of paracetamol and NSAIDs on carbon materials studied.
Water 11 01099 g006aWater 11 01099 g006b
Figure 7. Calculation of adsorption equilibrium constant for ibuprofen, naproxen, and paracetamol onto adsorbents: ■—ST-A-P; ▼—ST-A-P-CO2; ●—WG-15 employing the experimental data. The full line represents the curve obtained by the application of the Langmuir–Freundlich equation; dash line reflects the Freundlich equation, whereas drop line corresponds to the Langmuir one with respect to the adsorption data as adjusted by the least-squares method.
Water 11 01099 g007aWater 11 01099 g007b
Table 1. Chemical structures and selected properties of the adsorbates [33].
CompoundParacetamolIbuprofenNaproxen
Molecular structure Water 11 01099 i001 Water 11 01099 i002 Water 11 01099 i003
IUPAC nameN-(4-hydroxyphenyl)-acetamide(RS)-2-(4-(2-methylpropyl)phenyl)-propanoic acid(+)-(S)-2-(6-methoxy-naphthalen-2-yl)propanoic acid
Chemical formulaC8H9NO2C13H18O2C14H14O3
Molecular weight151.16 g/mol206.28 g/mol230.26 g/mol
Water solubility1.4 mg/L (25 °C)21 mg/L (25 °C)15.9 mg/L (25 °C)
pKa *9.384.914.15
λ (nm) **243221273
* Ka–dissociation constant at 20 °C; ** absorption wavelength at which spectrophotometric measurements were made for adsorbates.
Table 2. Calculation results for (S)-naproxen, paracetamol, (S)-ibuprofen and (R)-ibuprofen obtained in SCIGRESS program.
(S)-naproxenParacetamol(S)-ibuprofen(R)-ibuprofen
partial charge partial charge partial charge partial charge
C1−0.350C1−0.309C1−0.315C1−0.337
C2−0.325C20.317C2−0.329C2−0.322
C30.341C3−0.352C30.305C30.303
C4−0.533C4−0.372C4−0.346C4−0.351
C50.283C50.364C5−0.352C5−0.366
C60.293C6−0.325C60.273C60.303
C7−0.533N7−0.428C7−0.267C7−0.254
C80.312O8−0.478C8−0.625C8−0.608
C9−0.34C90.259C90.267C90.233
C10−0.364O10−0.344C10−0.486C10−0.481
H110.225C11−0.678C11−0.133C11−0.133
H120.235H120.234C12−0.618C12−0.618
O13−0.271H130.201C13−0.614C13−0.615
H140.23H140.203O14−0.308O14−0.31
H150.218H150.306O15−0.441O15−0.428
H160.235H160.329H160.221H160.24
C17−0.241H170.399H170.216H170.218
H180.237H180.212H180.219H180.218
C19−0.464H190.212H190.222H190.214
C20−0.672H200.251H200.231H200.222
C210.247 H210.216H210.224
O22−0.308 H220.22H220.213
O23−0.43 H230.217H230.213
H240.241 H240.2H240.199
H250.201 H250.207H250.208
H260.2 H260.194H260.193
H270.244 H270.227H270.225
H280.223 H280.184H280.184
H290.237 H290.203H290.202
H300.219 H300.191H300.191
H310.408 H310.2H310.201
H320.212H320.212
H330.409H330.408
Table 3. Structural parameters of the studied carbon materials.
Carbon MaterialsSBET
m2/g
Vt
cm3/g
Vme
cm3/g
Vmi
cm3/g
Mesoporosity %
ST-A-P6700.680.510.1775
ST-A-P-CO28860.840.580.2669
WG-159870.500.230.2746
SBET—specific surface area; Vt—single-point total pore volume calculated at p/po = 0.99; Vme—mesopore volume calculated by subtracting Vmi from Vt; Vmi—volume of micropores obtained by αs-method; Mesoporosity—the percentage of the mesopore volume in relation to the total pore volume.
Table 4. Functional groups available on the studied adsorbents.
AdsorbentsTotal Basic Groups
(mmol g−1)
Total Acidic Groups
(mmol g−1)
Phenolic Groups
(mmol g−1)
Carbonyl Groups
(mmol g−1)
ST-A-P [35]0.240.690.350.34
ST-A-P-CO20.560.820.440.38
WG-152.350.66-0.66
Table 5. Kinetic parameters of paracetamol and NSAIDs adsorption on the studied adsorbents.
AdsorbateAdsorbentqe (exp)
(mg g−1)
Pseudo-First-Order Kinetic ModelPseudo-Second-Order Kinetic Model
k1
(min−1)
qe
(mg g−1)
R2k2
(g mg−1 min−1)
qe
(mg g−1)
R2
ParacetamolST-A-P211.20.0177204.70.94670.00008256.40.9616
ST-A-P-CO2286.60.0139154.30.87740.00010303.00.9999
WG-15103.40.0118172.40.93320.00007117.60.9847
IbuprofenST-A-P120.10.0247240.00.93920.00005166.70.9924
ST-A-P-CO292.00.0347212.30.95130.00010114.90.9909
WG-15139.00.0166210.7098170.00009137.00.9933
NaproxenST-A-P248.80.011074.00.94020.00030256.40.9999
ST-A-P-CO2296.30.012853.00.99860.00050303.01.0000
WG-15150.30.012695.50.86130.00020158.70.9819
Table 6. Kinetic parameters of paracetamol and NSAIDs adsorption on the studied adsorbents.
AdsorbateAdsorbentFractal-Like Pseudo-First-Order Kinetic ModelFractal-Like Pseudo-Second-Order Kinetic Model
k0,1′
(min-n)
αR2k0,2′
(g mg−1 min−n)
αR2
ParacetamolST-A-P0.010110.850.98530.0001810.7183
ST-A-P-CO20.004430.820.93390.0001610.8405
WG-150.030420.830.98670.0001510.9767
IbuprofenST-A-P0.004520.850.98170.0001410.9055
ST-A-P-CO20.007730.980.95510.0002310.9083
WG-150.002680.760.94490.000110.950.8906
NaproxenST-A-P0.170760.560.95540.0004110.9275
ST-A-P-CO20.357720.460.99420.0005610.6862
WG-150.006660.510.88940.000660.830.7627
Table 7. Intra-particle diffusion model parameters.
AdsorbateAdsorbentkid1
(mg g−1 min−1/2)
c1
(mg g−1)
R12kid2
(mg g−1 min−1/2)
c2
(mg g−1)
R22
ParacetamolST-A-P28.3297.620.86460.1997.250.9999
ST-A-P-CO225.63164.920.95790.11207.720.9998
WG-1517.9119.920.94830.002284.410.9999
IbuprofenST-A-P21.8819.210.94740.21113.921.0000
ST-A-P-CO214.7124.440.89510.2584.110.9997
WG-1518.0031.260.99660.91110.390.9999
NaproxenST-A-P12.44190.870.93020.18242.930.9999
ST-A-P-CO29.79256.270.95000.22289.771.0000
WG-1512.7190.650.92690.61132.200.9998
Table 8. Langmuir, Freundlich, and Langmuir-Freundlich equations parameters and correlation coefficients R2 for the adsorption of the studied paracetamol on adsorbents.
IsothermsParametersAdsorbent
ST-A-PST-A-P-CO2WG-15
FreundlichKF (mg g−1) (dm−3 mg−1)1/n67.26122.6444.97
1/n0.230.210.26
R20.95940.83730.8170
LangmuirKL (dm3 mg−1)0.0340.060.02
qm (mg g−1)290.52400.00257.82
R20.95620.96680.9637
Langmuir- FreundlichKLF (dm3 mg−1)1/n0.1060.1080.01
qm (mg g−1)413.53501.91238.00
n2.051.560.79
R20.99680.99010.9709
Table 9. Langmuir, Freundlich, and Langmuir-Freundlich equations parameters and correlation coefficients R2 for the adsorption of naproxen on the studied adsorbents.
IsothermsParametersAdsorbent
ST-A-PST-A-P-CO2WG-15
FreundlichKF (mg g−1) (dm−3 mg−1)1/n83.42106.1621.04
1/n0.230.290.40
R20.96460.84610.9578
LangmuirKL (dm3 mg−1)0.0770.1080.02
qm (mg g−1)286.04395.54226.74
R20.96120.85760.9851
Langmuir- FreundlichKLF (dm3 mg−1)1/n0.0680.7290.0326
qm (mg g−1)300.00301.0051.35
n1.471.381.45
R20.97730.98360.9939
Table 10. Langmuir, Freundlich, and Langmuir-Freundlich equations parameters and correlation coefficients R2 for the adsorption of ibuprofen on the adsorbents.
IsothermsParametersAdsorbent
ST-A-PST-A-P-CO2WG-15
FreundlichKF (mg g−1) (dm−3 mg−1)1/n15.4019.6627.71
1/n0.380.300.29
R20.95160.87440.9089
LangmuirKL (dm3 mg−1)0.020.020.02
qm (mg g−1)162.23129.93193.03
R20.90750.90640.9436
Langmuir–FreundlichKLF (dm3 mg−1)1/n0.010.010.02
qm (mg g−1)193.61148.05210.96
n1.031.031.16
R20.99260.98980.9813

