Scour Induced by Single and Twin Propeller Jets


1
State Key Laboratory of Hydraulic Engineering Simulation and Safety, Tianjin University, Tianjin 300072, China
2
First R&D Services, A-08-16 M Suites, 283 Jalan Ampang, Kuala Lumpur 50450, Malaysia
3
School of Natural and Built Environment, Architecture, Civil & Structural Engineering and Planning, Queen’s University Belfast, David Keir Building, Stranmillis Road, Belfast BT9 5AG, UK
*
Author to whom correspondence should be addressed.
Water 2019, 11(5), 1097; https://doi.org/10.3390/w11051097
Submission received: 27 April 2019
/
Revised: 13 May 2019
/
Accepted: 23 May 2019
/
Published: 25 May 2019
(This article belongs to the Special Issue Experimental, Numerical and Field Approaches to Scour Research)
Abstract
:Single and twin ship propeller jets produce scour holes with deposition dune. The scour hole has a maximum depth at a particular length downstream within the propeller jet. Existing equations are available to predict maximum scour depth and the corresponding scour length downstream. Experiments conducted with various physical propeller models, rotational speeds, propeller-to-propeller distances and bed clearances are presented. The measurements allowed a better understanding of the mechanism of temporal scour and deposition formation for scour caused by single-propeller and twin-propeller. Results show that the propeller jet scour profiles can be divided into three zones, which are the small scour hole, primary scour hole and deposition dune. An empirical 2D scour model is proposed to predict the scour profile for both a single-propeller and twin-propeller using a Gaussian normal distribution.
1. Introduction
Ships are getting larger and faster to meet the needs of world economic development. Engine power has been increased for bigger ships leading to the use of the twin-propeller system. Kim et al. [1] and PIANC [2] stated that the twin-propeller system improved the ship power system and its handling ability. A twin-propeller ship produces a complicated jet affecting the navigation safety in waterways and damaging the seabed condition. Seabed scour is widely discussed due to the direct impingement of a high-velocity jet to cause excessive sediment transport in harbour and waterways. Hamill [3] and Gaythwaite [4] stated that the impingement of the ship’s propeller jet can damage the seabed.
Albertson et al. [5] firstly proposed the efflux velocity within the plain water jet from orifice being predicted using axial momentum velocity. Blaauw and van de Kaa [6] and Verhey et al. [7] suggested the use of a theoretical foundation of a plain water jet in Albertson et al. to investigate the ship propeller jet induced seabed scour in the harbour without consideration of the berth structure. Hamill et al. [8], Lam et al. [9] and Hong et al. [10] continued the investigations in laboratories by using a physical single propeller model to observe the scouring condition. Hamill et al. [11] include the effects of the quay wall in the seabed scour prediction. The aforementioned researchers emphasised on the estimation of maximum scour depth induced by ship propeller wash. Wang et al. [12], Sun et al. [13] and Ma et al. [14] implemented the foundation of propeller jet induced scour to predict the wake of tidal turbine and the tidal turbine induced scour and Jiang et al. [15] proposed the theoretical structure of ship twin propeller jet.
The impingement of this rotating jet forms the scour pit with the scoured sediments being transported downstream to form dune deposited surrounding the scour pit on the seabed when the watercraft or vessels entering a port. The accumulated sediment forms a dune reducing the water depth and increasing the risk of ship collision in shallow waterways. A ship propeller can be damaged when hitting the seabed. The understanding of both the scour pit and deposition dune are important to ensure navigation safety. Twin-propeller jet produces the scour profiles with deposited dune downstream, which is different compared to the single-propeller. Yew et al. [16] and Hong et al. [10] stated that the deposition is an M-shaped distribution with the largest accumulated height on the longitudinal axis of both propellers. The height of deposited dunes decreased along the side of two propellers surrounding scour hole.
In this works, a purpose-built power train system was developed to rotate the physical propeller model at the desired rotational speeds in the laboratory in order to investigate the ship twin-propeller jet induced scour. Previous researchers used the maximum scour depth without available equations to predict the entire cross-section of the scour profile. The current experimental data were used to establish the 2D scour model by proposing the scour depth equation and Gaussian normal distribution to estimate the entire scour profile for both single-propeller and twin-propeller systems.
2. Propeller Jet and Scour
2.1. Propeller Jet
Hamill et al. [3] started the research on propeller jets according to the axial momentum theory and plain jet theory. Hamill et al. [17] found that the flow structure of the propeller jet is symmetrical along the rotational axis. The jet can be divided into two development stages, which are the zone of flow establishment and zone of established flow and the whole jet is conical in 3D view. The zone of flow establishment is the initial development stage of flow velocity with more complicated nature compared to the second zone downstream. Low-velocity region was found near to the propeller jet outflow plane due to the hub effects with no contribution of velocity from blades. The maximum lateral velocity distribution occurred in the middle of the blade, where the maximum blade width occurred. The velocity distribution is symmetrical along the propeller axis. For the zone of established flow, the maximum velocity is lesser compared to the initial zone due to water entrainment to reduce the velocity gradient within the jet. The high-velocity flow is mixed with the low-velocity flow to balance the velocity distribution.
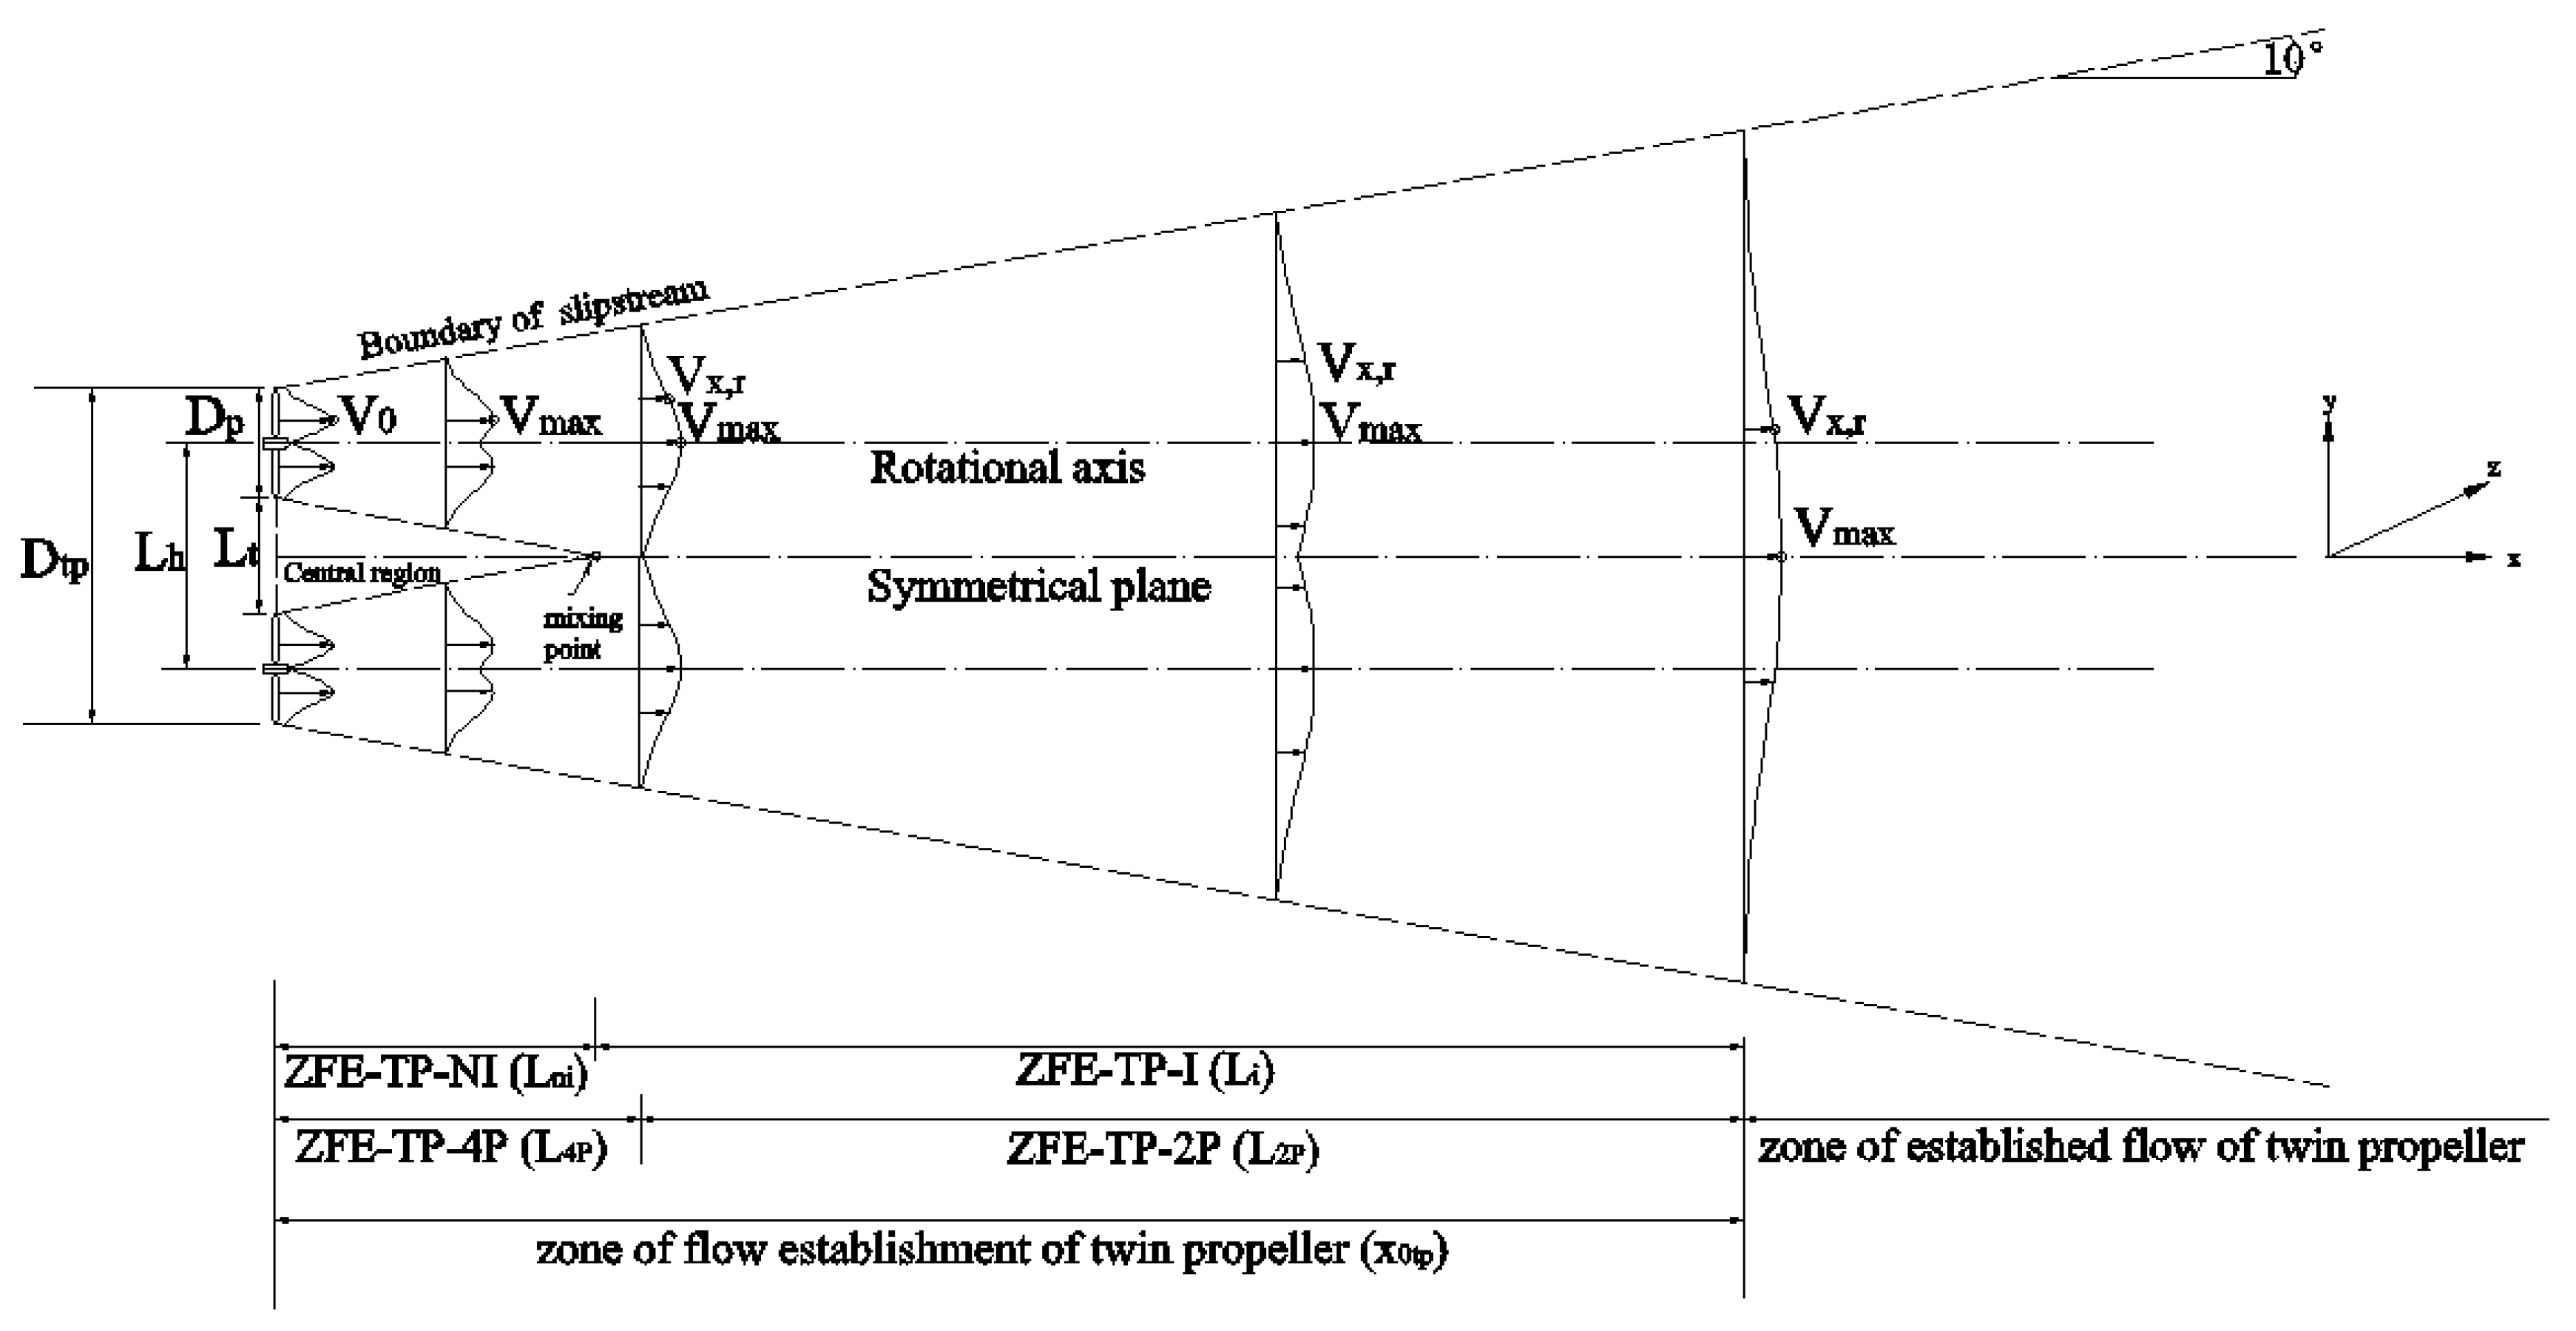
Jiang et al. [15] proposed the flow structure of the twin-propeller jet has two zones as a single propeller, as shown in Figure 1. The zone of flow establishment can be divided to be non-interference zone (ZFE-TP-NI) and inference zone (ZFE-TP-I). Two propeller jets in twin system have no contact in the non-interference zone and expand separately to meet at one point where the interference zone starts. The zone of flow establishment consists of the four-peak region (ZFE-TP-4P) and two-peak region (ZFE-TP-2P) according to the lateral velocity section. A mixing point happens downstream within the twin-propeller jet. The twin-propeller jet is the same as two separate jets in the upstream region of the mixing point. Four maximum speeds were found on the cross-section, which corresponds to the two velocity peaks for every single propeller. The four maximum velocities combined to be two maximum velocities located at the rotational axis of each propeller when two single jets mixed together. In the zone of established flow, only one maximum velocity was found on the symmetrical plane.
2.2. Propeller Induced Scour
Chiew and Lim [18] studied the scouring problem by using a submerged circular jet to simulate the rotating propeller instead of the complicated propeller jet. The scour hole dimensions produced by the circular wall jet were highly dependent on the densimetric Froude number (F0). The maximum equilibrium scour depth increased with an increase in F0. Chiew and Lim introduced the offset height (G) of the circular wall jet as an additional parameter governing the diffusion characteristics of the jet. The maximum scour depth reduced with an increase in the offset height.
Hamill et al. [11] investigated the scour induced by a propeller jet both in the absence of the port structure and near the quay walls. A predictive equation for the time-dependent maximum scour depth as a function of the Froude number (F0), propeller size (Dp), sediment bed material size (d50), and distance between propeller tip and seabed was proposed. Seabed scour around a marine current turbine was also studied by Chen and Lam [19].
Hong et al. [10] conducted an experimental study of a single propeller jet. Limited works from Mujal-Colilles et al. [20] and Yew [16] were found to discuss the twin-propeller induced scour. All these researchers stressed the importance of estimating the maximum scouring depth caused by ship propeller. The equations to predict the scour depth proposed by the previous researches are shown in Table 1.
3. Experimental Works
Experiments were conducted in the Marine Renewable Energy Laboratory (MREL) at Tianjin University. The scaled twin-propeller system consisted of two single propellers. Two propellers were fixed at the shaft to rotate at the desired rotational speeds in a tank. The experimental setup, measurement method and 3D printed propeller model are discussed in the following sections. The rotational directions of twin-propellers were controlled to rotate internally and externally as internal rotation and external rotation. The propeller at the port side (left from the aft) rotated counter clockwise, while the propeller at starboard side (right from the aft) rotated clockwise to form the external rotation system. Most of the ships used the external rotation system to prevent flow compression in the clearance between two propellers with strong internal mixing jet. The observation of the development of a scour profile with time was made and followed by the measurement of the scour depth.
3.1. Experiment Setup
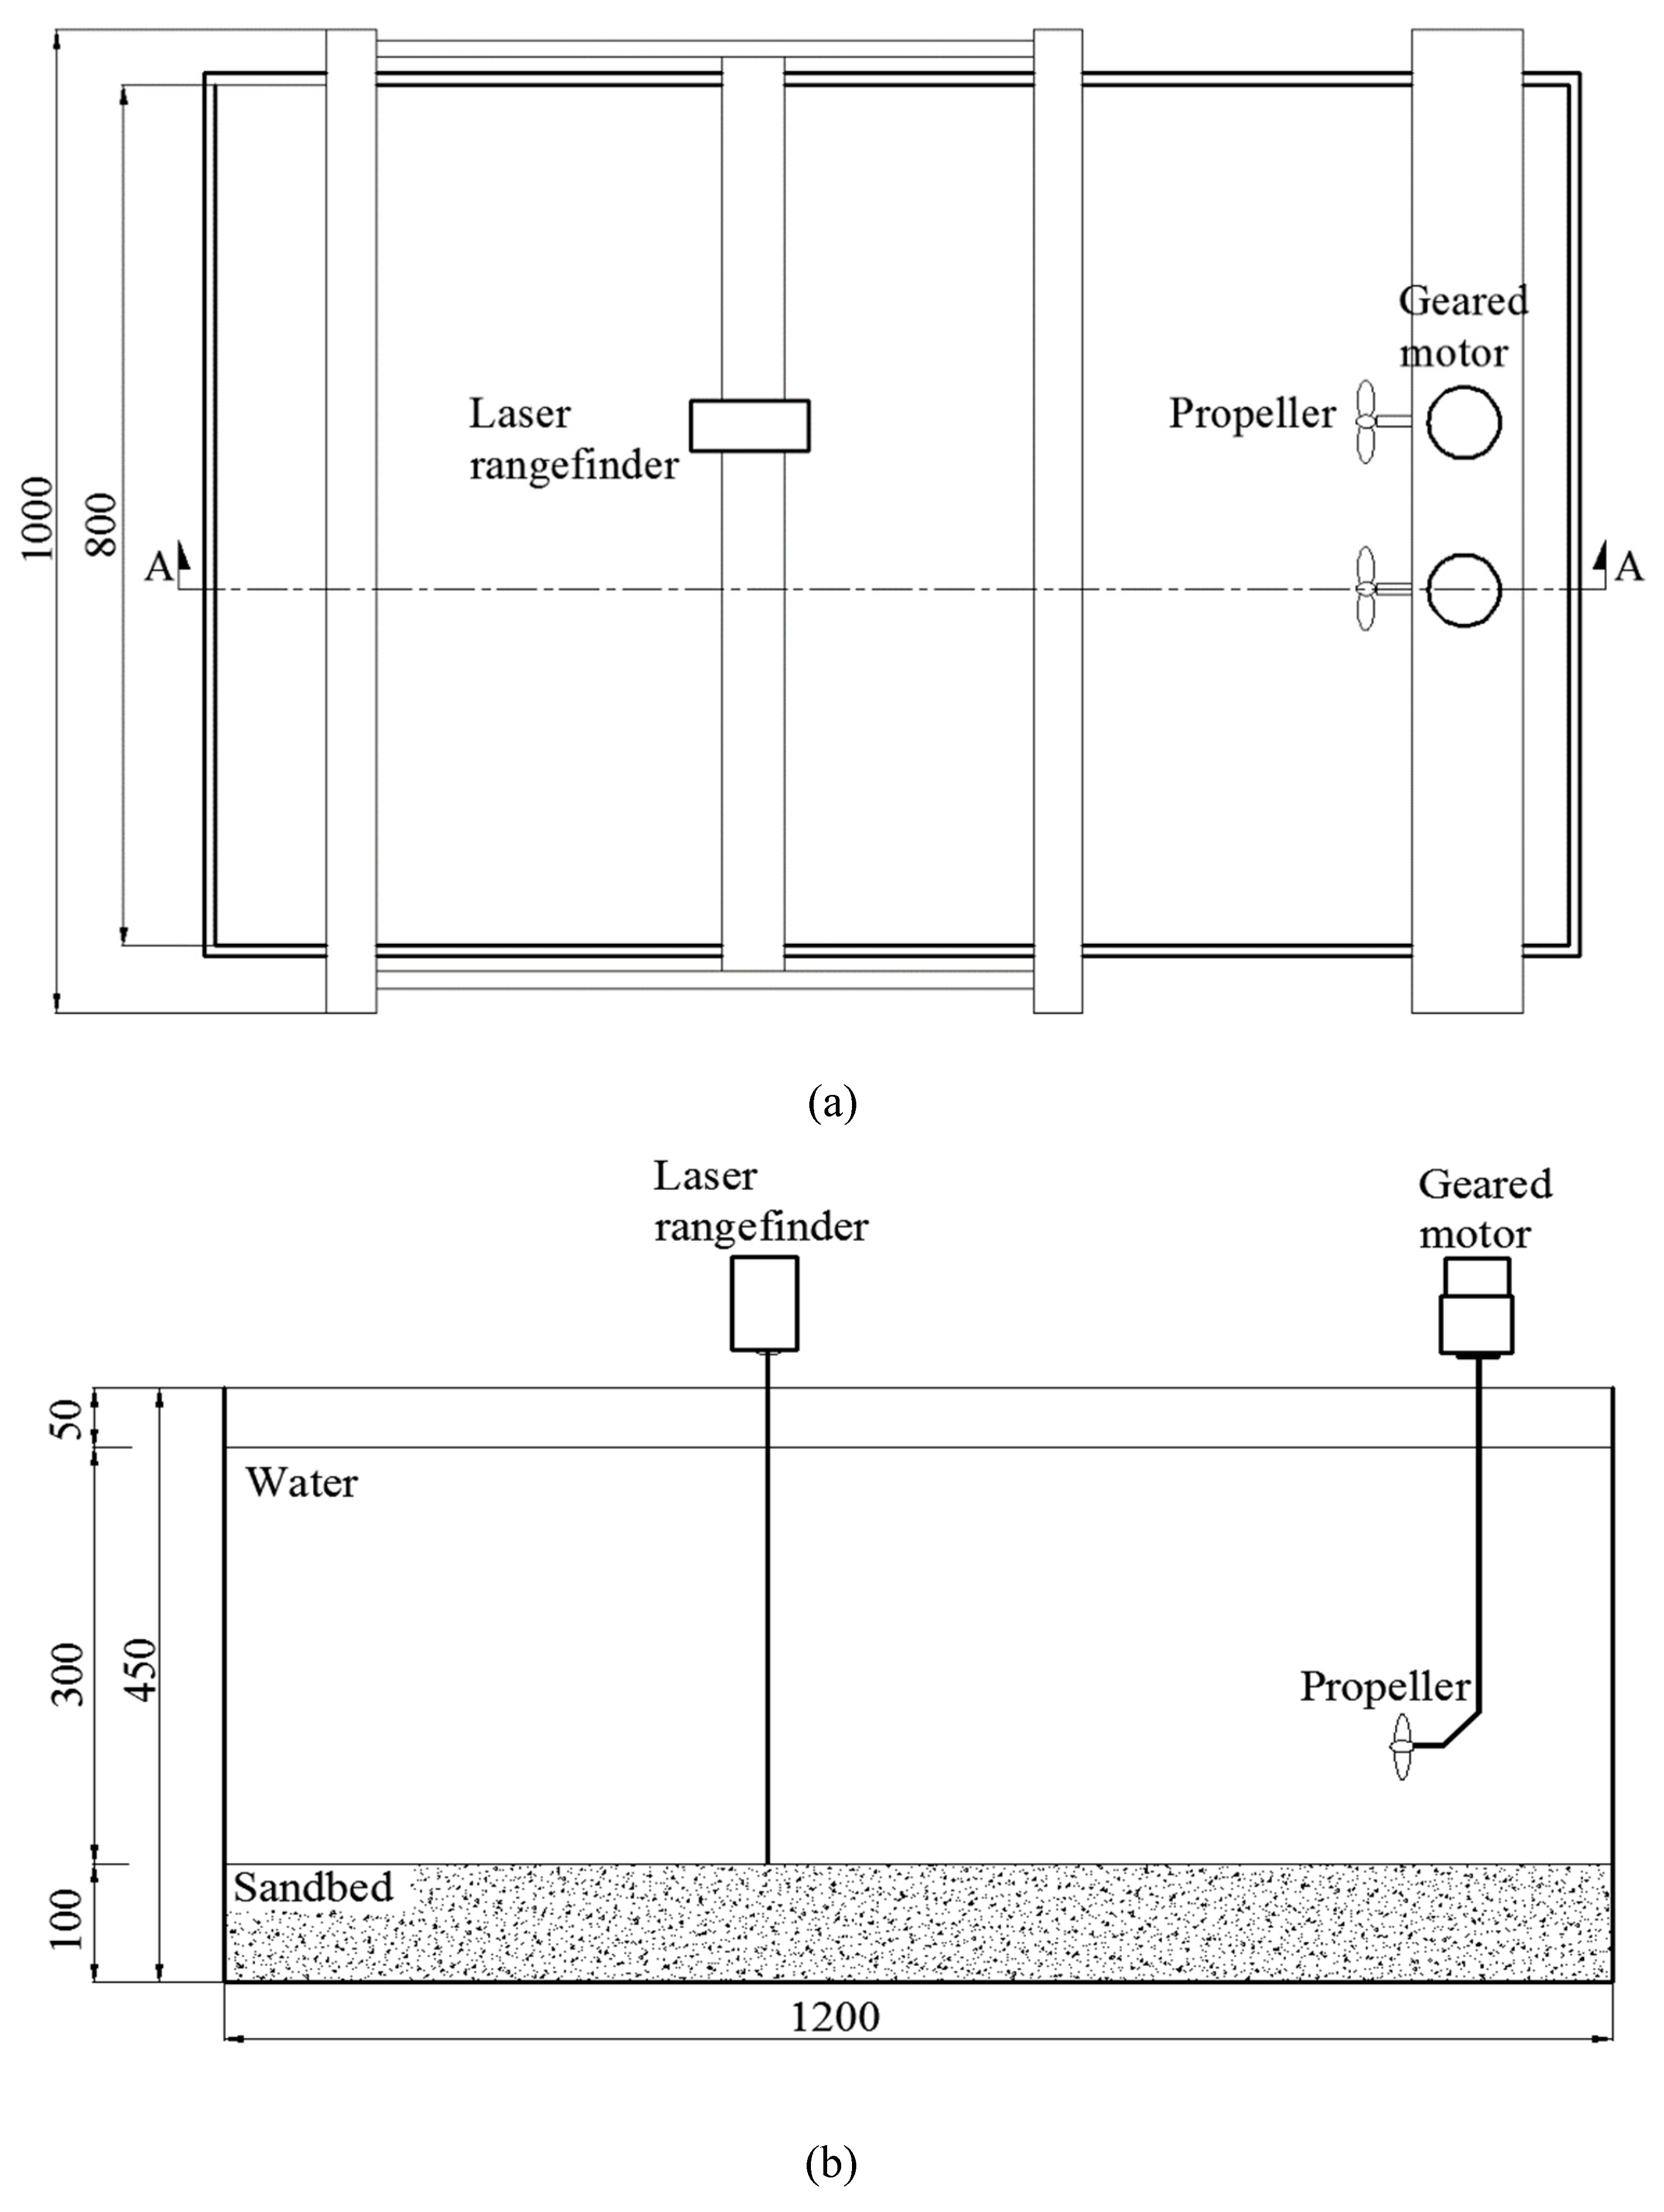
The experiment was carried out in a water tank of 1.2 m in length, 0.8 m in width, and 0.45 m in height. The sand was evenly laid on the ground with a height of 0.1 m. Scour depth was much smaller than the depth of available laid sand. The sand used was the construction sand screened through 0.1 mm to 0.3 mm diameter filters. The diameter of sand in this experiment was 0.2 mm. The distances between propeller tip and sandbed were set to 5.0 mm, 27.5 mm and 55.0 mm according to Hong et al. [10]. The schematic diagram of the experiment is shown in Figure 2a,b.
3.2. Measurement Methods
The measurement system consisted of a laser rangefinder to measure the scour depth and the traverse system to move the laser rangefinder to the designated position for point measurement within the 1m × 1m area, as shown in Figure 2. A laser rangefinder was used to measure the scour depth and deposition height. The laser rangefinder used is made by Sndway Co. Ltd. with a measurement range up to 40 m. The laser rangefinder had an aspherical optical focusing mirror, which could enhance reflected light acceptance. The measurement accuracy was within ± 0.2 mm. The lasers had different refractive indices in water and in air. The experimental data needs to be multiplied by 1.33 to eliminate the differences due to the transmission of the light beam through the air and water as consideration of refractive index.
The propellers were not rotating before the measurement and the designed rotational speeds can be adjusted by using the speed control system. Depth measurement was made on a point by point basis through comparison of the undisturbed reference point and the scoured point to obtain the relative scour depth. The laser rangefinder was initially moved to the undisturbed sandbed point and read the measurement point L1, as shown in Figure 3. Then, the laser rangefinder was moved to the sandpit measurement point to read the data L2. The scour depth can be obtained by calculating the εm = (L2 − L1) n, where n is the refractive index of water.
The support structure for the measurement system was built with four columns and four beams surrounding the experimental tank to accommodate the traverse system. The stands were 0.4 m high, and its length and width were the same as 1 m. Two rods were fixed in the direction of the propeller jet (x-direction) on supporting beams with sliders allowing y-direction movement. An additional rod was installed on top of the two rods with sliders on each side allowing the x-direction motion. A fixed clip was used to fix the laser rangefinder the rod. A laser rangefinder had the optical axis perpendicular to the seabed for depth measurement. The single rod allowed the laser rangefinder to move at any axial distance from the flow field. The double rods allowed the laser rangefinder to measure any position in the y-direction. Therefore, all desired points within the x-y measurement grid can be acquired to provide data for scour depth and deposition height.
3.3. 3D Printed Propeller Model
Hamill et al. [8] studied the characteristics of the propeller wash of a manoeuvring ship and the resulting bed scour based on two propellers, propeller-76 and propeller-131. The propeller characteristics used in experiments are shown in Table 2. The current propeller model used is being termed as propeller-A and propeller-B.
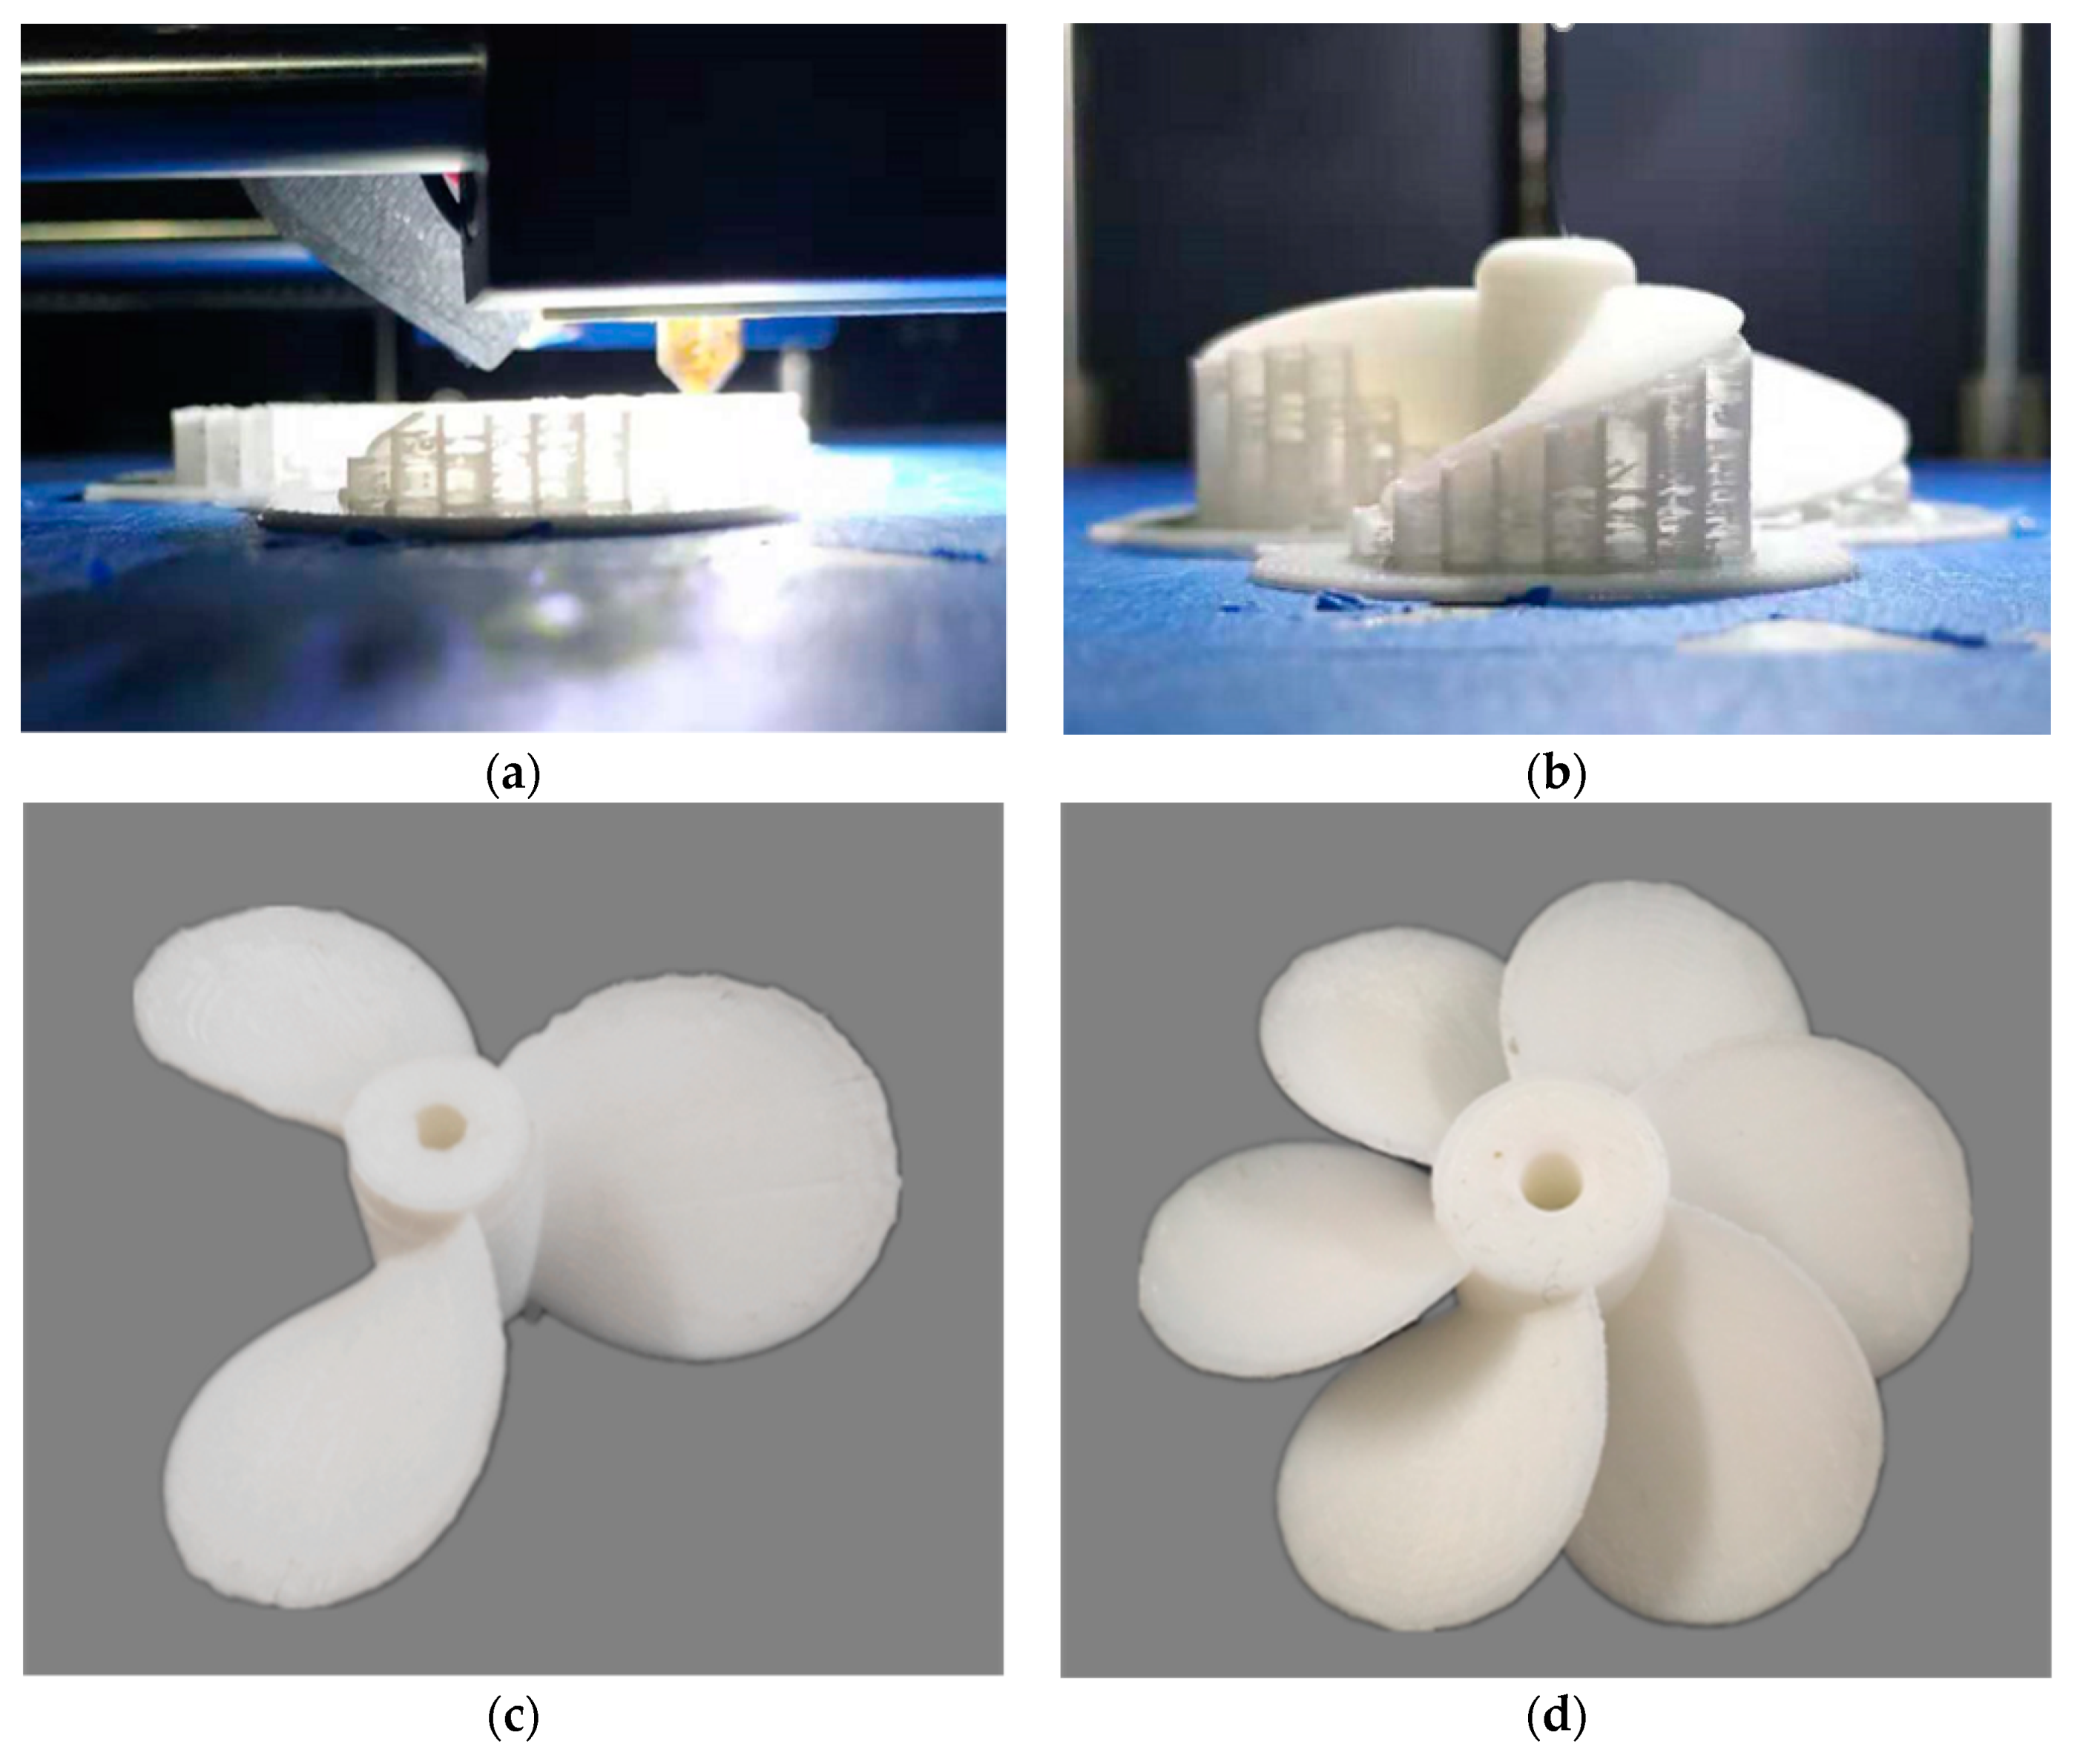
For the current experiments, the solid propeller geometry was created by using the Solidworks and printed on the 3D printer made by JG Aurora in China using biodegradable polylactic acid filament (PLA) material. The actual propeller model was created through the additive process by printing the propeller layer by layer up to 0.1 mm. Two hours were taken to complete the entire printing process. Figure 4a shown the propeller printed in progress and Figure 4b shows the completed propeller with the temporary supporting structure, which needs to be eliminated in the post-processing.
3.4. Scaling of Experiment
According to Verhey et al. [7], the scaling effects caused by viscosity are negligible if the Reynolds number for flow () and the propeller () are greater than 3 × 10³ and 7 × 10⁴. The Reynolds numbers can be calculated using Equations (1) and (2).
where is the length that depends on β as defined by Blaauw and van de Kaa [6] as Equation (3).
where V0 is the efflux velocity (m/s); Dp is the diameter of the propeller (m); Dh is the diameter of the hub (m); ν is the kinematic viscosity of the fluid (8.54 × 10⁻⁷ m2/s); n is the rotational speed (rps); β is the blade area ratio; and N is the number of blades.
Typical propeller sizes and rotational speeds that might cause seabed scouring in British ports and harbours ranged between 1.5 m and 3 m for propeller diameters running at 200–400 rpm according to Qurrain [21]. A typical ship propeller with a diameter of 1.65 m that operated at 200 rpm with a coefficient of thrust (Ct) of 0.35 was used as the prototype for the twin-propeller. The propeller rotation speeds used for this investigation were set to 500 and 700 rpm for observing the resulting scour profiles. Reynolds numbers for the proposed speed ranges were 2.9 × 10⁴ Rflow and 1.3 × 10⁴ for Rprop. In the current study, the motor speed was limited. Rprop was slightly smaller than the specified value. However, Blaauw and van de Kaa [6] and Verhey [7] proposed that these scale effects were insignificant. The Reynolds numbers for the jets were all greater than 3 × 10³ satisfying the criteria for Froudian scaling.
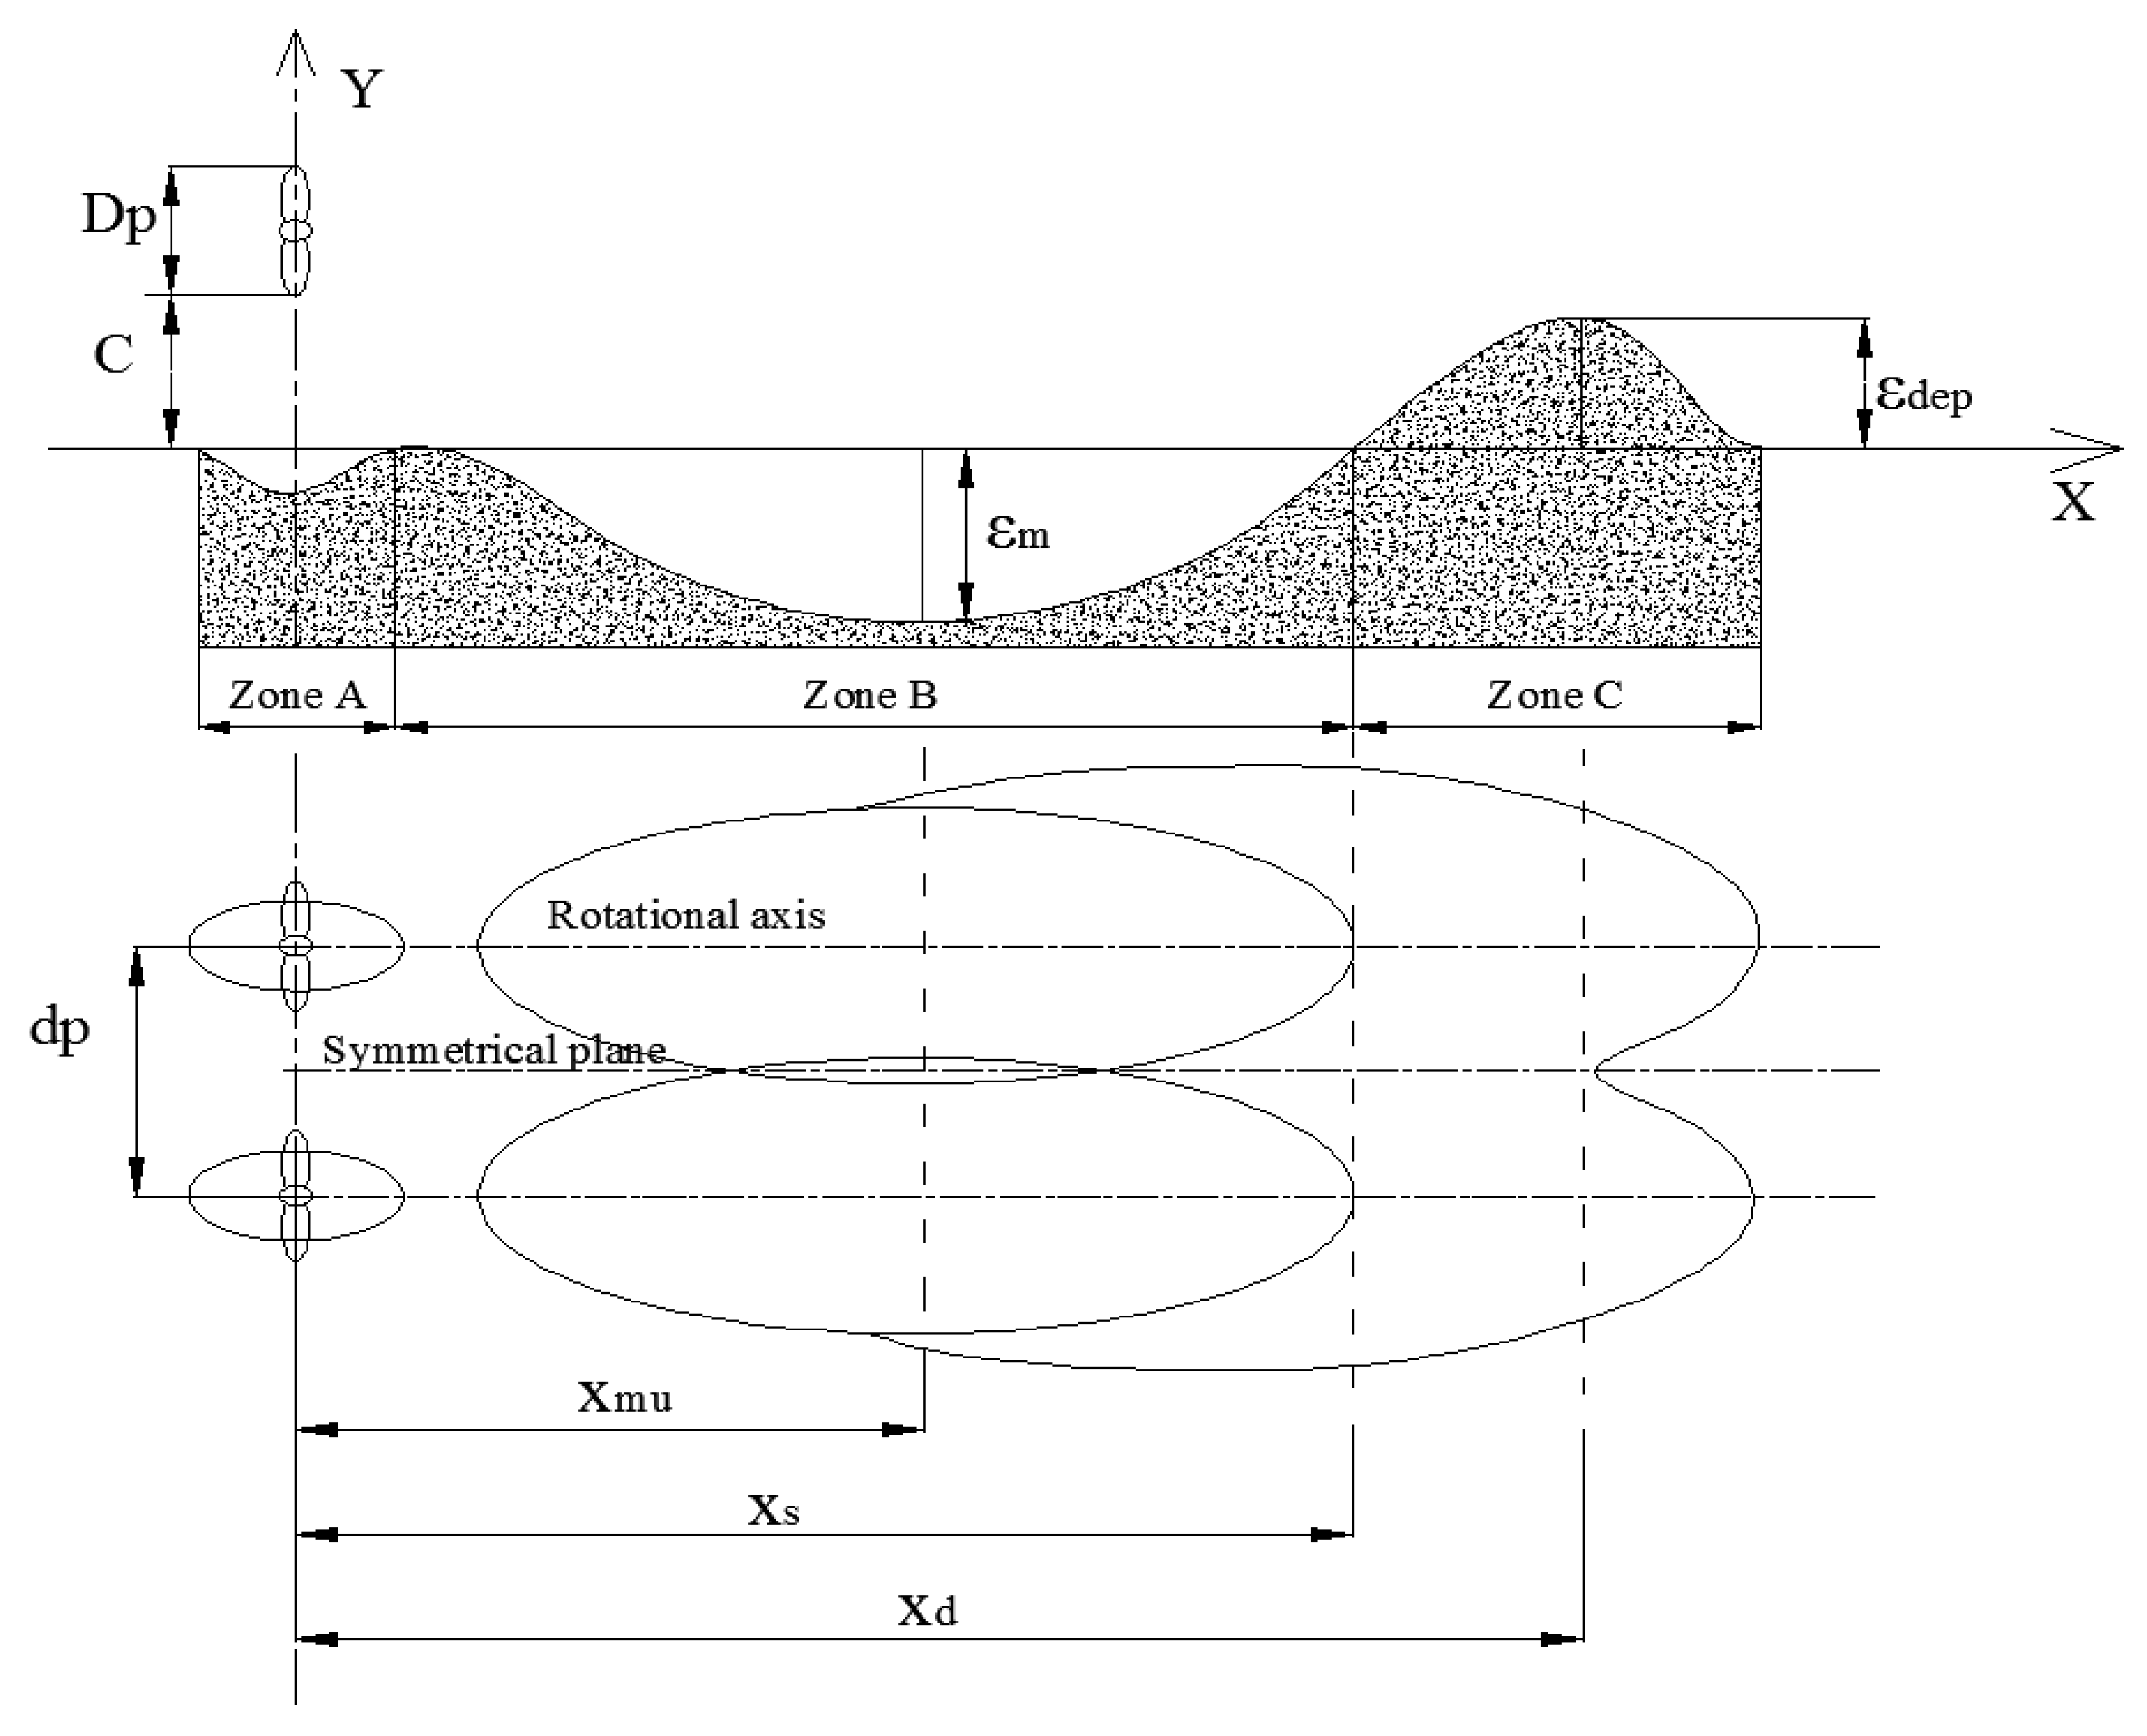
The dimensions of the scour profile induced by twin-propeller are shown in Figure 5. Hong et al. [10] stated that scour induced by a propeller can be divided into small scour hole (Zone A), primary scour hole (Zone B) and deposition dune (Zone C). The current research focused on the scour caused by the twin-propellers. Ten different twin-propeller experiments and one single-propeller experiment were set up as summarised in Table 3.
4. Twin-Propeller Jet Induced Sandbed Scour
4.1. Temporal Depth of Scour
The experiments found the maximum scour position of a twin-propeller occurred symmetrically at the rotational axis of both two propellers. The scour holes were mirrored for two propellers in the twin system at the port and starboard sides with time, as shown in Figure 6. The depth of the scoured hole increased with time from the observation of various experiments. The motor speed reached 500 rpm in a very short time and the propeller reached a stable rotation speed in 3 s. The scour data were recorded at 60, 120, 300, 600, 1200 and 1800 s in the experiment. The increase of the scour depth was insignificant after 1800 s (30 min), which reached the equilibrium state. Hong et al. [10] stated the scour process includes initial stage, developing stage, stabilisation stage and asymptotic stage. The scour process for T-1 case in current experiments is shown in Figure 6. The evolution of a typical scouring profile along the longitudinal direction was measured.
Figure 7 shows the experimental results obtained from six scour times up to 1800 s (30 min). The external rotating twin-propeller produced the two largest scour holes at the propeller axis and the scour profile was approximately symmetrical. The maximum scour depth in the axial direction of the right single propeller (starboard) was recorded. The x-axis shows the axis distance, while the y-axis indicates scour depth. The main scour hole and deposition appeared downstream of the jet. A shallow hole formed immediately below the propeller. The sediments located on the surface of the sand bed were washed downstream with time due to the jet impingement. The maximum scour depth increased gradually with time. The location of the maximum scour depth did not change significantly with time. The deposition height increased gradually with time, but the position of dune peak moves downstream with time. For the non-dimensionalised scour profile, the x-axis shows the axis distance (X/Xm), where Xm is the length of the maximum scour hole from the propeller. The y-axis indicates scour depth (εm/εmax). The non-dimensionalised scour profiles show the scour profile at different times had high similarity.
4.2. 2D Scour Section for Single-propeller
Previous researchers proposed an empirical formula to predict the maximum scour depth based on the experimental results. The scour structure of the entire scour section has not been studied. The current research studied the 2D scour profile of single-propeller and twin-propeller induced scour. The maximum scour occurred on the rotational axis of single-propeller. Hamill et al. [8] stated that the maximum scour depth location (Xm) can be calculated by Equation (4). The location of the maximum scour depth was proportional to the distance from the tip of the propeller blade to the sandbed.
Xm = F00.94C
For current propeller diameter of 55 mm, speed of 500 rpm, and C of 0.0275 m, F0 was calculated as 8.135. The maximum scour depth and position was measured, as presented in Figure 8.
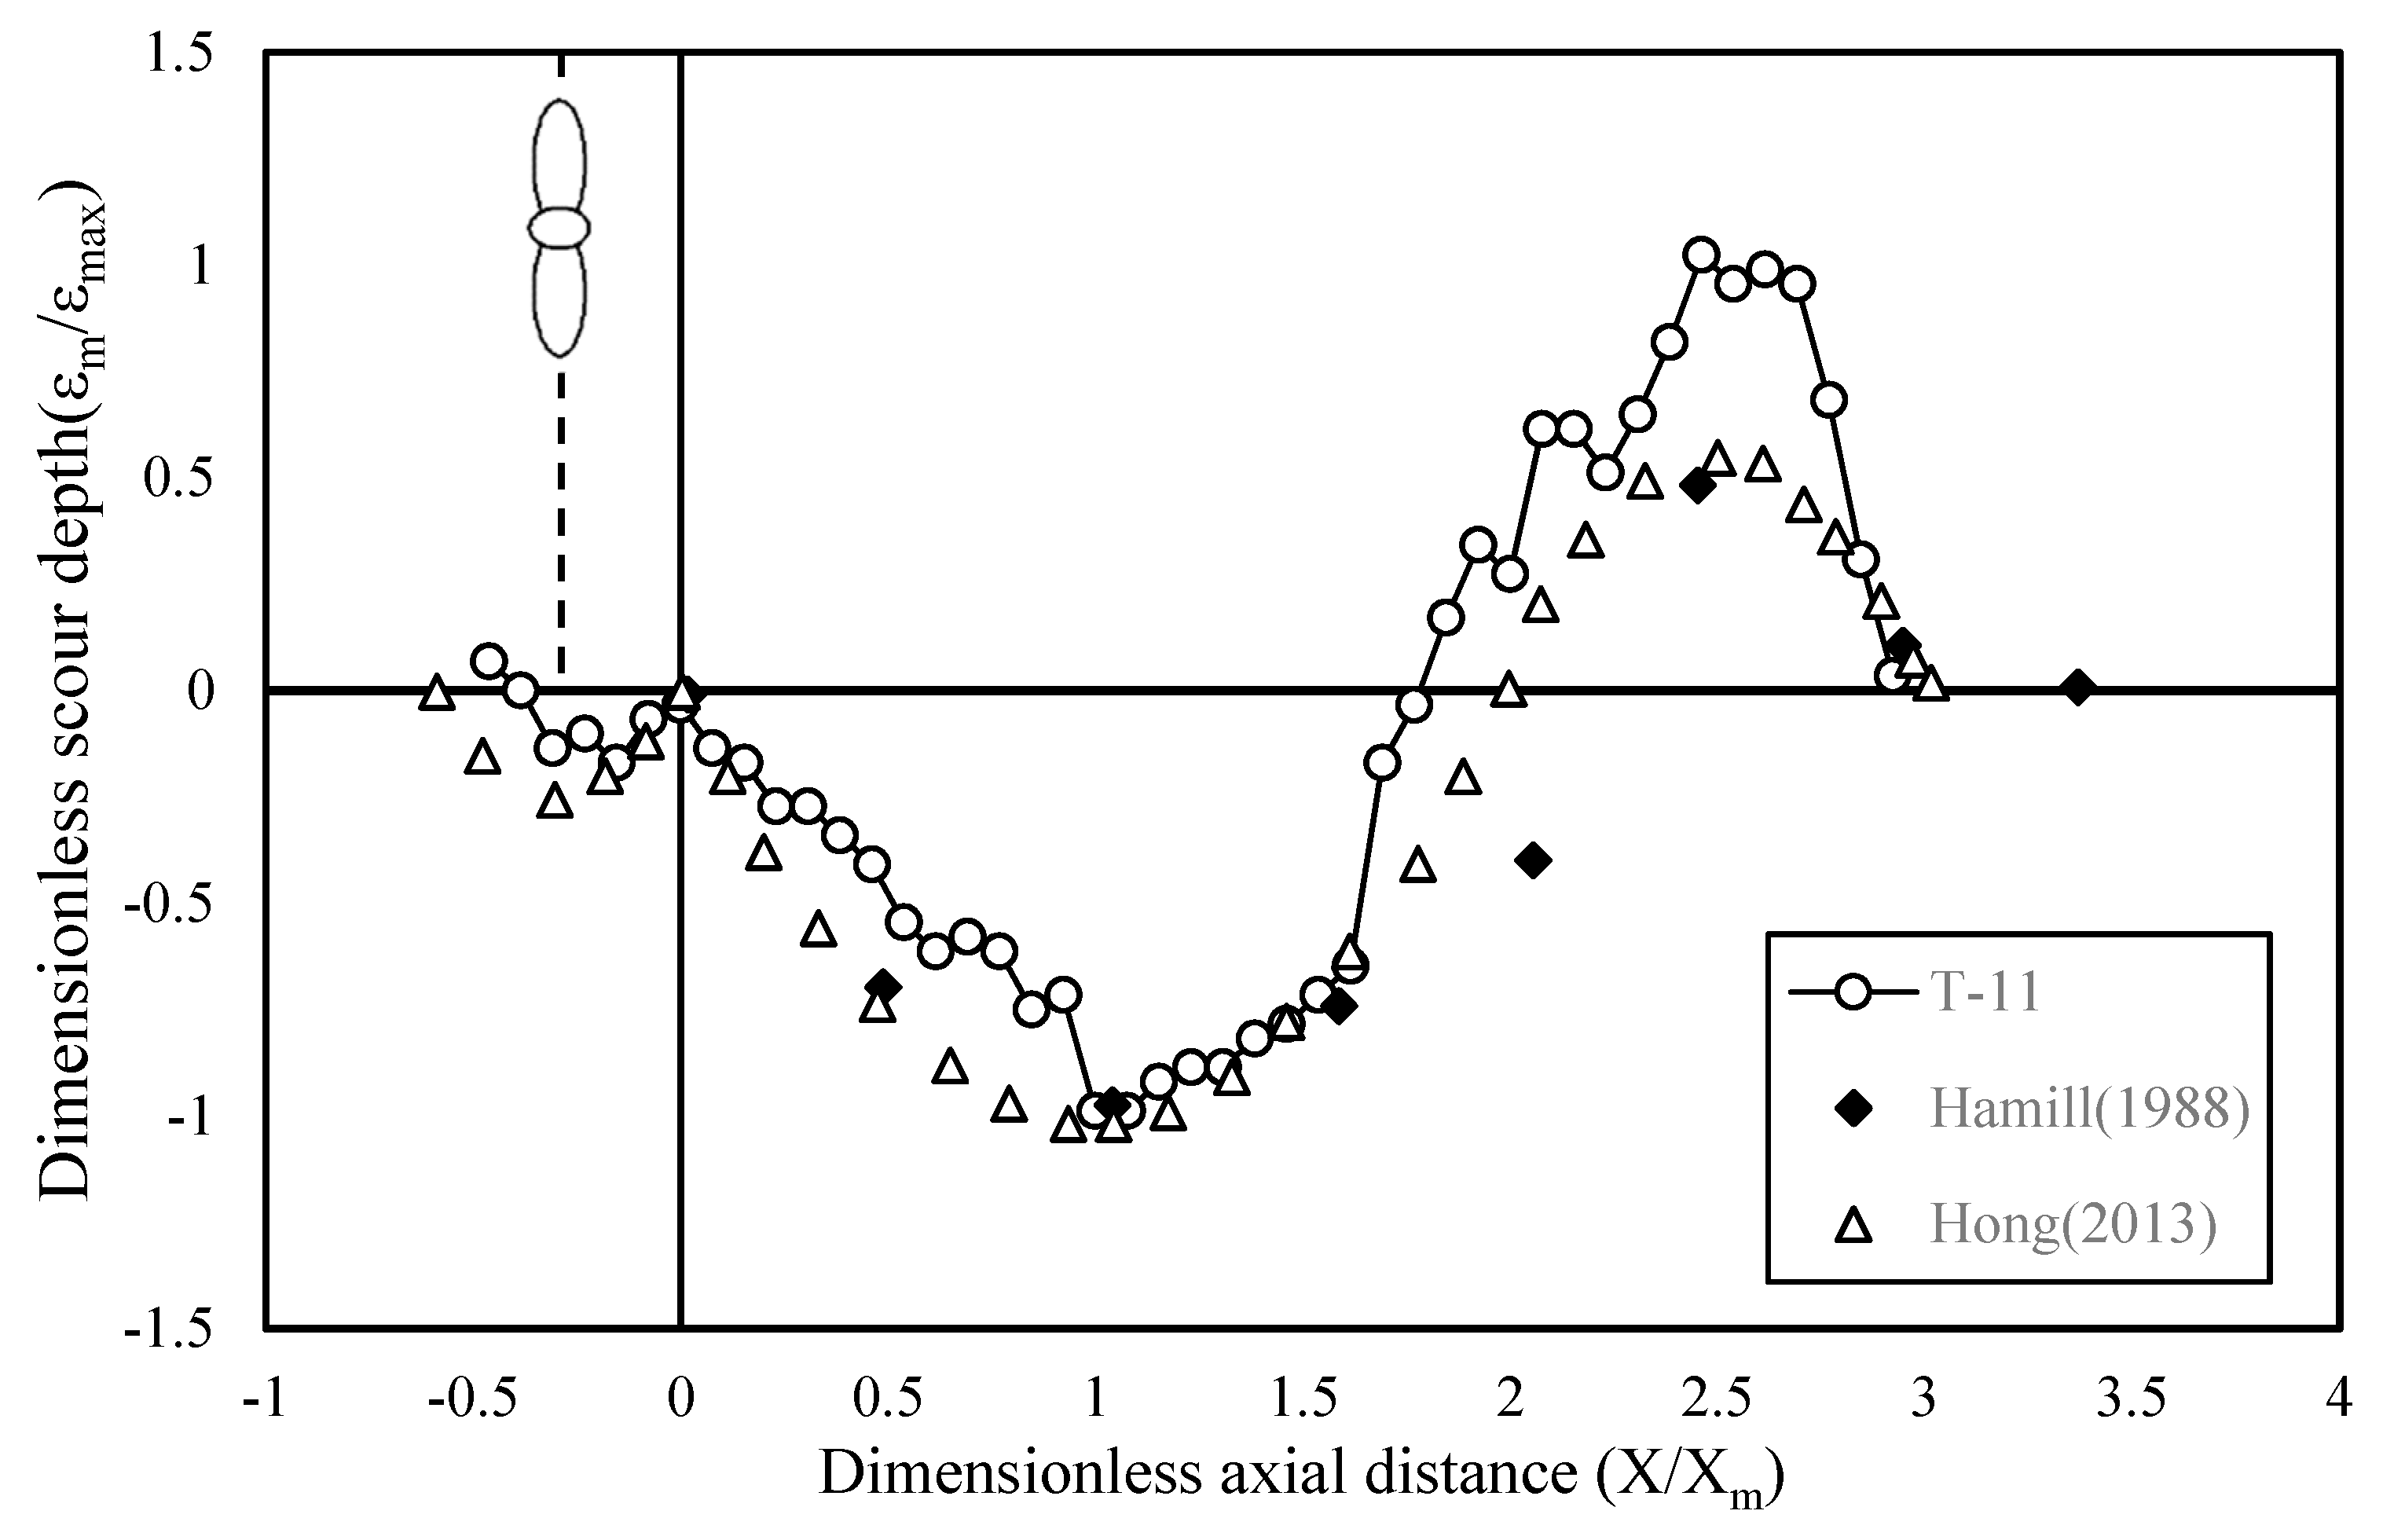
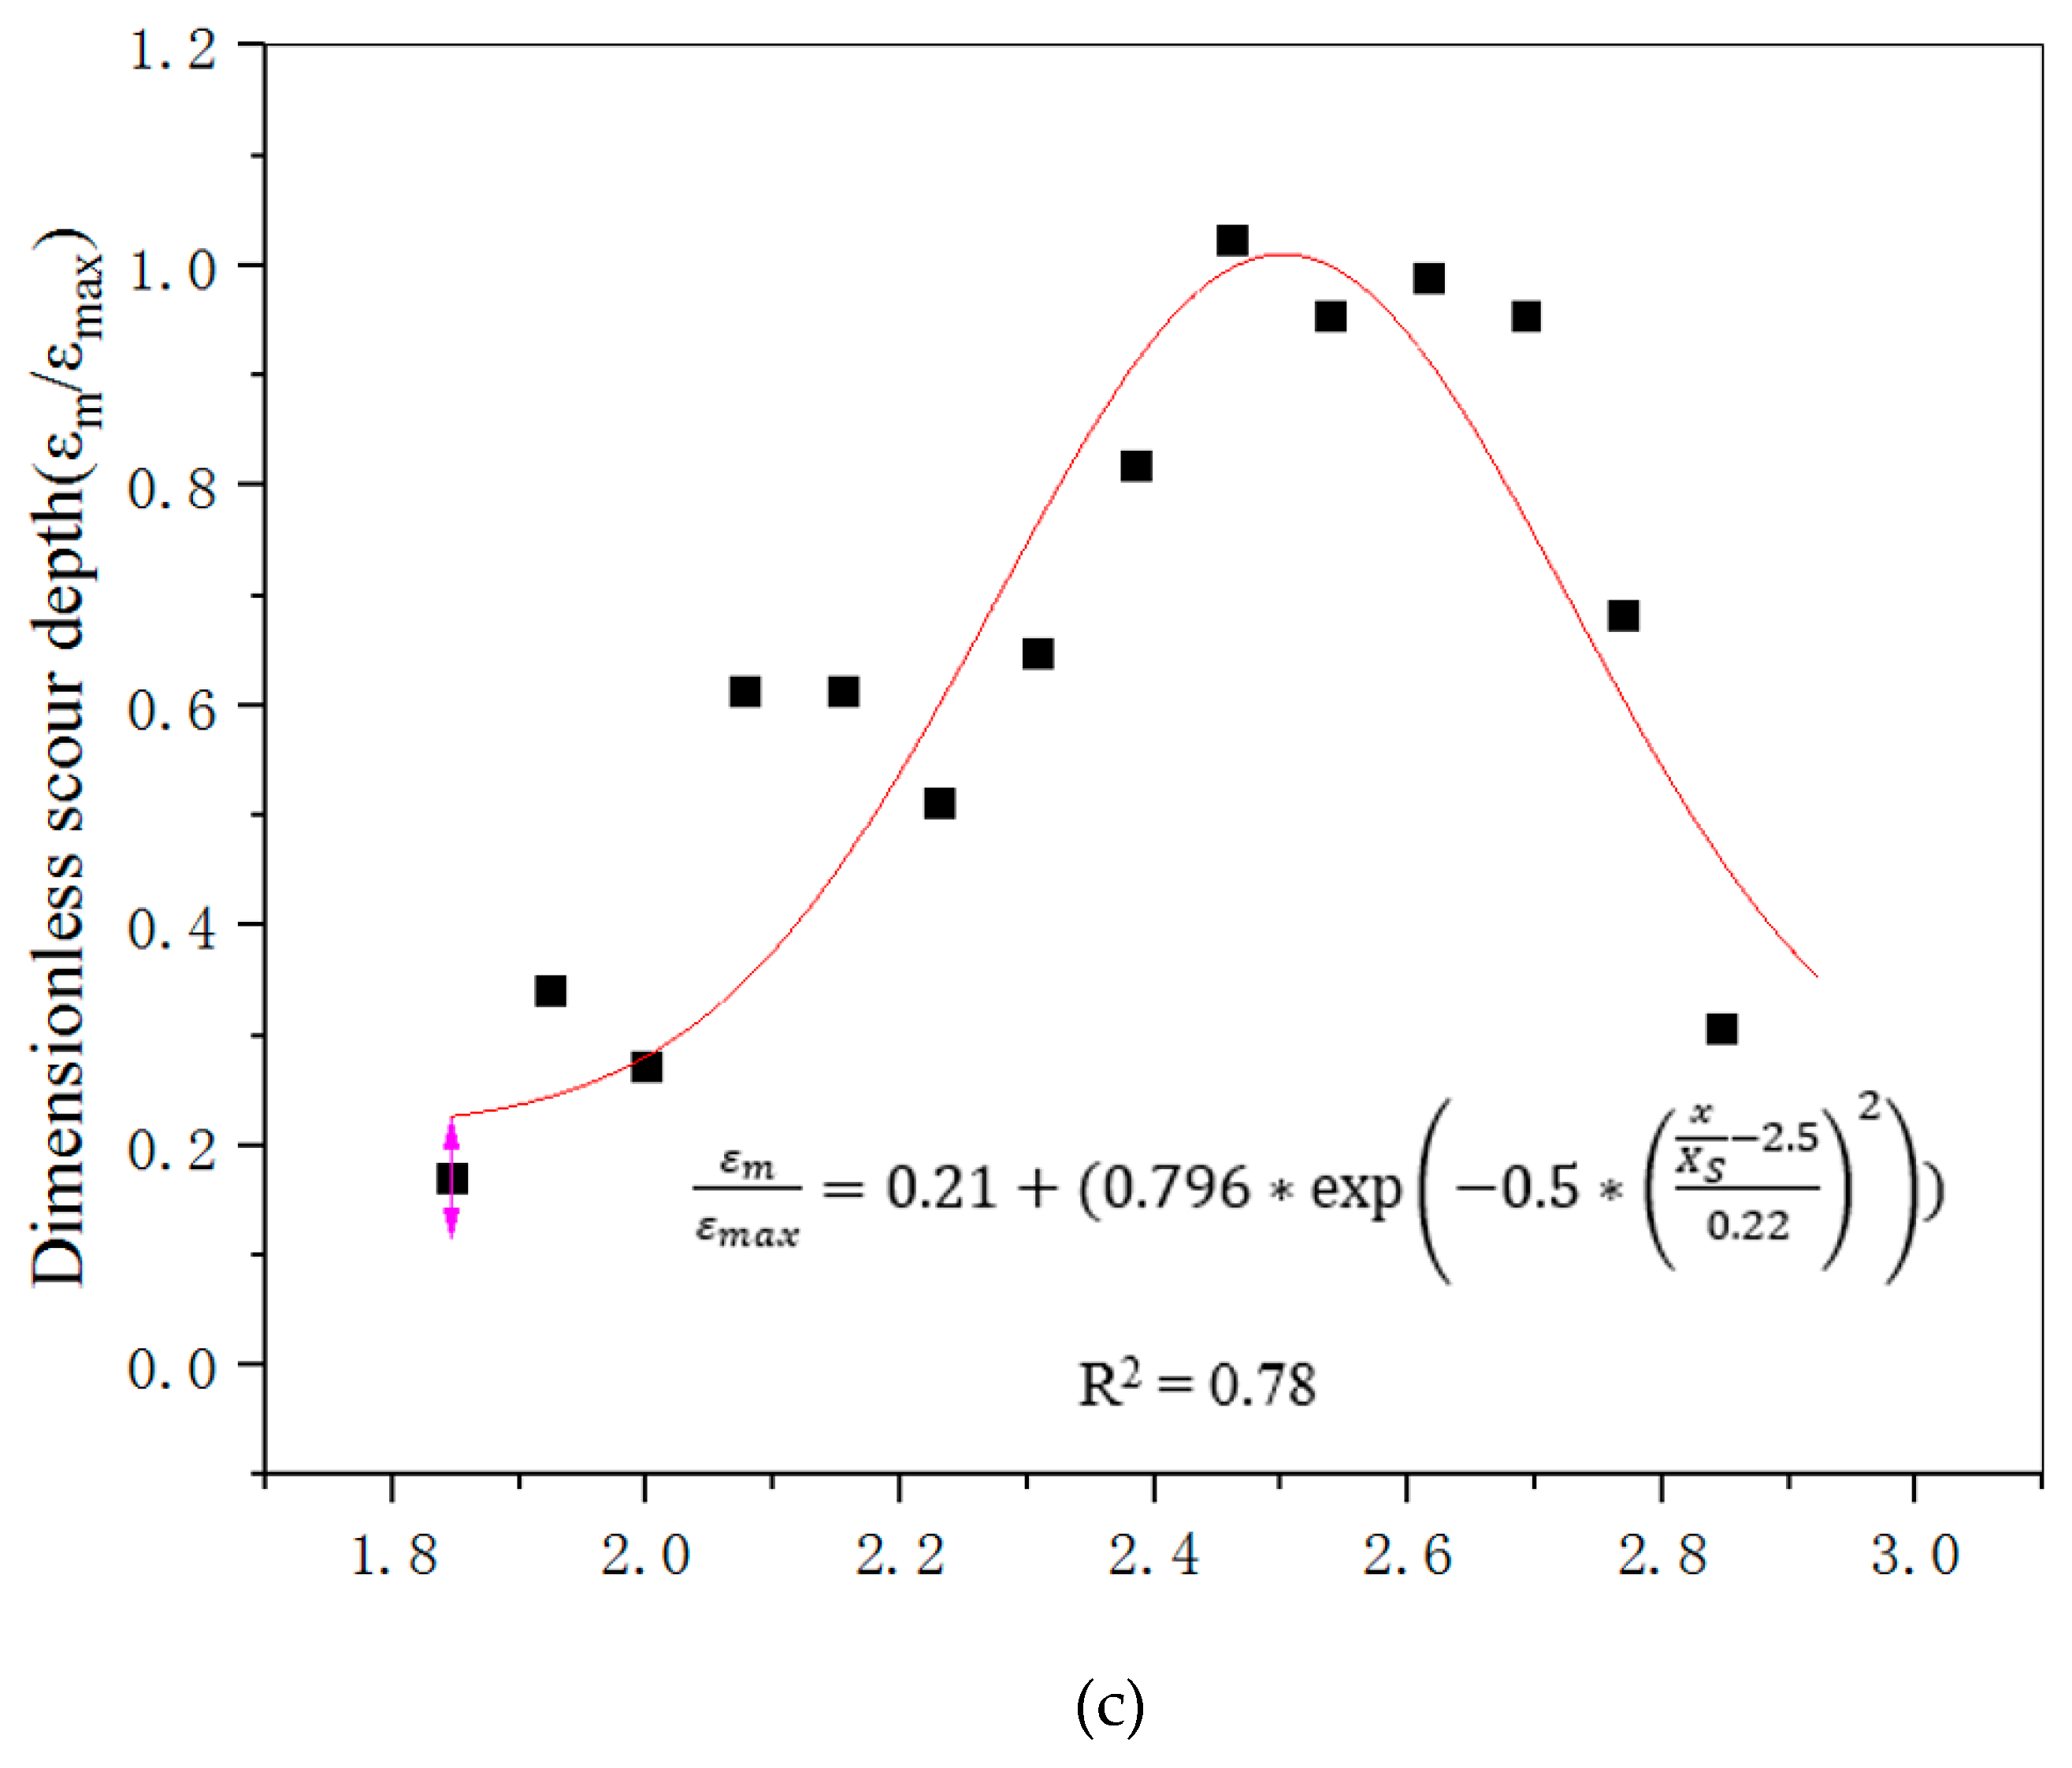
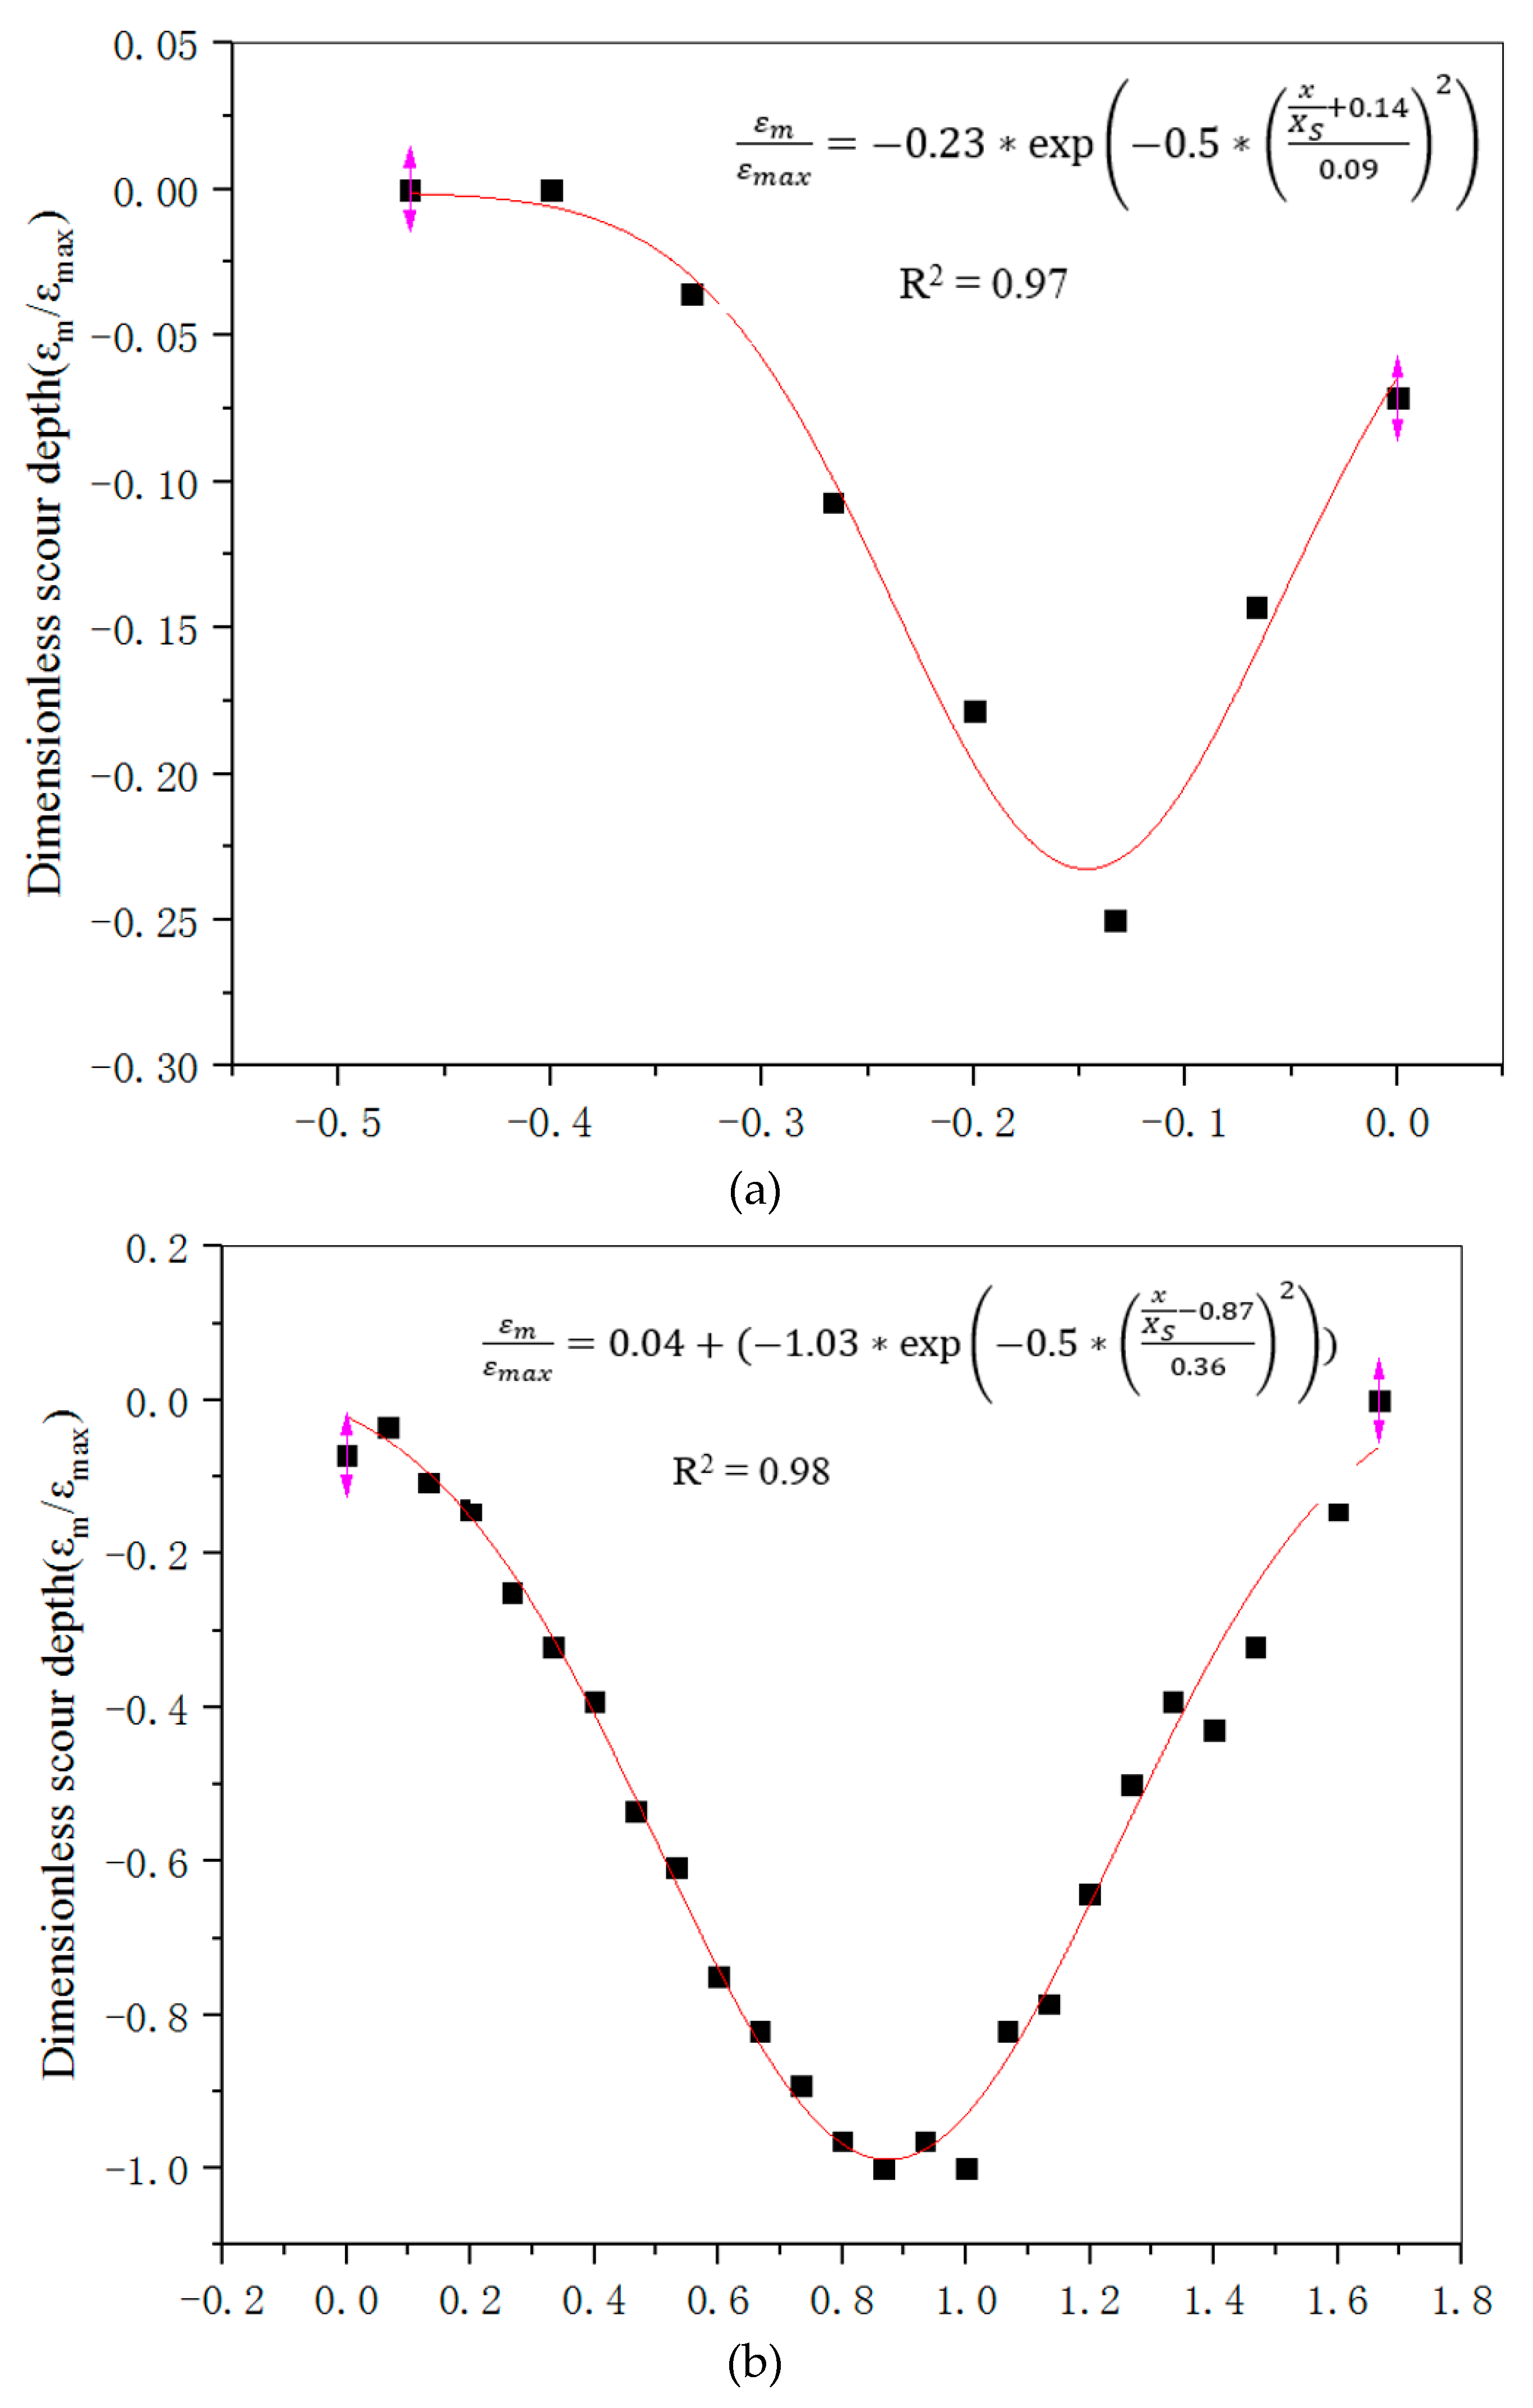
The dimensionless scour profiles show that the current research has the same scour profile compared with Hamill et al. [8] and Hong et al. [10]. The scour profile is divided into three zones: small scour hole, primary scour hole and deposition dune in order to describe the whole scour section for single-propeller. The length of each zone was necessary to describe the scour profile. Table 4 summarises the suggested dimensionless length of each zone. The current work suggests the application of a Gaussian probability distribution to represent each scour section, which the scour depth is distributed in the holes. A Gaussian distribution curve was used to fit the three zones, as shown in Figure 9.
The entire scour profile can be predicted by using Equations (5)–(7).
The proposed calculation was compared to the experimental results by Hong et al. [10] in order to validate the proposed scour equation to form 2D scour profile. The maximum scour depth was 0.107 m. The location of the maximum scour depth was 0.75 m. The comparison between the experimental results and the predicted equation is shown in Figure 10.
The results of the predicted scour profile are consistent with the experimental results. The predicted scour depth has an error of less than 20%. The current research suggests that the scour profile of a single propeller can be predicted by using Equations (5)–(7) after the maximum scour depth and position was calculated using the existing equations.
4.3. 2D Scour Section for Twin-Propeller
Scour induced by twin-propeller produced a sand deposition downstream after the primary scour hole. The deposition is in the "M" distribution with two deposition peaks at the rotational axis of both propellers. The deposition decreased towards the two propellers laterally from the M-shaped lateral scour distribution. Previous researchers did not propose a corresponding formula to predict the deposition profile.
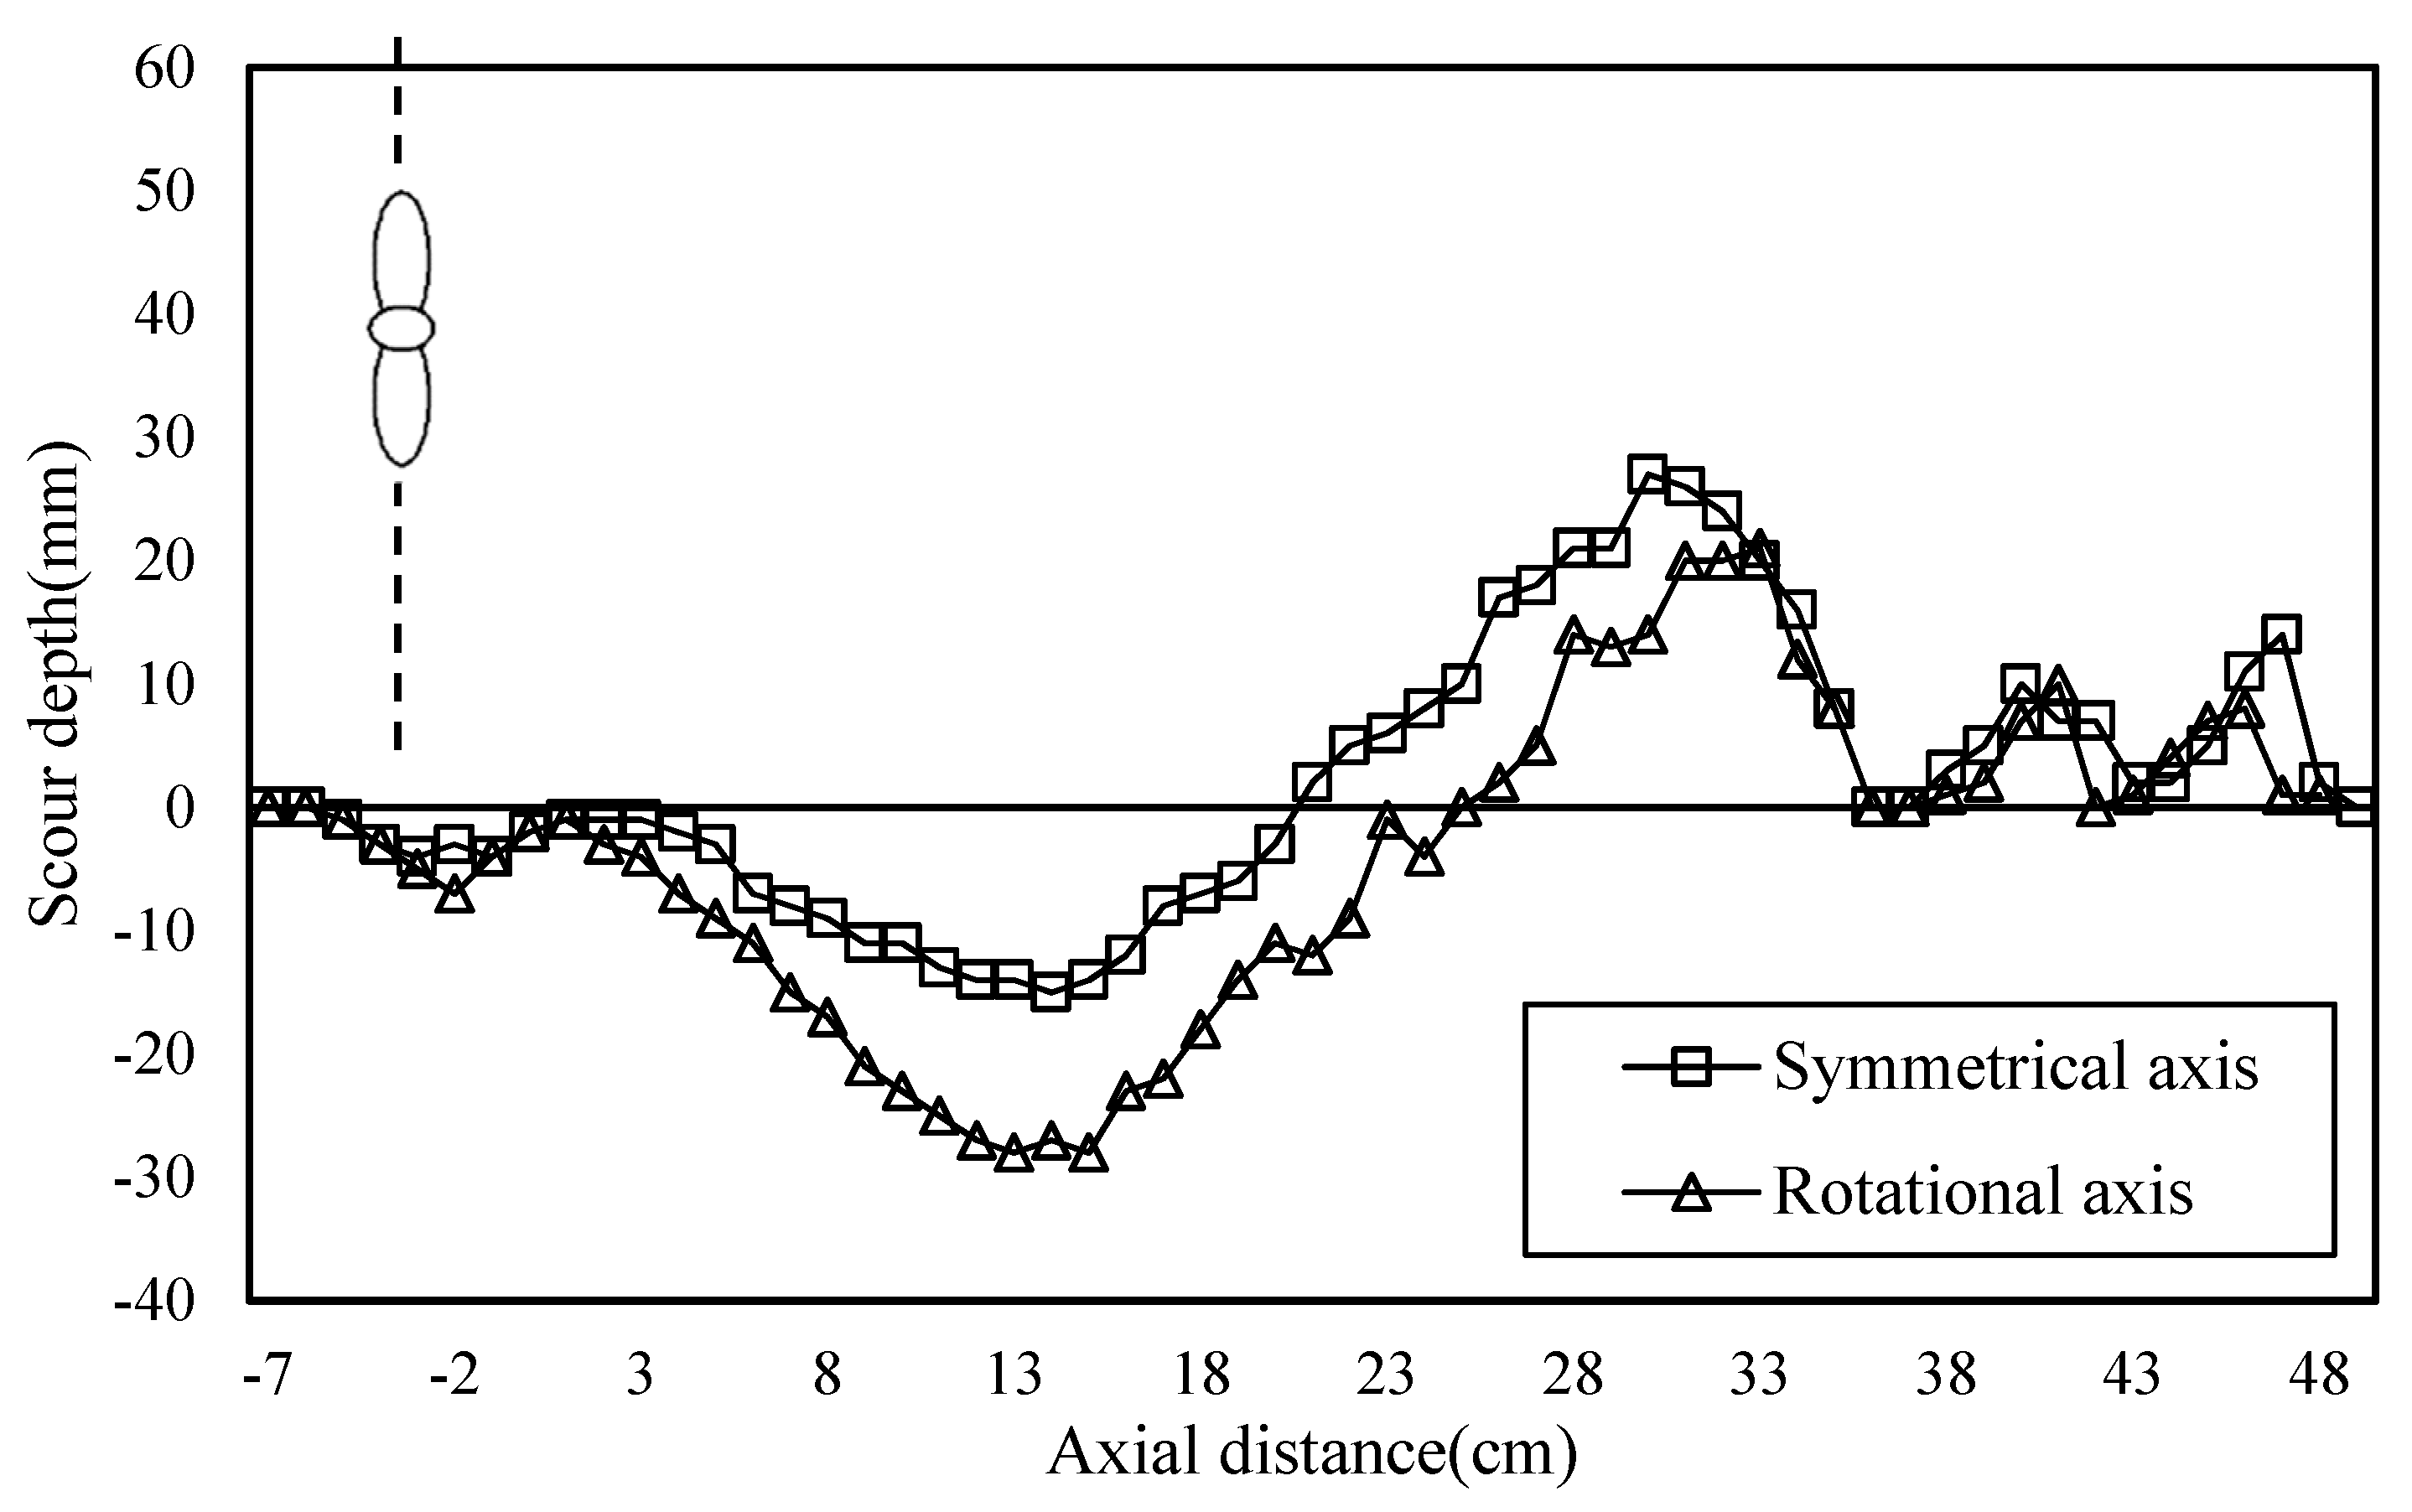
For propeller-B, the scour results were recorded at a speed of 700 rpm in T-6 case. The measured twin-propeller scour results in the rotational axis and the symmetrical plane are shown in Figure 11. The maximum scour depth on the rotational axis was significantly larger than the maximum scour depth on the symmetrical plane. The maximum deposition height on the symmetrical plane was higher than the deposition height on the rotational axis. The position of deposition peak on the symmetrical axis was 310 mm from the propeller, but the position of deposition peak on the rotational axis was 350 mm from the propeller. The experimental results show the ridge-like deposition profile with three peaks. The first deposition peak is bigger compared to the two other peaks downstream. The dimensionless scour profile on the rotational axis of twin-propeller (T-1 case) and single-propeller (T-11 case) induced scour are shown in Figure 12.
The maximum scour position for twin-propeller can be calculated by Equation (8).
Xm,twin = 2.1Dp
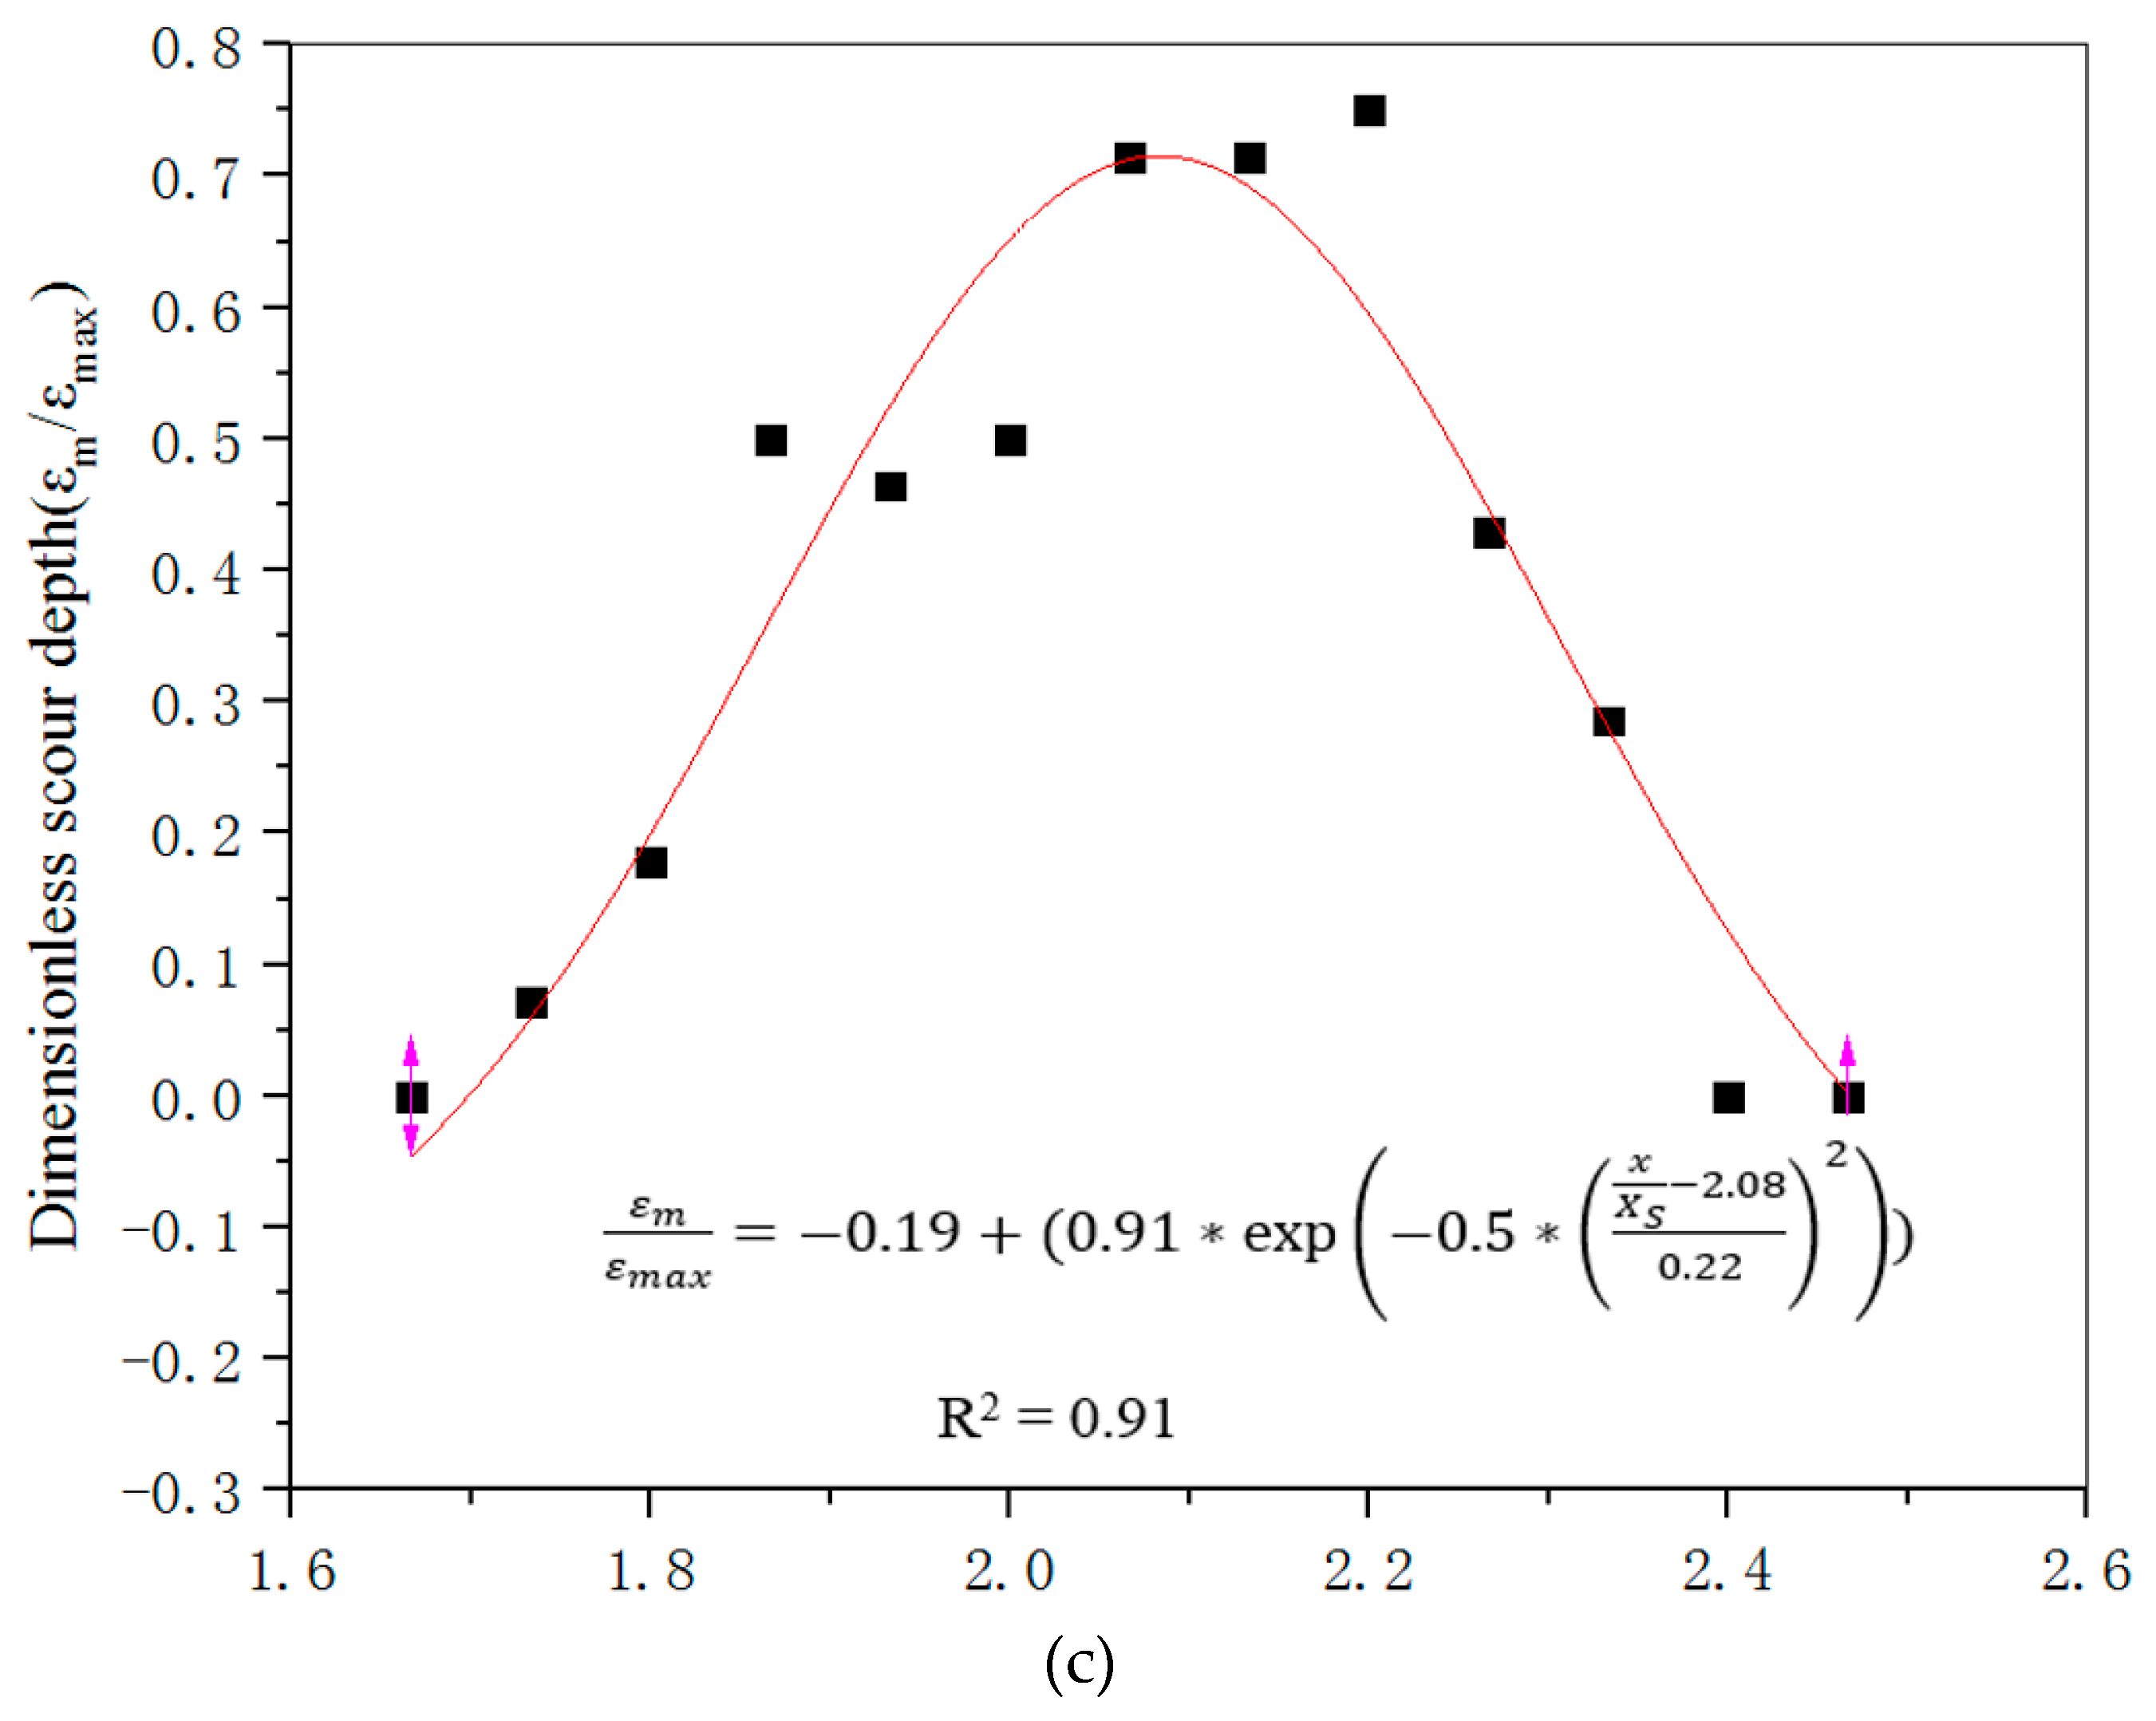
The scour profile of twin-propeller was also divided into three zones including small scour hole, primary scour hole and deposition dune. Table 5 gives the position of the maximum scour depth (Xm,twin) and the length of primary scour hole (Xs,twin). The dimensionless length of each zone was also suggested. The three zones were predicted by using the Gaussian distribution curve, as shown in Figure 13.
The entire scour profile can be predicted using Equations (9)–(11).
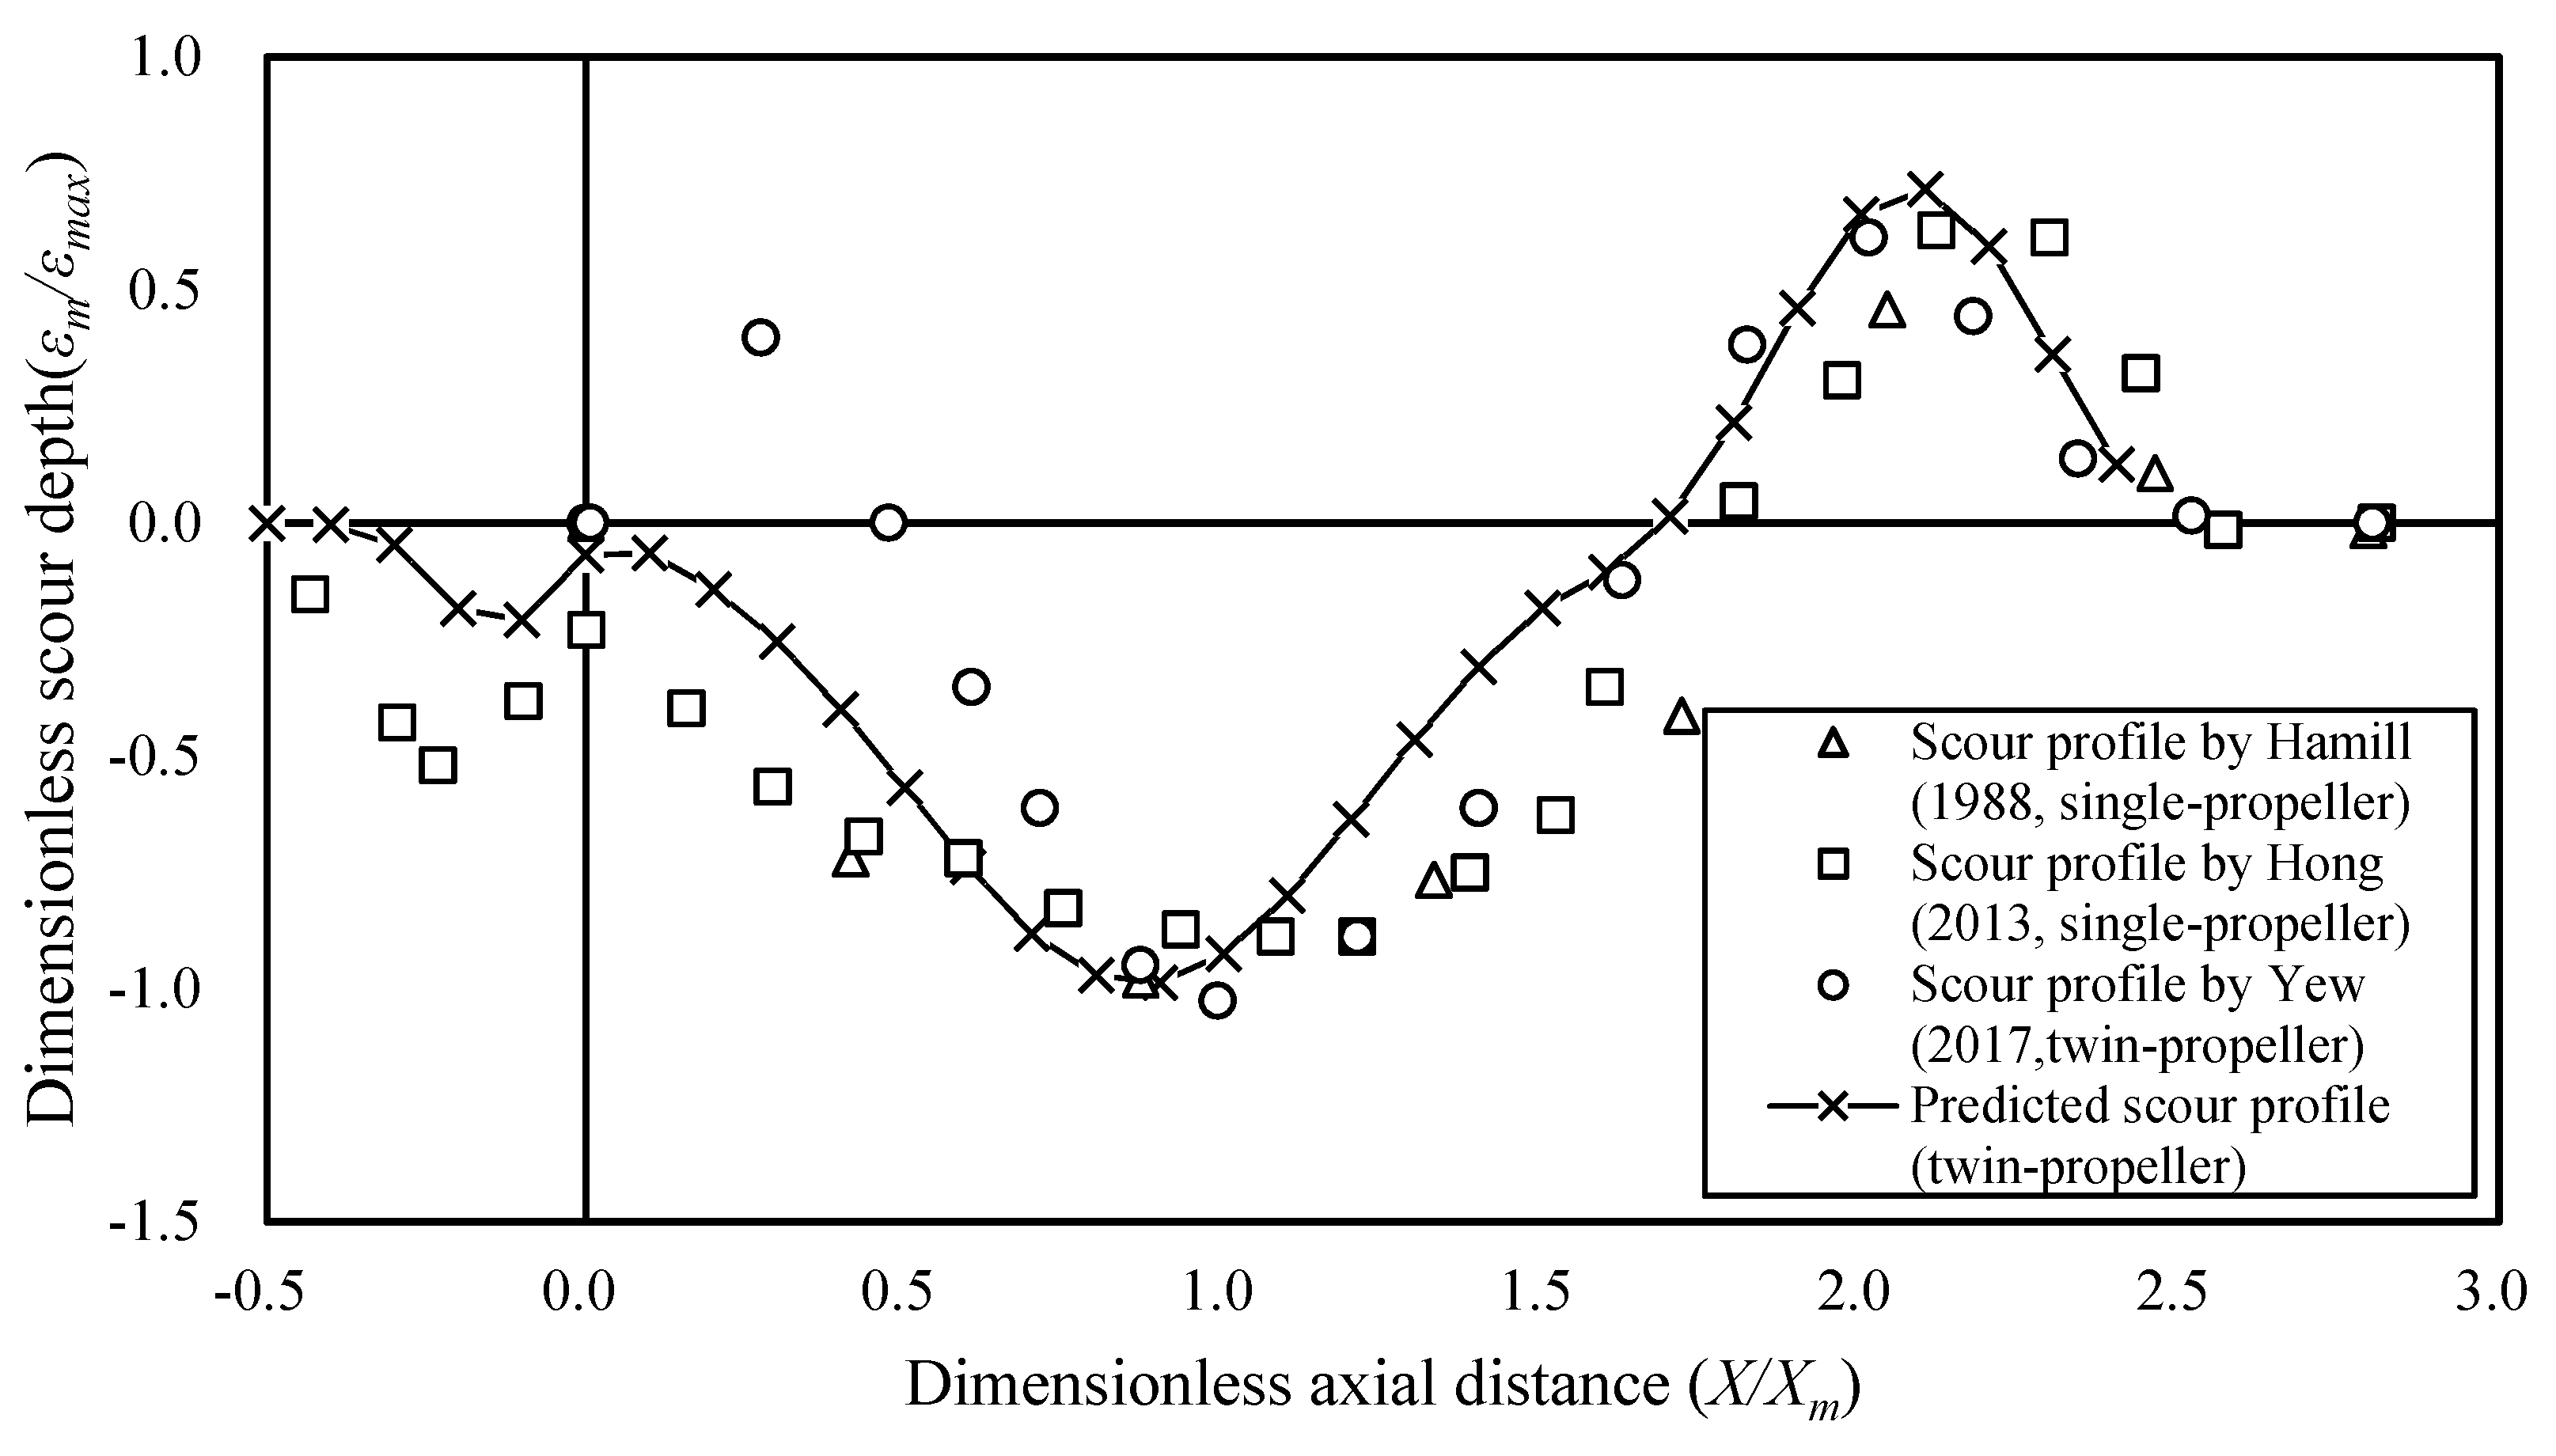
The prediction of the scour profile by twin-propeller was compared with the experimental results. The measured maximum scour depth was 28 mm. The location of the maximum scour depth was 140 mm from propeller. The comparison between the predicted equation and previous research is shown in Figure 14.
The predicted scour profile for q twin-propeller proposed by the current research agreed with the scour profile of a single-propeller by Hamill et al. [8] and Hong et al. [10]. The predicted primary scour profile was different from the research provided by Yew [16]. The current research suggests that the scour profile of a twin-propeller can be predicted by Equations (9), (10) and (11). The maximum scour depth and position should be calculated first.
5. Conclusions
Scour induced by single and twin propeller jets were investigated to present the scour structure and followed by the proposal of empirical scour equations based on the maximum scour depth and its position. Empirical scour distribution equation was proposed by using Gaussian normal distribution. The scour structure can be divided into three zones, which are the small scour hole, primary scour hole and deposition dune. 2D scour model are proposed enabling the prediction of the scour profiles for both single-propeller induced scour and twin-propeller induced scour.
For the single propeller, Equations (5)–(7) are proposed to predict the entire scour profile to establish a 2D single propeller scour model.
For the twin propeller, Equations (9)–(11) are proposed to predict the entire scour profile to establish a 2D twin propeller scour model.
Notation:
- C = clearance distance from propeller tip to bed;
- Ct = thrust coefficient;
- Dh = propeller hub diameter;
- Dp = propeller diameter;
- dp = the distance between twin-propeller;
- d50 = average sediment grain size;
- F0 = densimetric Froude number;
- n = number of revolutions per second/minute;
- N = blade number
- β = blade area ratio;
- t = time;
- εm, twin = depth of maximum scour of twin-propeller at time t;
- ZD, twin = maximum deposition height of twin-propeller at time t;
- Ω = experimental coefficient;
- Γ = experimental coefficient;
- Xm = distance to location of maximum scour for single-propeller;
- Xm,twin = distance to location of maximum scour for twin-propeller;
Author Contributions
W.-H.L.’s long term research series in ship propeller jet induced scour with former supervisor G.H.; Y.C. and W.-H.L. contributed to establish 2D scour model to predict twin-propeller scour; Y.C. wrote the manuscript with revisions, recommendations and validations from W.-H.L., T.Z., C.S. and G.H.
Funding
This research was funded by the Natural Science Foundation of Tianjin City: 18JCYBJC21900 and The APC was funded by the Natural Science Foundation of Tianjin City: 18JCYBJC21900.
Acknowledgments
The authors wish to extend their gratitude to the School of Civil Engineering at Tianjin University for laboratory space; Queen’s University Belfast, University of Plymouth, University of Oxford, Dalian University of Technology, University of Malaya (HIR ENG47), Universiti Teknologi Malaysia, and Southern University College for their past support; and professional bodies EI, IEI, IET, BCS, IEM, IEAust, ASCE, ECUK, SCUK, BEM, FEANI, AFEO, MINDS and academy AAET for membership support and available resources.
Conflicts of Interest
The authors declare no conflict of interest.
References
- Kim, Y.G.; Kim, S.Y.; Kim, H.T.; Lee, S.K.; Yu, B.S. Prediction of the manoeuvrability of a large container ship with twin-propeller and twin rudders. Mar. Sci. Technol. 2007, 12, 130–138. [Google Scholar] [CrossRef]
- MarCom Working Group 180. Guidelines for Protecting Berthing Structures from Scour Caused by Ships; PIANC: Brussels, Belgium, 2015. [Google Scholar]
- Hamill, G.A. Characteristics of the Screw Wash of a Manoeuvring Ship and the Resulting Bed Scour. Ph.D. Thesis, Queen’s University of Belfast, Belfast, Northern Ireland, 1987. [Google Scholar]
- Gaythwaite, J. Design of Marine Facilities for the Berthing, Mooring, and Repair of Vessels; ASCE: Reston, VA, USA, 2004. [Google Scholar] [CrossRef]
- Albertson, M.L.; Dai, Y.B.; Jensen, R.A.; Rouse, H. Diffusion of submerged jets. Trans. Am. Soc. Civ. Eng. 1950, 115, 639–697. [Google Scholar]
- Blaauw, H.G.; van de Kaa, E.J. Erosion of Bottom and Sloping Banks Caused by the Screw Race of the Manoeuvring Ships; Delft Hydraulics Laboratory: Delft, The Netherlands, 1978. [Google Scholar]
- Verhey, H.J.; Blockland, T.; Bogaerts, M.P.; Volger, D.; Weyde, R.W. Experiences in Netherlands with Quay Structures Subjected to Velocities Created by Bow Thrusters and Main Propellers of Mooring and Unmooring Ships; PIANC: Brussels, Belgium, 1987. [Google Scholar]
- Hamill, G.A. The Scouring Action of the Propeller jet Produced by a Slowly Manoeuvring Ship; PIANC: Brussels, Belgium, 1988. [Google Scholar]
- Lam, W.H.; Hamill, G.A.; Robinson, D.; Raghunathan, S. Observations of the initial 3D flow from a ship’s propeller. Ocean Eng. 2010, 37, 1380–1388. [Google Scholar] [CrossRef]
- Hong, J.H.; Chiew, Y.M.; Cheng, N.S. Scour Caused by a Propeller Jet. J. Hydraul. Eng. 2013, 139, 1003–1012. [Google Scholar] [CrossRef]
- Hamill, G.A.; Johnston, H.T.; Stewart, D.P. Propeller wash scour near quay walls. J. Waterw. Port Coast. Ocean Eng. 1999, 4, 170–175. [Google Scholar] [CrossRef]
- Wang, S.; Lam, W.H.; Cui, Y.; Zhang, T.; Jiang, J.; Sun, C.; Guo, J.; Ma, Y.; Hamill, G. Novel energy coefficient used to predict efflux velocity of tidal current turbine. Energy 2017, 158, 730–745. [Google Scholar] [CrossRef]
- Sun, C.; Lam, W.H.; Cui, Y.; Zhang, T.; Jiang, J.; Guo, J.; Ma, Y.; Wang, S.; Tan, T.H.; Chuah, J.H.; et al. Empirical model for Darrieus-type tidal current turbine induced seabed scour. Energy Convers. Manag. 2018, 171, 478–490. [Google Scholar] [CrossRef] [Green Version]
- Ma, Y.; Lam, W.H.; Cui, Y.; Zhang, T.; Jiang, J.; Sun, C.; Guo, J.; Wang, S.; Lam, S.S.; Hamill, G. Theoretical vertical-axis tidal-current-turbine wake model using axial momentum theory with CFD corrections. Appl. Ocean Res. 2018, 79, 113–122. [Google Scholar] [CrossRef] [Green Version]
- Jiang, J.; Lam, W.-H.; Cui, Y.; Zhang, T.; Sun, C.; Guo, J.; Ma, Y.; Wang, S.; Hamill, G. Ship Twin-propeller Jet Model used to Predict the Initial Velocity and Velocity Distribution within Diffusing Jet. KSCE J. Civ. Eng. 2019, 23, 1118–1131. [Google Scholar] [CrossRef] [Green Version]
- Yew, W.T. Seabed Scour Induced by Twin-propeller Ships. Ph.D. Thesis, University of Malaya, Kuala Lumpur, Malaysia, 2017. [Google Scholar]
- Hamill, G.A.; Kee, C. Predicting axial velocity profiles within a diffusing marine propeller jet. Ocean Eng. 2016, 124, 104–112. [Google Scholar] [CrossRef] [Green Version]
- Chiew, Y.M.; Lim, S.Y. Local Scour by a Deeply Submerged Horizontal Circular Jet. J. Hydraul. Eng. 2016, 122, 529–532. [Google Scholar] [CrossRef]
- Chen, L.; Lam, W.H. Methods for predicting seabed scour around marine current turbine. Renew. Sustain. Energy Rev. 2014, 29, 683–692. [Google Scholar] [CrossRef]
- Mujal-Colilles, A.; Gironella, X.; Crespo, A.J.C.; Sanchez-Arcilla, A. Study of the Bed Velocity Induced by Twin Propellers. J. Waterw. Port Coast. Ocean Eng. 2017, 145, 04017013. [Google Scholar] [CrossRef]
- Qurrain, R. Influence of the Sea Bed Geometry and Berth Geometry on the Hydrodynamics of the Wash from a Ship’s Propeller. Ph.D. Thesis, Queen’s University of Belfast, Belfast, Northern Ireland, 1994. [Google Scholar]
Figure 1.
Flow structure of a twin-propeller jet [15].
Figure 1.
Flow structure of a twin-propeller jet [15].

Figure 2.
Schematic diagram of the experiment (1.2 m × 0.8 m × 0.45 m). (a) Plan view; (b) longitudinal cross-section (A-A).
Figure 2.
Schematic diagram of the experiment (1.2 m × 0.8 m × 0.45 m). (a) Plan view; (b) longitudinal cross-section (A-A).

Figure 3.
Measurement system: (1) Laser rangefinder; (2) optical axis and sliding block; (3) support; (4) experimental tank.
Figure 3.
Measurement system: (1) Laser rangefinder; (2) optical axis and sliding block; (3) support; (4) experimental tank.

Figure 4.
3D printing for propeller model. (a) Printing status; (b) print completed; (c) propeller-A; (d) propeller-B.
Figure 4.
3D printing for propeller model. (a) Printing status; (b) print completed; (c) propeller-A; (d) propeller-B.

Figure 5.
Dimensions of the scour profile induced by twin-propeller.

Figure 6.
Temporal scour processes for twin-propeller, (a) 60 s; (b) 120 s; (c) 300 s; (d) 600 s; (e) 1200 s; (f) 1800 s.
Figure 6.
Temporal scour processes for twin-propeller, (a) 60 s; (b) 120 s; (c) 300 s; (d) 600 s; (e) 1200 s; (f) 1800 s.

Figure 7.
Dimensionless scour depth for a twin-propeller.

Figure 8.
Dimensionless scour profiles for a single-propeller.

Figure 9.
Dimensionless scour section of different zones. (a) Small scour hole (−0.5 < X/Xm < 0); (b) primary scour hole (0 < X/Xm < 1.8); (c) deposition dune (1.8 < X/Xm < 3).
Figure 9.
Dimensionless scour section of different zones. (a) Small scour hole (−0.5 < X/Xm < 0); (b) primary scour hole (0 < X/Xm < 1.8); (c) deposition dune (1.8 < X/Xm < 3).


Figure 10.
Comparison between the experimental values and the predicted equation.

Figure 11.
Scour on rotational axis and symmetrical planes for twin-propeller.

Figure 12.
Scour induced by a twin-propeller and single-propeller.

Figure 13.
Dimensionless scour section of different zones for twin-propeller. (a) Small scour hole (−0.5 < X/Xm,twin < 0); (b) primary scour hole (0 < X/Xm,twin < 1.6); (c) deposit mound (1.6 < X/Xm,twin < 2.6).
Figure 13.
Dimensionless scour section of different zones for twin-propeller. (a) Small scour hole (−0.5 < X/Xm,twin < 0); (b) primary scour hole (0 < X/Xm,twin < 1.6); (c) deposit mound (1.6 < X/Xm,twin < 2.6).


Figure 14.
Comparison between the predicted equation and previous research.


Table 1.
Summarised scour depth induced by the propeller.
| Source | Scour Type | Equations |
|---|---|---|
| Chiew [18] | Circular jet | |
| Hamill [8] | Single propeller | |
| Hamill [11] | Single propeller | |
| Hong [10] | Single propeller | |
| Yew [16] | Twin propeller | |
| Cui | Twin propeller |
Table 2.
Propeller characteristics.
| Propeller | N | Dp (mm) | Ct | P’ | β | Dh (mm) |
|---|---|---|---|---|---|---|
| A | 3 | 55 | 0.40 | 1.00 | 0.47 | 11.5 |
| B | 6 | 55 | 0.56 | 1.14 | 0.922 | 11.5 |
Table 3.
Summary of experiments.
| Experiment | Propeller | Distance between Propeller Hubs, dp | C (mm) | n (rpm) |
|---|---|---|---|---|
| T-1 | Propeller-A | 1.5 Dp | 27.5 | 500 |
| T-2 | Propeller-A | 1.5 Dp | 55.0 | 500 |
| T-3 | Propeller-A | 2.0 Dp | 27.5 | 700 |
| T-4 | Propeller-A | 2.0 Dp | 55.0 | 700 |
| T-5 | Propeller-B | 1.5 Dp | 27.5 | 500 |
| T-6 | Propeller-B | 1.5 Dp | 55.0 | 700 |
| T-7 | Propeller-B | 2.0 Dp | 27.5 | 500 |
| T-8 | Propeller-B | 2.0 Dp | 55.0 | 700 |
| T-9 | Propeller-A | 3.0 Dp | 27.5 | 500 |
| T-10 | Propeller-A | 3.0 Dp | 55.0 | 500 |
| T-11 | Single-propeller (Propeller-A) | / | 27.5 | 500 |
Table 4.
Dimensionless length of each zone for single-propeller induced scour.
| Source | Small Scour Hole (Zone A) | Primary Scour Hole (Zone B) | Deposition Dune (Zone C) |
|---|---|---|---|
| Hamill [8] | No defined | 0 < X/Xm < 1.7 | 1.7 < X/Xm < 2.2 |
| Hong [10] | −0.5 < X/Xm < 0 | 0 < X/Xm < 1.83 | 1.83 < X/Xm < 2.9 |
| Current research | −0.45 < X/Xm < 0 | 0 < X/Xm < 1.8 | 1.8 < X/Xm < 3 |
| Suggested length | −0.5 < X/Xm < 0 | 0 < X/Xm < 1.8 | 1.8 < X/Xm < 3 |
Table 5.
Dimensionless length of each zone for twin-propeller induced scour.
| Case | Xm,twin (m) | Xs,twin (m) | Small Scour Hole (Zone A) | Primary Scour Hole (Zone B) | Deposition Dune (Zone C) |
|---|---|---|---|---|---|
| T-1 | 0.15 | 0.24 | −0.5 < X/Xm < 0 | 0 < X/Xm < 1.58 | 1.58 < X/Xm < 2.4 |
| T-2 | 0.17 | 0.28 | −0.5 < X/Xm < 0 | 0 < X/Xm < 1.63 | 1.63 < X/Xm < 2.6 |
| T-3 | 0.18 | 0.29 | −0.45 < X/Xm < 0 | 0 < X/Xm < 1.62 | 1.62 < X/Xm < 2.8 |
| T-4 | 0.17 | 0.28 | −0.5 < X/Xm < 0 | 0 < X/Xm < 1.65 | 1.65 < X/Xm < 2.7 |
| T-5 | 0.15 | 0.23 | −0.5 < X/Xm < 0 | 0 < Xm < 1.53 | 1.53 < X/Xm < 2.4 |
| T-6 | 0.17 | 0.27 | −0.5 < X/Xm < 0 | 0 < X/Xm < 1.6 | 1.6 < X/Xm < 2.6 |
| T-7 | 0.19 | 0.33 | −0.5 < X/Xm < 0 | 0 < X/Xm < 1.72 | 1.72 < X/Xm < 3 |
| T-8 | 0.18 | 0.31 | −0.5 < X/Xm < 0 | 0 < X/Xm < 1.71 | 1.71 < X/Xm < 2.9 |
| T-9 | 0.14 | 0.24 | −0.5 < X/Xm < 0 | 0 < X/Xm < 1.68 | 1.68 < X/Xm < 2.8 |
| T-10 | 0.15 | 0.25 | −0.5 < X/Xm < 0 | 0 < X/Xm < 1.64 | 1.64 < X/Xm < 2.8 |
| Suggested length | / | / | −0.5 < X/Xm < 0 | 0 < X/Xm < 1.6 | 1.6 < X/Xm < 2.6 |
© 2019 by the authors. Licensee MDPI, Basel, Switzerland. This article is an open access article distributed under the terms and conditions of the Creative Commons Attribution (CC BY) license (http://creativecommons.org/licenses/by/4.0/).
Share and Cite
MDPI and ACS Style
Cui, Y.; Lam, W.H.; Zhang, T.; Sun, C.; Hamill, G. Scour Induced by Single and Twin Propeller Jets. Water 2019, 11, 1097. https://doi.org/10.3390/w11051097
AMA Style
Cui Y, Lam WH, Zhang T, Sun C, Hamill G. Scour Induced by Single and Twin Propeller Jets. Water. 2019; 11(5):1097. https://doi.org/10.3390/w11051097
Chicago/Turabian StyleCui, Yonggang, Wei Haur Lam, Tianming Zhang, Chong Sun, and Gerard Hamill. 2019. "Scour Induced by Single and Twin Propeller Jets" Water 11, no. 5: 1097. https://doi.org/10.3390/w11051097
Note that from the first issue of 2016, this journal uses article numbers instead of page numbers. See further details here.