Article

Seasonal Drought Pattern Changes Due to Climate Variability: Case Study in Afghanistan

1
Department of Water and Environmental Engineering, School of Civil Engineering, Faculty of Engineering, Universiti Teknologi Malaysia (UTM), 81310 Johor Bahru, Malaysia
2
Department of Environmental Sciences, Faculty of Science, Federal University Dutse, P.M.B 7156 Dutse, Nigeria
3
Department of Civil Engineering, Science and Research Branch, Islamic Azad University, Tehran, Iran
4
Faculty of Water Resource Management, Lasbela University of Agriculture, Water and Marine Sciences, Balochistan 90150, Pakistan
5
Civil, Environmental and Natural Resources Engineering, Lulea University of Technology, 97187 Lulea, Sweden
6
Sustainable Developments in Civil Engineering Research Group, Faculty of Civil Engineering, Ton Duc Thang University, Ho Chi Minh City, Vietnam
7
State Key Laboratory of Hydrology-Water Resources and Hydraulic Engineering, Nanjing Hydraulic Research Institute, Nanjing 210029, China
8
Research Center for Climate Change, Ministry of Water Resources, Nanjing 210029, China
*
Author to whom correspondence should be addressed.
Water 2019, 11(5), 1096; https://doi.org/10.3390/w11051096
Submission received: 20 April 2019 / Revised: 16 May 2019 / Accepted: 23 May 2019 / Published: 25 May 2019

Abstract

:
We assessed the changes in meteorological drought severity and drought return periods during cropping seasons in Afghanistan for the period of 1901 to 2010. The droughts in the country were analyzed using the standardized precipitation evapotranspiration index (SPEI). Global Precipitation Climatology Center rainfall and Climate Research Unit temperature data both at 0.5° resolutions were used for this purpose. Seasonal drought return periods were estimated using the values of the SPEI fitted with the best distribution function. Trends in climatic variables and SPEI were assessed using modified Mann–Kendal trend test, which has the ability to remove the influence of long-term persistence on trend significance. The study revealed increases in drought severity and frequency in Afghanistan over the study period. Temperature, which increased up to 0.14 °C/decade, was the major factor influencing the decreasing trend in the SPEI values in the northwest and southwest of the country during rice- and corn-growing seasons, whereas increasing temperature and decreasing rainfall were the cause of a decrease in SPEI during wheat-growing season. We concluded that temperature plays a more significant role in decreasing the SPEI values and, therefore, more severe droughts in the future are expected due to global warming.

1. Introduction

The changes in global energy balance due to warming have changed the patterns of the atmospheric variables [1,2,3]. The global temperature increases, in particular, have influenced the occurrence of droughts as well as their frequency and severity in many regions [4,5,6]. Water availability is the main element that changes in response to changes in drought patterns [7]; thus, it is an important factor for defining water stress, agricultural productivity, and food security [8,9,10,11]. Compared to other natural disasters, droughts are unique due to their slow onset and their often prolonged occurrence [12]. As its effects accumulate slowly over time, the determination of drought onset, duration, and termination is ambiguous [13]. Therefore, the impacts of droughts on agriculture are much more devastating compared to other natural disasters [14]. The 1998 drought in Oklahoma, USA caused loses in agriculture exceeding USD $2 billion [15]. Droughts caused severe famine in the horn of Africa between 2011 and 2012, and projections have shown the likelihood of increased droughts in future [6], which would affect agriculture [16].
The variability in climate has devastating impacts on droughts characteristics, particularly in areas that are arid or semi-arid. Hence, the consequences of climate change are remarkably affecting drought patterns, having far-reaching impacts in social, economic, agricultural, and environmental contexts [17,18]. Comprehending the association between climate variability and drought pattern is vital for discerning the changes in droughts due to changes in climate [13]. However, this relationship highly varies from one region to another [19], which emphasizes the need for more region-specific studies. In addition, due to crop water demand during cropping seasons, occurrence of droughts during these seasons can be more devastating. Therefore, understanding meteorological droughts during different cropping seasons is paramount for sustainable agricultural practices.
Afghanistan, being a semi-arid to arid area, is prone to droughts and prolonged droughts commonly occur in the country. The country receives a meagre annual precipitation of between 200 and 400 mm [20], indicating the significance of natural resource management and the requirement to adapt and implement mitigation measures against climate change. The changing climate in the country significantly affects most rural communities where water, soil, forests, and grazing areas are essential factors [21]. The impacts of climate change on water resources have been reported in Afghanistan; observation showed the impact of climate change on glacier and snowmelts feeding the Kabul River, which has caused an increase in the trend of melting and a shift in the seasonal monsoons in the river basin [21].
Studies related to droughts in Afghanistan are limited. Muhammad et al. [22] applied a modified version of standard Palmer method, incorporating snowmelt module based on the temperature-index method to assess droughts between 1957 and 2002. The study revealed major drought events over the region during the period. Droughts were found to have severe impacts on crop yields, causing economic crisis in the province of Badakhshan of Afghanistan [23]. Williams [24] reported the increasing impacts of the changing climate in Afghanistan, as seen in the recurrent droughts, which have increased in duration and frequency, at least for the past second half of the 20th century. The severity of droughts in the neighboring Central Asia and other countries bordering Afghanistan have been reported to have increased [21,25,26]. In Central Asia, Ta [27] analyzed the spatio-temporal patterns of conditions of dryness and wetness using the standardized precipitation evapotranspiration index (SPEI) and reported a drought frequency of 42.87% in the region during 1930 to 2014. Li et al. [28] reported a sharp temperature increase was experienced in Central Asia in 1997, and has since been in a state of high volatility, making the last 15 years (1998–2013) the warmest on record in about 50 years. Zoljoodi and Didevarasl [29] assessed the trends in droughts in the northwest and northeast parts of Iran bordering Afghanistan during 1951–2005 using the Palmer Drought Severity Index, and reported an increase in the severity of droughts. Ahmed et al. [26] investigated the trends in droughts in Pakistan over the last century and reported that drought-affected areas in the country have increased due to sharp temperature increases. However, no study has assessed the meteorological droughts in Afghanistan during cropping seasons, and no attempt has been made to understand the changes in droughts in the country due to climate change.
The continuous increase in drought frequency may have devastating effects on the water supplies in many communities in the country, thus leading to humanitarian crises, including diseases, population displacements, and violent conflicts [30]. Droughts may also increase the tension between Afghanistan and neighboring countries as the various countries would try to claim a greater share of the region’s total available water [31]. For Afghanistan, where a significant part of the population is engaged in agriculture, assessment of the impacts of climate change on drought characteristics is paramount for sustainable agricultural practices. This is especially crucial for the different crop growing seasons due to the changing patterns of the climate, which, for example, drastically prematurely reduce winter snowpack from its usual conditions, affecting wheat production yields in the northern, northeastern, and western regions of the country from 2007 to 2008 [30].
In the present study, the changing drought characteristics during different cropping seasons (rice, corn, and wheat) in Afghanistan during 1901–2010 were assessed. We assessed the droughts’ characteristics using the SPEI [32], which considers temperature and precipitation climatic variables. Gridded precipitation and temperature datasets from the Global Precipitation Climatology Centre (GPCC) [33] and Climatic Research Unit (CRU) [34], respectively, were used for drought assessment during 1901–2010 using a 50-year sliding window with a 10-year interval. The modified Mann–Kendall (MMK) trend test was used to perform model analysis on the secular climatic variables’ trends and the drought index.

2. Study Area and Data

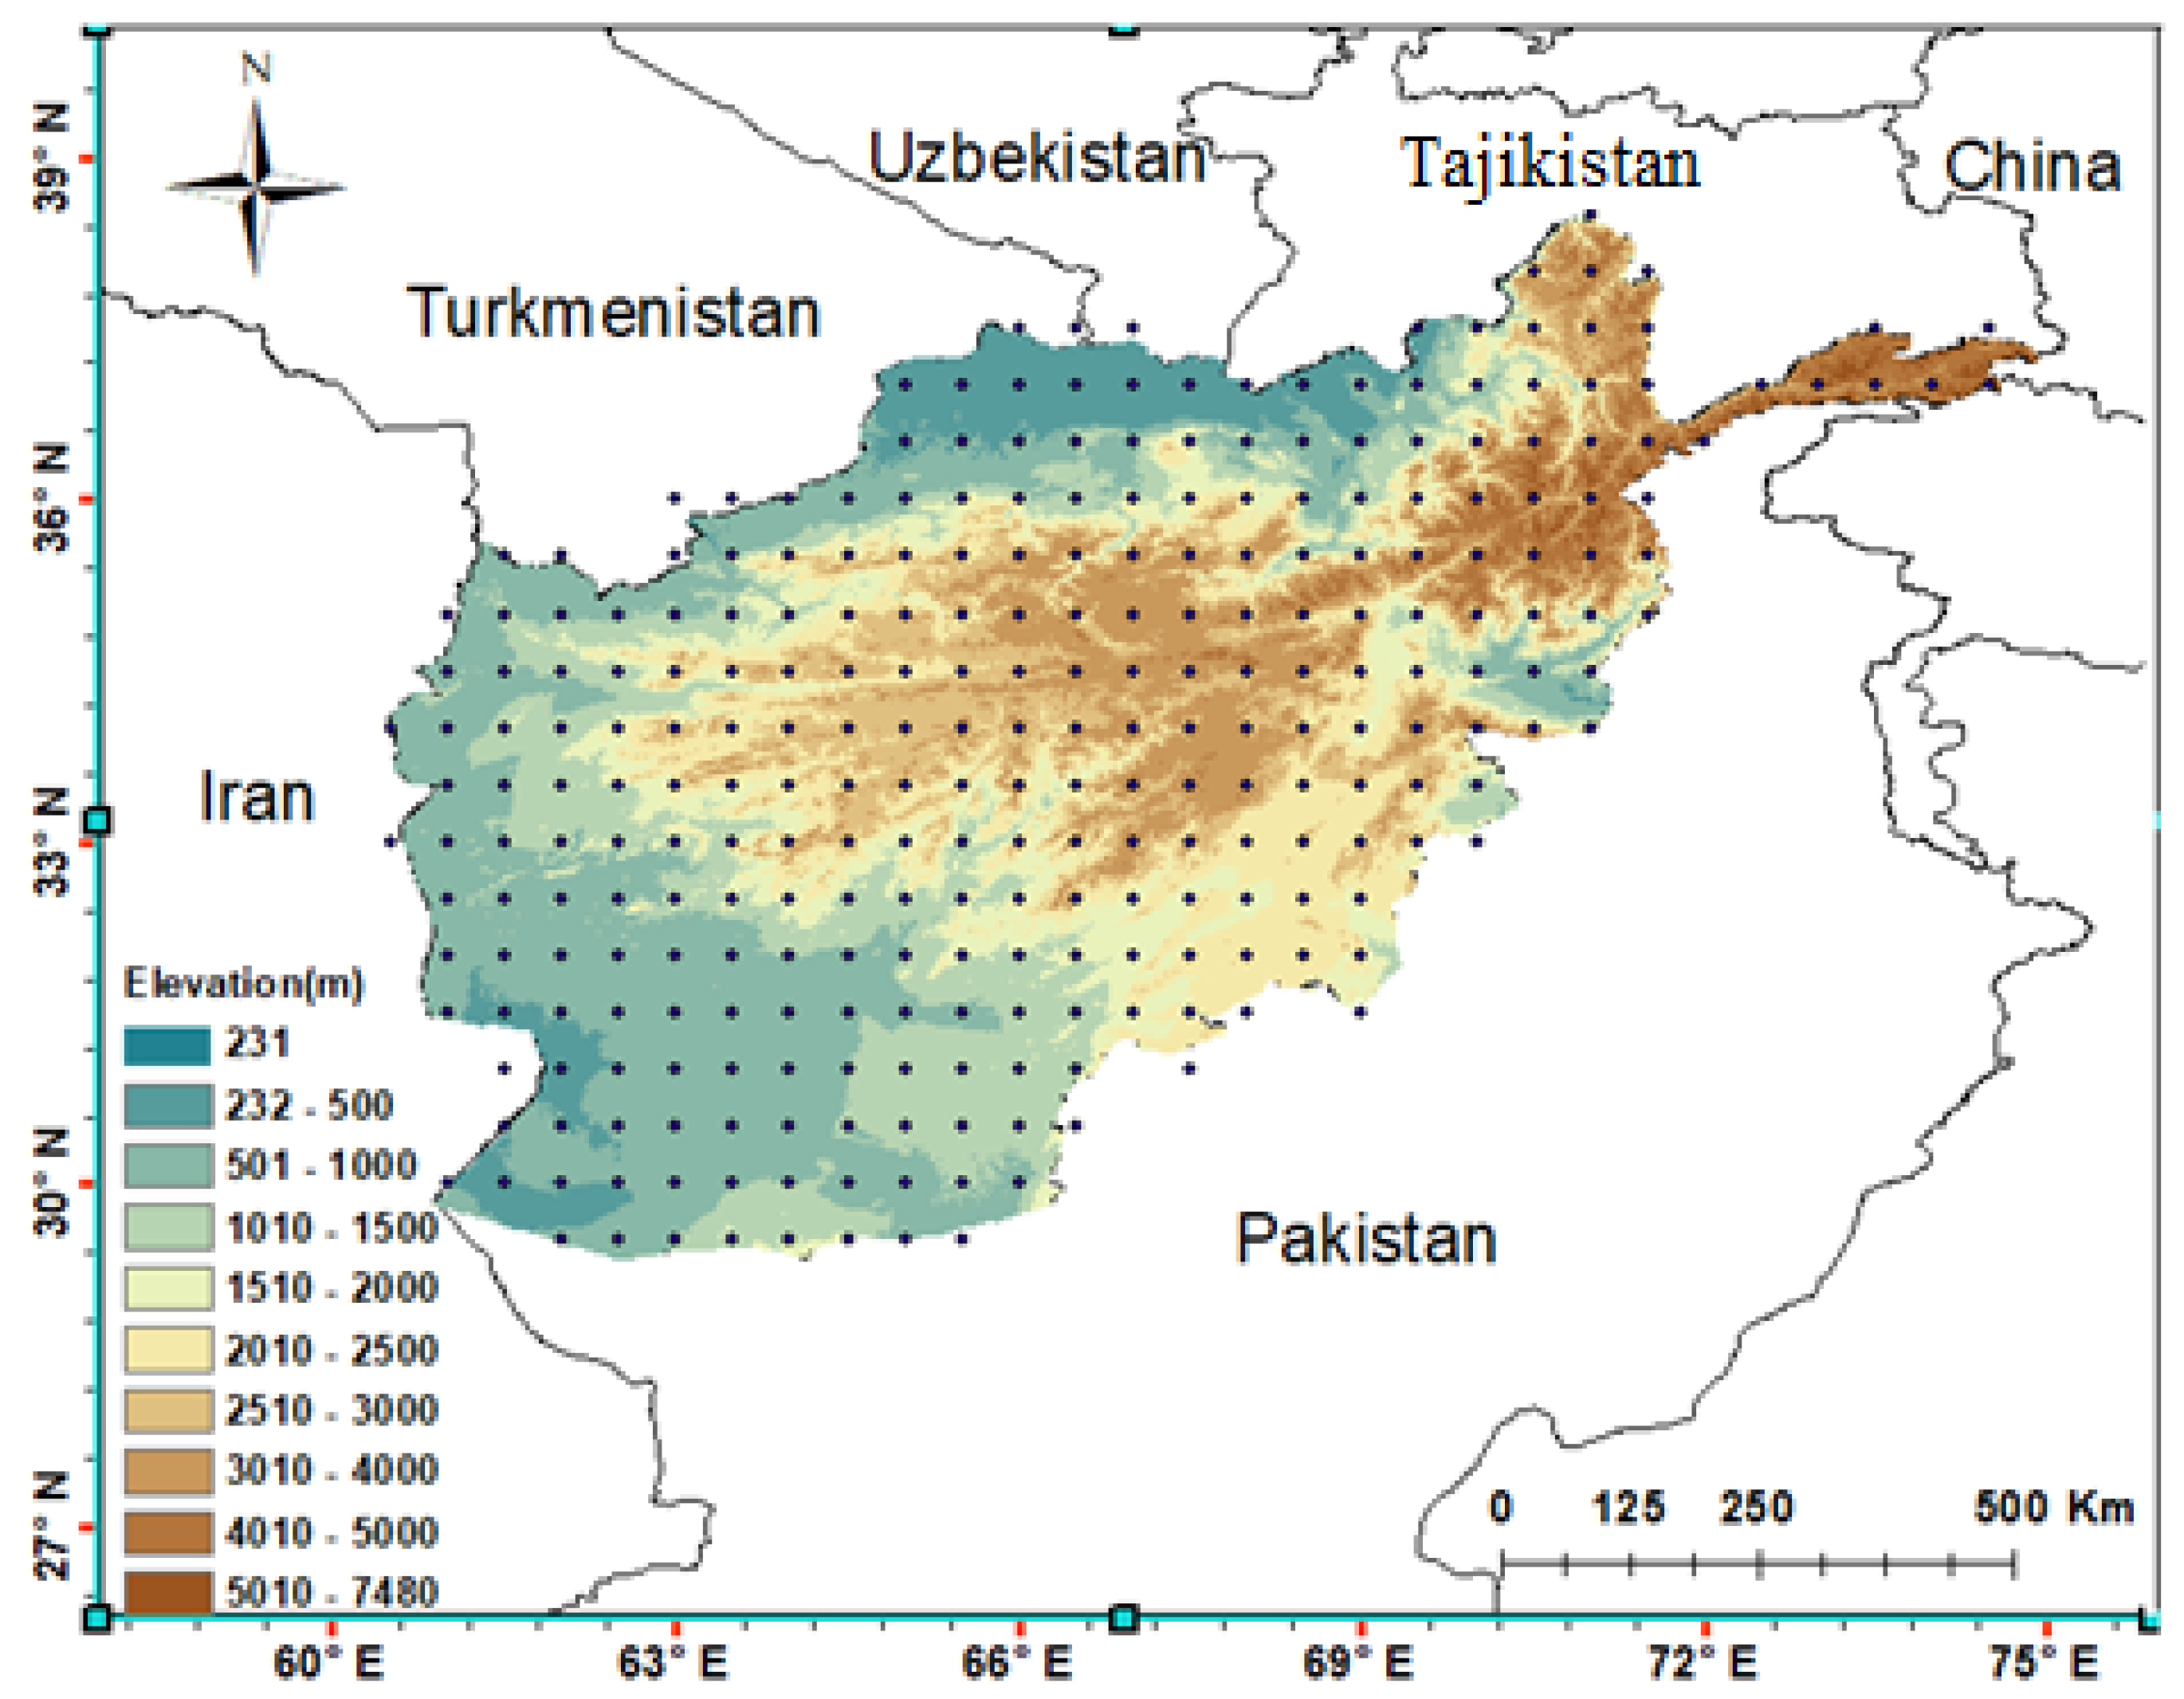
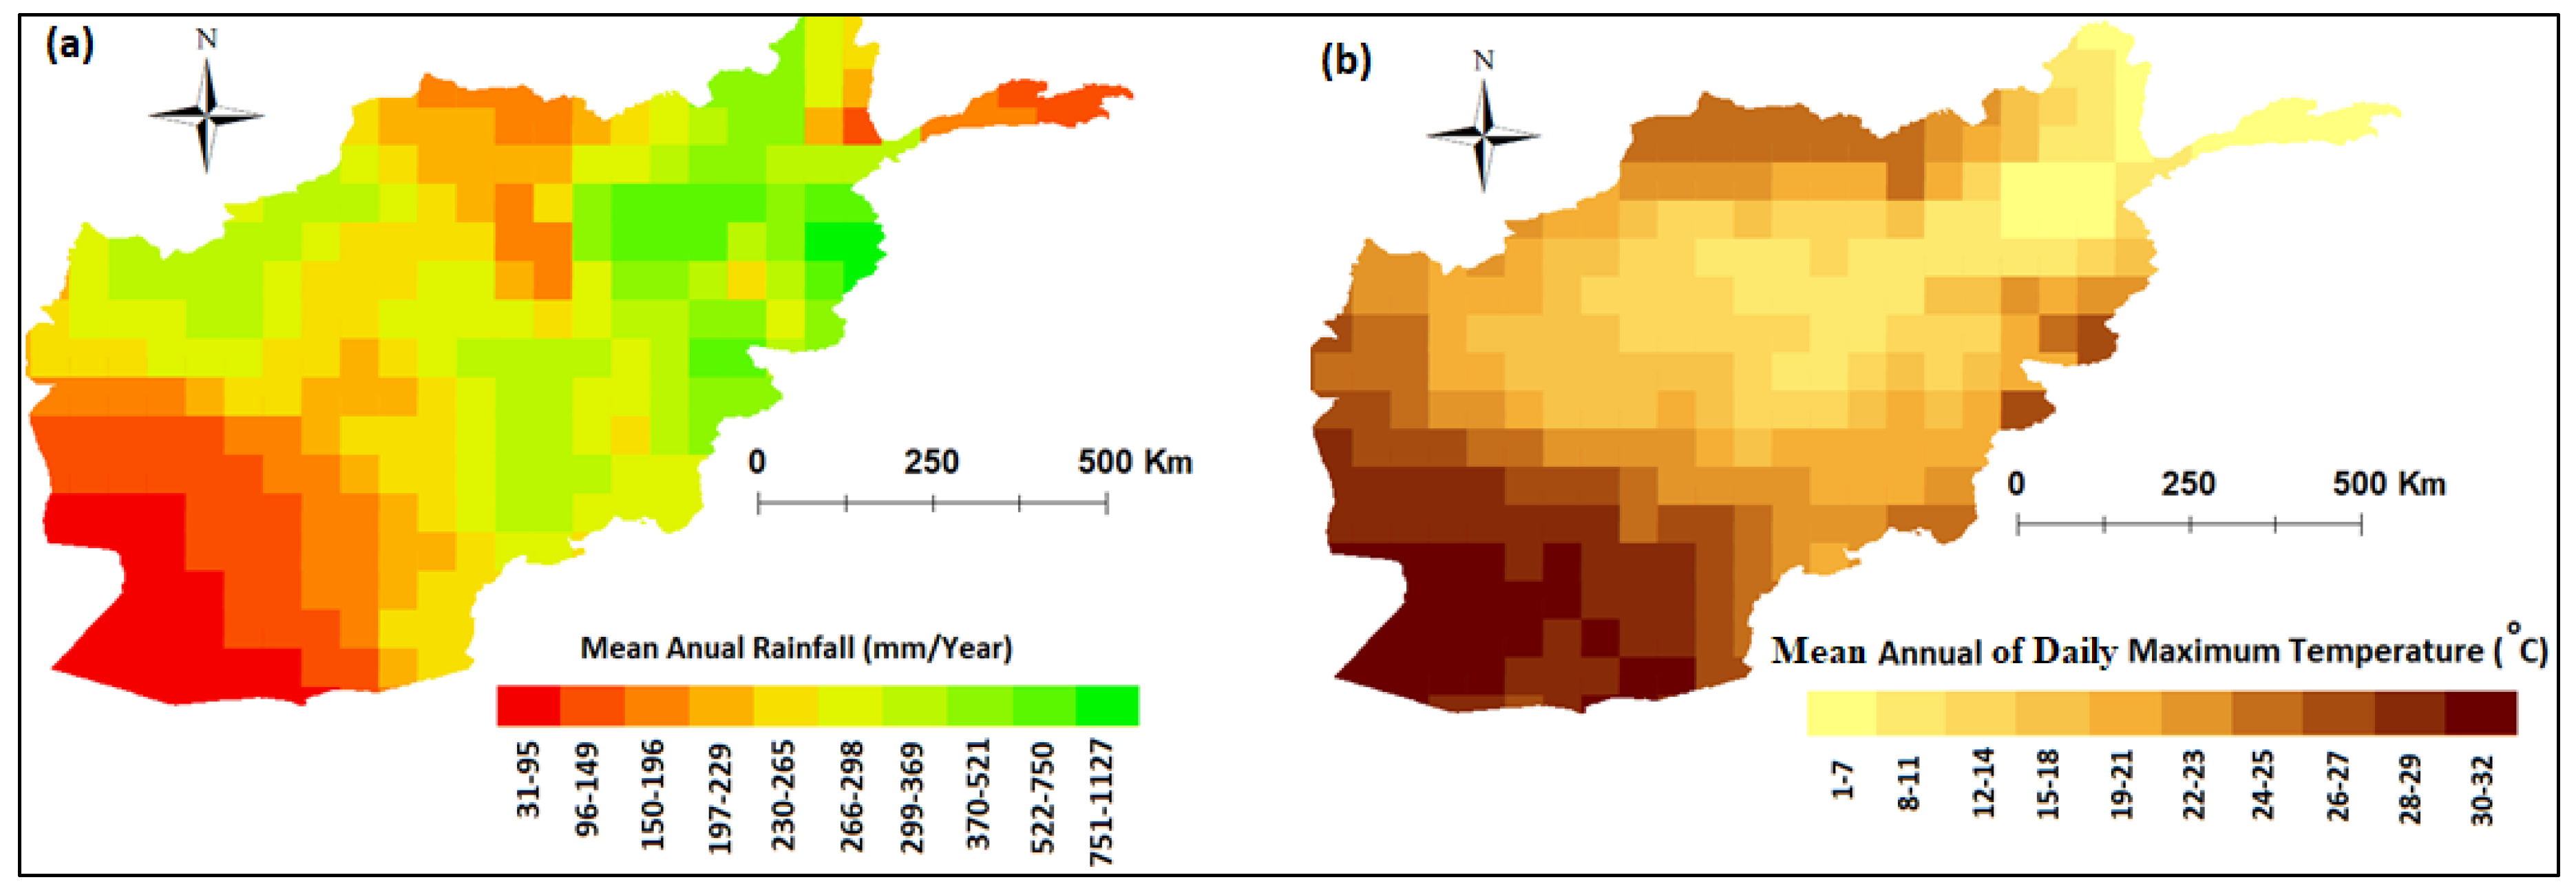
2.1. Description of the Study Area

Afghanistan (29–39° N; 60–75° E) is a landlocked country, sharing a long border with Pakistan in the south; Iran in the west; Turkmenistan, Uzbekistan, and Tajikistan in the north; and a thin stretch mountainous land with China in the northeast (Figure 1). The Hindu Kush Mountains from the northeastern border to west across the country divide the topography of the country into geographic regions: central highland, the southwestern plateau, and the northern plains.
Afghanistan’s climate varies greatly between topographic regions [35]. The climate varies considerably between arid and semiarid with hot summers and cold winters. Mean annual precipitation for the country is shown in Figure 2a, which indicates a gradual decrease in rainfall from the northeast along the Hindokush Mountains toward the southwestern plateau zone. The lowest mean annual precipitation of around 30 mm occurs in the southwestern plateau region. The highest precipitation of more than 1000 mm occurs in the northeastern Hindokush Mountain’s foothill regions. The mean annual maximum temperature in Afghanistan is shown in Figure 2b. Temperature gradually increases from the top of the Hindokush mountain from northeast toward the southeastern plateau regions for both cropping seasons of winter and summer. The highest mean annual maximum temperatures are recorded in the lower regions in the southeastern zone.
Afghanistan is largely dependent on agricultural production. Agricultural crops depend on specific climate conditions, and changes to the climate can have crucial negative impacts on the ways in which crops are cultivated in rain-fed areas. Almost 67–85% of the Afghan population are engaged in farming [36]. Crops are cultivated during the summer and winter season. The summer cropping season starts in May and finishes in November. The main crops grown during summer are rice and corn. The main cultivated crops in winter (October to June) are wheat and barley. Wheat, rice, and corn, analyzed in this study, are the most important food crops for the population. The area cultivated for wheat is 2,575,000 ha or 79% of the total cultivated land; 200,000 ha rice, or 6.2%; and 140,000 ha corn, or 4.3% of the cultivated land in Afghanistan.
The cropping season calendars of the most important crops cultivated in the country, wheat, corn, and rice, are presented in Figure 3. Wheat is cultivated in winter, whereas rice and corn are cultivated in summer. Irrigated wheat sowing usually begins late October and finishes in early December. Rain-fed cropping season starts in winter when enough soil moisture content has been acquired from rainfall. Due to cold winters, winter season crop harvesting starts in late May and ends early July. Summer season starts in April and continues until the end of winter season in early July. In Afghanistan, wheat is cultivated in every part of the country, whereas rice and corn are cultivated in the northern part of the country. Due to adequate surface water in the north of Afghanistan, it is used as the main source of irrigation for summer crops.

2.2. Datasets

One main challenge in hydro-climatological studies around the world is inadequate or lacking long-term records and reliable climatic data [26]. Prolonged conflicts that have resulted in inadequate data availability in Afghanistan have hindered climatic research in the country [37]. In areas like Afghanistan where long-tern climate data are lacking, gridded climate data are used for climatic studies [38]. Amongst gridded data, such as satellite based gridded data, the in-situ-based gridded data, reanalysis, and combined gridded data, in-situ-based gridded data have been recommended because of better spatial and temporal availability [39].
Gridded monthly precipitation data of the GPCC and the monthly average temperature data of the CRU, both at a spatial resolutions of 0.5° by 0.5° (281 grid points over Afghanistan) for the period 1901–2010, were used in this study. Data spanning the period 1901–2010 were chosen due to the use of a 50-year sliding window with a 10-year interval, which enabled uniform division and consistency within the considered period. GPCC monthly data were developed from various data sources, including national weather services and hydrological institutes with data collections from over 8500 rain gauge stations in 190 countries around the world [40]. GPCC gridded data have many advantages: (1) good dataset quality; (2) it is a dataset of a climate model, interpolated with the highest number of observed data; and (3) it has a large enough time span for hydro-climatic investigations [41]. The CRU dataset was derived from gauge measurements of 4000 weather stations from around the globe [26]. The CRU monthly temperature dataset is updated and controlled by manual and semi-automatic quality control means [34].

3. Methodology

The procedure adopted to estimate the changes in droughts and assess the influence of climatic factors on the trends in droughts during Afghanistan’s major crop growing seasons is outlined below:
  • The potential evapotranspiration (PET) was estimated using the Thornthwaite method at each CRU grid point. CRU’s monthly average mean temperature was used for this purpose.
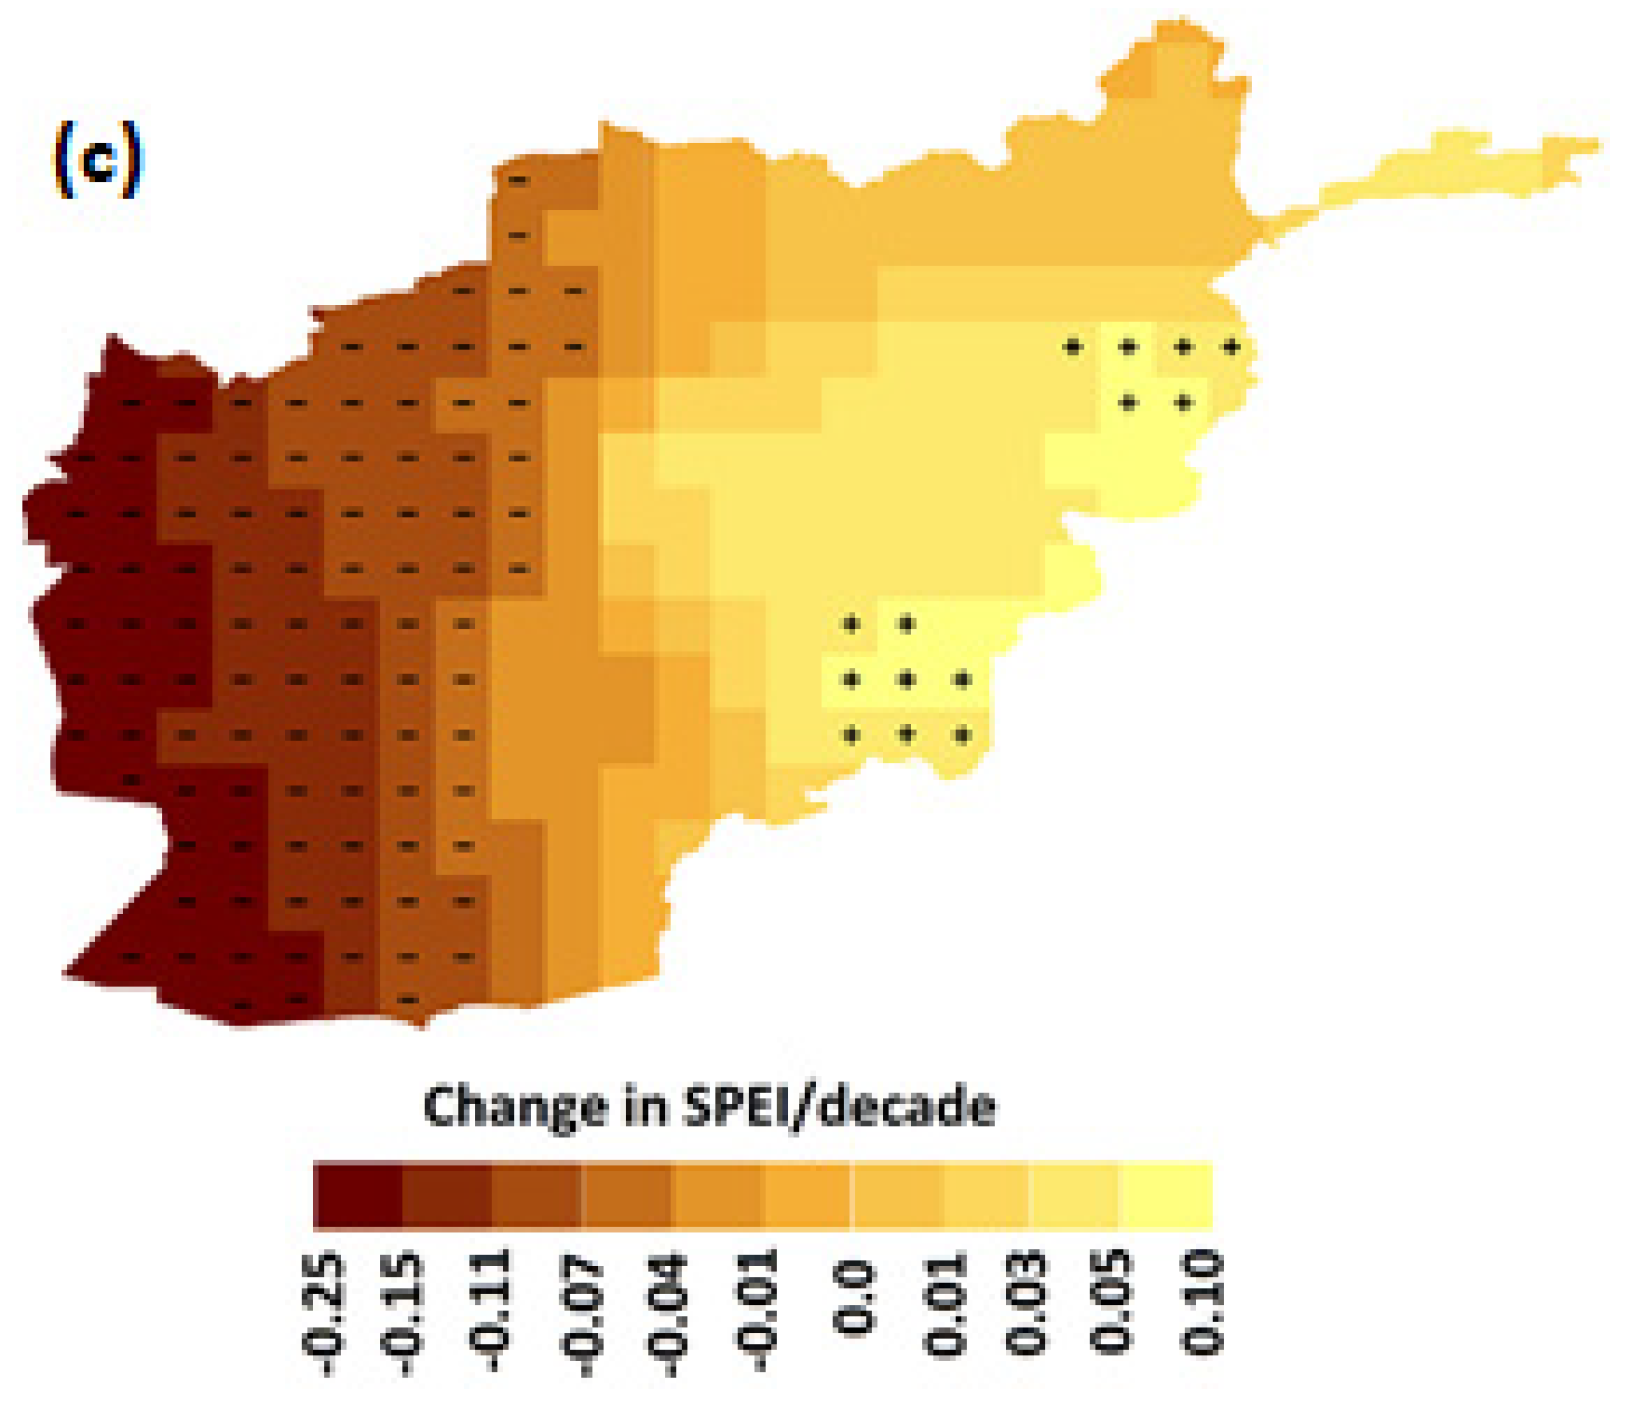
  • The SPEI was calculated using GPCC rainfall and the ET estimated in Step 1 at every GPCC/CRU grid point in Afghanistan (281 grid points) during 1901–2010 using a moving 50-year window and a 10-year interval.
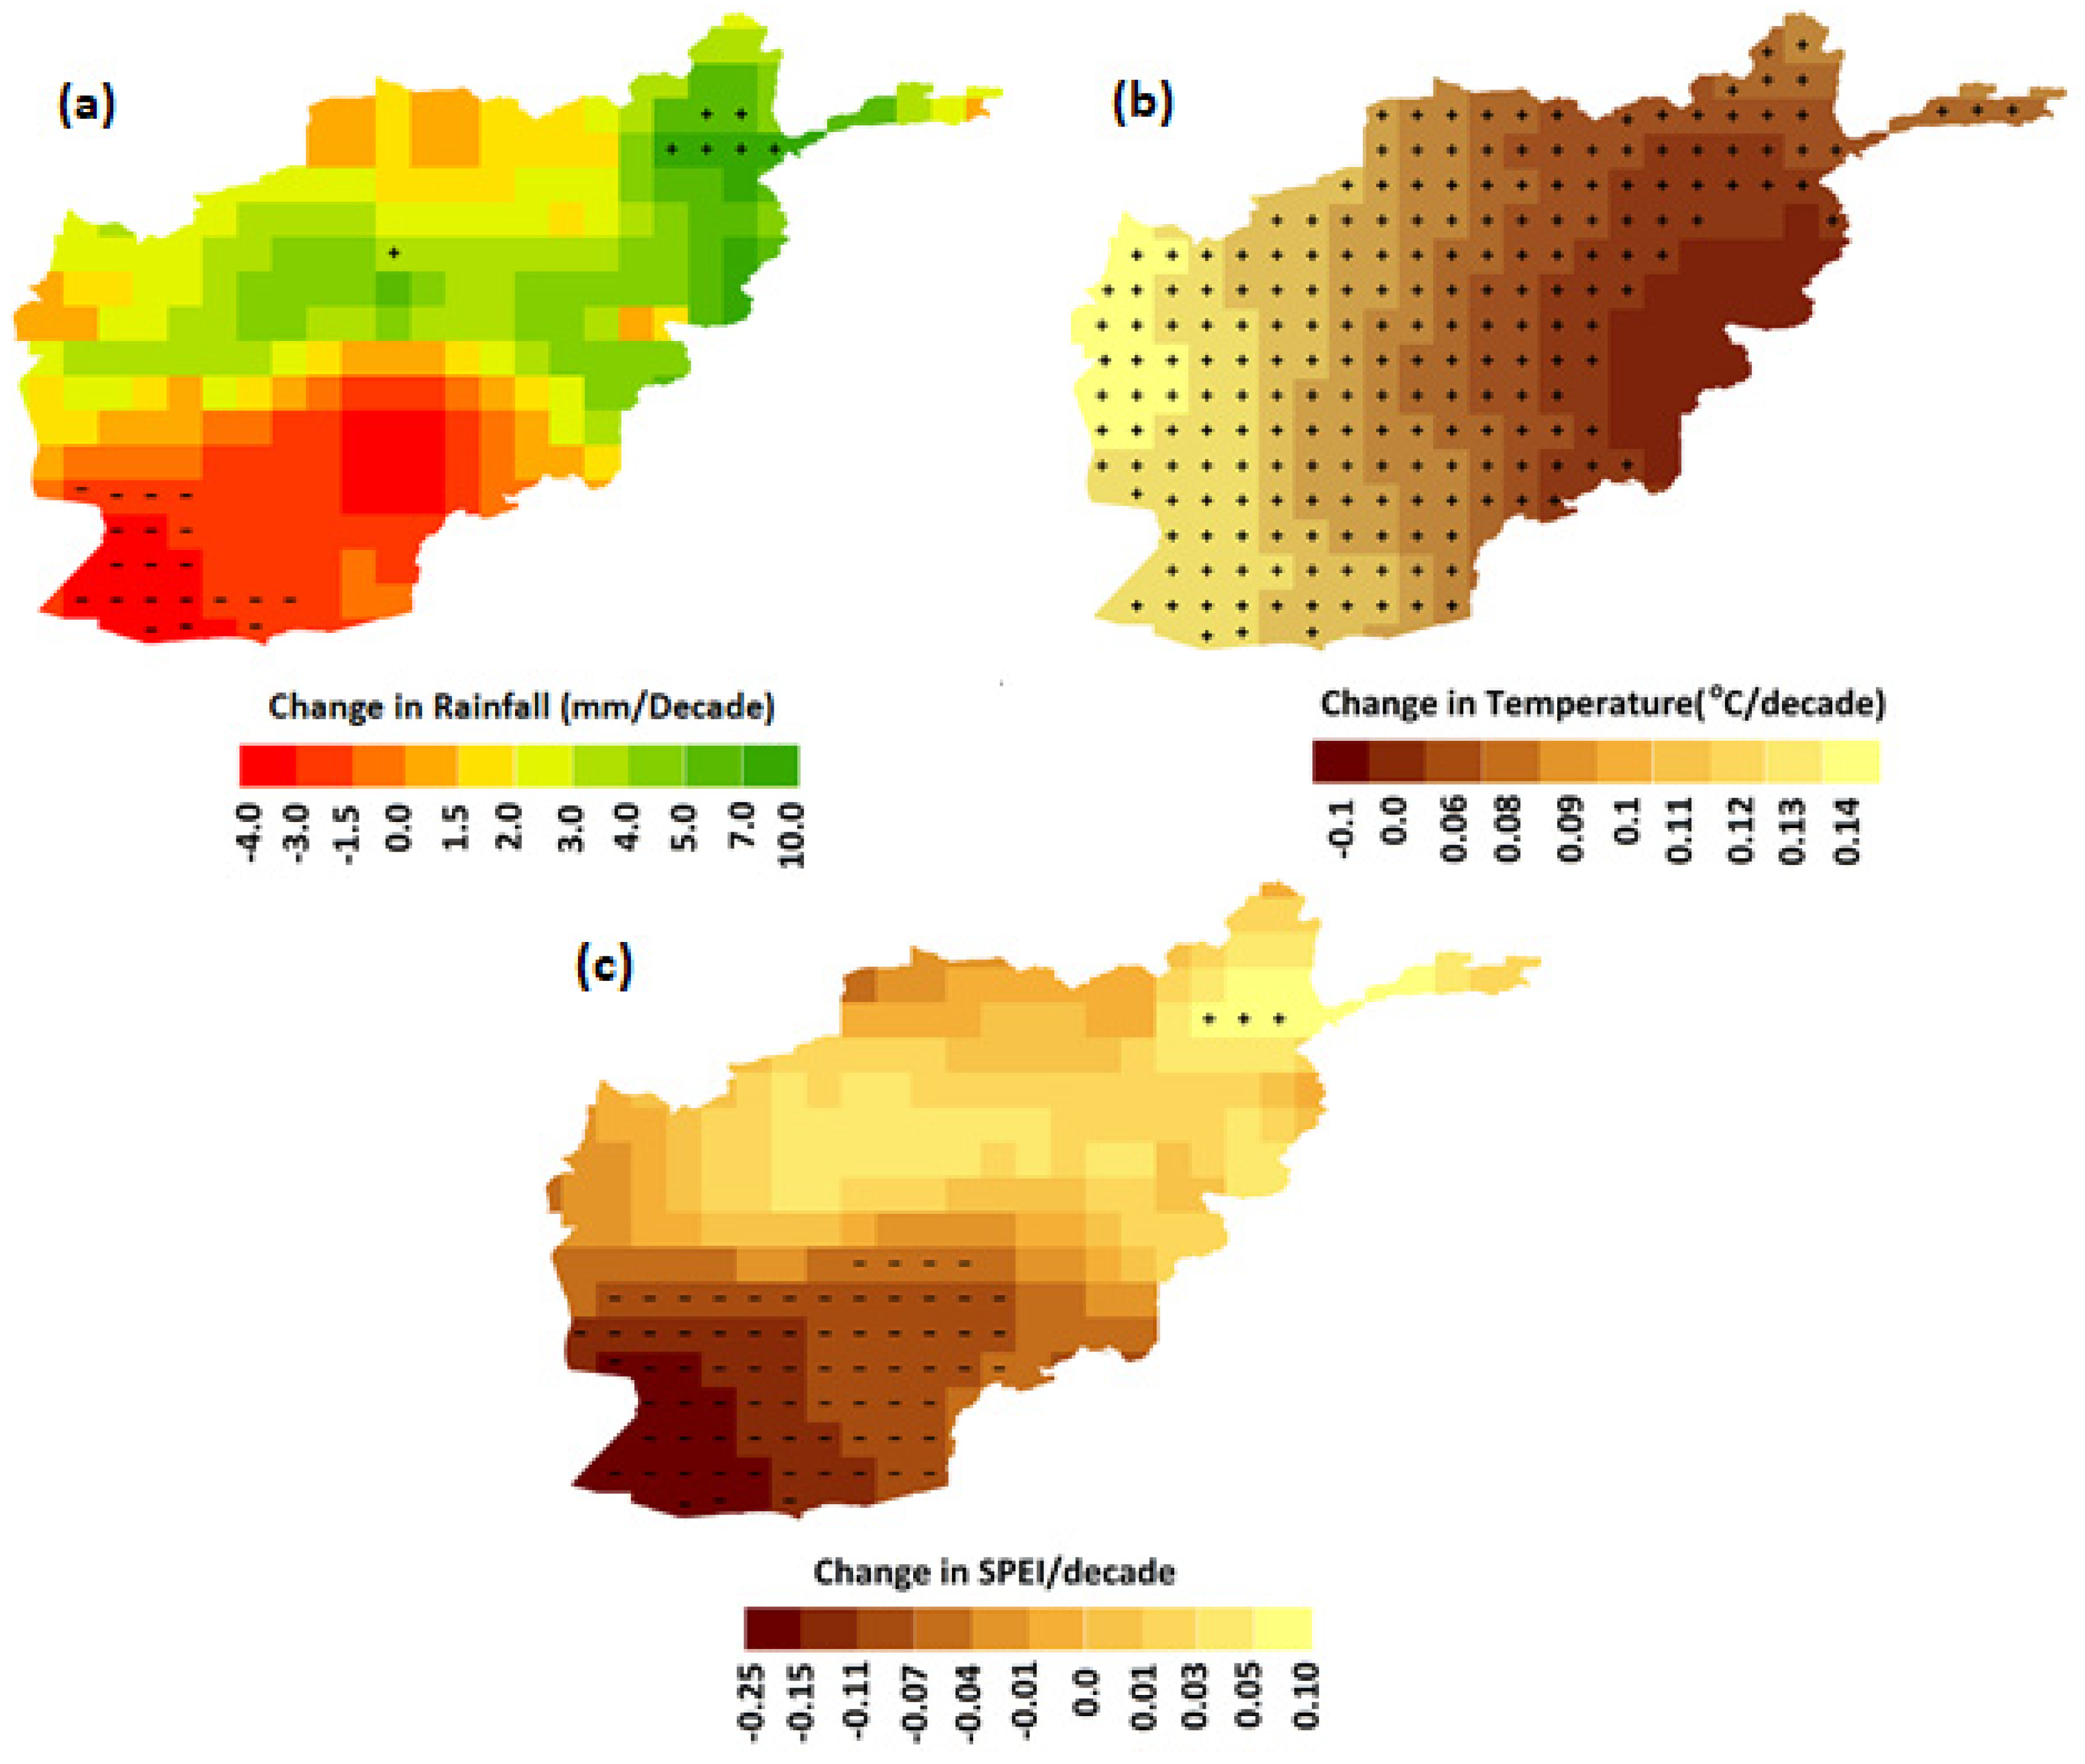
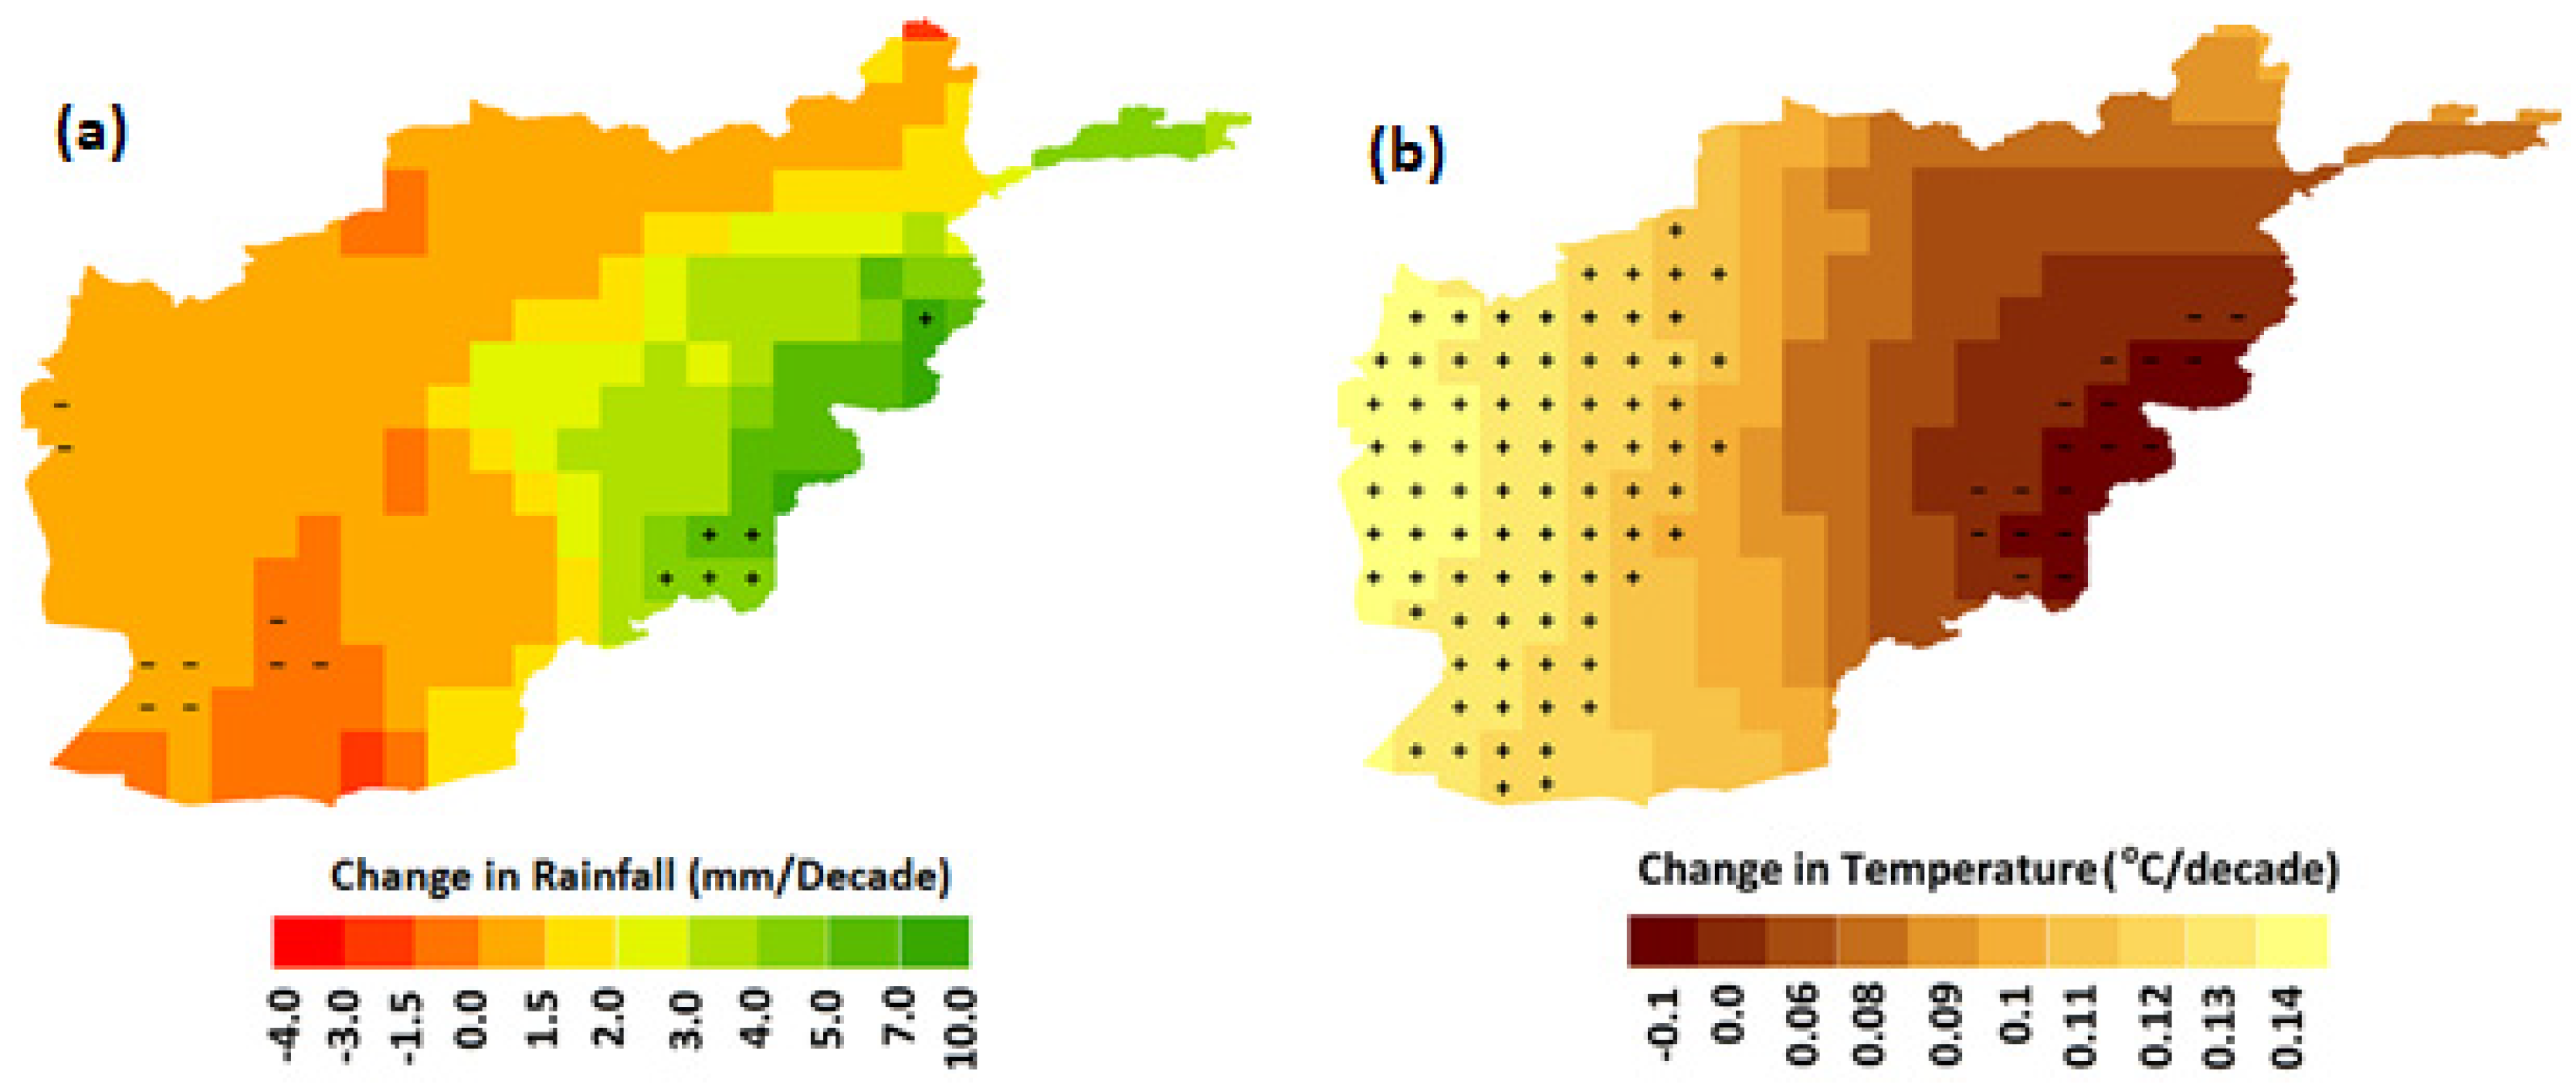
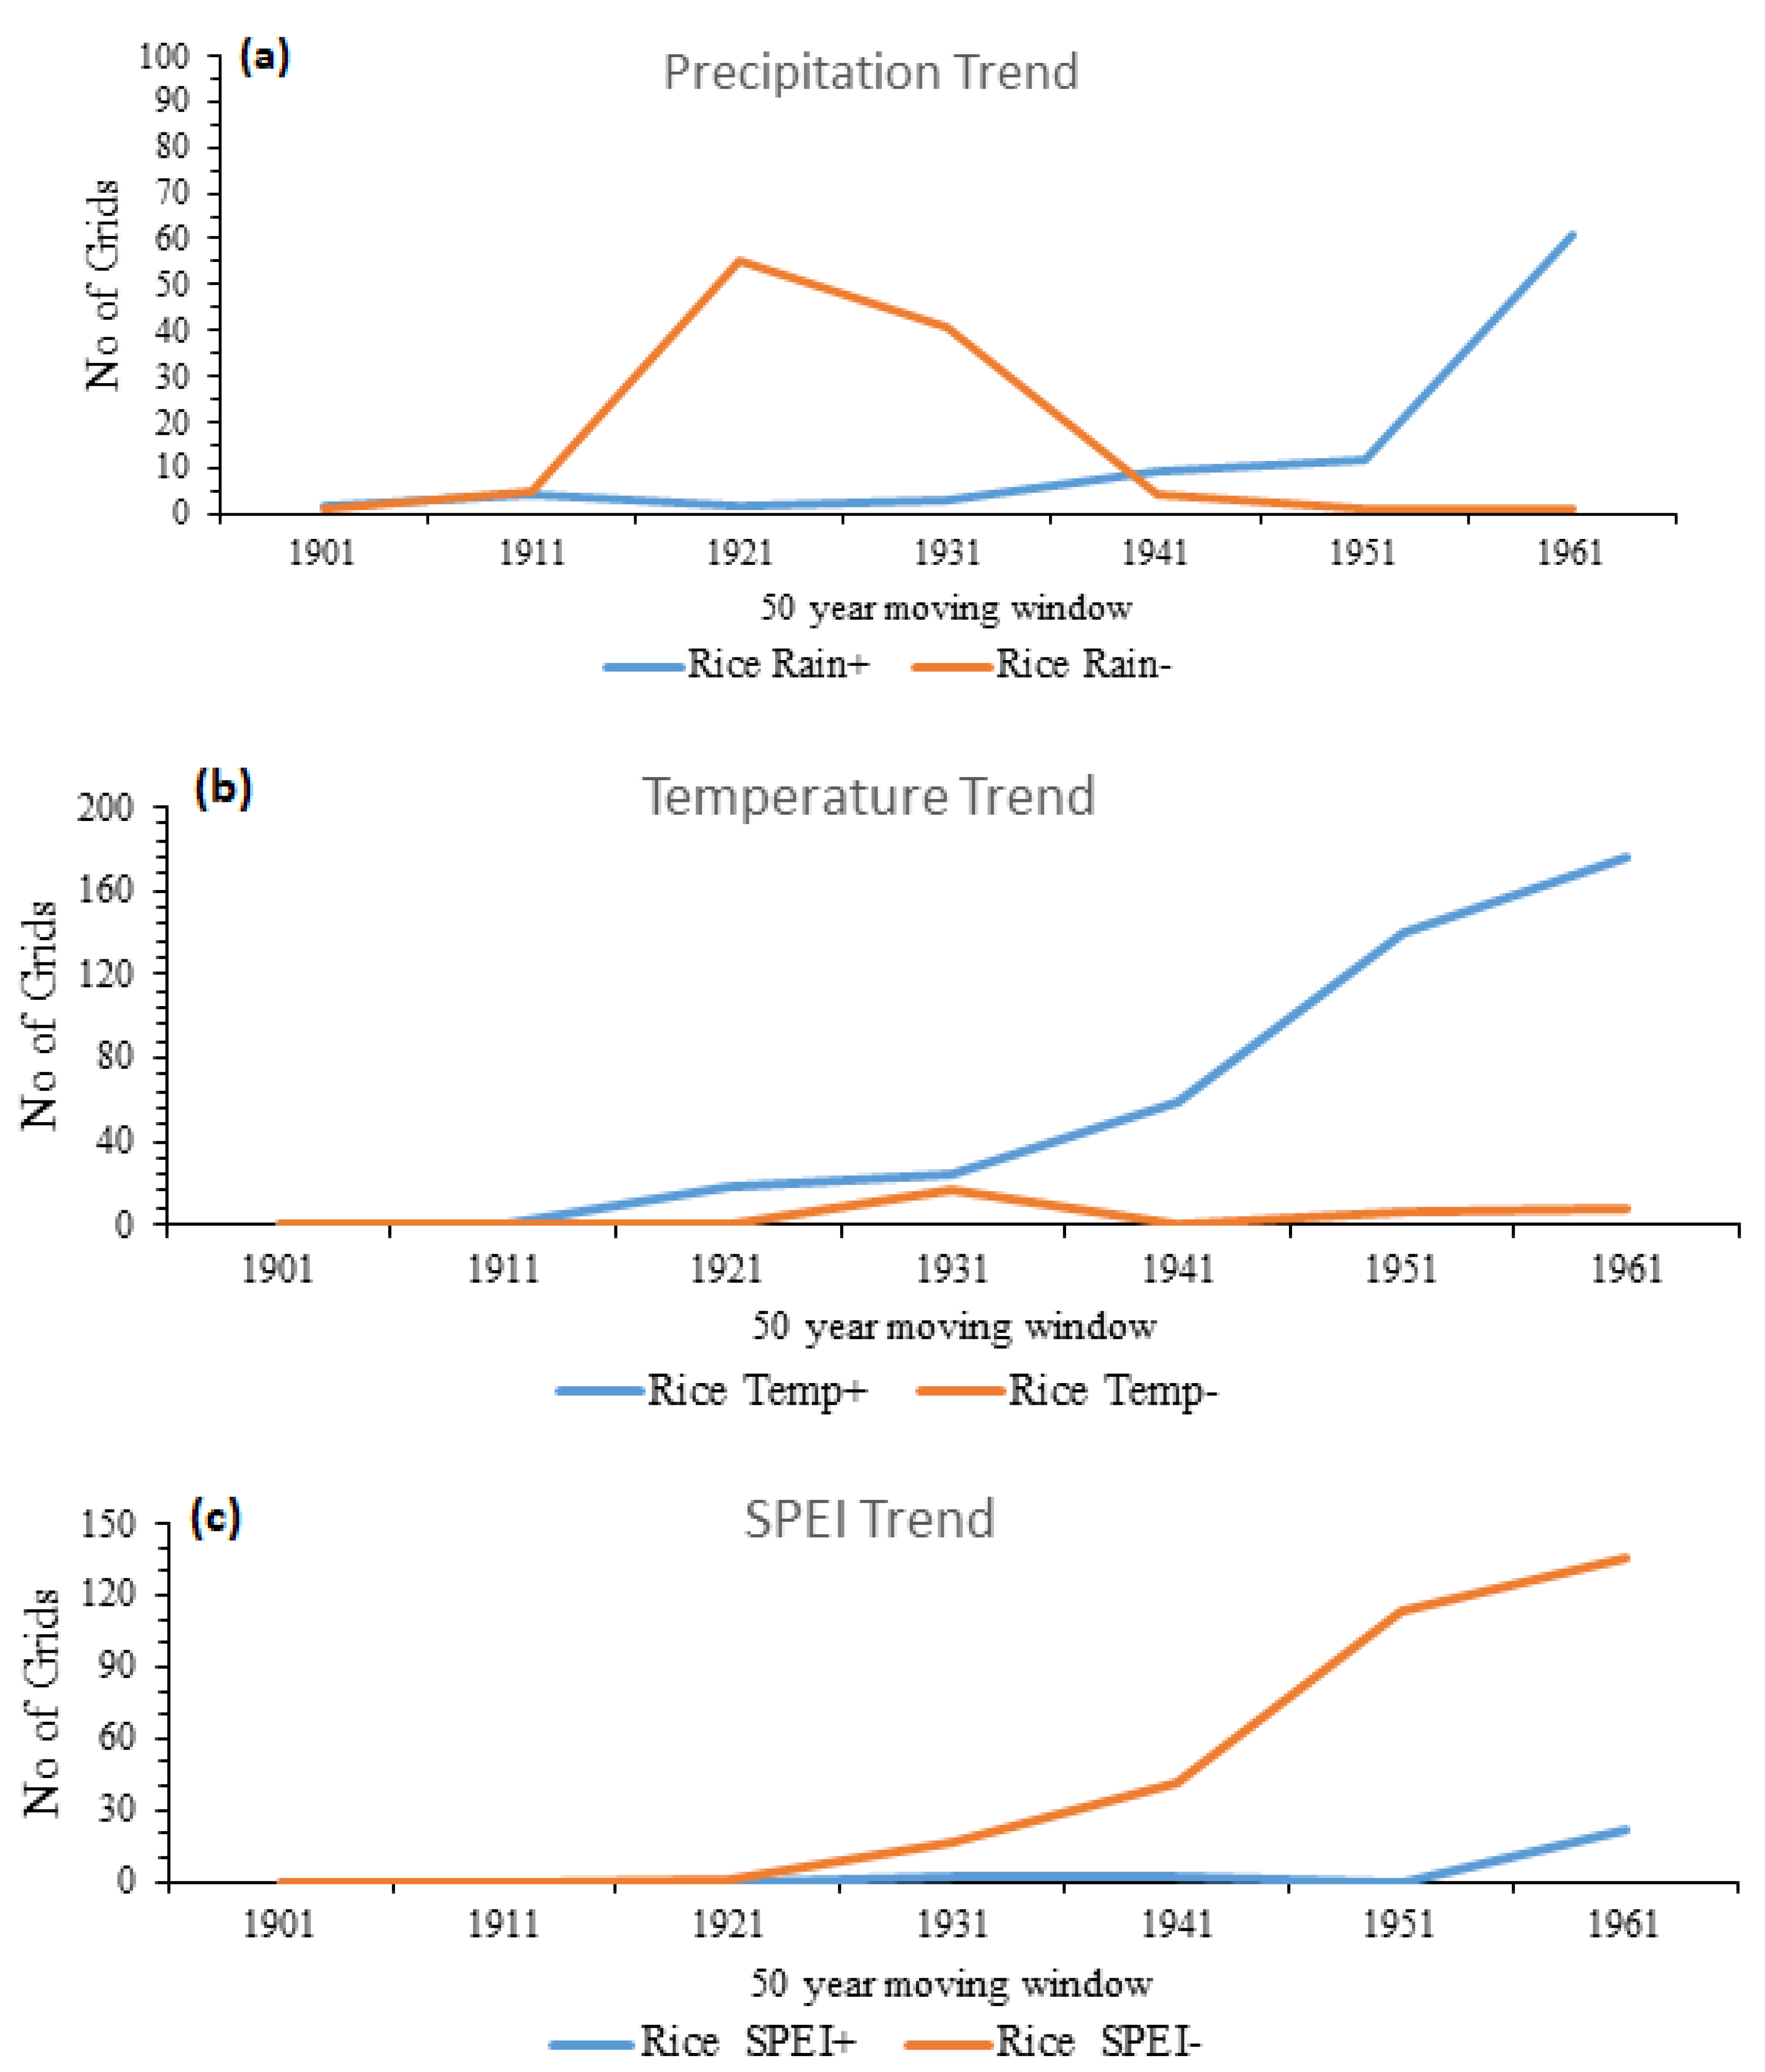
  • Trends in temperature, precipitation, and SPEI were assessed for cropping seasons for different 50-year periods using the MMK test.
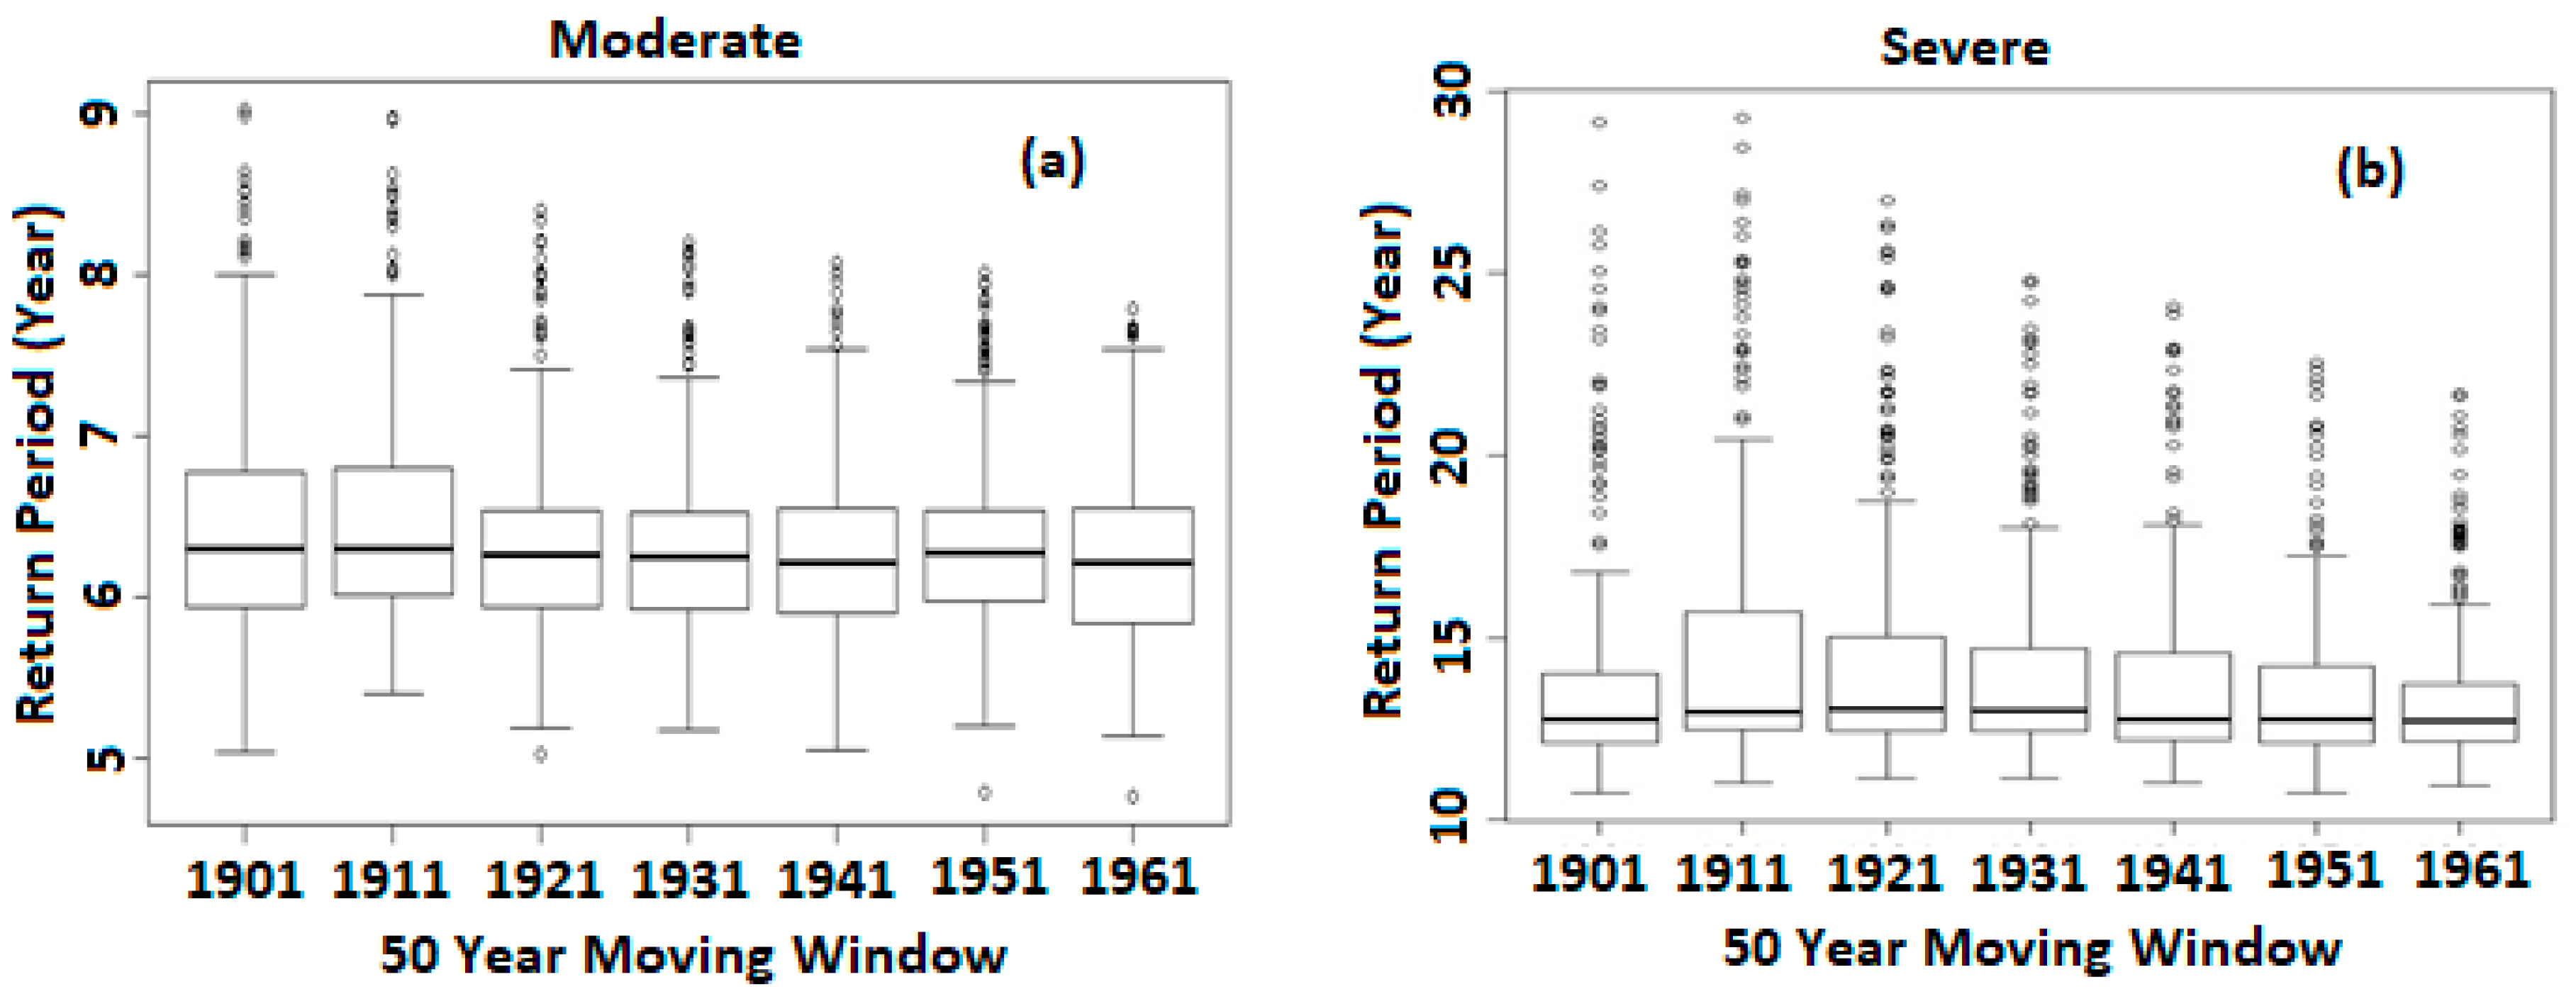
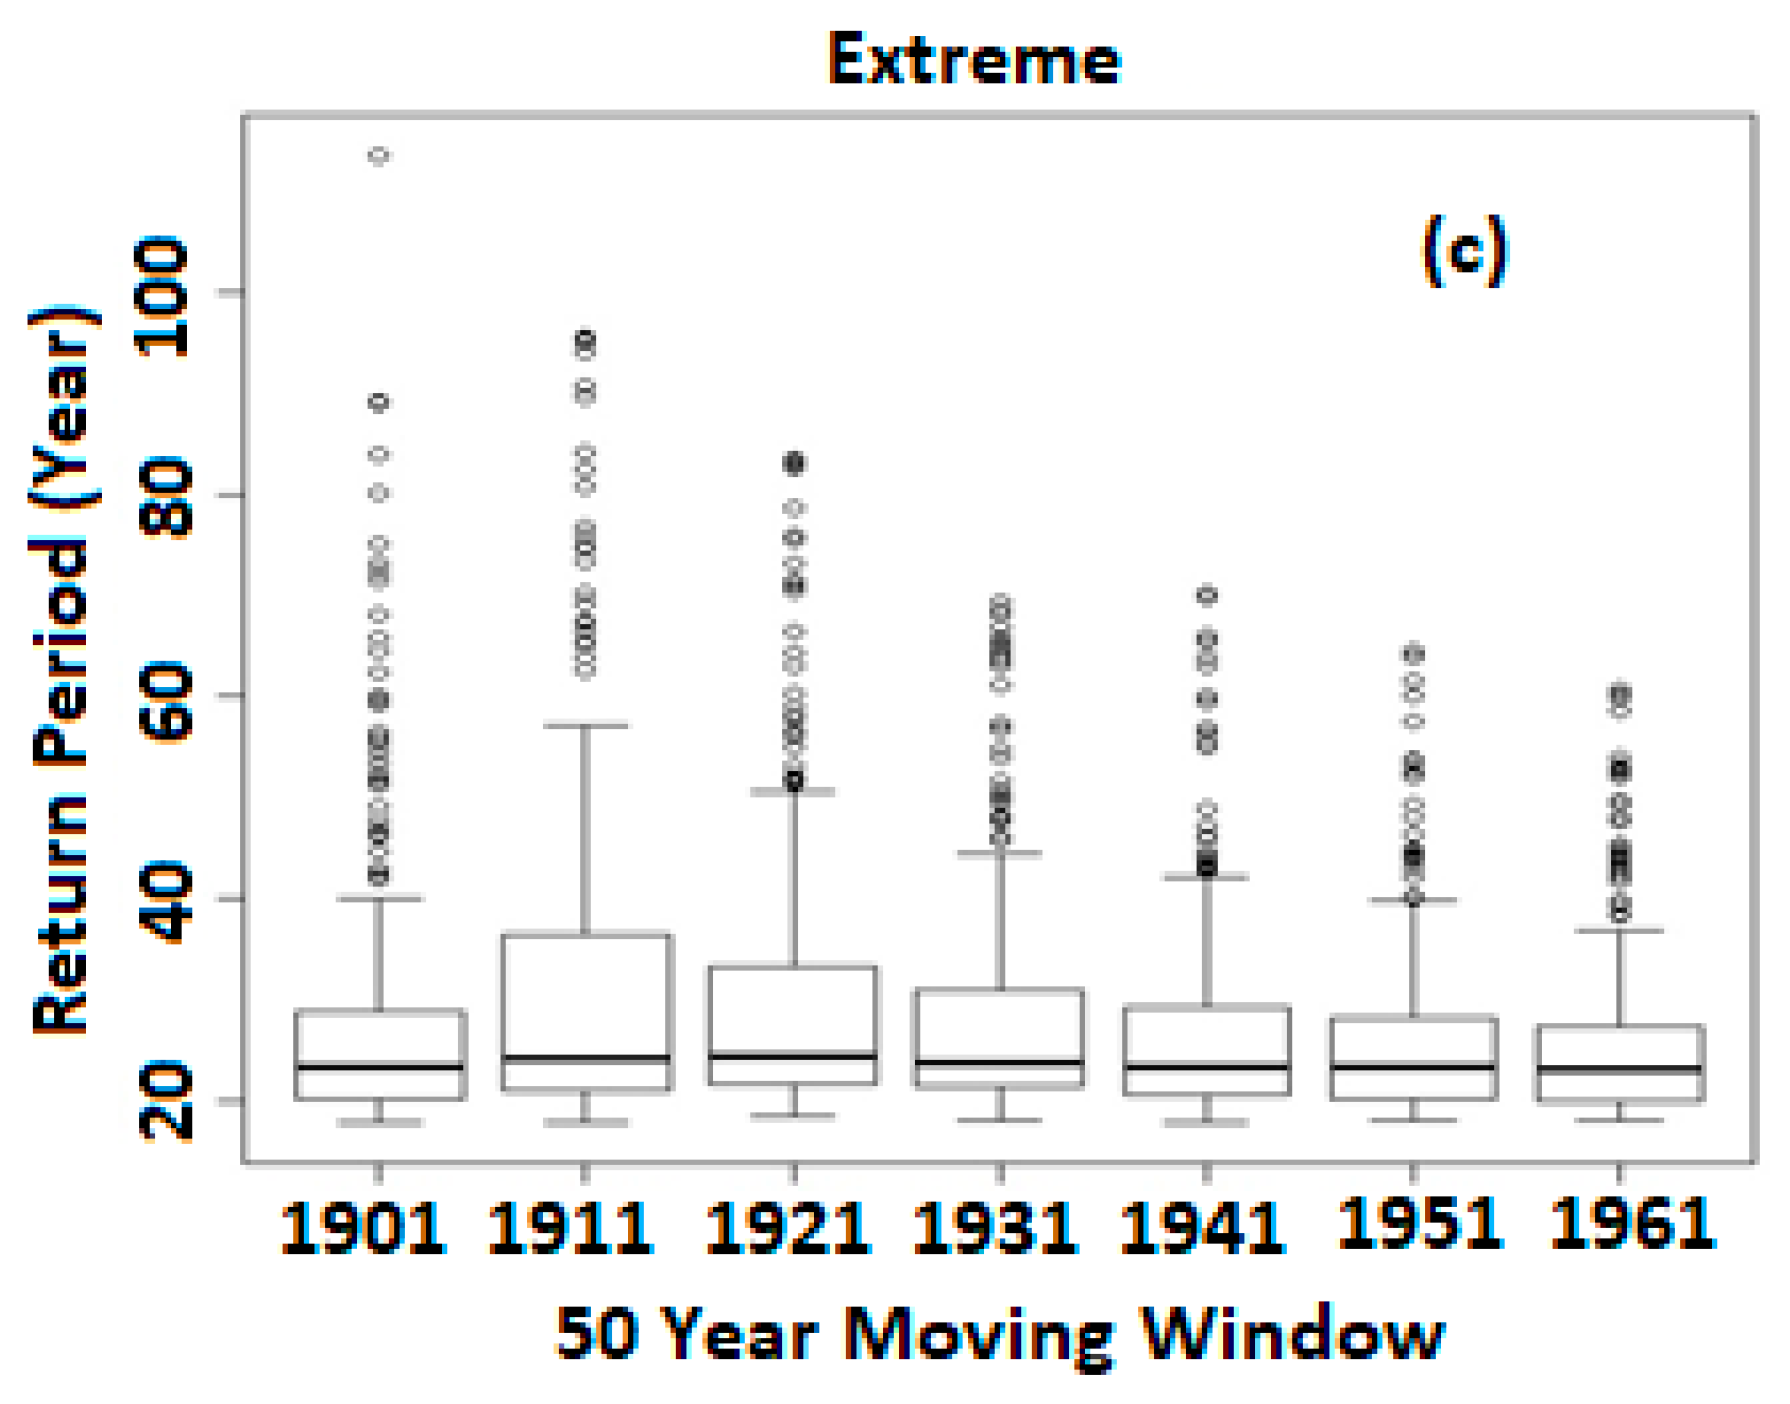
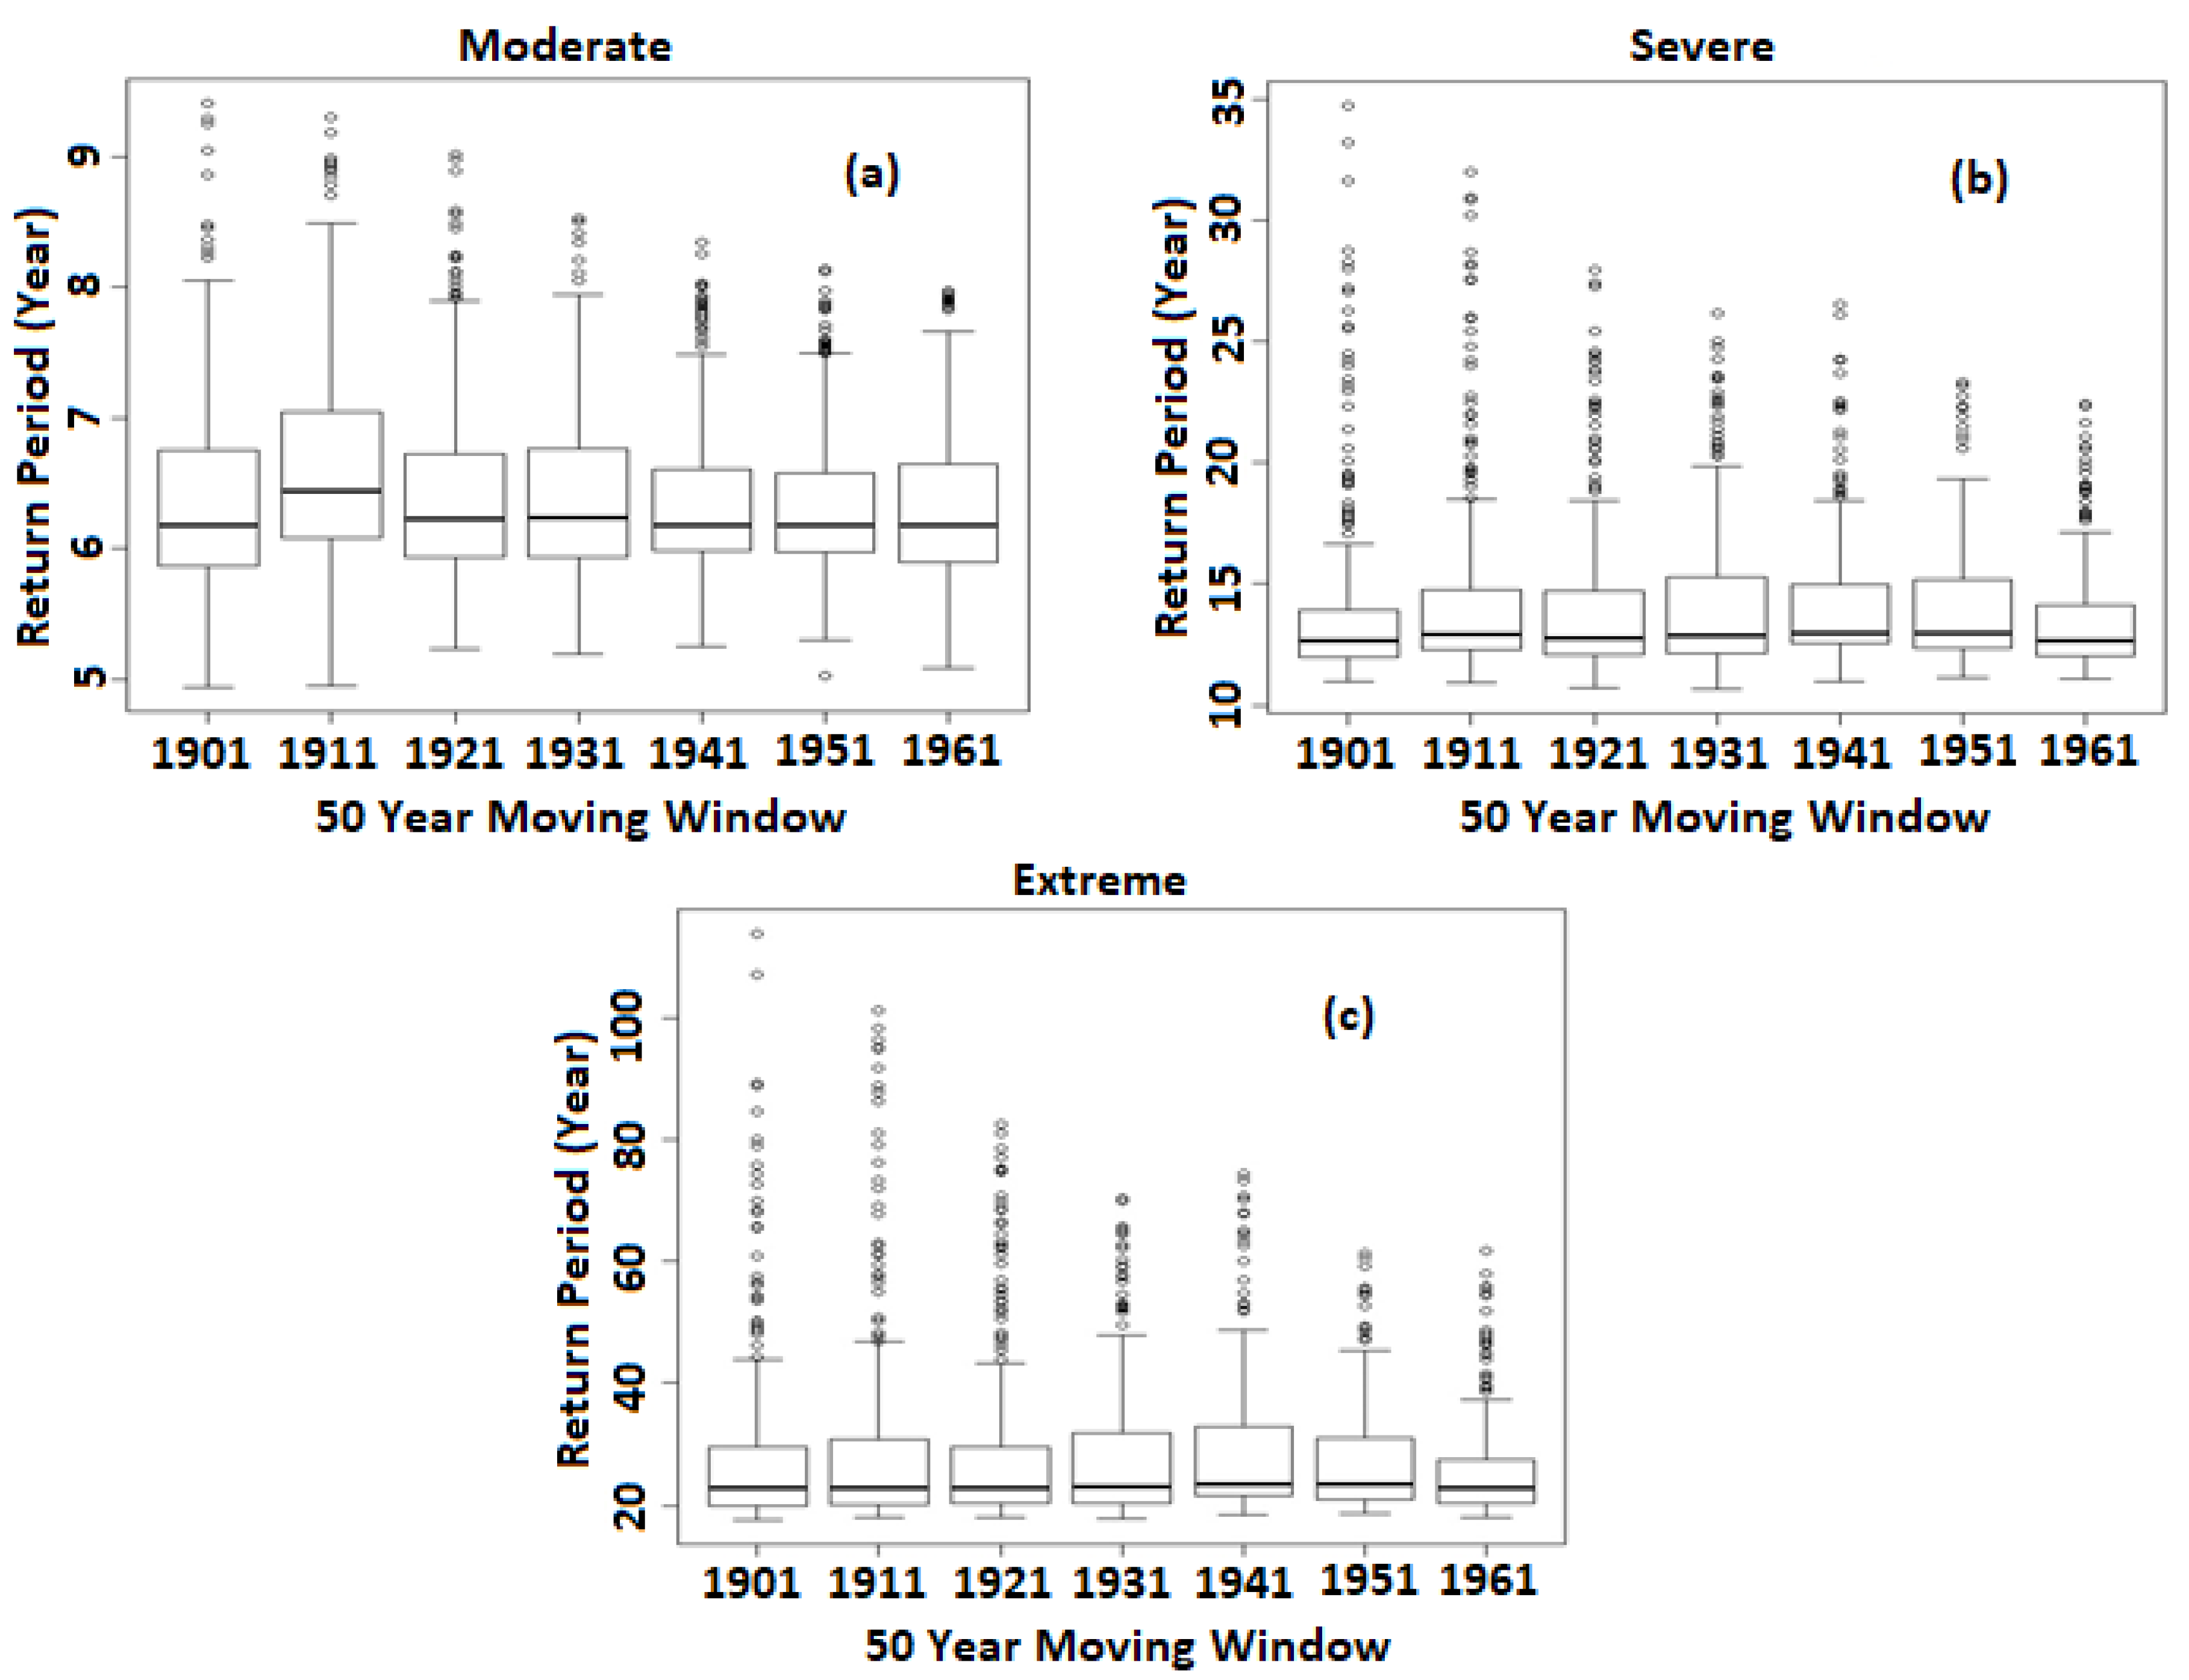
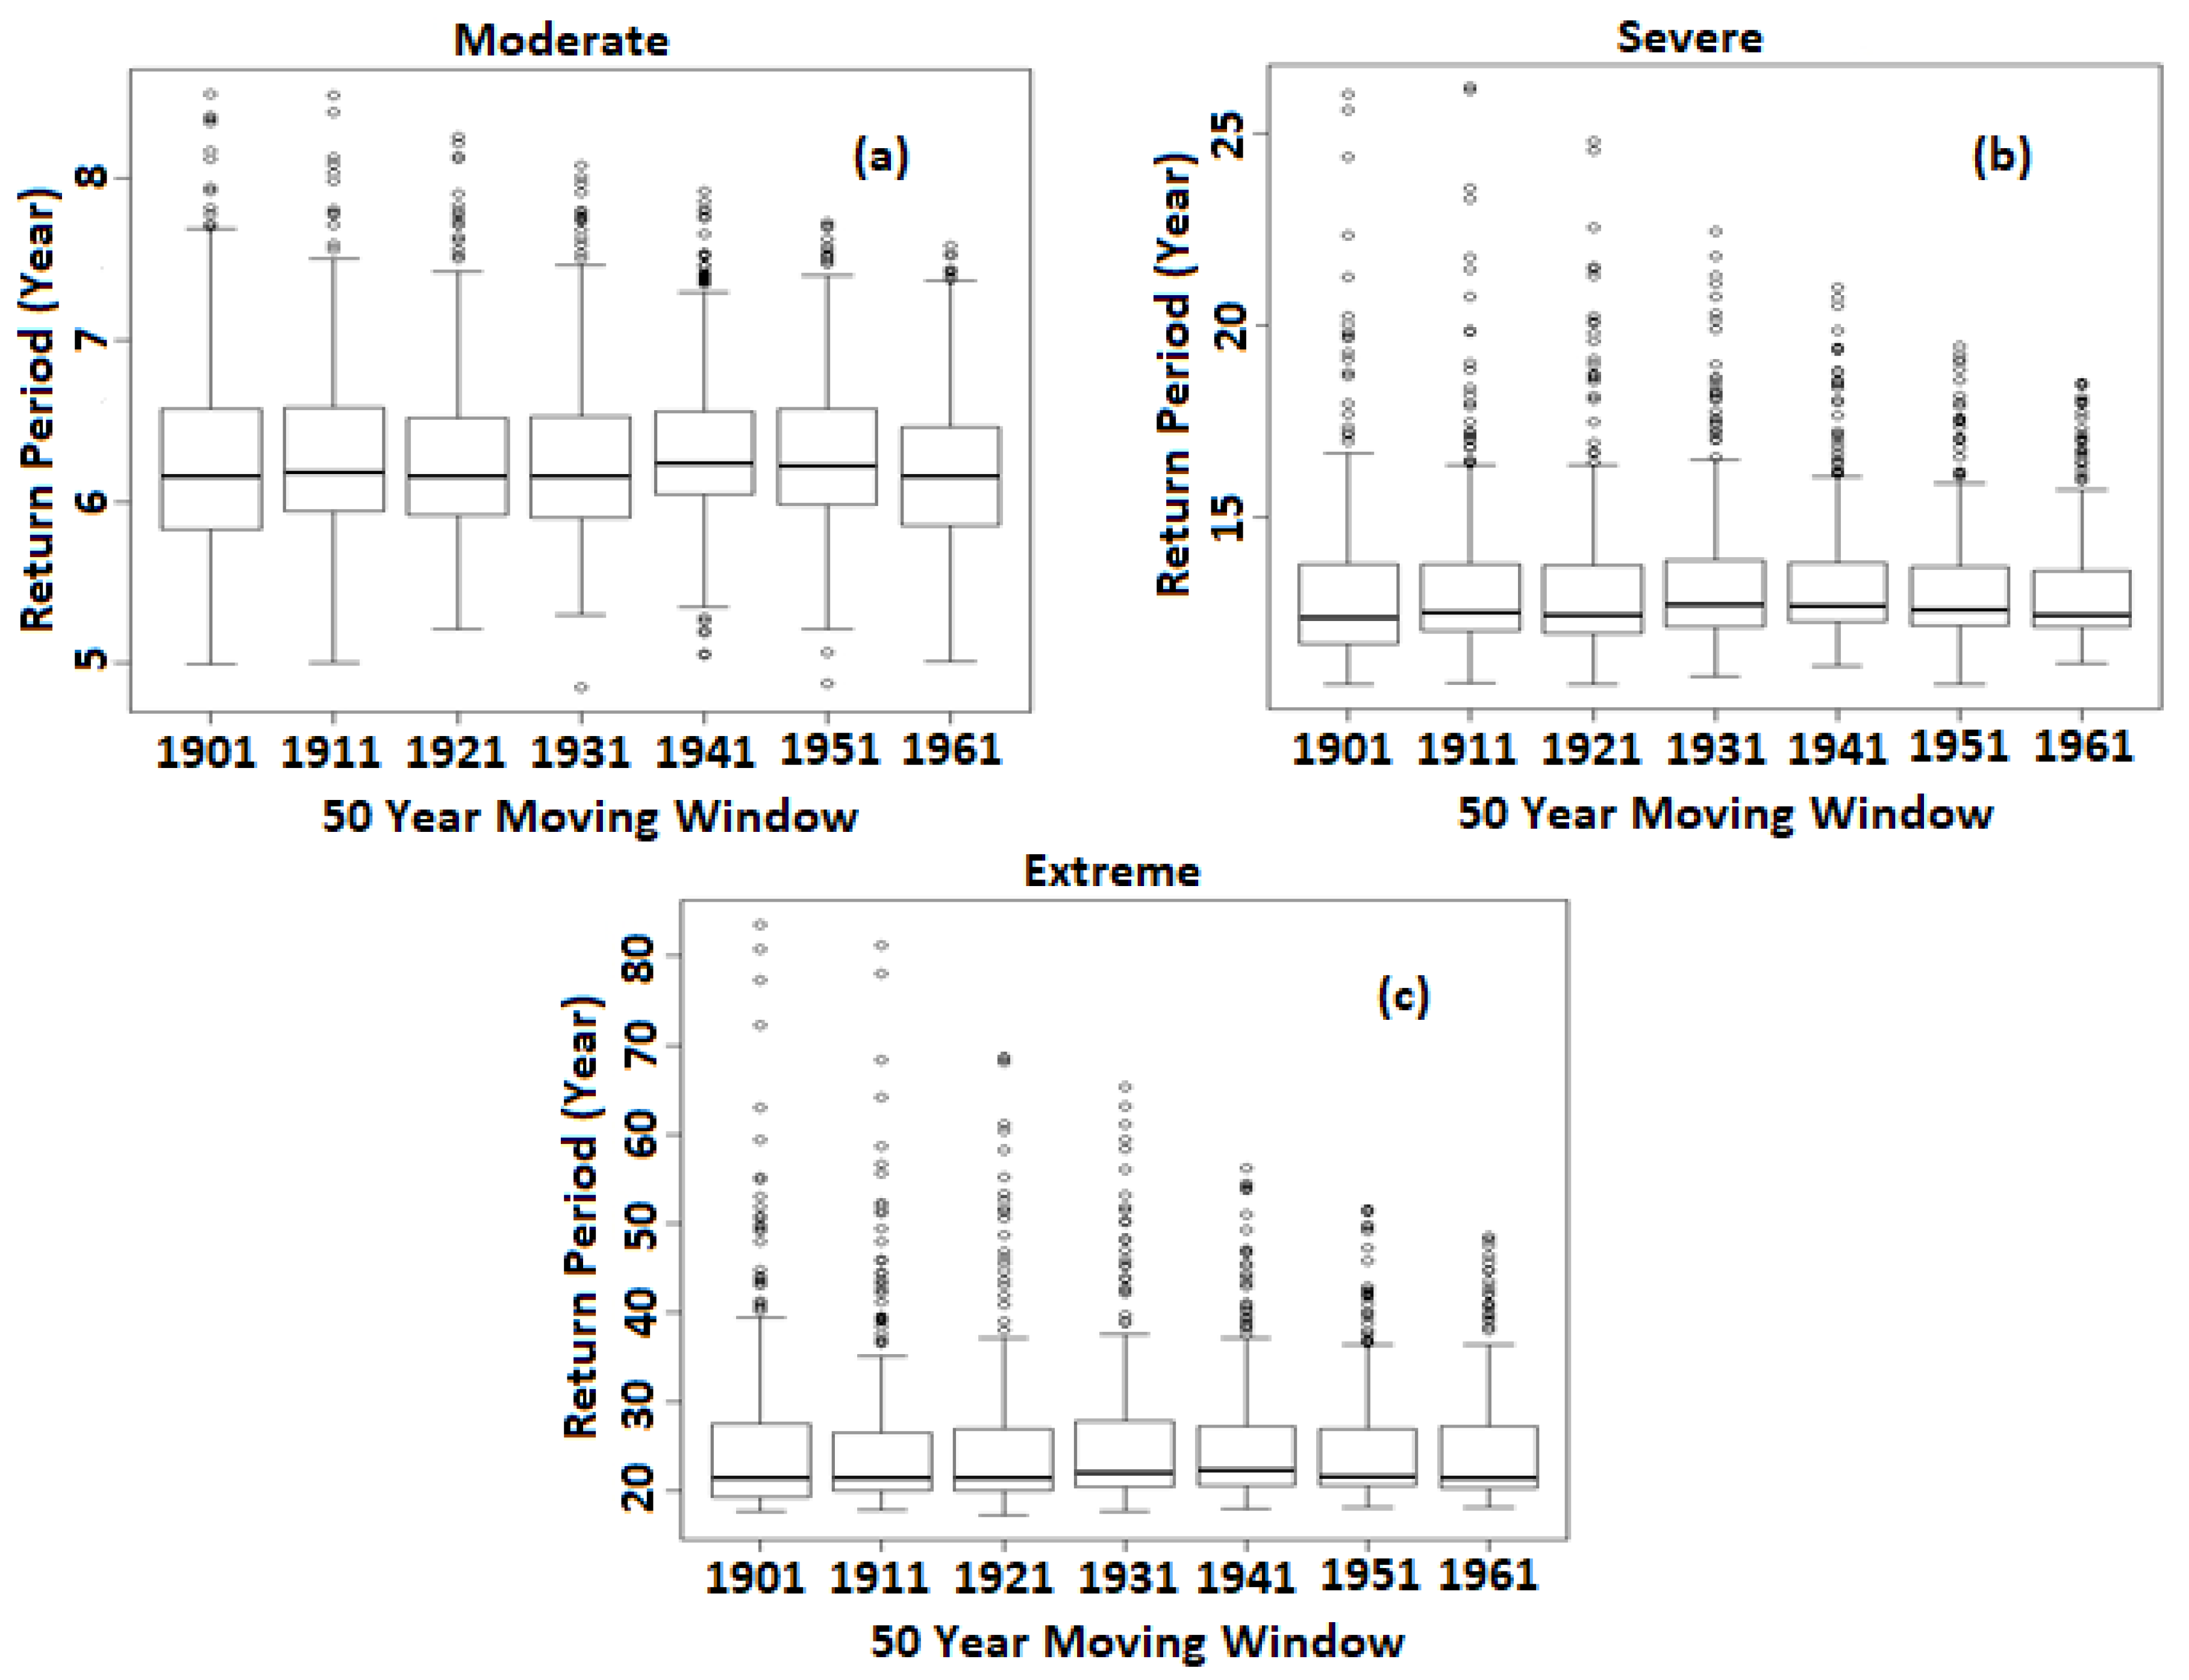
  • The return periods (RPs) of the different drought intensities (moderate, severe, and extreme) for cropping seasons for different 50-year periods were calculated through fitting the SPEI values with an appropriate probability distribution function (PDF).
  • The results obtained for the different crops growing seasons during 1901–2010 were analyzed to understand the impacts of climate change on droughts.
The methods employed in the current study are detailed in subsequent sections.

3.1. Standardized Precipitation Evapotranspiration Index for Estimating Seasonal Droughts

PET was estimated using different methods based on temperature, radiation, and mass transfer [42]. According to Stagge et al. [43], estimated SPEI does not vary significantly with the PET method used. However, Begueria et al. [44] reported significant variations in SPEI calculated using different PET methods in arid and semi-arid regions. Begueria et al. [44] proposed Penman–Monteith as the best option for the estimation of PET for calculation of SPEI followed by Hargreaves and the Thornthwaite methods. However, the Penman–Monteith method requires sunshine, humidity, and wind speed data along with temperature data, which are all spatially and temporally inadequate in Afghanistan. The Thornthwaite method only requires the mean daily temperature and latitudes of the study area. This makes Thornthwaite a suitable method for calculation of PET in data-scarce regions such as Afghanistan. Therefore, the Thornthwaite method was used in this study to calculate PET:
PET = 16 N m ( 10 T m I ) a
where Nm is a correction factor estimated according to latitude of the location and the month of the year; Tm is the monthly average of daily mean temperature (°C); I is a heat index, which was estimated for the whole year; and a is a coefficient estimated from I.
For calculation of SPEI, precipitation and PET data were used for the preparation of the time series of water deficit or surplus (D) as precipitation minus potential evapotranspiration (P–PET) P–PET at each GPCC/CRU grid point. The D values were then fit with the best PDF. The D can have negative values and, therefore, three-parameter distributions are needed to calculate the SPEI. The log-logistic distribution was found to fit the D values best for all the cropping seasons. Therefore, the probability distribution function of D was estimated using a log-logistic distribution:
F ( D ) = [ 1 + ( α x γ ) β ] 1
where α, β, and γ are scale, shape, and origin parameters, respectively. The SPEI is obtained as the standardized values of F(D). Drought is classified according to SPEI values: −1.0 to −1.5 is moderate drought, −1.5 to −2.0 is severe drought, and below −2.0 is extreme drought.
For the determination of a season’s drought, we used the value of the SPEI of the last month of that season calculated for the duration of the season. Because more water is required during sowing and mid-season compared to harvesting, droughts only during those periods were considered. The sowing and vegetative period for wheat, for example, is 7 months; hence, a 7-month SPEI value computed at the end of April was used for analysis of wheat droughts (Table 1).
Similarly, 4-month SPEI values estimated in September and 5-month SPEI values estimated in August were used for droughts analysis during rice and corn growing seasons, respectively as given in Table 1.
The estimated SPEI values were employed to calculate drought return periods (RPs) during cropping seasons. The following steps were used for the calculation of drought RPs.
  • The time series of droughts were generated for each cropping seasons considering SPEI < −1 as drought.
  • The years without droughts were assigned a value of zero.
  • The drought frequency analysis was conducted on the non-zero values.
  • We performed a correction using non-exceedance probability (F’) to account for the number of zero values [45]:
    F = q + ( 1 q ) F
    where F is the drought occurrence probability with consideration of non-drought years and q is the ratio of the number of non-drought years to the total study period [46].
  • The drought RP with particular severity was calculated as:
    T ( x ) = 1 1 F ( x )
In the present study, the drought events were fitted with different distributions. The Gamma distribution was found to best fit the drought events for all seasons and was therefore selected for drought frequency analysis.

3.2. Sen’s Slope Estimator

Sen’s slope (Q) estimates overall slope of a time series (y) as the median of slope between all the successive sampling points [47]. Mathematically, it is represented as:
Q = m e d i a n [ Δ y Δ t ]
where Δy is the change in recorded values due to change time Δt between two successive data points in the time series.

3.3. MMK Test

Trends in climate variables are usually assessed for the quantification of the changes in climate variables. The non-parametric Mann–Kendall (MK) test [48,49], suggested by the World Meteorological Organization [50], is generally used for the evaluation of the trends in atmospheric variables. The MK test is independent of data distribution and less sensitive to missing values and is thus most commonly used for assessment of trends in different climate variables. However, the major drawback of the MK test is that it is sensitive to auto-correlated data [51,52]. Several revisions of the MK test have been completed to make it insensitive to autocorrelation [53,54,55]. Recent studies also revealed that long-term persistence (LTP), or a slow decay of the autocorrelation function that causes a longstanding cycle in data series, also affects the significance of the trend [56]. The LTP in climatic time series occurs due to the influence of slow climatic processes that change over time. The LTP is a part of climate; therefore, it is required to separate the natural fluctuations from an external trend to estimate the trend due to global-warming-induced climate change [1,57,58,59,60,61]. The recent modification of the MK test (MMK) by Hamed [62] can be used for this purpose. The MK test statistic (S) of a data series y having n data points is estimated as [48]:
S = k = 1 n 1 . i = k + 1 n sign ( y i y k )
where:
s i g n ( y i y k ) = { + 1   when   ( y i   y k ) > 0   0   when   ( y i   y k ) = 0 1   when   ( y i   y k ) < 0
The variance of S [Var(S)] is estimated using Z statistics to decide trend significance:
Z = { S 1 V a r ( S )   when   S > 0 0      when   S = 0 S 1 V a r ( S )   when   S < 0
If Z is significant, the MMK test de-trends the time series [62], ranks the series ( R i ), and then calculates its equivalent normal variants ( Z i ) as:
Z i = ϕ 1 ( R i n + 1 )
where ϕ 1 represents the inverse form of normal distribution. The Hurst coefficient (H) of the series is then derived through the maximum log likelihood function to estimate the autocorrelation function for lag l on any scale using the following equation [63]:
ρ l = 1 2 ( | l + 1 | 2 H 2 | l | 2 H + | l 1 | 2 H )
The significance of H is decided by the use of the first and second moments for H = 0.5. For significant H values, the variance of S is estimated as:
V a r ( S ) H = i < j . k < l 2 π sin 1 ( ρ | j i | ρ | i l | ρ | j k | + ρ | i k | ( 2 2 ρ | i j | ) ( 2 2 ρ | k l | ) )
where V a r ( S ) H is the biased estimate of the variance of S, which can be removed using a correction factor (B):
V a r ( S ) H = V a r ( S ) H × B
where B is a function of H, as below:
B = a 0 + a 1 H + a 2 H 2 + a 3 H 3 + a 4 H 4
where the coefficients, a 0 , a 1 , a 2 , a 3 , and a 4 are the functions of the sample size n, which can be found in Hamed [62]. The significance of the MMK test is determined using V a r ( S ) H instead of V a r ( S ) in Equation (8). At a 95% confidence level, the null hypothesis of no trend is rejected if |Z| > 1.96. In the present study, the 95% confidence level was considered for the assessment of the significance of a trend.

4. Application Results and Analysis

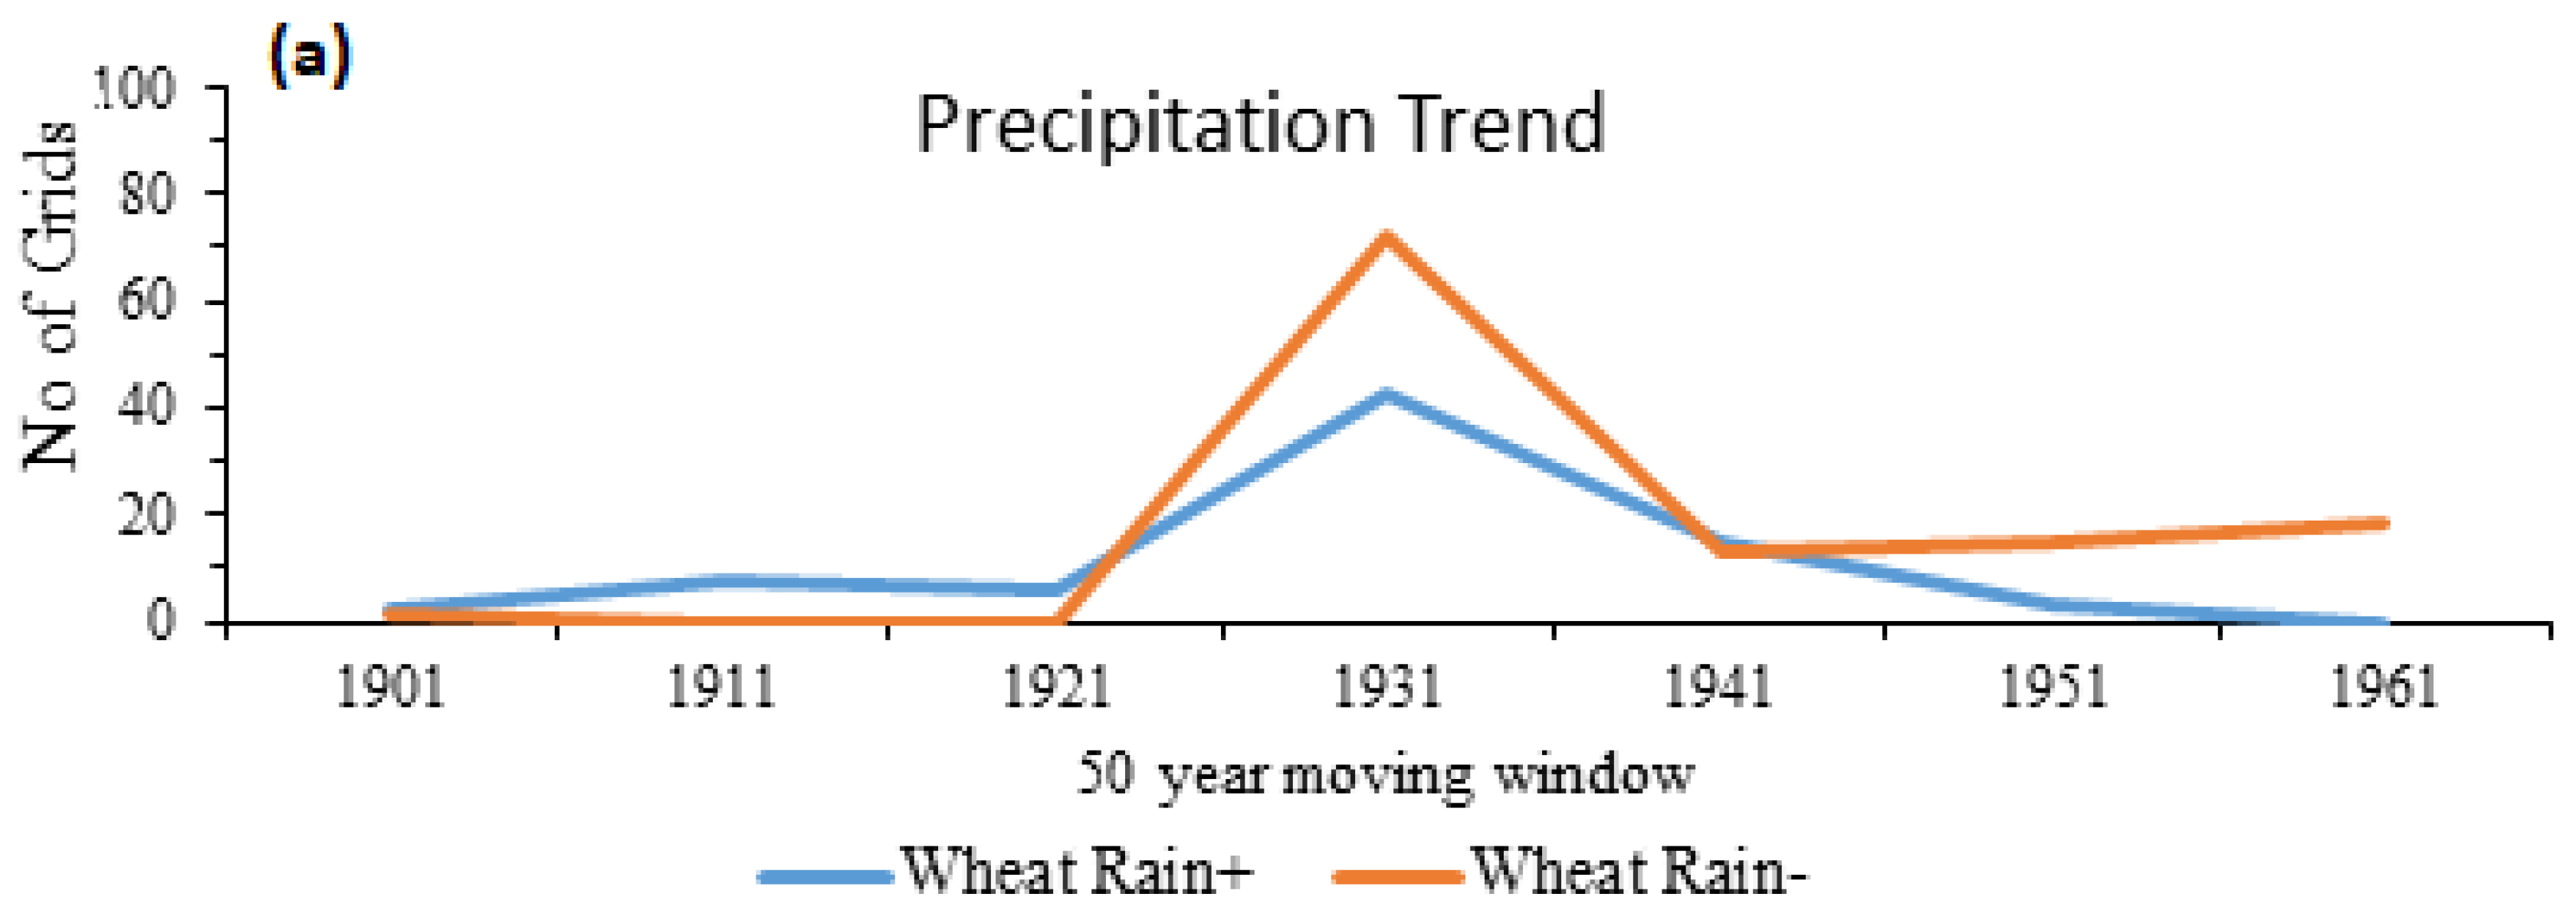
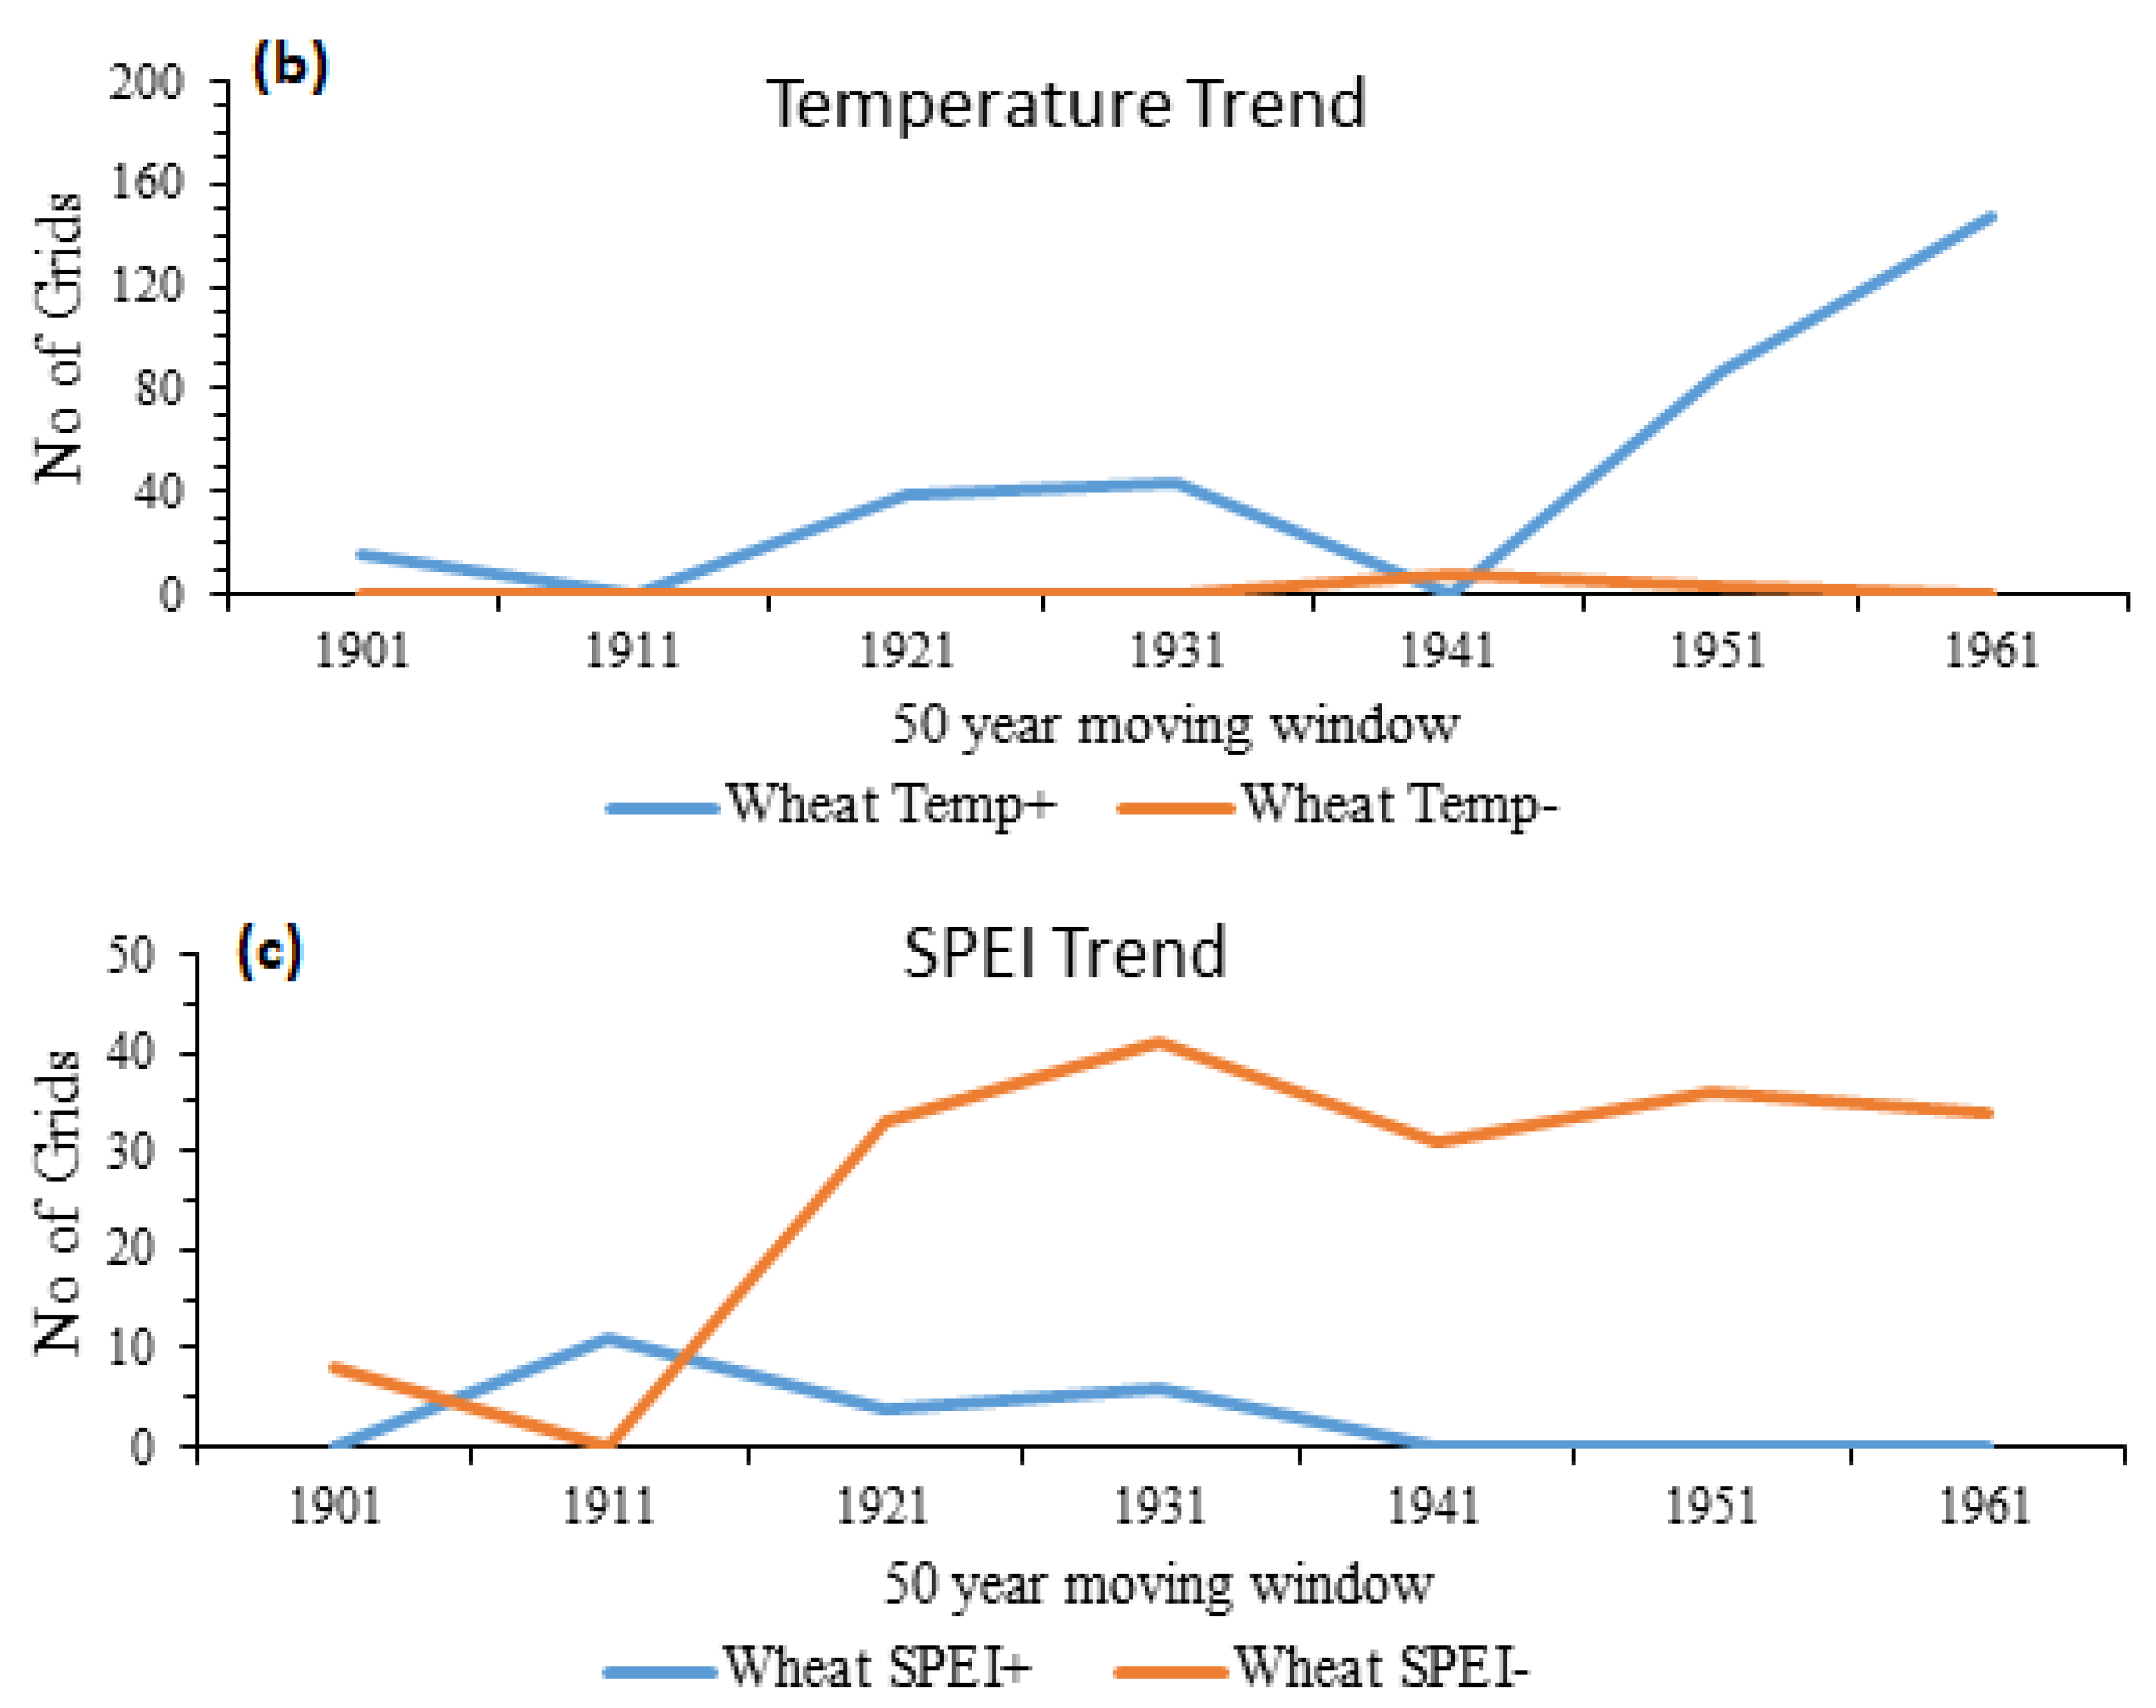
4.1. Meteorological Droughts During Wheat-Growing Season

The geographical distribution of the trends in precipitation, temperature, and SPEI during sowing and vegetative (mid-season) of wheat are presented in Figure 4a–c, respectively, for recent years. The magnitude of the change estimated by the use of Sen’s slope at each point is presented with a resolution of 0.5° × 0.5° (original GPCC/CRU data resolution) in the maps presented in Figure 4. The significant decrease or increase in trends at the 95% confidence interval (CI) calculated by the MMK test at each of the GPCC/CRU points are shown using the symbols ‘+’ or ‘−’, respectively.
Figure 4a shows precipitation decreased significantly in the southwest and increased in some grids in the northeast of Afghanistan. However, increases in temperature occurred almost for the whole country, except for the southeast (Figure 4b). Increases in temperature were higher in the west—up to 0.14 °C/decade (Figure 4c). The counts of the grid points where precipitation, temperature, and SPEI changed significantly considering a 50-year sliding window and a 10-year interval during 1901–2010 for the wheat cropping season are presented in Figure 5a–c, respectively. SPEI was found to be sensitive to rainfall and temperature. Decreases in SPEI were observed at up to 45 grid points (16% area) during the period temperatures were increasing at about 40 grid points (14% area) and when rainfall was decreasing at 70 grid points (25% area) until 1931. The estimated RPs of wheat drought at the different grids of Afghanistan are depicted using box plots in Figure 6a–c for three different drought severities. A longer box size or a longer whisker in the plot is an indication of a wide range of return periods of droughts. Shorter boxes or shorter whiskers indicate the proximity of the RPs of droughts to the median value. The RPs of moderate, severe, and extreme wheat droughts ranges between 5.7 and 6.8, 12.2 and 16.0, and 20.0 and 38.0 years, respectively. The median RPs were found within 6.2–6.4 for moderate, 12.7–13 for severe, and 24–25 for extreme drought classes.

4.2. Meteorological Droughts in Rice-Growing Season

The geographical distributions of the changes in precipitation, temperature, and SPEI during the rice growing season are presented in Figure 7a–c respectively. Figure 7a shows a significant decrease in precipitation in the southwest and northwest and a significant increase at some grid points in the northeast and southeast. Temperature increased significantly at almost all grid points at the northwest and southwest of the country (Figure 7b). Significant decreases in temperature were observed in the southeast of the country, which caused decreases in the SPEI in the region (Figure 7c).
The grid point numbers with significant rainfall, temperature, and SPEI changes for a 50-year sliding window and a 10-year interval during 1901–2010 for the rice cropping season are outlined in Figure 8a–c, respectively. After an increase in the grid point numbers where rainfall was decreasing until 1921, there was a continuous decrease in the grid point numbers where it was decreasing after 1921. The count of grid points where precipitation was increasing sharply increased after mid-century. The drought return periods for rice are presented in Figure 9a–c for the three different drought severities. The moderate, severe, and extreme drought RPs for this crop were found to be 5.9–7.1, 12.5–15.2, and 20.0–37.0 years, respectively. The median RP values for different categories of droughts are found within 6.2–6.5 for moderate, 13.0–13.5 for severe, and 22.0–23.5 for extreme drought classes.

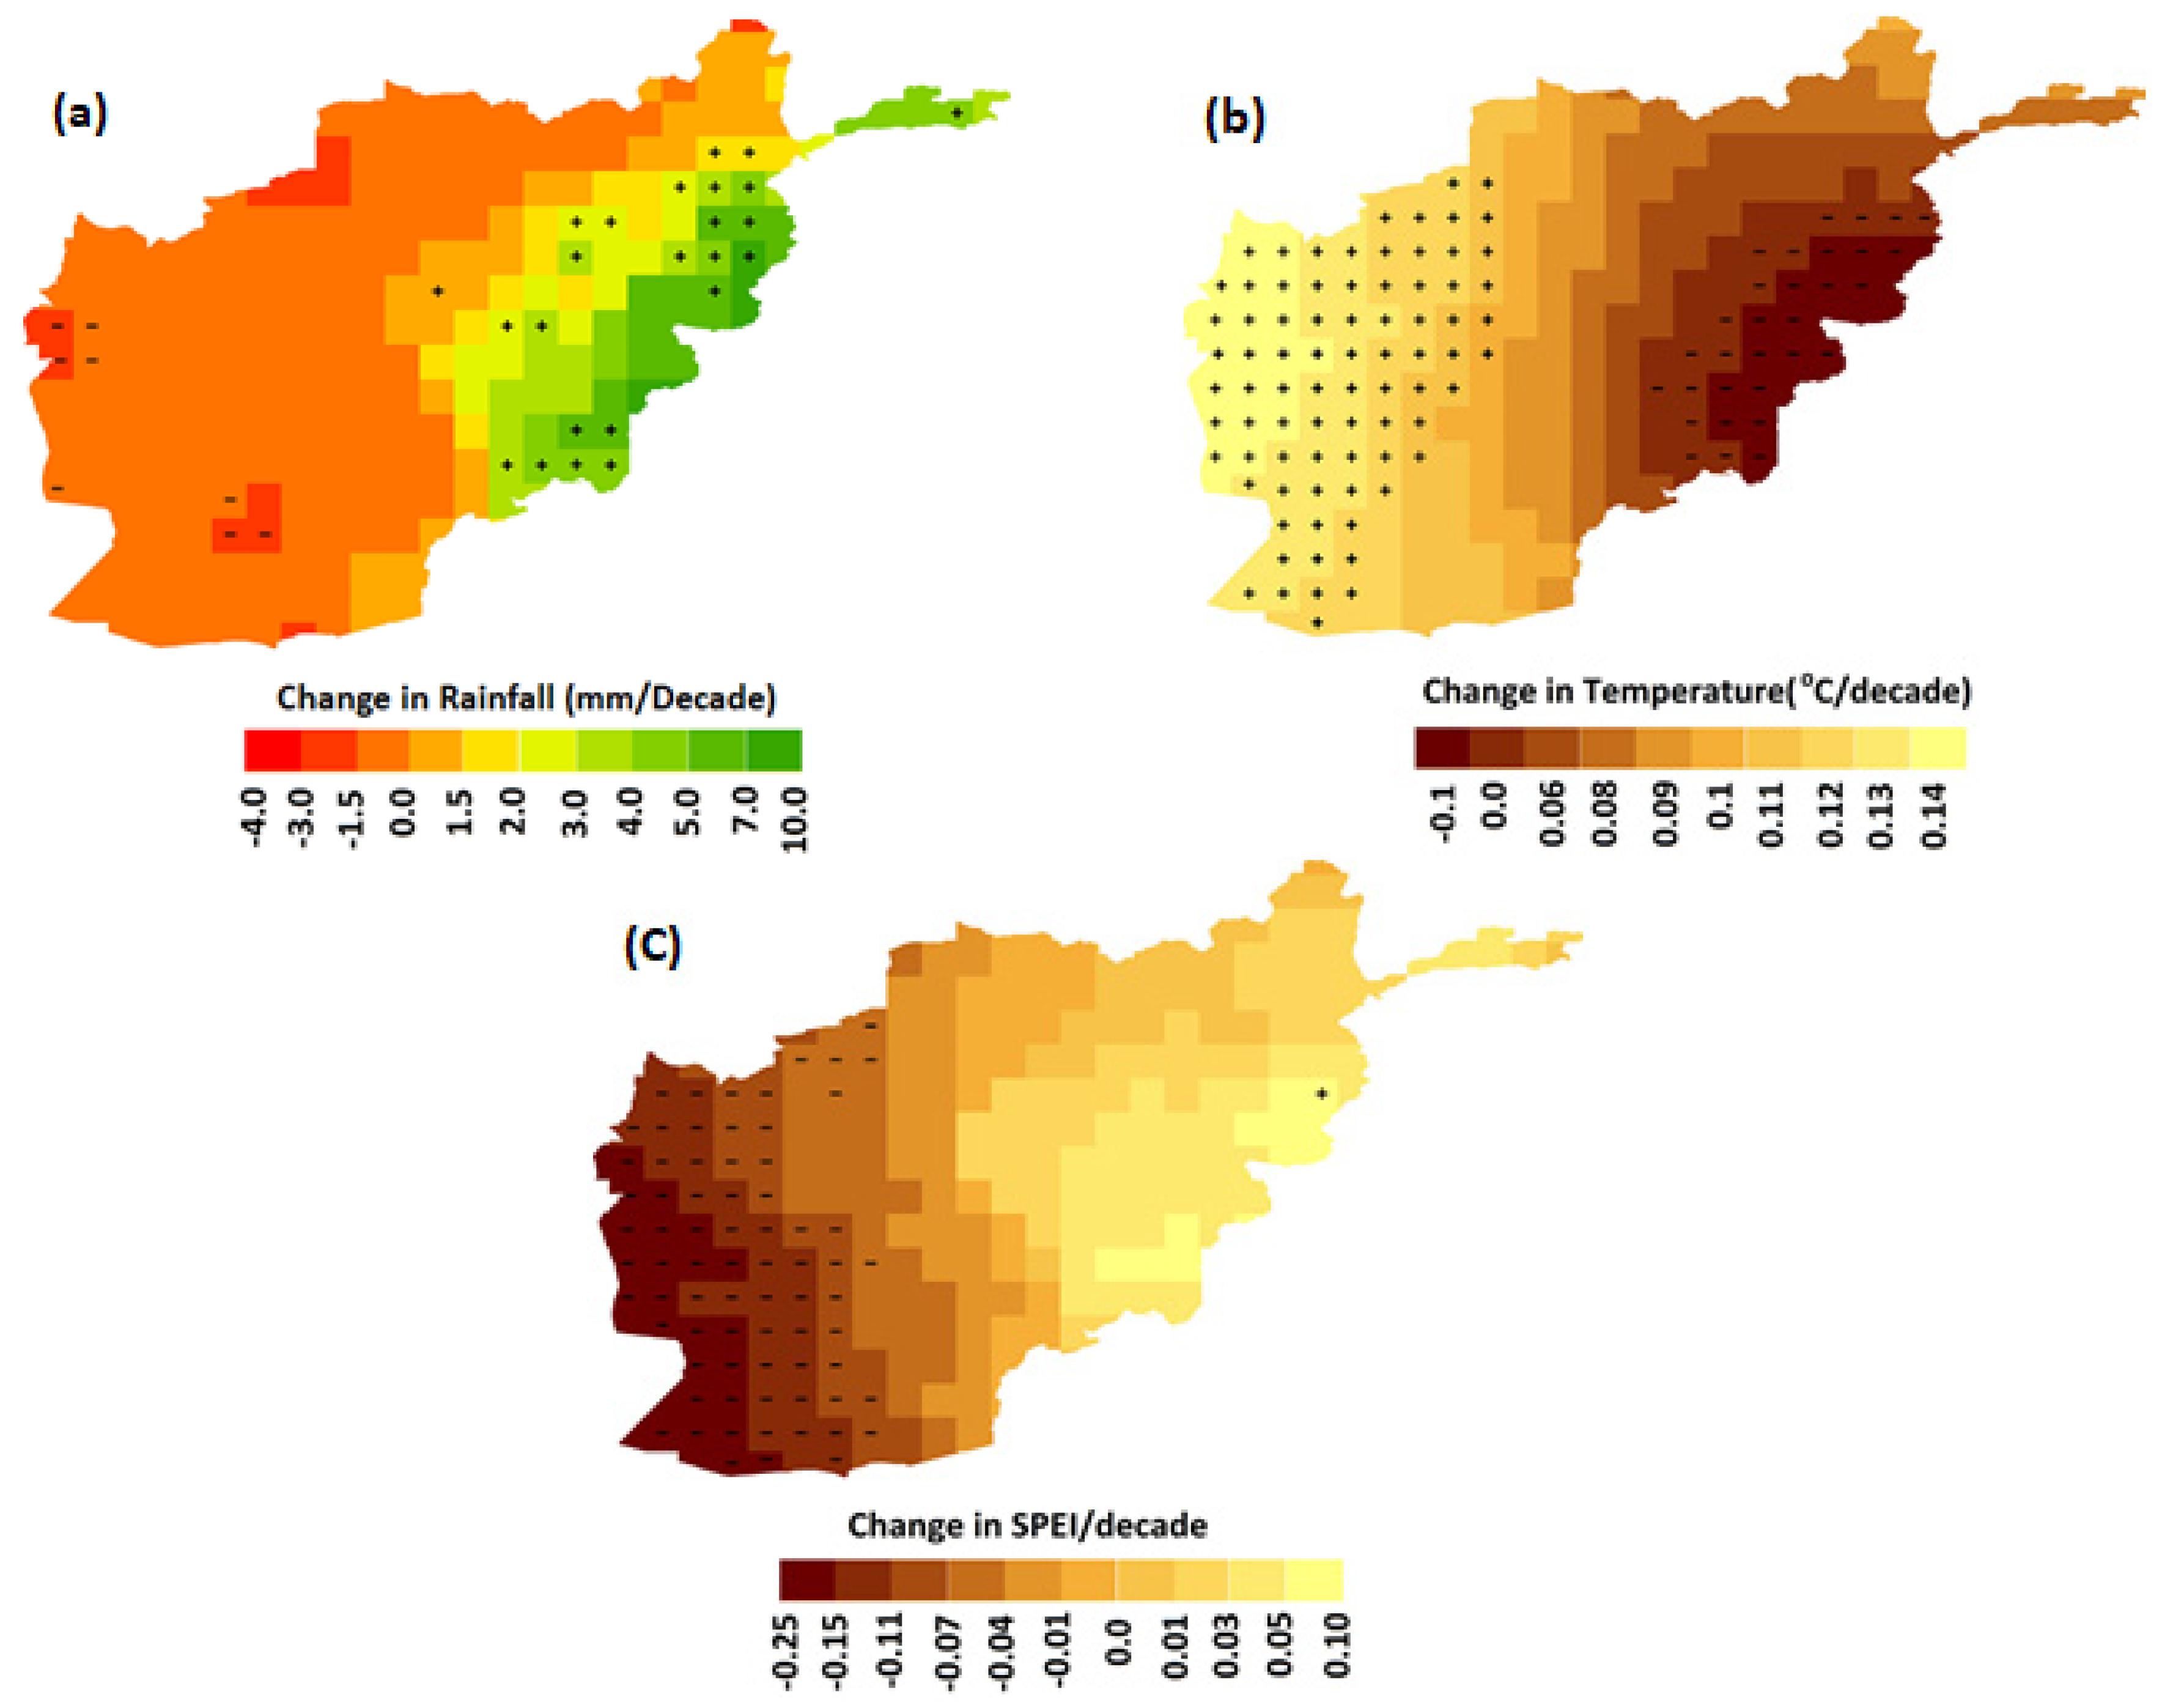
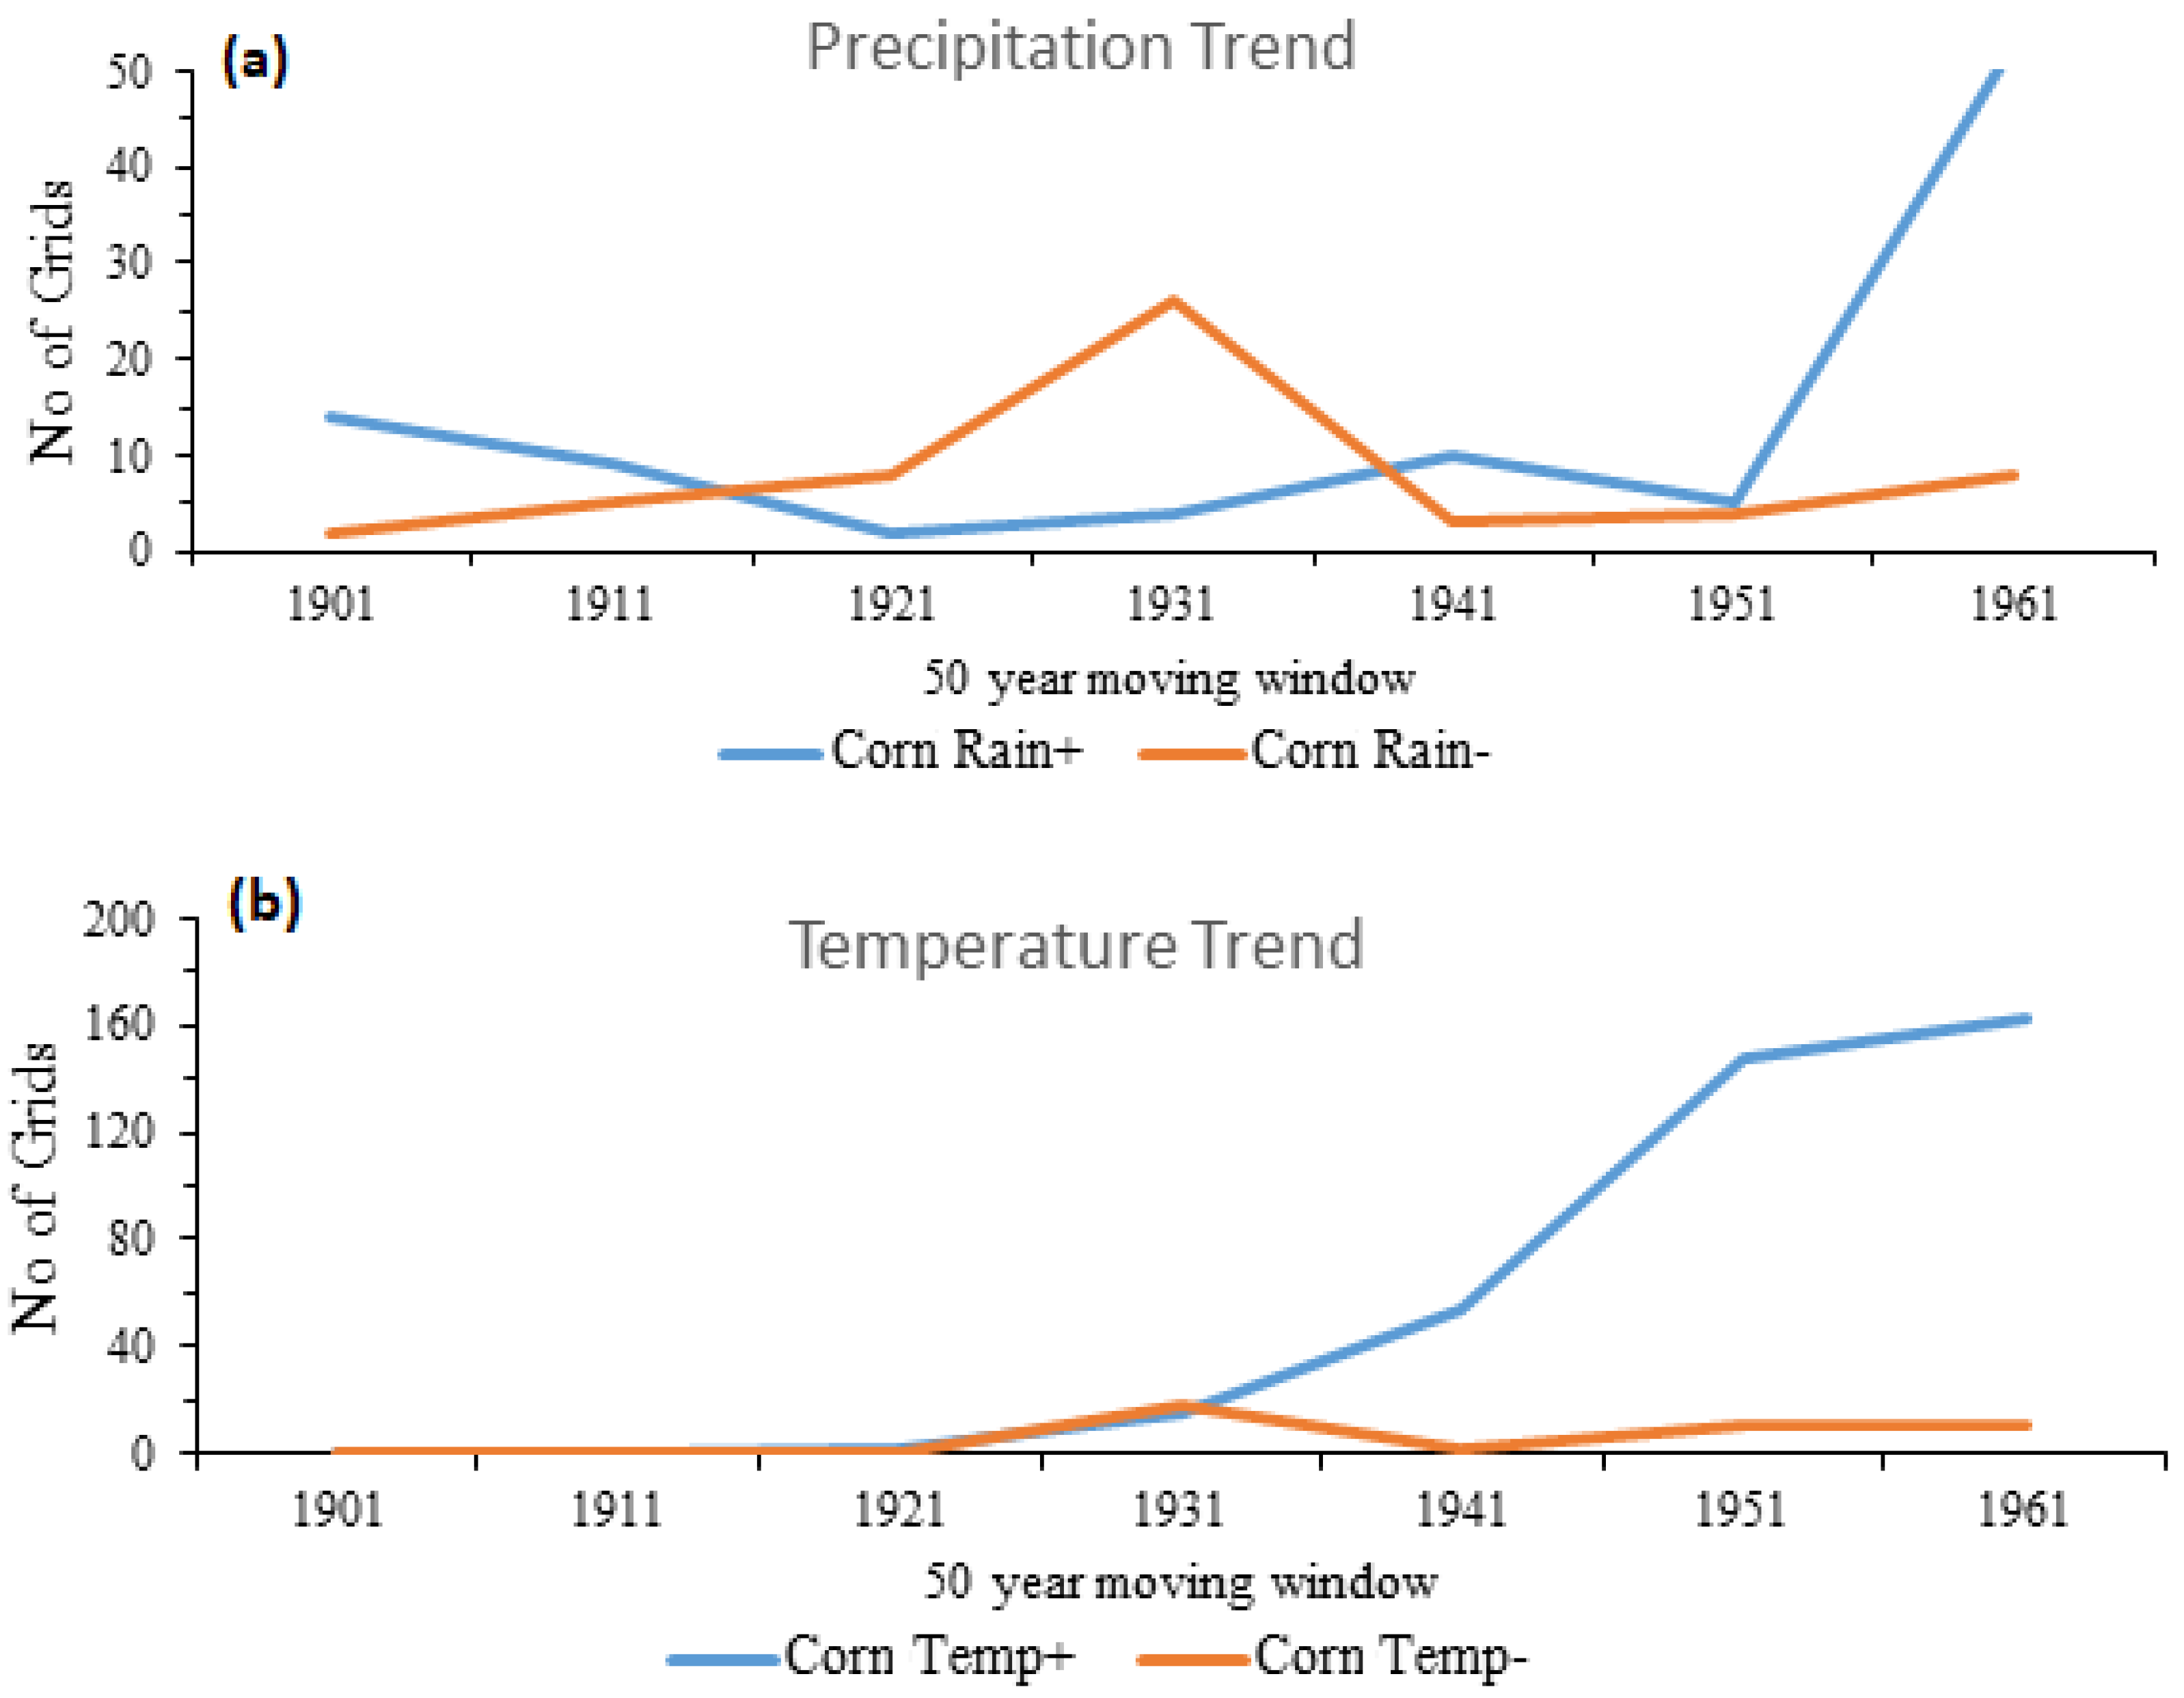
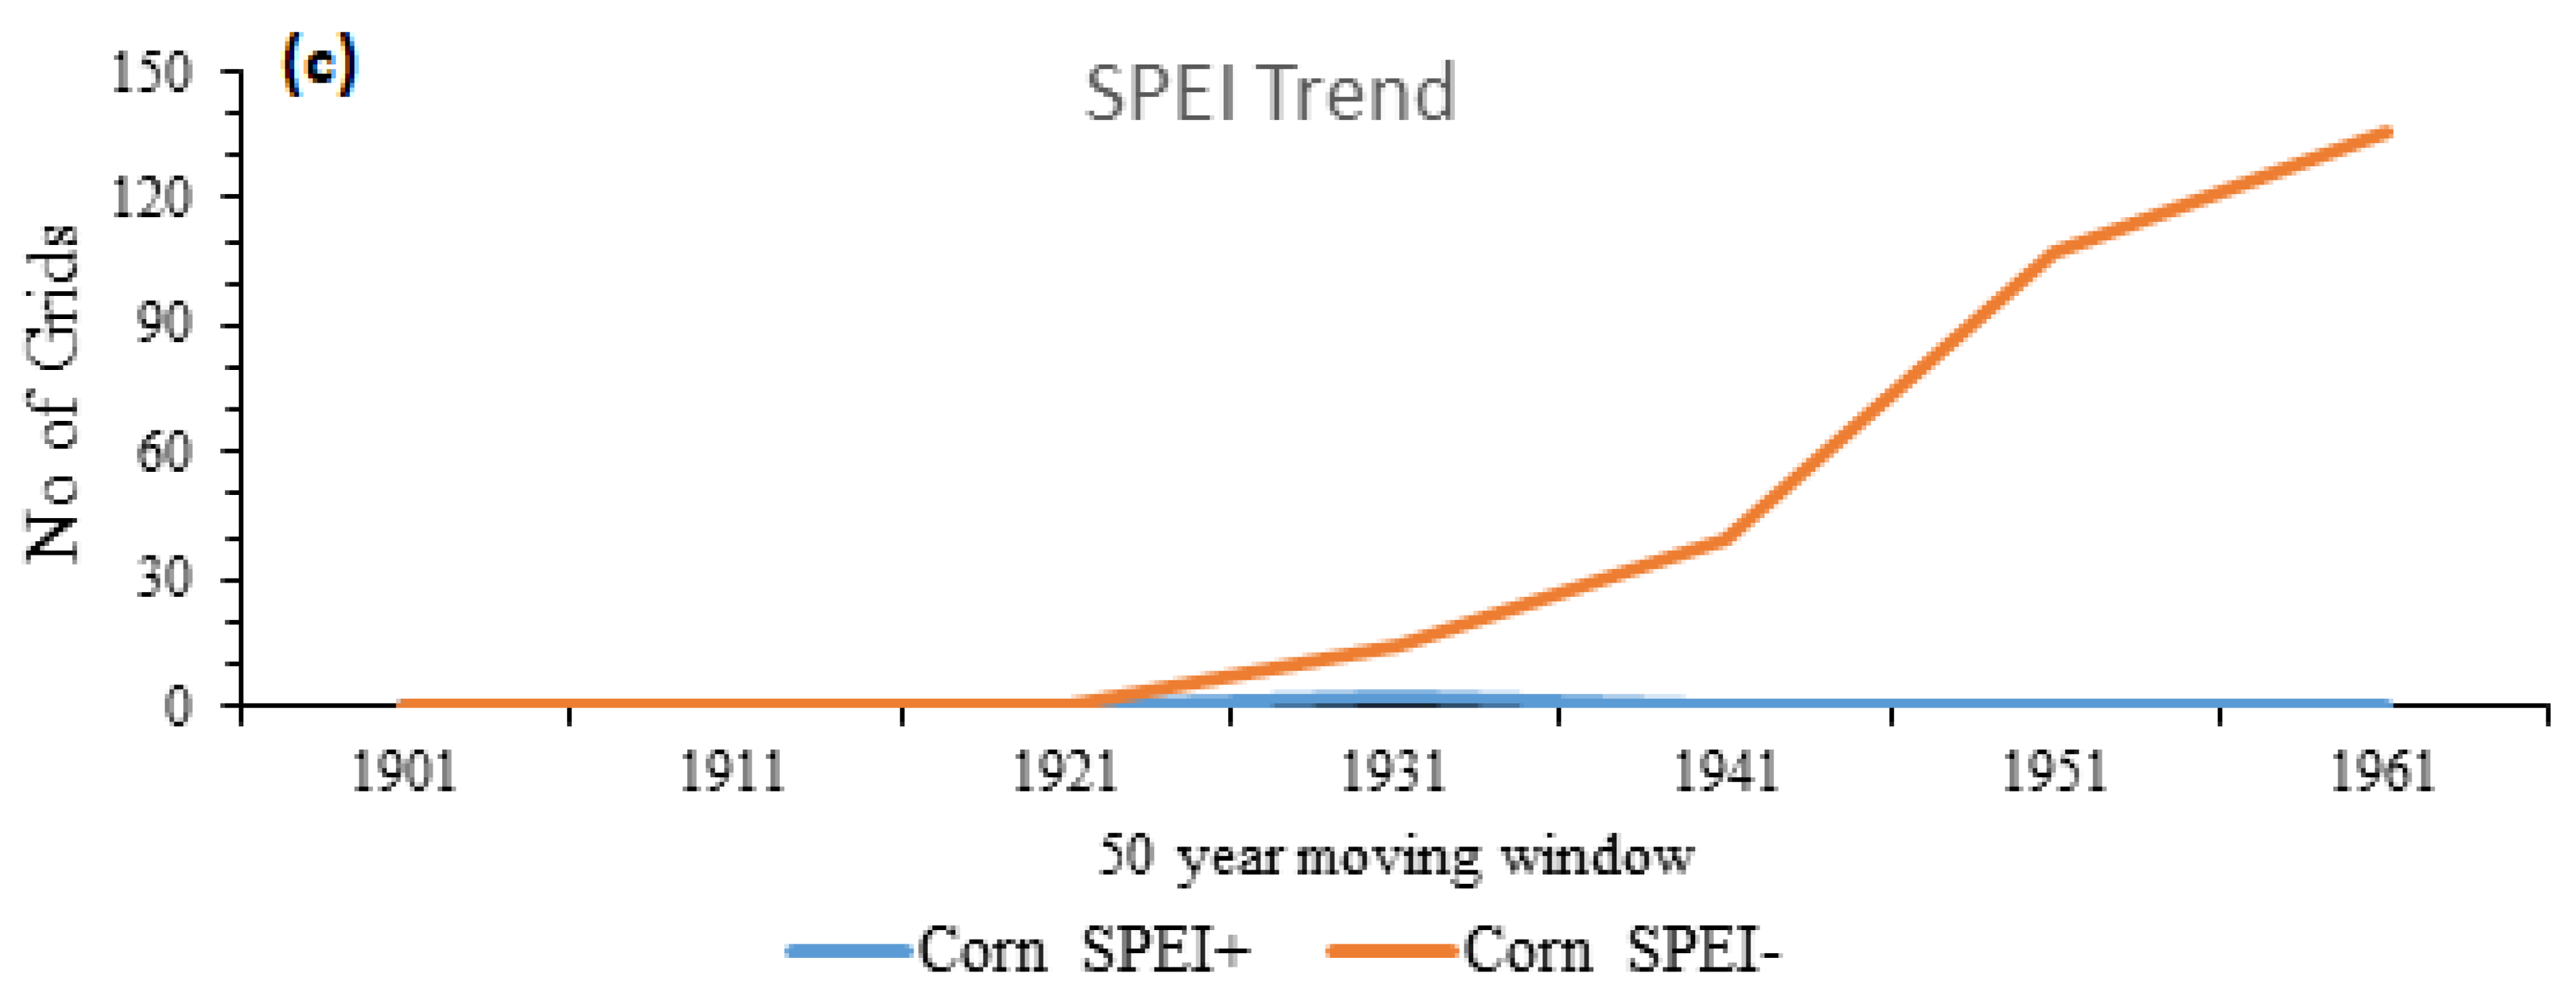
4.3. Meteorological Droughts During Corn-Growing Season

The geographical distributions of the changes in precipitation, temperature, and SPEI during the corn-growing season are presented in Figure 10a–c, respectively. Figure 10a shows rainfall decreased significantly at a few locations in the southwest and northwest, while significant increases occurred in the northeast and southeast of the country. Temperature increased significantly at almost all grid points in the northwest and southwest of the country (Figure 10b). Significant decreases in temperature were observed in the southeast and part of the northeast of the country. Significant increases in temperature in the northwest and southwest of the country resulted in a decrease in the SPEI in these areas (Figure 10c). The number of grids that showed significant rainfall, temperature, and SPEI changes for a 50-year sliding window and a 10-year interval during 1901–2010 for the corn cropping season are presented in Figure 11a–c, respectively. The figures show an increase in the number of grids where rainfall is increasing significantly after mid-century. The number of grids where rainfall decreased significantly also gradually increased from 1941. Drought return periods for corn are presented in Figure 12 for the three drought severities. The moderate, severe, and extreme drought return periods for this crop were 5.8–6.6, 12.0–14.0, and 19.0–27.0 years, respectively. The RP median values for the different categories of droughts were 6.2–6.3 for moderate, 12.5–13.0 for severe, and 21.0–22.0 for extreme droughts.

5. Discussion

The changing drought characteristics during wheat-, rice-, and corn-growing periods at 281 grid points in Afghanistan during 1901–2010 using gauge-based climatic data were assessed in this study. The fitting of the SPEI values with the best PDF was used in the estimation of drought RP. The secular climate and drought index changes were assessed using the MMK test. For understanding the influences of the climatic variables on droughts, drought temporal variations and their relationships with temperature and precipitation changes were evaluated using a 50-year sliding window with 10-year intervals.
The geographical assessment of the spatial patterns of droughts for the different growing seasons showed that decreases in rainfall and increases in temperature during the wheat-growing season resulted in a decrease in the SPEI in the southwest, whereas an increase in rainfall and relatively lower rate of increase in temperature caused SPEI to rise at a few locations in the northeast. This indicates that the combined effect of rainfall and temperature played an important role in decreasing the SPEI in the southwest of Afghanistan during wheat-growing season. For rice-growing season, increases in temperature in the northwest and southwest of the country caused a decrease in the SPEI in the regions. This shows that temperature played a significant role in decreasing the SPEI in the area during rice-cropping season. In the northeast and the southeast where few grid points showed increases in precipitation and decreases in temperature, the SPEI was observed to decrease during the rice cropping season. In the corn-growing season, the significant increase in temperature in the northwest and southwest of the country resulted in a decrease in the SPEI in these areas. This is an indication that temperature was crucial to decreasing the SPEI in these areas during the corn cropping season. In the northeast and southeast parts where precipitation increased at some grids, there were no significant changes in SPEI, except for a significant increase at one grid point.
The count of grid points where rainfall, temperature, and SPEI changed for the different crops showed that during the wheat-growing season, increases were not observed in the SPEI for the study period except at the beginning of the century. A sharp increase from 1941 was observed for temperature. In recent years (1961–2010), precipitation was found to be gradually increasing with the increase in temperature in many parts of Afghanistan. This has resulted in a decreasing trend in the SPEI. Rice-growing season showed that temperature continuously increased at about 170 grid points (60% of the total grid points) until the end of the century. Continuous increases in temperature resulted in continuous decreases in the SPEI at many grid points (150 grids, about 53%) during the rice cropping season. During corn-growing season, temperature increased continuously from 1921 until the end of the study period at about 170 grid points (60% of the total study area), while there were no observable decreases in temperature at any grid point during most of the study period. The SPEI decreased continuously at 140 grid points (50% of the study area) due to continuous increases in temperature.
The return periods during different crop growing seasons showed that the box plots generally contracted over time for all categories of wheat drought. This was observed both for the median and the whiskers of the box plots. Though fluctuations were observed in the RPs during the first 50 years of the century during the rice-growing season, the return periods generally decreased for all drought classes, especially for the severe and the extreme droughts after that. Similar to rice, the corn-growing season showed some fluctuations in the drought RPs, but a generally decreasing trend was observed in the RPs of all classes of drought. The return periods for all the crops suggested that droughts occurred more frequently in areas where they were not frequent before.
Although the impacts of climate change on droughts have been widely assessed in many parts of the globe, including in Afghanistan and surrounding regions, no assessments of droughts have been conducted during the cropping seasons. In Pakistan, Ahmed et al. [26] assessed the impacts of climate variability and change on seasonal drought characteristics during two cropping seasons: Rabi and Kharif. The study showed increased drought severity during both cropping seasons, mostly in the arid and semi-arid regions of the country. Increasing droughts were mostly influenced by increasing temperature, whereas decreases in droughts were influenced by rainfall. Ta et al. [27] used SPEI, the Mann–Kendal trend test, and empirical orthogonal function analysis, and showed that drought frequency was over 42.87% in the entire Central Asia region, with Uzbekistan and Turkmenistan as the driest countries in the region. The results corroborate the findings from this study of high dryness over Afghanistan, like the neighboring countries in Central Asia.

6. Conclusions

In this study, we assessed the changes in meteorological droughts during crop growing seasons in Afghanistan. A comparison of the changing characteristics of droughts for different crop growing seasons suggested that the southern parts of the country have been strongly affected by climatic changes during wheat cropping season. The northwest and the southwest of the country were more affected by droughts due to alternations in rainfall and temperature. Afghanistan, like many other semi-arid and arid regions, is prone to the impacts of a variable climate as water is a scarce resource in such regions due to the amounts of rainfall received annually and excessive evaporation due to high temperatures. Sustainable agricultural practices are crucial for Afghanistan, where many of the populace are engaged in farming as a source of livelihood. Understanding the influences of the modification of key climate variables, like precipitation and temperature, on the changing characteristics of drought is crucial to planning reliable adaptation and mitigation drought measures under a changing climate. This is especially important during crop growing seasons because droughts can be devastating when they coincide with the crop growing season. To this effect, we revealed the changing characteristics of droughts during the wheat, rice, and corn cropping seasons under a changing climate. It is anticipated that the methods applied here can be used elsewhere and be applied in the development of adaptation and mitigation measures under a changing climate.

Author Contributions

Conceptualization, S.S.; Data curation, I.Q.; Formal analysis, I.Q.; Investigation, I.Q.; Methodology, I.Q.; Project administration, Z.M.Y.; Software, K.A.; Supervision, N.A.-A., Z.M.Y., S.S. and X.W.; Visualization, A.S. and Z.M.Y.; Writing—original draft, M.S.S., K.A. and Z.M.Y.; Writing—review & editing, A.S. and Z.M.Y.

Funding

This research received no external funding.

Conflicts of Interest

The authors declare no conflict of interest.

References

  1. Salman, S.A.; Shahid, S.; Ismail, T.; Chung, E.-S.; Al-Abadi, A.M. Long-term trends in daily temperature extremes in Iraq. Atmos. Res. 2017. [Google Scholar] [CrossRef]
  2. Khan, N.; Shahid, S.; Juneng, L.; Ahmed, K.; Ismail, T.; Nawaz, N. Prediction of heat waves in Pakistan using quantile regression forests. Atmos. Res. 2019. [Google Scholar] [CrossRef]
  3. Ahmed, K.; Shahid, S.; Sachindra, D.A.; Nawaz, N.; Chung, E.S. Fidelity assessment of general circulation model simulated precipitation and temperature over Pakistan using a feature selection method. J. Hydrol. 2019, 573, 281–298. [Google Scholar] [CrossRef]
  4. Mishra, A.K.; Singh, V.P. Drought modeling—A review. J. Hydrol. 2011, 403, 157–175. [Google Scholar] [CrossRef]
  5. Ahmed, K.; Shahid, S.; Harun, S.b.; Wang, X.-j. Characterization of seasonal droughts in Balochistan Province, Pakistan. Stoch. Environ. Res. Risk Assess. 2016. [Google Scholar] [CrossRef]
  6. Shiru, M.S.; Shahid, S.; Chung, E.S.; Alias, N. Changing characteristics of meteorological droughts in Nigeria during 1901–2010. Atmos. Res. 2019. [Google Scholar] [CrossRef]
  7. Ahmed, K.; Shahid, S.; Ismail, T.; Nawaz, N.; Wang, X.J. Absolute homogeneity assessment of precipitation time series in an arid region of Pakistan. Atmosfera 2018. [Google Scholar] [CrossRef]
  8. Farooq, M.; Wahid, A.; Kobayashi, N.; Fujita, D.; Basra, S.M.A. Plant drought stress: Effects, mechanisms and management. In Sustainable Agriculture; Springer: Dordrecht, The Netherlands, 2009; ISBN 9789048126651. [Google Scholar]
  9. Samarah, N.H. Effects of drought stress on growth and yield of barley. Agron. Sustain. Dev. 2005. [Google Scholar] [CrossRef]
  10. Lake, P.S. Ecological effects of perturbation by drought in flowing waters. Freshw. Biol. 2003. [Google Scholar] [CrossRef]
  11. Trenberth, K.E.; Dai, A.; Van Der Schrier, G.; Jones, P.D.; Barichivich, J.; Briffa, K.R.; Sheffield, J. Global warming and changes in drought. Nat. Clim. Chang. 2014, 4, 17–22. [Google Scholar] [CrossRef]
  12. European Commission; European Commission—High Level Group on Science Education; European Commission—Science, Economy and Society. Science Education Now: A Renewed Pedagogy for the Future of Europe; Office for Official Publications of the European Communities: Luxembourg, 2007; ISBN 927905659X. [Google Scholar]
  13. Wilhite, D.A.; Svoboda, M.D.; Hayes, M.J. Understanding the complex impacts of drought: A key to enhancing drought mitigation and preparedness. Water Resour. Manag. 2007. [Google Scholar] [CrossRef]
  14. Wilhite, D.A.; Sivakumar, M.V.K.; Pulwarty, R. Managing drought risk in a changing climate: The role of national drought policy. Weather Clim. Extrem. 2014, 3, 4–13. [Google Scholar] [CrossRef] [Green Version]
  15. Thurman, J.N. Oklahoma in grip of new Dust Bowl. Christ. Sci. Monit. 1998. Available online: https://www.csmonitor.com/1998/0824/082498.us.us.3.html (accessed on 18 April 2019).
  16. Kalaugher, E.; Beukes, P.; Bornman, J.F.; Clark, A.; Campbell, D.I. Modelling farm-level adaptation of temperate, pasture-based dairy farms to climate change. Agric. Syst. 2017, 153, 53–68. [Google Scholar] [CrossRef]
  17. Dale, V.H.; Joyce, L.A.; Mcnulty, S.; Neilson, R.P.; Ayres, M.P.; Flannigan, M.D.; Hanson, P.J.; Irland, L.C.; Lugo, A.E.; Peterson, C.J.; et al. Climate change and forest disturbances. BioScience 2001. [Google Scholar] [CrossRef]
  18. Miyan, M.A. Droughts in asian least developed countries: Vulnerability and sustainability. Weather Clim. Extrem. 2015. [Google Scholar] [CrossRef]
  19. Rezaeianzadeh, M.; Stein, A.; Cox, J.P. Drought forecasting using Markov Chain model and artificial neural networks. Water Resour. Manag. 2016, 30, 2245–2259. [Google Scholar] [CrossRef]
  20. Reddy, C.S.; Saranya, K.R.L. Earth observation data for assessment of nationwide land cover and long-term deforestation in Afghanistan. Glob. Planet. Chang. 2017, 155, 155–164. [Google Scholar] [CrossRef]
  21. Atef, S.S.; Sadeqinazhad, F.; Farjaad, F.; Amatya, D.M. Water conflict management and cooperation between Afghanistan and Pakistan. J. Hydrol. 2019, 570, 875–892. [Google Scholar] [CrossRef]
  22. Muhammad, A.; Kumar Jha, S.; Rasmussen, P.F. Drought characterization for a snow-dominated region of Afghanistan. J. Hydrol. Eng. 2017. [Google Scholar] [CrossRef]
  23. Iqbal, M.W.; Donjadee, S.; Kwanyuen, B.; Liu, S.-y. Farmers’ perceptions of and adaptations to drought in Herat Province, Afghanistan. J. Mt. Sci. 2018. [Google Scholar] [CrossRef]
  24. Williams, D.B. Finding Water in the Heart of Darkness: Afghanistan’s Ongoing Water Challenges, 2009. Available online: https://www.earthmagazine.org/article/finding-water-heart-darkness-afghanistans-onoing-water-challenges (accessed on 24 March 2019).
  25. Sorg, A.; Huss, M.; Rohrer, M.; Stoffel, M. The days of plenty might soon be over in glacierized Central Asian catchments. Environ. Res. Lett. 2014, 9, 104018. [Google Scholar] [CrossRef]
  26. Ahmed, K.; Shahid, S.; Nawaz, N. Impacts of climate variability and change on seasonal drought characteristics of Pakistan. Atmos. Res. 2018, 214, 364–374. [Google Scholar] [CrossRef]
  27. Ta, Z. Analysis of the spatio-temporal patterns of dry and wet conditions in Central Asia. Atmopshere 2018, 1, 7. [Google Scholar] [CrossRef]
  28. Li, Z.; Chen, Y.N.; Li, W.H.; Deng, H.J.; Fang, G.H. Potential impacts of climate change on vegetation dynamics in Central Asia. J. Geophys. Res. 2015, 120, 12345–12356. [Google Scholar] [CrossRef]
  29. Zoljoodi, M.; Didevarasl, A. Evaluation of spatial-temporal variability of drought events in Iran using palmer drought severity index and its principal factors (through 1951–2005). Atmos. Clim. Sci. 2013. [Google Scholar] [CrossRef]
  30. Shroder, J.F. Natural Resources in Afghanistan: Geographic and Geologic Perspectives on Centuries of Conflict; Elsevier: San Diego, CA, USA, 2014; ISBN 0128005459. [Google Scholar]
  31. Thomas, V.; Ramzi, A.M. SRI contributions to rice production dealing with water management constraints in northeastern Afghanistan. Paddy Water Environ. 2011, 9, 101–109. [Google Scholar] [CrossRef]
  32. Vicente-Serrano, S.M.; Beguería, S.; López-Moreno, J.I. A multiscalar drought index sensitive to global warming: The standardized precipitation evapotranspiration index. J. Clim. 2010, 23, 1696–1718. [Google Scholar] [CrossRef]
  33. Becker, A.; Finger, P.; Meyer-Christoffer, A.; Rudolf, B.; Schamm, K.; Schneider, U.; Ziese, M. A description of the global land-surface precipitation data products of the global precipitation climatology centre with sample applications including centennial (trend) analysis from 1901–present. Earth Syst. Sci. Data 2013, 5, 71–99. [Google Scholar] [CrossRef]
  34. Harris, I.; Jones, P.D.; Osborn, T.J.; Lister, D.H. Updated high-resolution grids of monthly climatic observations—The CRU TS3.10 Dataset. Int. J. Clim. 2014, 34, 623–642. [Google Scholar] [CrossRef]
  35. Haritashya, U.K.; Bishop, M.P.; Shroder, J.F.; Bush, A.B.G.; Bulley, H.N.N. Space-based assessment of glacier fluctuations in the Wakhan Pamir, Afghanistan. Clim. Chang. 2009, 94, 5–18. [Google Scholar] [CrossRef]
  36. Palka, E.J. Afghanistan: A Regional Geography; United States Military Academy, West Point Department of Geography & Environmental Engineering: West Point, NY, USA, 2001. [Google Scholar]
  37. Aich, V.; Akhundzadah, N.; Knuerr, A.; Khoshbeen, A.; Hattermann, F.; Paeth, H.; Scanlon, A.; Paton, E. Climate change in Afghanistan deduced from reanalysis and coordinated regional climate downscaling experiment (CORDEX)—South Asia simulations. Climate 2017, 5, 38. [Google Scholar] [CrossRef]
  38. Shiru, M.S.; Shahid, S.; Chung, E.-S.; Alias, N.; Scherer, L. A MCDM-based framework for selection of general circulation models and projection of spatio-temporal rainfall changes: A case study of Nigeria. Atmos. Res. 2019. [Google Scholar] [CrossRef]
  39. Kishore, P.; Jyothi, S.; Basha, G.; Rao, S.V.B.; Rajeevan, M.; Velicogna, I.; Sutterley, T.C. Precipitation climatology over India: Validation with observations and reanalysis datasets and spatial trends. Clim. Dyn. 2016, 46, 541–556. [Google Scholar] [CrossRef]
  40. Schneider, U.; Becker, A.; Finger, P.; Meyer-Christoffer, A.; Ziese, M.; Rudolf, B. GPCC’s new land surface precipitation climatology based on quality-controlled in situ data and its role in quantifying the global water cycle. Theor. Appl. Clim. 2014, 115, 15–40. [Google Scholar] [CrossRef]
  41. Spinoni, J.; Naumann, G.; Carrao, H.; Barbosa, P.; Vogt, J. World drought frequency, duration, and severity for 1951–2010. Int. J. Clim. 2014, 34, 2792–2804. [Google Scholar] [CrossRef]
  42. Tuklimat, N.N.A.; Harun, S.; Shahid, S. Comparison of different methods in estimating potential évapotranspiration at Muda Irrigation Scheme of Malaysia. J. Agric. Rural Dev. Trop. Subtrop. 2012, 113, 77–85. [Google Scholar]
  43. Stagge, J.H.; Tallaksen, L.M.; Xu, C.-Y.; Van Lanen, H.A.J. Standardized precipitation-evapotranspiration index (SPEI): Sensitivity to potential evapotranspiration model and parameters. In Hydrology in a Changing World: Environmental and Human Dimensions, Proceedings of the Flow Regimes from International Experimental and Network Data (FRIEND)-Water 2014, Montpellier, France, 7–10 October 2014; International Association of Hydrological Sciences (IAHS) Publisher: Oxfordshire, UK, 2014. [Google Scholar]
  44. Beguería, S.; Vicente-Serrano, S.M.; Reig, F.; Latorre, B. Standardized precipitation evapotranspiration index (SPEI) revisited: Parameter fitting, evapotranspiration models, tools, datasets and drought monitoring. Int. J. Climatol. 2014, 34, 3001–3023. [Google Scholar] [CrossRef]
  45. Condon, L.E.; Gangopadhyay, S.; Pruitt, T. Climate change and non-stationary flood risk for the Upper Truckee River Basin. Hydrol. Earth Syst. Sci. Discuss. 2014, 11, 5077–5114. [Google Scholar] [CrossRef]
  46. Mohsenipour, M.; Shahid, S.; Chung, E.-s.; Wang, X.-j. Changing pattern of droughts during cropping seasons of Bangladesh. Water Resour. Manag. 2018. [Google Scholar] [CrossRef]
  47. Sen, P.K. Estimates of the regression coefficient based on Kendall’s tau. J. Am. Stat. Assoc. 1968, 63, 1379–1389. [Google Scholar] [CrossRef]
  48. Mann, H.B. Nonparametric tests against trend. Econometrica 1945. [Google Scholar] [CrossRef]
  49. Kendall, M.G. Rank Correlation Methods; Griffin: Oxford, UK, 1948. [Google Scholar]
  50. World Meteorological Organization (WMO). Analyzing Long Time Series of Hydrological Data with Respect to Climate Variability; WCAP-3, WMO/TD-No: 224; World Meteorological Organization: Geneva, Switzerland, 1988; pp. 1–12. [Google Scholar]
  51. Ahmed, K.; Shahid, S.; Othman, R.; Harun, S.B.; Wang, X.-j. Evaluation of the performance of gridded precipitation products over Balochistan Province, Pakistan. Desalin. Water Treat. 2017. [Google Scholar] [CrossRef]
  52. Khan, N.; Shahid, S.; Ismail, T.; Wang, X.-J. Spatial distribution of unidirectional trends in temperature and temperature extremes in Pakistan. Theor. Appl. Climatol. 2018. [Google Scholar] [CrossRef]
  53. Hamed, K.H.; Rao, A.R. A modified Mann-Kendall trend test for autocorrelated data. J. Hydrol. 1998, 204, 182–196. [Google Scholar] [CrossRef]
  54. Yue, S.; Pilon, P.; Cavadias, G. Power of the Mann–Kendall and Spearman’s rho tests for detecting monotonic trends in hydrological series. J. Hydrol. 2002, 259, 254–271. [Google Scholar] [CrossRef]
  55. Yue, S.; Wang, C. The Mann-Kendall test modified by effective sample size to detect trend in serially correlated hydrological series. Water Resour. Manag. 2004, 18, 201–218. [Google Scholar] [CrossRef]
  56. Koutsoyiannis, D.; Montanari, A. Statistical analysis of hydroclimatic time series: Uncertainty and insights. Water Resour. Res. 2007, 43, W05429. [Google Scholar] [CrossRef]
  57. Nashwan, M.S.; Shahid, S.; Abd-Rahim, N. Unidirectional trends in annual and seasonal climate and extremes in Egypt. Theor. Appl. Climatol. 2018. [CrossRef]
  58. Salman, S.A.; Shahid, S.; Ismail, T.; Ahmed, K.; Wang, X.-J. Selection of climate models for projection of spatiotemporal changes in temperature of Iraq with uncertainties. Atmos. Res. 2018, 213, 509–522. [Google Scholar] [CrossRef]
  59. Nashwan, M.S.; Shahid, S.; Wang, X.-J. Uncertainty in estimated trends using gridded rainfall data: A case study of Bangladesh. Water 2019, 11, 349. [Google Scholar] [CrossRef]
  60. Khan, N.; Pour, S.H.; Shahid, S.; Ismail, T.; Ahmed, K.; Chung, E.-S.; Nawaz, N.; Wang, X. Spatial distribution of secular trends in rainfall indices of peninsular Malaysia in the presence of long-term persistence. Meteorol. Appl. 2019. [Google Scholar] [CrossRef]
  61. Pour, H.S.; Abd-Wahab, A.K.; Shahid, S.; Wang, X. Spatial pattern of the unidirectional trends in thermal bioclimatic indicators in Iran. Sustainability 2019, 11, 2287. [Google Scholar] [CrossRef]
  62. Hamed, K.H. Trend detection in hydrologic data: The Mann-Kendall trend test under the scaling hypothesis. J. Hydrol. 2008, 349, 350–363. [Google Scholar] [CrossRef]
  63. Koutsoyiannis, D.; Koutsoyiannis, D. Climate change, the Hurst phenomenon, and hydrological statistics. Hydrol. Sci. J. 2003, 48. [Google Scholar] [CrossRef]
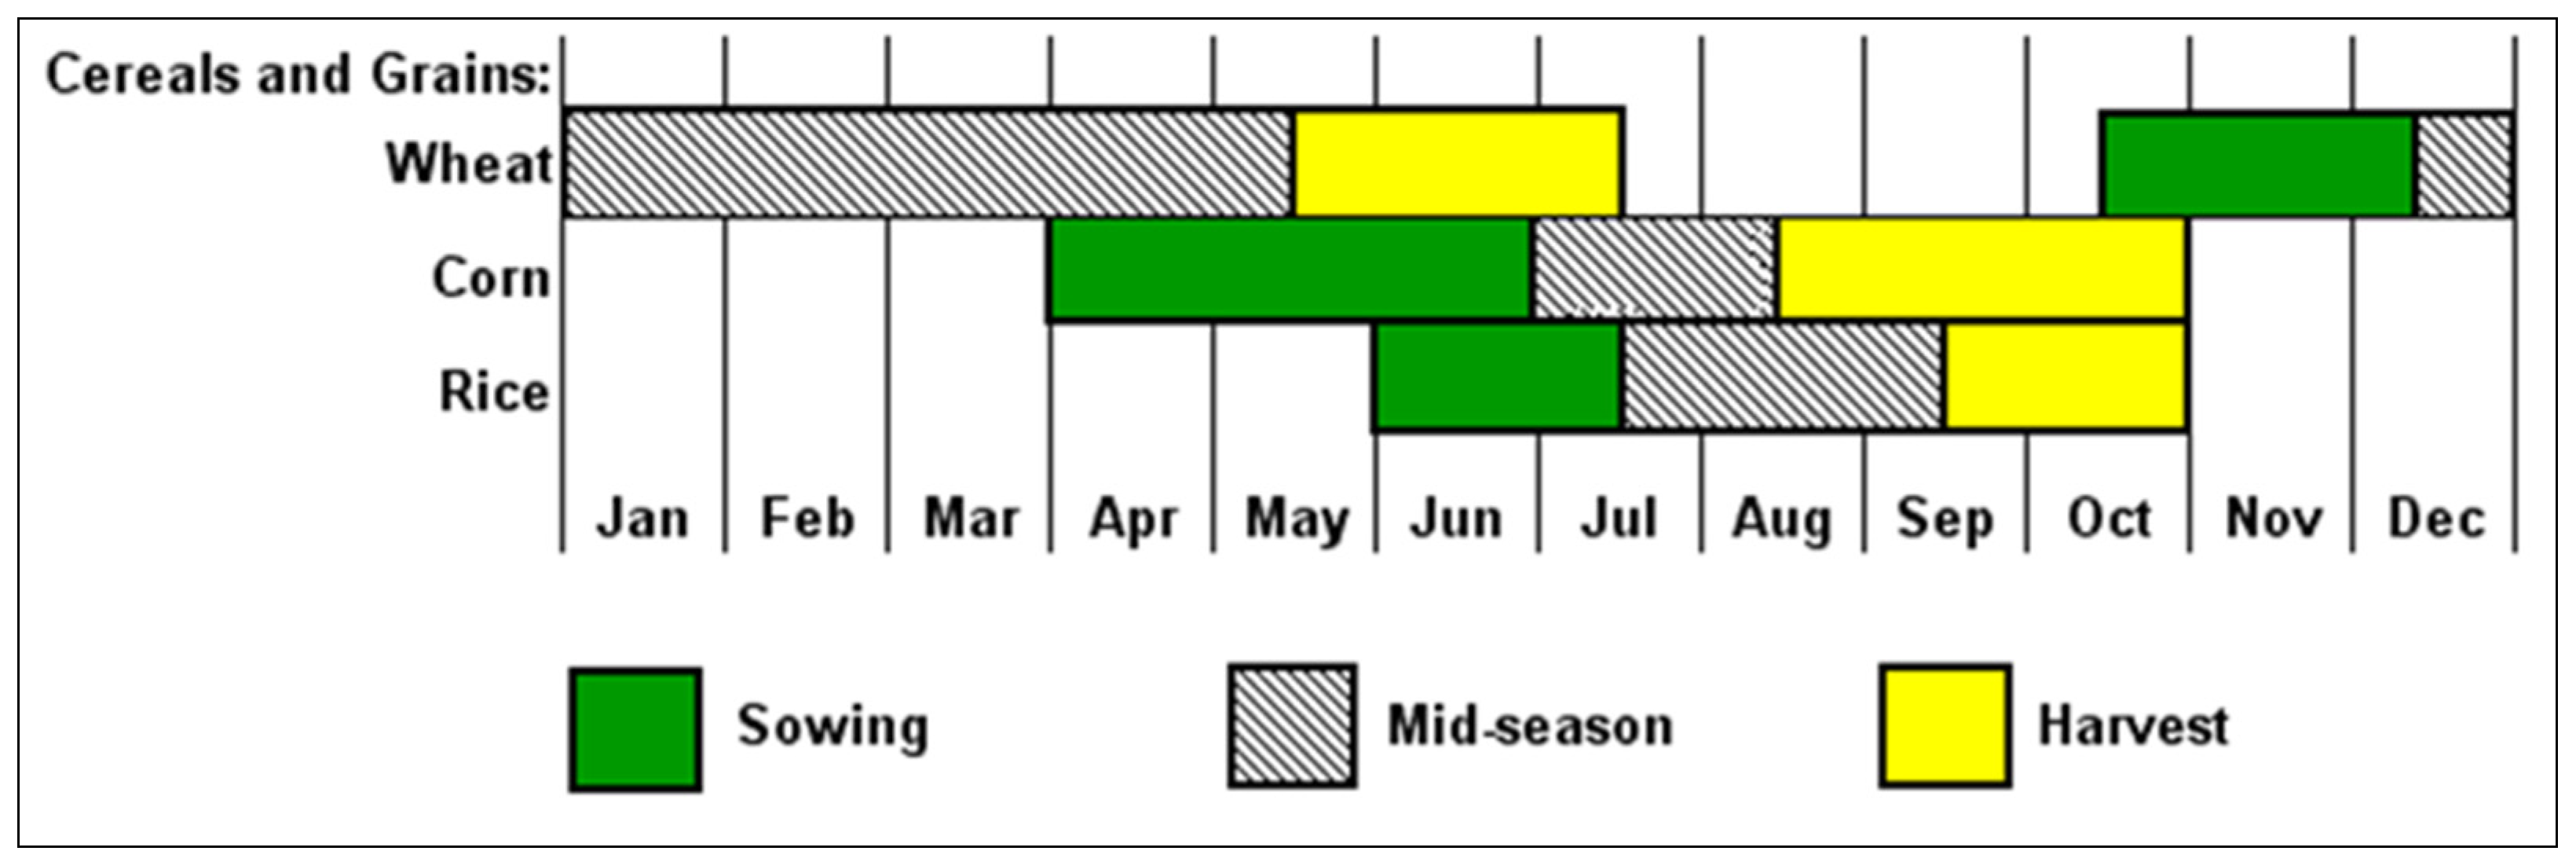
Figure 1. Map of Afghanistan showing elevation and country borders.
Water 11 01096 g001
Figure 2. (a) Geographical distribution of mean annual rainfall (mm/year) and (b) annual mean of daily maximum temperature (°C) in Afghanistan.
Water 11 01096 g002
Figure 3. Crop calendars of selected crops in Afghanistan.
Water 11 01096 g003
Figure 4. Trends in (a) precipitation, (b) mean temperature, and (c) SPEI during the wheat-growing period in Afghanistan during 1901–2010.
Water 11 01096 g004
Figure 5. The number of grid points at which significant changes in (a) precipitation, (b) mean temperature, and (c) SPEI during wheat-growing season for different 50-year periods for 1901–2010.
Water 11 01096 g005aWater 11 01096 g005b
Figure 6. Box-plots showing the return periods of (a) moderate, (b) severe, and (c) extreme meteorological droughts during wheat-growing season observed for different 50-year windows over 1901–2010.
Water 11 01096 g006aWater 11 01096 g006b
Figure 7. Trends in (a) precipitation, (b) mean temperature, and (c) SPEI during rice-growing period in Afghanistan during 1901–2010.
Water 11 01096 g007aWater 11 01096 g007b
Figure 8. The number of grid points at which significant changes in (a) precipitation, (b) mean temperature, and (c) SPEI during rice-growing season for different 50-year windows during 1901–2010.
Water 11 01096 g008
Figure 9. Box-plots showing the return period of (a) moderate, (b) severe, and (c) extreme droughts during rice-growing season for different 50-year windows during 1901–2010.
Water 11 01096 g009
Figure 10. Geographical distributions of the changes in (a) precipitation, (b) mean temperature, and (c) SPEI during corn-growing season in Afghanistan during 1901–2010.
Water 11 01096 g010
Figure 11. The number of grid points at which significant changes in (a) precipitation, (b) mean temperature, and (c) SPEI during corn-growing season for different 50-year windows over 1901–2010.
Water 11 01096 g011aWater 11 01096 g011b
Figure 12. The box-plots showing the return periods of (a) moderate, (b) severe, and (c) extreme corn droughts estimated for different 50-year windows over the period 1901–2010.
Water 11 01096 g012
Table 1. The time spans used for standardized precipitation evapotranspiration index (SPEI) calculation for droughts estimation during different cropping seasons.
CropSeasonPeriod (Months)
WheatOctober–April7
RiceJune–September4
CornApril–July5

