Article

Clogging of Infiltration Basin and Its Impact on Suspended Particles Transport in Unconfined Sand Aquifer: Insights from a Laboratory Study

1
College of Hydrology and Water Resource, Hohai University, Nanjing 210098, China
2
State Key Laboratory of Hydrology-Water Resources and Hydraulic Engineering, Hohai University, Nanjing 210098, China
3
Department of Hydrology and Water Resources, NHRI, Nanjing 210029, China
*
Author to whom correspondence should be addressed.
Water 2019, 11(5), 1083; https://doi.org/10.3390/w11051083
Submission received: 28 April 2019 / Revised: 16 May 2019 / Accepted: 20 May 2019 / Published: 24 May 2019
(This article belongs to the Section Wastewater Treatment and Reuse)

Abstract

:
A laboratory study was undertaken to investigate the physical clogging of a sand medium by injecting suspended particles (SP), with diameters ranging from 0.03 to 63.41 μm, into an infiltration basin, which was installed in a sand tank under the condition of constant head. The hydraulic conductivity (K) of the saturated porous medium was found to have decreased by 27% because of re-arrangement over the seven days of self-filtration. A clogging layer was observed on the infiltration basin bottom, probably due to straining over the stormwater infiltration stage. Particle-size analyses also indicate that retention of bigger SP led to faster straining of smaller SP, despite the small fraction of bigger SP. The clogging layer weakened the hydraulic connection between the water level in the basin and the water table of the unconfined aquifer until nearly no water could infiltrate into the aquifer. The deposition of finer SP that entered into the aquifer are governed by the hydrodynamic forces. These finer SP caused non-uniform permeability reduction of the porous medium, with an estimated 35% of permeability reduction occurring beneath the infiltration basin. However, the reduction appears to be reversible, as the fine SP deposited on the pore surfaces of the porous medium can be released or detached by the continuous horizontal hydraulic gradient. Extended tailing of the outlet breakthrough curve (BTC) also strongly supported the detachment of SP. This study focused on the effects of particles’ polydispersity and hydrodynamic forces on the hydraulic characteristics of the porous medium.

1. Introduction

Stormwater has been increasingly integrated in the planning and development of sustainable urban water management, especially in the context of water scarcity and aquifer overexploitation [1]. Filtration and infiltration techniques, such as groundwater injection wells [2], infiltration basins [3] and vadose zone infiltration wells [4], can store stormwater in an aquifer, thus helping to restore the pre-development hydrology [5]. Surface infiltration basin is preferred, because clogging on the surface can be better controlled [6]. However, clogging of the filtration systems is a main limiting factor that causes a decrease in the infiltration rate and permeability due to physical, chemical and biological processes [7]. In these infiltration systems, physical clogging is the dominant type, with a high level of suspended particles (SP) present in stormwater [8].
Physical clogging is caused either by particle accumulation on the surface of filter medium, or by deposition inside a deep porous medium. In the first case, a clogging layer is formed and stops the suspended particles. In the second case, the SP move through the porous bed in which the particles are retained. The mechanisms involved in clogging are diverse and complex, corresponding to the SP size. Brownian diffusion is the most prevalent in the deposition of colloids (<1 μm), but for large particles (>10 μm), gravity, inertial and effects of hydrodynamics are dominant. For mean particles (1–10 μm), all forces and mechanisms can make a contribution to the deposition of particles [9]. Given the diverse range of particle sizes in stormwater, which varies depending on the type of catchment, level of pre-treatment etc. [10], it is necessary to understand the clogging process in order to ultimately improve the filtration performance of a porous medium.
Parameters that influence the SP deposition in a porous medium include size and shape of the filter material [11,12], size and concentration of the SP [13,14], size distributions of SP and filter material [15,16], as well as the hydrodynamic effects [9,17]. The transport of SP in a filtration system is frequently described by the colloid filtration theory (CFT), which treats SP like solutes, with a kinetic retention coefficient to account for the deposition [18,19]. But colloid filtration theory sometimes fails in the attempt to predict the fate of SP in a porous medium, as SP interact with the porous medium in a different way compared to nanoparticles (solutes). The deposited SP changes both the pore structure and the morphology (tortuosity, surface area) of the porous medium [20]. The clogging phenomena is accompanied by visible head losses. Various empirical models have been developed to describe the clogging process by establishing the relationships between a specific deposit and other variables (e.g., head loss and hydraulic conductivity), and these models can be used as tools to depict the clogging process [21]. But previous studies indicate that a specific deposit of particles in a porous medium is not sufficient to characterize clogging. These studies reveal that deposit morphology has a major effect on the degree of clogging [15,22,23].
Owing to their large size and density (relative to solutes), the retention of SP is more likely to be affected by perturbances to groundwater hydrodynamic conditions such as variations in pressure or flow velocities. Hydrodynamic forces can induce the release or detachment of already retained SP, especially under repulsion (unfavorable) attachment conditions [24]. Furthermore, research also suggests that straining processes are prevalent in stormwater filtration applications. Straining occurs when the pore throats is too small for SP to pass, and is determined by the ratio of the diameter (dp) of the suspended particles to that (dg) of porous medium grain [25]. The threshold value of straining (dp/dg) may depend on the experiment conditions, as various thresholds have been reported, ranging from 0.005 to 0.1 [13,26,27,28]. These findings suggest that the understanding of physical clogging is limited, especially in the context of stormwater infiltration.
Furthermore, current clogging studies in stormwater systems are limited to a vertical sand column. Few attempts have been undertaken to understand the clogging process of polydisperse SP in a sand tank. The hydraulic gradient in a sand tank is horizontal or lateral, which is more approximate to natural groundwater flow. Moreover, it is unclear whether the findings from a 1-D sand column can be transferred to clogging studies in a 2-D sand tank. It is necessary to understand the nature of clogging specific to highly polydisperse SP in stormwater with a horizontal hydraulic gradient.
This paper is intended as an investigation of the physical clogging process in a 2-D sand tank under a controlled hydraulic gradient environment. Semi-synthetic stormwater containing polydisperse SP was studied. The purposes of this paper included: (1) exploring the physical clogging on the infiltration basin; and (2) estimating how retained SP interact with the porous medium under a condition of mainly horizontal hydraulic gradient. To achieve these goals, effluent concentration curves (BTC) were measured, and temporal changes in the particle-size distribution (PSD) of infiltration basin were analyzed. In addition to above measurements, pressure variations allowing permeability reduction of the porous medium were assessed both spatially and temporally by Kozeny-Carman equation. Based on these observations, relevant mechanisms that control the transport and deposition of the polydisperse particles are discussed.

2. Materials and Methods

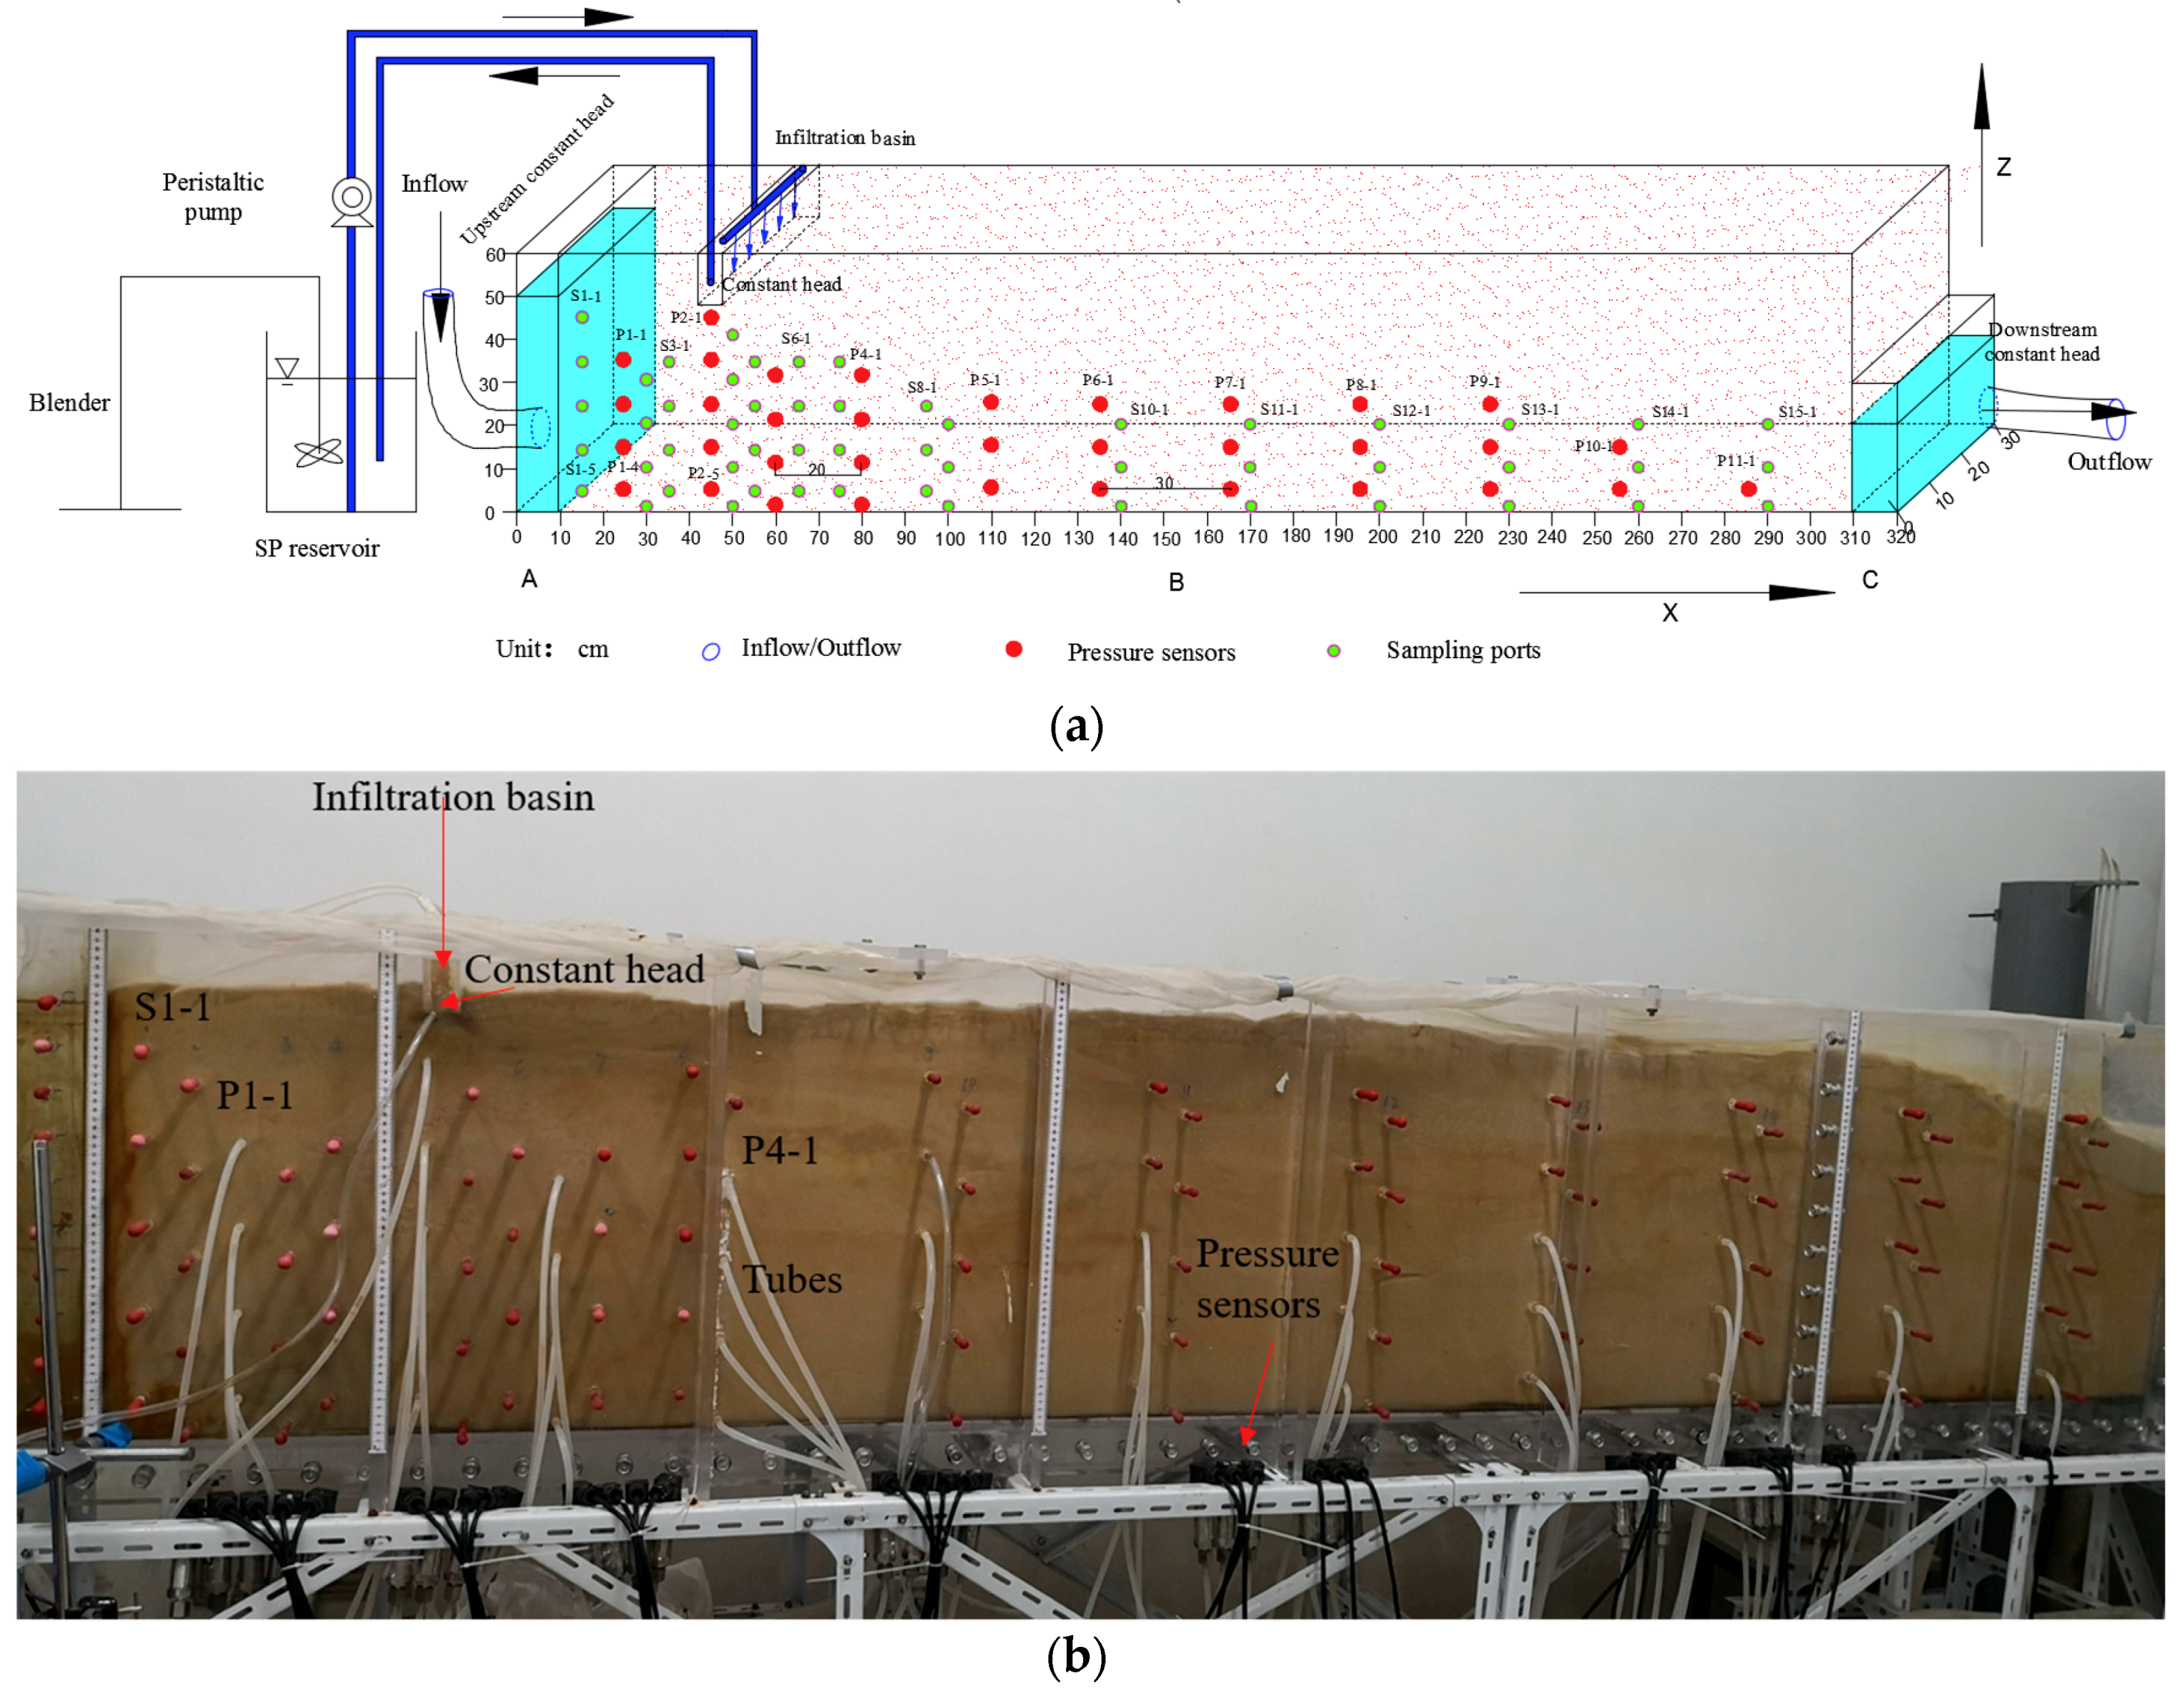
2.1. Design of the Sand Tank

In order to explore the impacts of SP’s polydispersity on the performance of infiltration basin, a tank was constructed from 1.5-cm thick Perspex with the dimensions of 3.2 m long by 0.3 m wide by 0.6 m high. Stainless steel screens were then installed to divide the tank into three segments, as shown in Figure 1. The main (middle) segment was 3 m long and filled with medium sand to approximate a 55-cm thick sand aquifer. The first and the third segments (at each side) without sand were equipped with a water supply to serve as the constant head (Dirichlet) boundary conditions of the aquifer. The first segment (upper end) kept a 50-cm constant head throughout the course of the experiment, and the third segment (lower end) kept a 20-cm constant head. The sand tank held its shape without any visible change. Sand was carefully filled into the tank to build a homogeneous isotropic sand medium, and also slowly poured to avoid trapping air bubbles. During the whole operation, water level was maintained above the sand surface that was evenly compacted by shovel. An infiltration basin of dimensions 3 cm (L) × 30 cm (W) × 10 cm (H) was constructed 45 cm downstream from the upstream constant head. The water in the basin was maintained at a constant level (52 cm). The bottom of the basin was buried 6 cm deep in the sand tank, and the top of the infiltration basin was connected to a peristaltic pump to act as a stormwater injection.
The detection system consisted of a turbidimeter and a computer. Fifteen arrays (S15-1, in the direction of length X) of sampling ports (green solid points in Figure 1a) were installed on the inwall of the main segment, and some of the sampling ports were installed on the back of the segment. Furthermore, the perforated 0.3 cm diameter tubes were also installed on the inwall of the main segment to monitor the variation of the water levels. Eleven arrays (P11-1, in the direction of length) of pressure sensors (red solid points in Figure 1a) were connected to the tubes to monitor pressure. Screen with the chosen opening of 0.1 mm, was fixed inside the tank to prevent the movement of sand to the sampling ports, but allow the transmission of water and SP. Pressure sensors were attached to the end of these tubes (saturated with water, Figure 1b) and connected to a data-logging system in a computer, which can record the sensors data every minute. This experiment focuses on X (horizontal) and Z (vertical) directions. The space interval between horizontal pressure sensors is 30 cm, but refined to 20 cm around infiltration basin. The position of sensors and ports can be read from the scale. The sampling ports and pressure sensors are named according to their positions. The pressure sensors (red solid dot) are numbered as Px-x column by column from left to right, and the sampling ports (green solid dot) are numbered as Sx-x. For instance, the first pressure sensor of the second column is referred to as P2-1, and the fifth sampling port of the first column is referred as S1-5.

2.2. Properties of Suspended Particles (SP) and Porous Medium

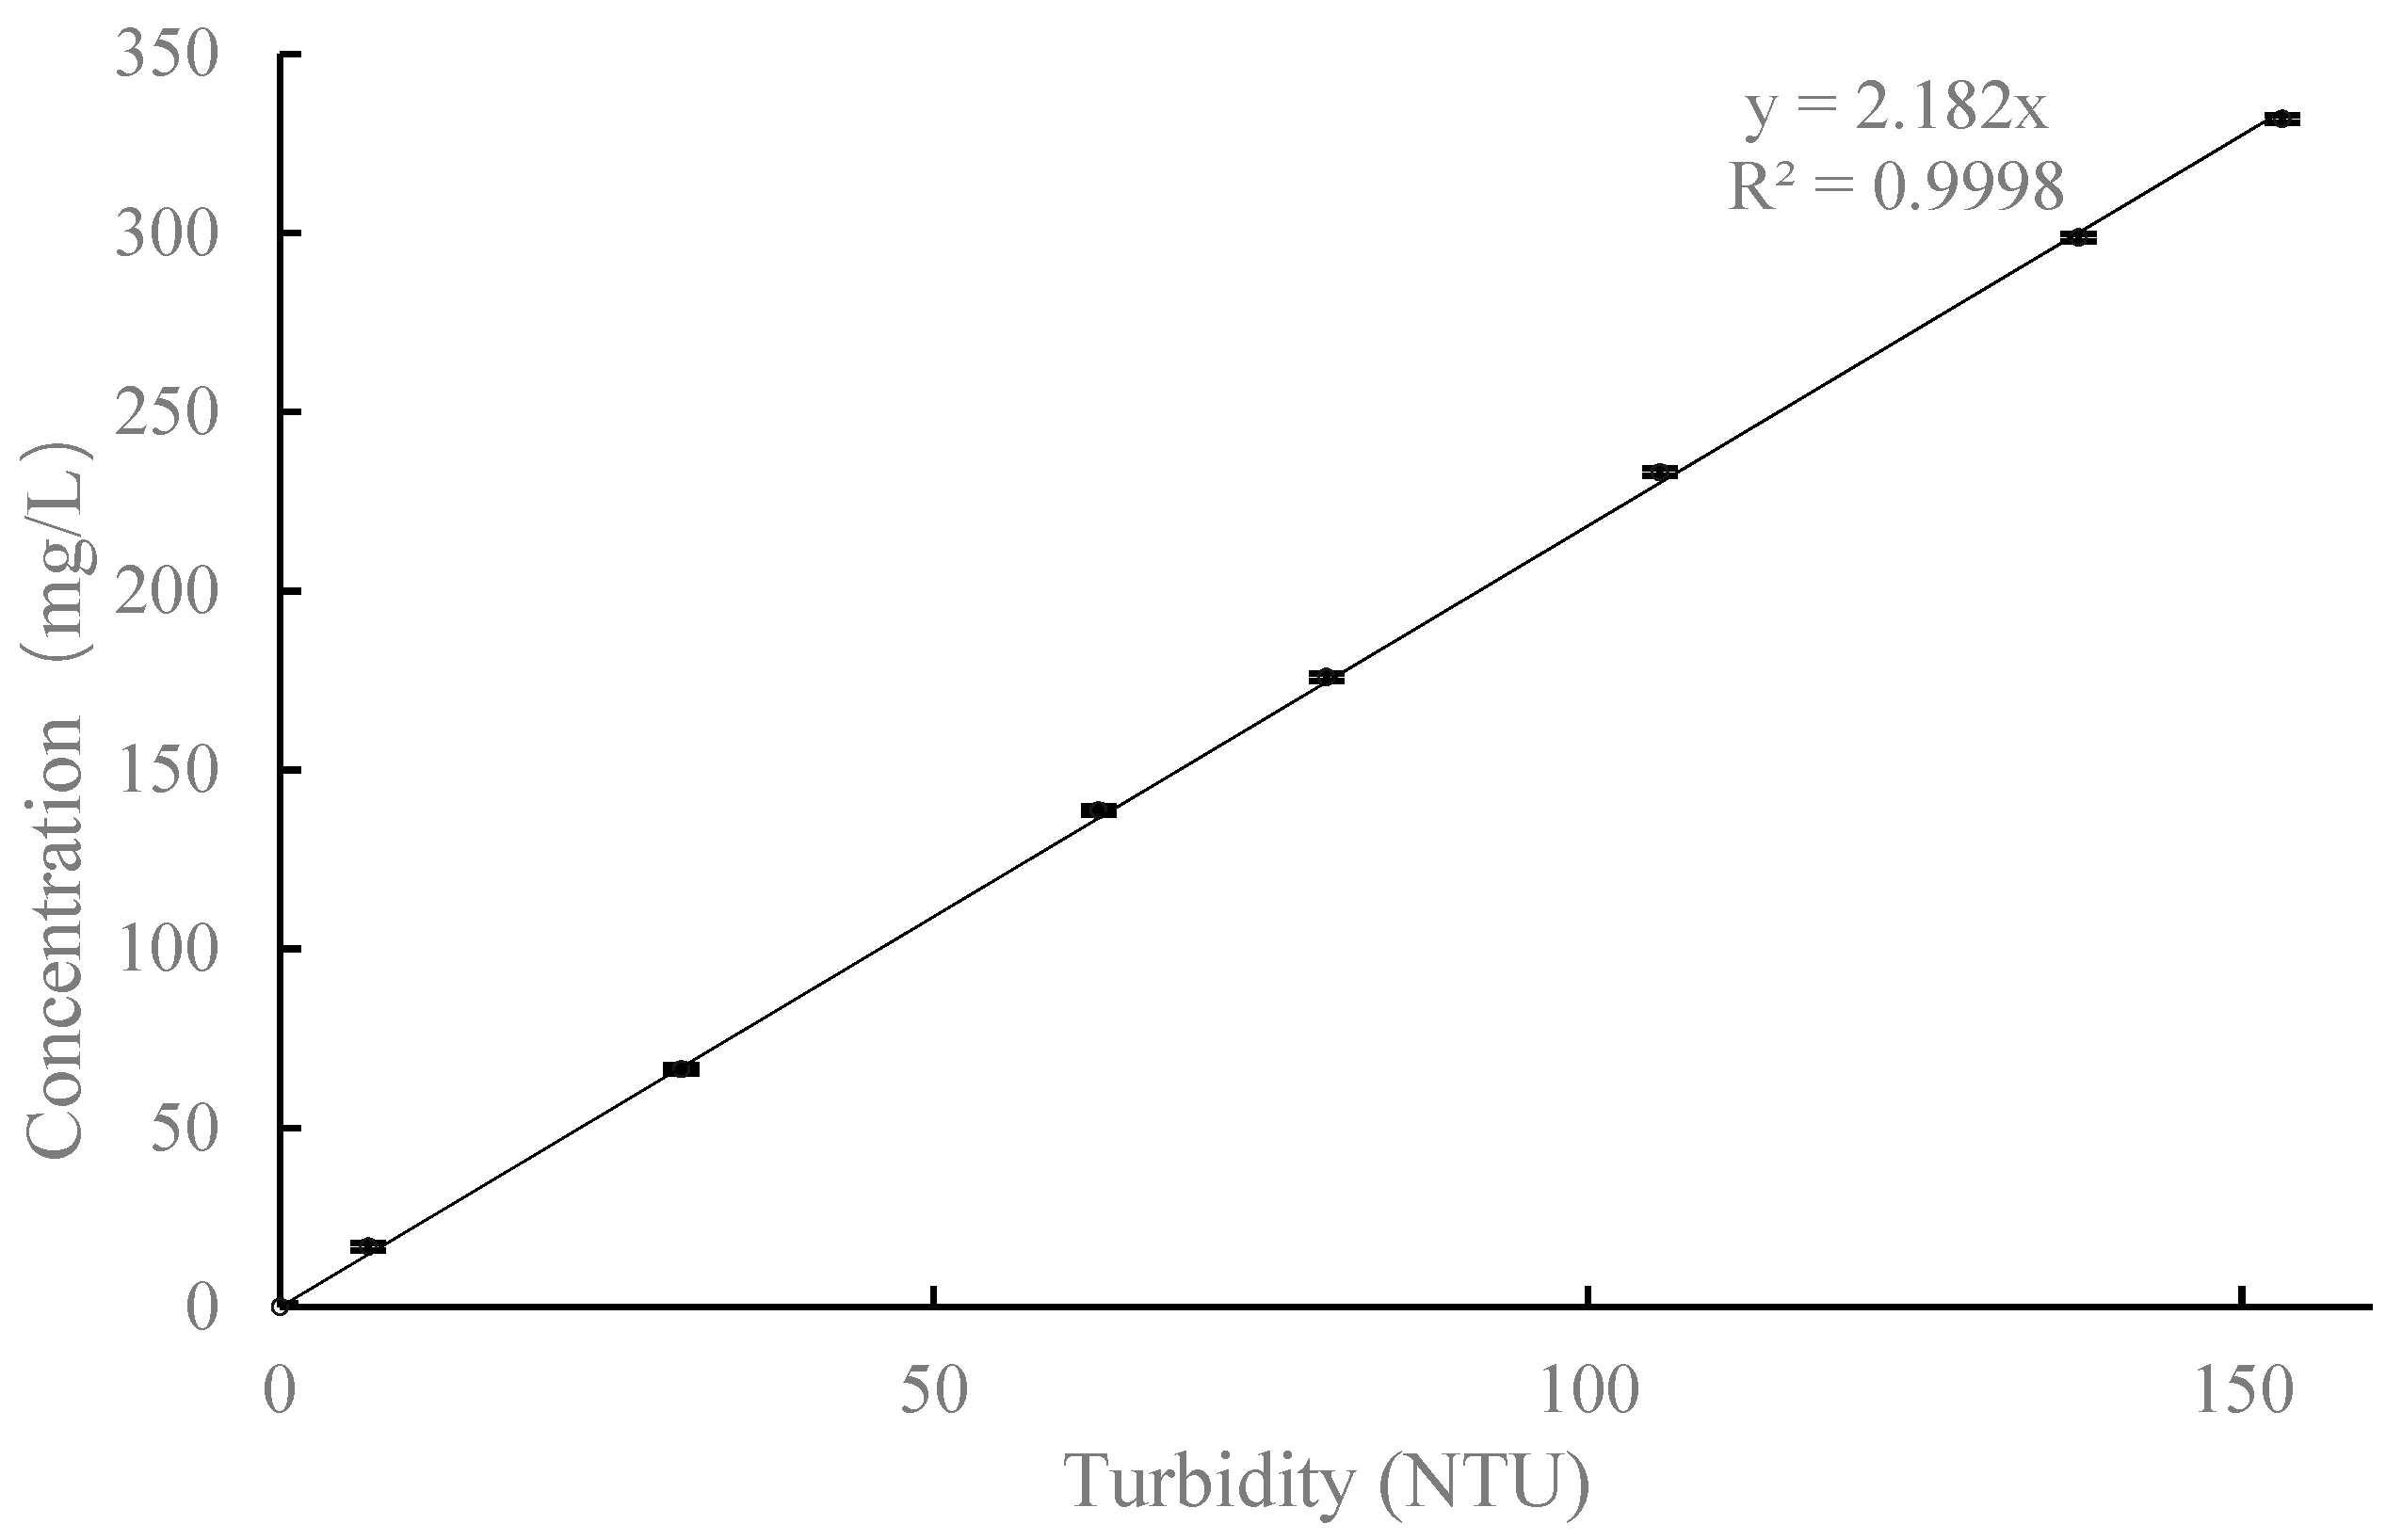
2.2.1. Suspended Particles

As semi-synthetic stormwater ensures a better consistency of concentration and composition than natural stormwater [12], the injected SP were collected by scraping the sediment layer from areas around the inlet of the Yangtze river, and then the material was passed through a 100 μm sieve. The SP ranges in sizes from 0.03 μm to 63.41 μm, with a median size of 11.28 μm. The diameter of SP in most filtration systems is of the order of 10 μm [29,30]. Thus, the SP size range in this study covers the diameters of migrating particles in practice, and provides realistic representation of composition in stormwater. The bulk density and specific density of the SP were measured to be 1.31g/cm3 and 2.51 g/cm3.

2.2.2. Porous Medium

Cheap silica sand was used as a porous medium. Mechanical sieving of silica sand was performed to obtain sand fractions between 0.3- and 0.6-mm. Particle size distribution (PSD) analysis was performed by a laser diffraction method. The sandy material has a particle size d10 of 0.302mm, d50 of 0.451 mm, and d60 of 0.473 mm. The uniformity coefficient (d60/d10) of the sand is 1.57. The specific surface area was measured to be 0.878 cm−1. The PSD analysis suggested that the porous medium is homogeneous. The bulk density was obtained by weighing a known volume of the sand and its value was 1.68 g/cm3. The specific density was obtained by adding distilled water to the known mass material until a fixed volume was reached. The average value of specific density determined after five tests was 2.56 g/cm3. The porosity of the porous medium was calculated as follows:
Porosity = 1 − Bulk density/Specific density
The porosity of the porous medium was 0.34 (±0.01). The infiltration basin was fed either by a tap water reservoir or by the reservoir containing the SP at the desired concentration of 30 mg/L, and the SP was cleaned by deionized water (pH of 6.7 ± 0.2).
Upstream and downstream boundaries were set as constant-head boundaries to create a one-dimensional steady-state flow. The hydraulic gradient was maintained at 0.1 and an initial flow velocity of 3.24 m/d was calculated. This velocity is small enough to ensure Darcy’s law to be valid.
For the homogeneous unconfined aquifer with steady-state flow driven by head differences of both sides, hydraulic conductivities (K) of saturated porous media were measured in a sand tank based on the direct application of the Dupuit discharge formula [31]. For constant heads, the discharge rates through the porous medium were measured.
K = 2 Q o u t L W ( H 1 2 H 2 2 )
where Qout is the discharge rate through the cross section of porous medium at the outlet (L3.T−1), L is the length of porous medium (L), W is the width of porous medium (L), and H1 and H2 (L) are constant heads at both segments, respectively. A period of several days is required for the outlet discharge to become steady. Temperature was measured round 23 °C (±0.5 °C) continuously over the entire duration of the experiment. The mean K of 5 measurements was presented in the results, as well as the 95% confidence interval. The measurements of K neglected the effect of capillary fringe, just as in a previous study [32].

2.3. Experimental Procedures

The porous medium was only given shovel-compaction during construction. The aquifer was subjected to self-filtration by water for a week immediately after construction to achieve hydraulic compaction. Self-filtration is the migration and rearrangement of particles within the porous medium, which has profound effects on the accurate measurement of hydraulic conductivity (K). Permeability tests were carried out during the self-filtration stage to measure the initial K of the porous medium in the tank. Then, clean water was introduced into infiltration basin until the water level became steady and turbidity in the outlet returned to baseline levels. Finally, clean water was replaced by stormwater according to the experimental plan without perturbing the infiltration rate. The clean water served dual purposes: to wash off the dust in the sand tank to minimize background value effects on turbidity measurements; and to act as a benchmark for a reliable comparison with later stormwater infiltration. A motorized stirrer was used in the suspension reservoir to keep the suspension stable and uniform. A peristaltic pump was used to pump the influent suspension into the infiltration basin. The excess influent coming out of the recharge basin was diverted back to the suspension in the influent tank.
The water level of 52 cm (3 cm above the bottom of the infiltration basin) was chosen to provide an initial infiltration rate equal to 417 mL/min. The water level was kept constant throughout the duration of the experiment. The choice of a 52-cm water level is suitable for this experiment, because a lower water level (50 cm) allows gases to accumulate under the basin bottom where they form a vapor barrier to downward flow. On the other hand, a higher water level (55 cm) will form a groundwater mound that interferes with the filtration processes [6]. The ratio of basin length (3 cm) to filter grain diameter (d50 = 0.451mm) was larger than 50, which is recognized as ideal for filtration studies [33]. The infiltration rate, decreasing with time as a result of particle accumulation on the basin surface, was measured and recorded at the outlet at regular time intervals. The carefully collected samples were measured by a turbidimeter. The turbidimeter recorded the turbidity values.
The turbidity of tap water was set to be zero. Stormwater recharge experiment was carried out only when turbidity of several randomly selected sampling ports as well as the outlet turbidity all approached zero, and as such the effects of background value were excluded. The experiment was run until the 95% of stormwater was back into the SP reservoir, which was identified as the clogged state of the infiltration basin. A total of 600 L (containing 18 g SP) was introduced into the infiltration basin, but no more than 0.1 g of SP was taken as samples, so the effects of sampling on the deposition of SP were ignored. A sampling probe with a screen of 0.1 mm was used to carefully take samples. The amount of SP in outlet is too small to be accurately measured for PSD analysis, and samples were taken at the bottom of the infiltration basin, where a clogging layer formed (see the Results section).
Water samples were collected to investigate the distributions of the aqueous SP. The clean water infiltration stage lasted about 8 h (from 48 to 56 h), and the stormwater infiltration stage lasted about 43 h (from 56 to 99 h, see the Results section). But the measurements continued even when the stormwater infiltration stage ended, and the last measurement was conducted when the time was 124 h. The turbidimeter determines the turbidity level by measuring the amount of light scattered at 90 by the suspended particles. The measurements are converted and displayed in Nephelometric Turbidity Units (NTU). The measurement range of the turbidimeter is from 0.1 to 200 NTU. The particle concentrations of the samples were determined with the help of correlations between SP concentrations in water and NTUs (Figure 2).

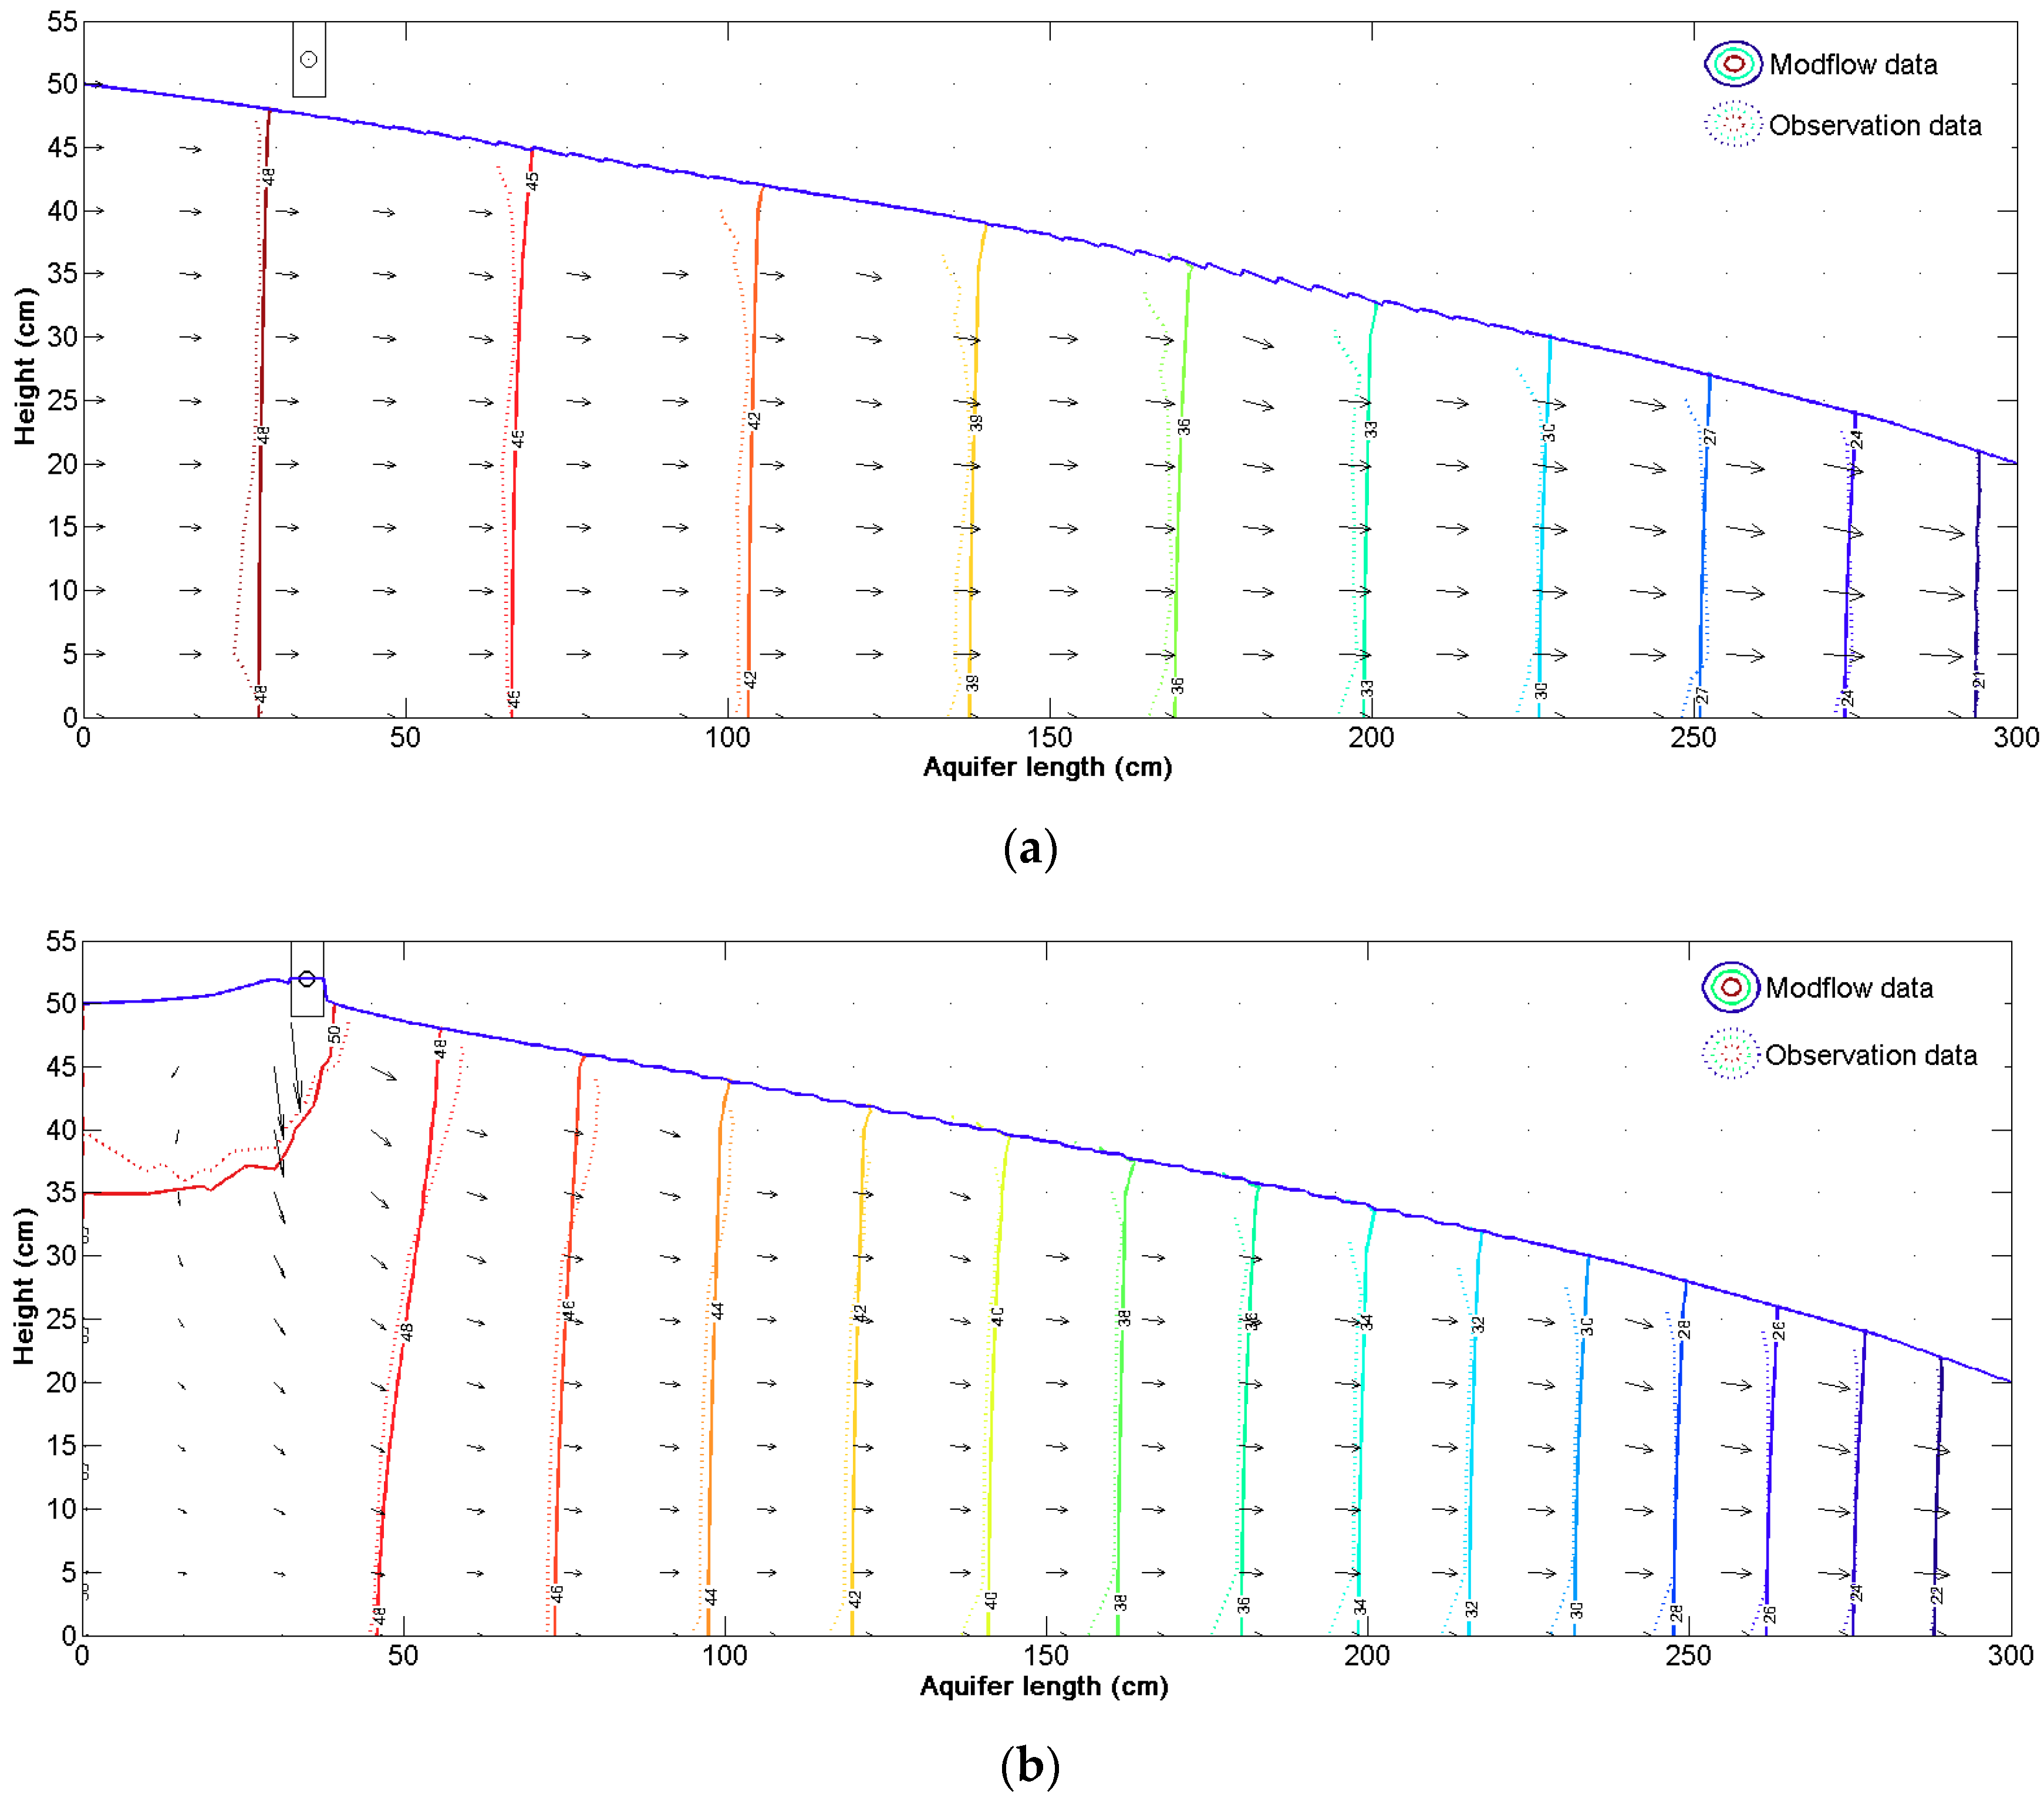
2.4. Mathematical Modeling

Unlike sand column experiments, the sand tank cannot be dismantled into sections [15]. The amount of retained particles cannot be obtained, which is important in estimating the permeability reduction of the porous medium. Empirical and semi-empirical models are alternatives to estimate the permeability reduction.
Permeability is directly related to porosity, and porosity changes due to particle accumulation. Therefore, the porosity ( ) at a given location (x, z) can be related to the volume of deposited SP, and the relationship is given by the following Equation [34]:
( x , z , t ) = 0 σ ( x , z , t ) ( 1 d )
where σ (L3.L−3) is the specific deposit with the definition of the volume of deposited particles per unit of porous medium volume, and 0 is the initial porosity of the clean porous medium, and d is the deposit porosity that is determined by the morphology of the deposited SP. The deposit porosity is expressed as follows [35]:
d = 1 ρ d ρ p = 1 [ ρ w ρ p + ( 1 ρ w ρ p ) 1 a b N 1 ] .
where ρ d (M.L−3) is the average deposit density, ρ w (M.L−3) is the water density, N is the number of particles in a deposit site, and a and b are empirical coefficients, taken as being equal to 1 and 1.35, respectively. The values of parameters a and b are recommended by Alem et al. [15].
The head loss increases with the accumulation of SP retention and an empirical relationship is given by [27]:
H ( x , z , t ) H 0 = 1 1 σ ( x , z , t ) 0 .
where H0 (L) is the head loss for a clean porous medium, H (L) is the head loss for a gradually clogging medium.
Deposited SP also changes the specific surface area and tortuosity of the porous bed. The specific surface area of the dirty porous bed is associated with that of the clean porous bed by [15]:
S = 1 1 [ ( 1 0 ) S 0 + ( 1 d ) σ ρ p S p ]
where S0 (L−1) and Sp (L−1) are the specific surface area of the clean bed and that of deposited particles, and S0 = 6 × (1 − 0 )/ φ dg, φ = 1 for a sphere, and S (L−1) is the specific surface area of the dirty porous bed.
Tortuosity is related to porosity as follows [36]:
T = F
where T is the tortuosity, and F = m is the formation factor given empirically as a function of porosity, with m = 1.3 for a sandy medium.
The reduction in permeability can be rearranged into Kozeny-Carman equation and expressed as:
K K 0 = 3 0 3 ( 1 0 ) 2 ( 1 ) 2 S 0 2 S 2 ( T 0 T ) 2 .
where K0 and K (L.T−1) are the initial and reduced hydraulic conductivities, respectively.
As mentioned in Section 2, the water levels of all the pressure sensors, the porosity, specific surface area, and densities can be directly measured, the expression of specific deposit σ is obtained through Equation (5); this expression, combined with Equation (4), is substituted into Equation (3), then the porosity at a given location (x, z) is obtained. The specific surface area S and the tortuosity T can be obtained by Equations (6) and (7) respectively. Finally, the permeability reduction is estimated by substituting the variables ( ,   S ,   T ) into Equation (8).

3. Results and Discussion

3.1. Self-Filtration of Porous Medium

Figure 3 shows the variations of outlet discharge throughout the entire duration of the experiment and evolution of the hydraulic conductivities over the self-filtration stage (without water pumped into the infiltration basin). The discharge rate was initially measured at 341 mL/min, then decreased by approximately 27% to 249 mL/min, but stabilized at the end of the self-filtration stage. This trend can be caused by the packing of the sand medium and the uncertainty related to discharge rate measurement techniques. The decline may be attributed to relatively loose packing of the porous medium, suggesting an initial re-arrangement of porous medium due to disturbance provided by the groundwater flow [8]. The variation in the evolution of discharge rate during the self-filtration stage was in accord with the ranges reported in the previous study e.g., Reddi et al. [30] that up to 60% decline in permeability that occurred because of self-filtration was observed for sandy filters under the condition of constant head infiltration. The flow rates used in the experiment govern the hydraulic conductivity measurements.
The discharge rate sharply increased to 667 mL/min within minutes and then stabilized, as the clean water was pumped into the infiltration basin. This implies that the aquifer is transmissive enough to accommodate lateral flow of the infiltrated water away from the infiltration basin. The discharge rate remained relatively stable even when stormwater was introduced. Only after a certain volume of stormwater was passed through the porous medium did the discharge rate begin to drop significantly (Figure 3). The discharge rate finally stabilized around 225 mL/min, and the rate was less than that of the self-filtration stage (249 mL/min), suggesting an adverse effect caused on the aquifer transmissivity.
The evolution of average hydraulic conductivity (K) exhibited a similar trend to that of the outlet discharge rate (Figure 3). The initial K, with a mean value of 45.6 m/d, decreased substantially over time, reaching a steady median of 32.4 m/d after 48 h of self-filtration. However, the rate of decline decreased generally over time, appearing to reach an asymptote value (Figure 3). A decrease in permeability is accompanied by a decreasing discharge rate. A horizontal hydraulic gradient caused by the head difference can restructure the internal structure of a porous medium, even if the porous medium is packed by shovel. The reduction in permeability due to self-filtration in the experiment should be considered for determining hydraulic conductivity of sandy material in a laboratory scale.
The simulations of groundwater flow were also performed by MODFLOW models. Figure 4 shows the simulated water levels (cm) and groundwater flow vectors in vertical cross section when the outlet discharge is stable. The groundwater flow is a one-dimensional steady-state flow, as demonstrated by MODFLOW simulation. The results also show a good agreement between the observed data and the simulated data, thus, indicating that the data from the pressure sensors in this study are acceptable and the distribution of the pressure sensors can properly characterize the groundwater flow.

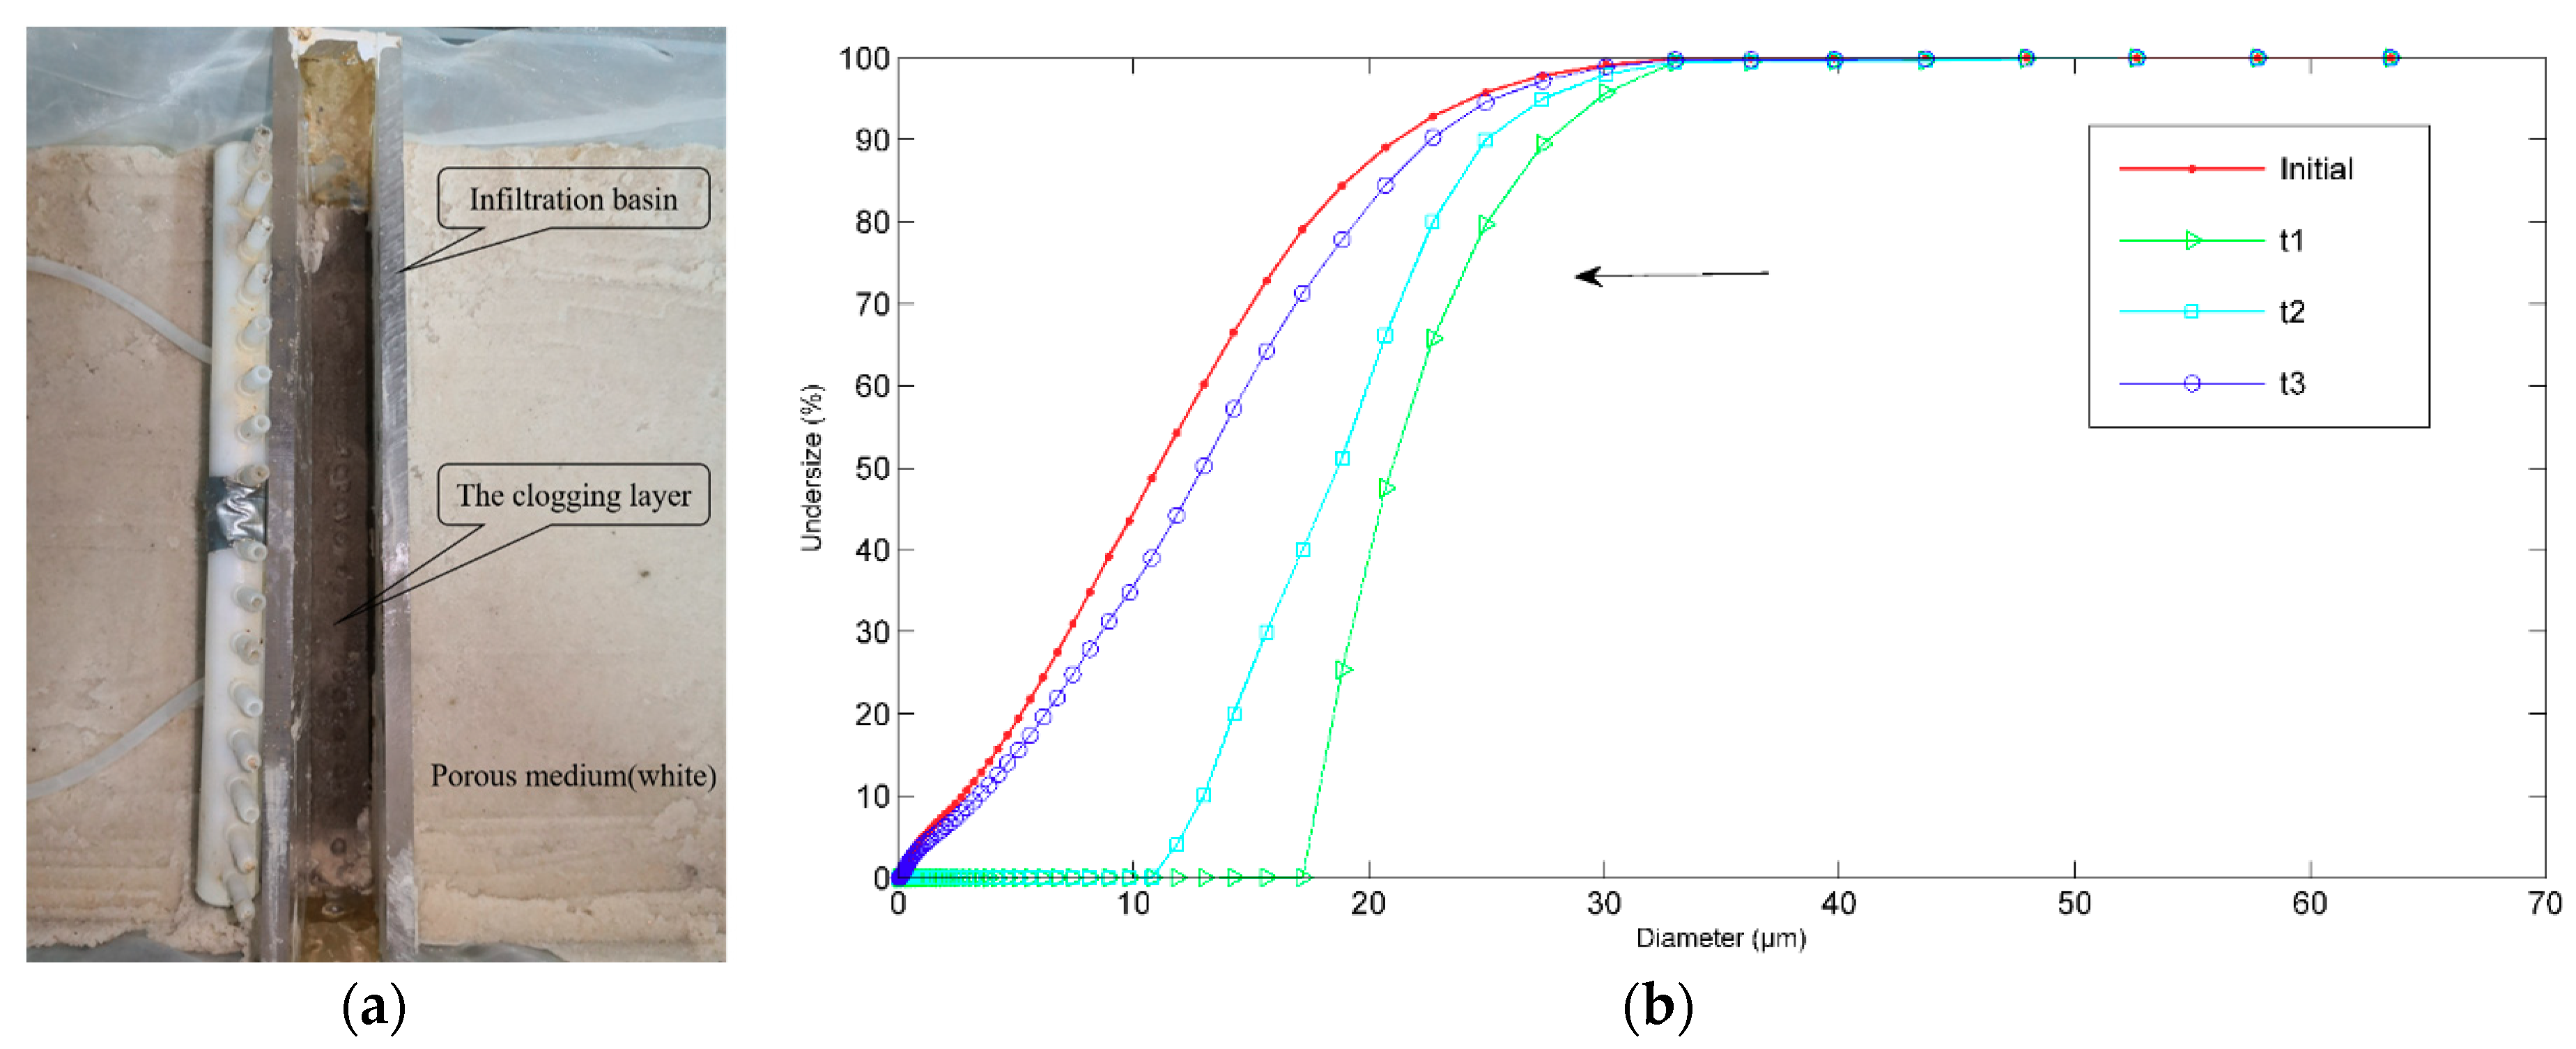
3.2. Formation of the Clogging Layer due to Straining

An analysis of the particle size distribution (PSD) of the SP within the infiltration basin was undertaken. SP (suspended particles) samples for particle-size analysis were taken carefully during the stormwater infiltration stage. Sampling times t1, t2 and t3 correspond to 79 h, 88 h and 97 h, respectively. The choice of t1 (79 h) to take the first samples was due to a visible dark clogging layer formed at this time. Three times of samplings were to minimize effects to the clogging layer.
Figure 5 presents the results of particle-size analysis, with a red line representing initial SP spectrum. The observed values for median particle size d50 at t1, t2 and t3 were 21.03 μm, 18.71 μm and 12.97 μm. Compared to the stormwater inflow, the median particle size diminished close to the initial particle size, which had d50 of 11.28 μm. The results show finer particles (dp < 18.39 μm) were the first to be transported into the aquifer. Then, coarser particles gradually accumulated on the basin bottom. This corresponds to the ratios of the size of SP to median grain diameter greater than 0.04, indicating that the main process responsible for the accumulation of these coarser particles was straining. This ratio is slightly less than the value of 0.06 reported by Alem et al. [13], but much greater than the threshold of 0.008 proposed by Xu et al. [28]. Furthermore, the accumulation of bigger SP in the filter appears to enhance the removal efficiency of incoming relatively smaller SP, because the PSD curve of the sample approaches the particle-size distribution initially injected. This can be explained by the fact that retention of bigger SP constricts pore spaces in the filter sufficiently to retain the smaller SP, resulting in an increase in the straining capacity and straining rates of the smaller SP. This similar behavior was also reported by Xu et al. [37]. Finally, as straining improved, almost all SP were retained on the basin bottom and the clogging layer was formed.
It can be concluded that accumulation of bigger SP on the basin bottom acts as capture sites and leads to faster straining of smaller SP, despite the small fraction of big SP (less than 8% of SP with size bigger than 18 μm) in the stormwater. Only a small amount of deposited SP can cause system failure. Given this, some pre-treatment or post-treatment procedures should be taken. For instance, scraping off the clogging layer can restore up to 68% of the initial infiltration capacity [38].

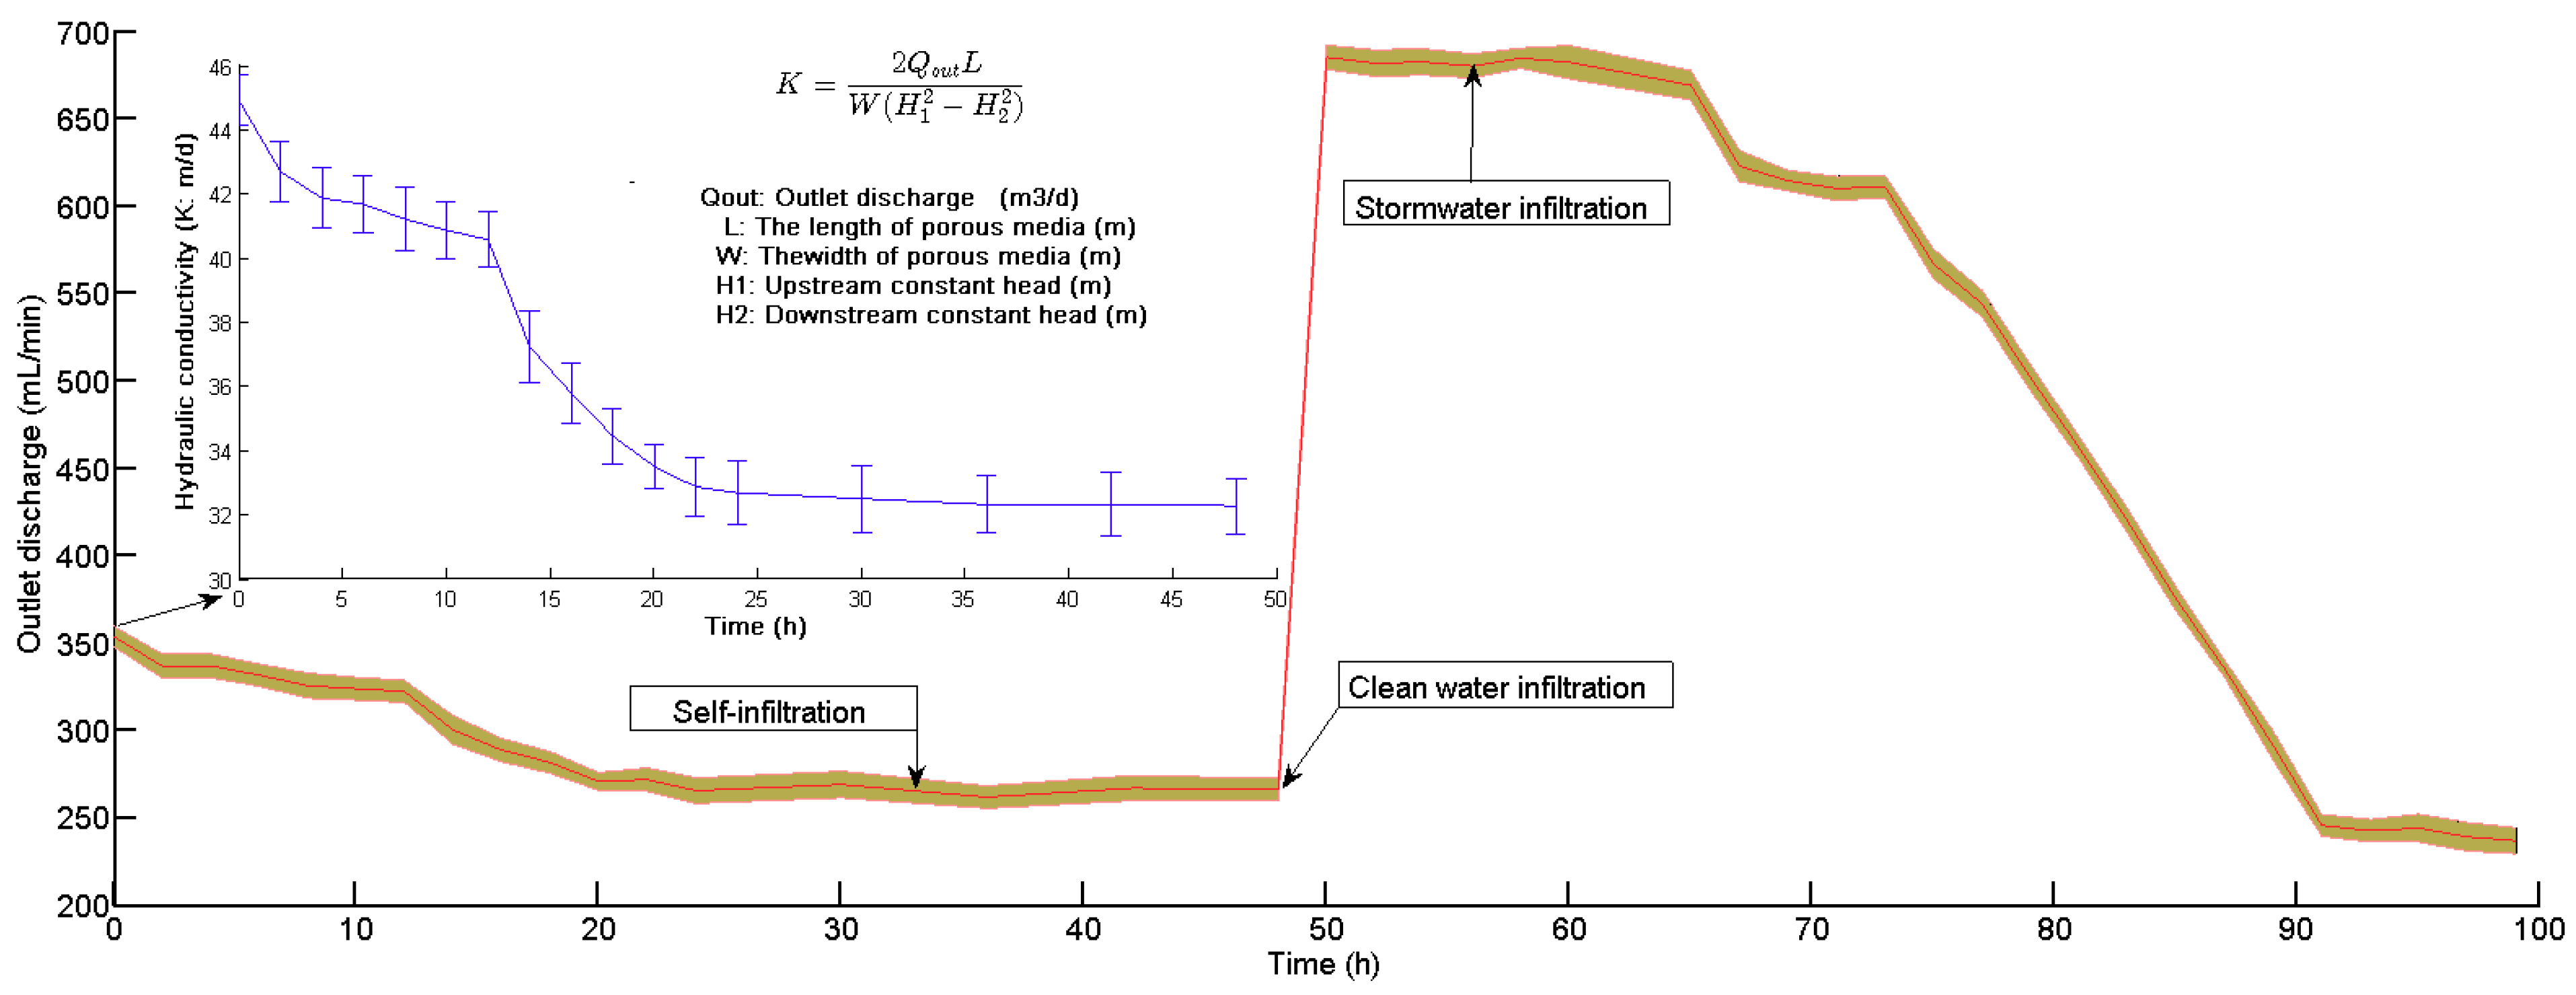
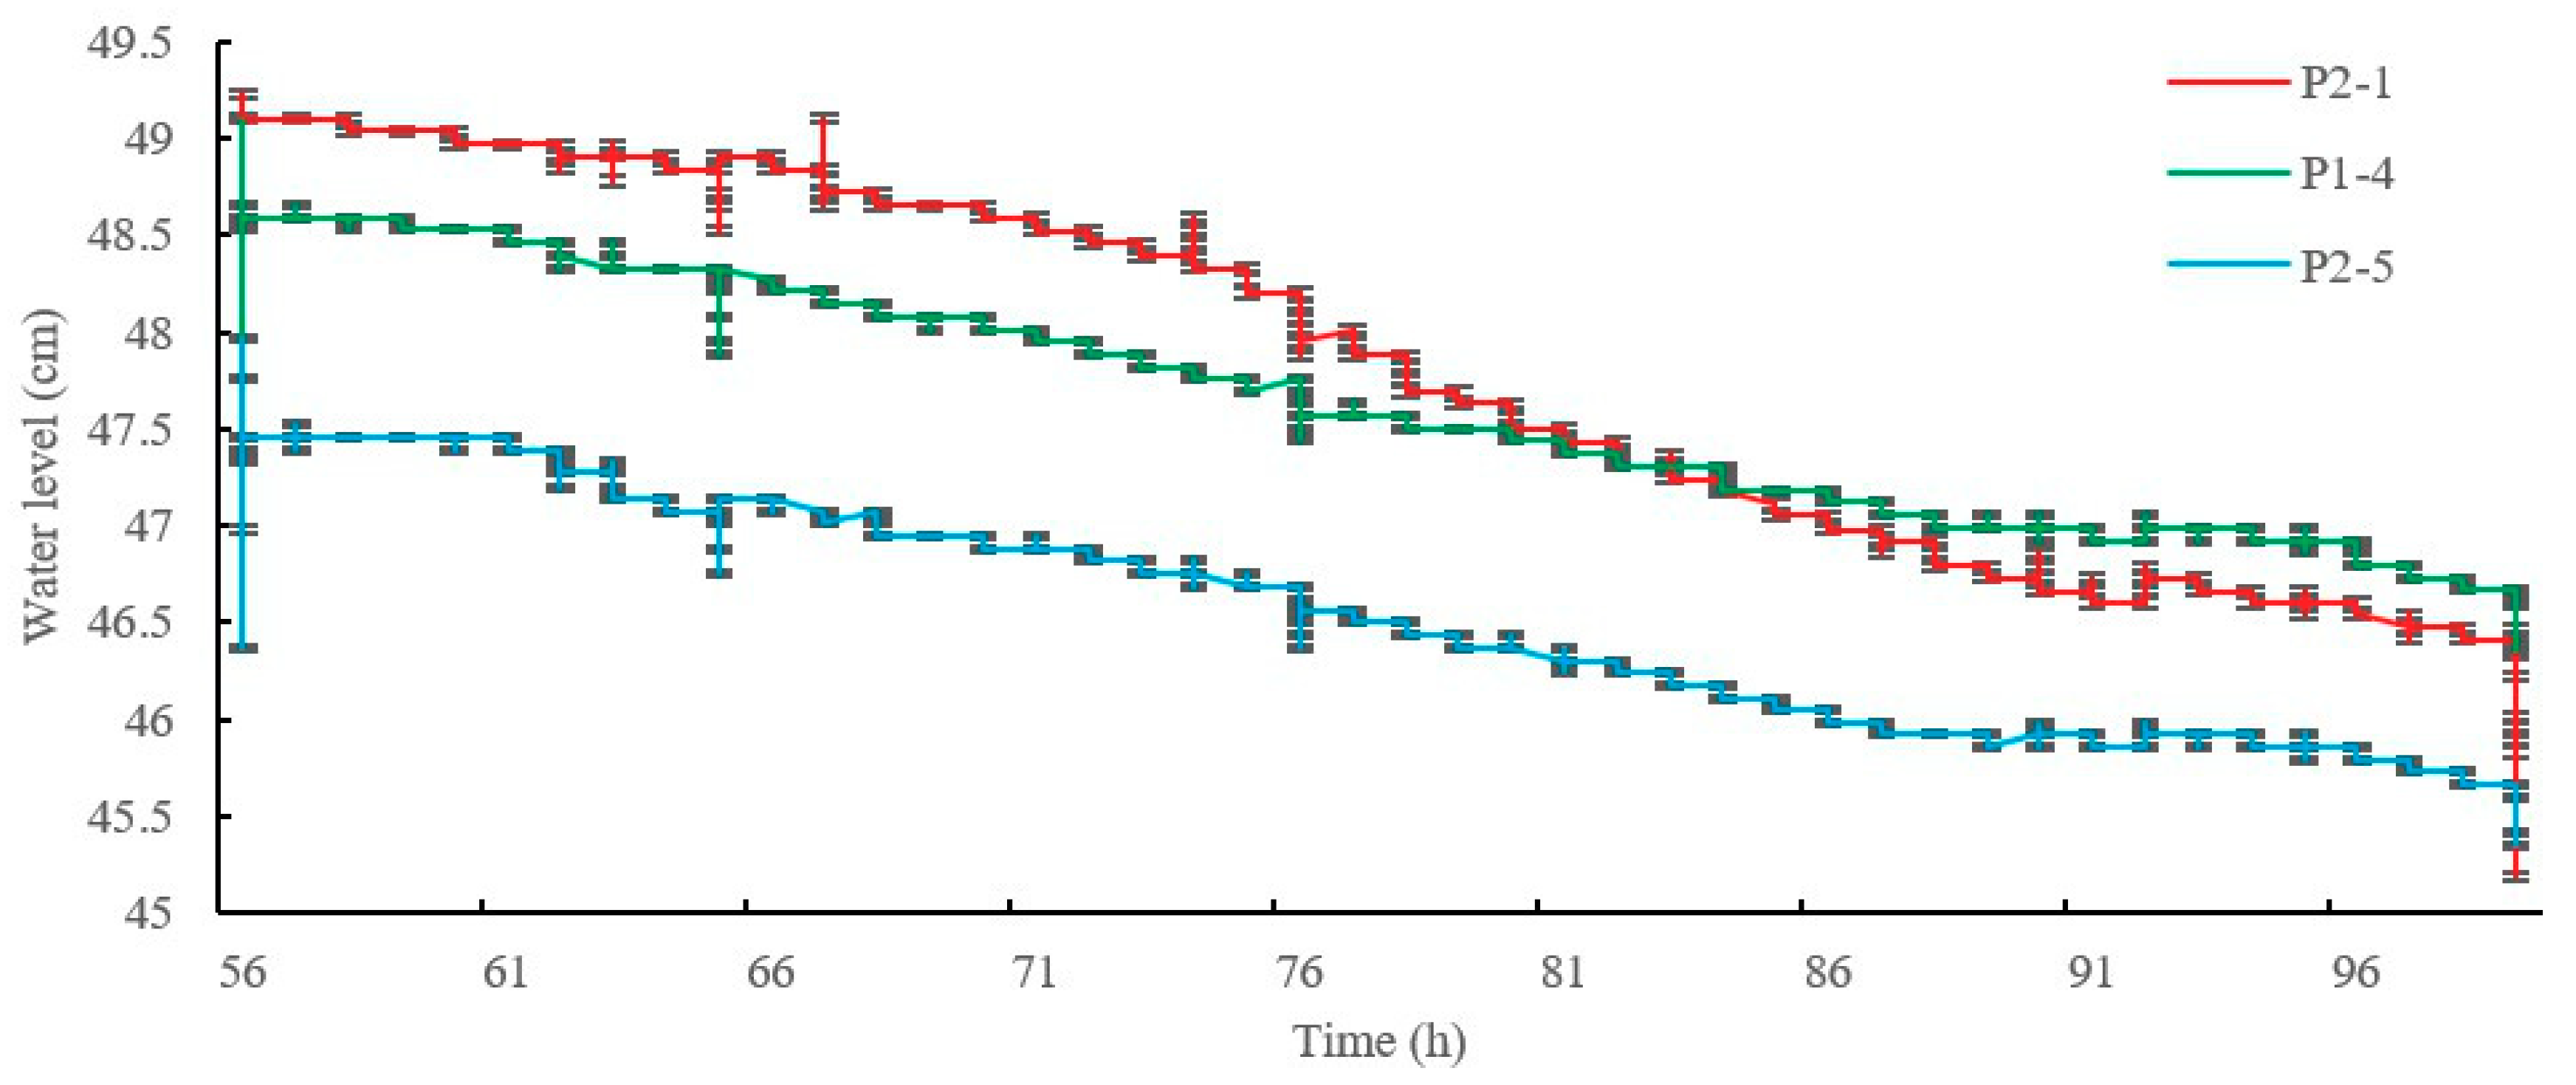
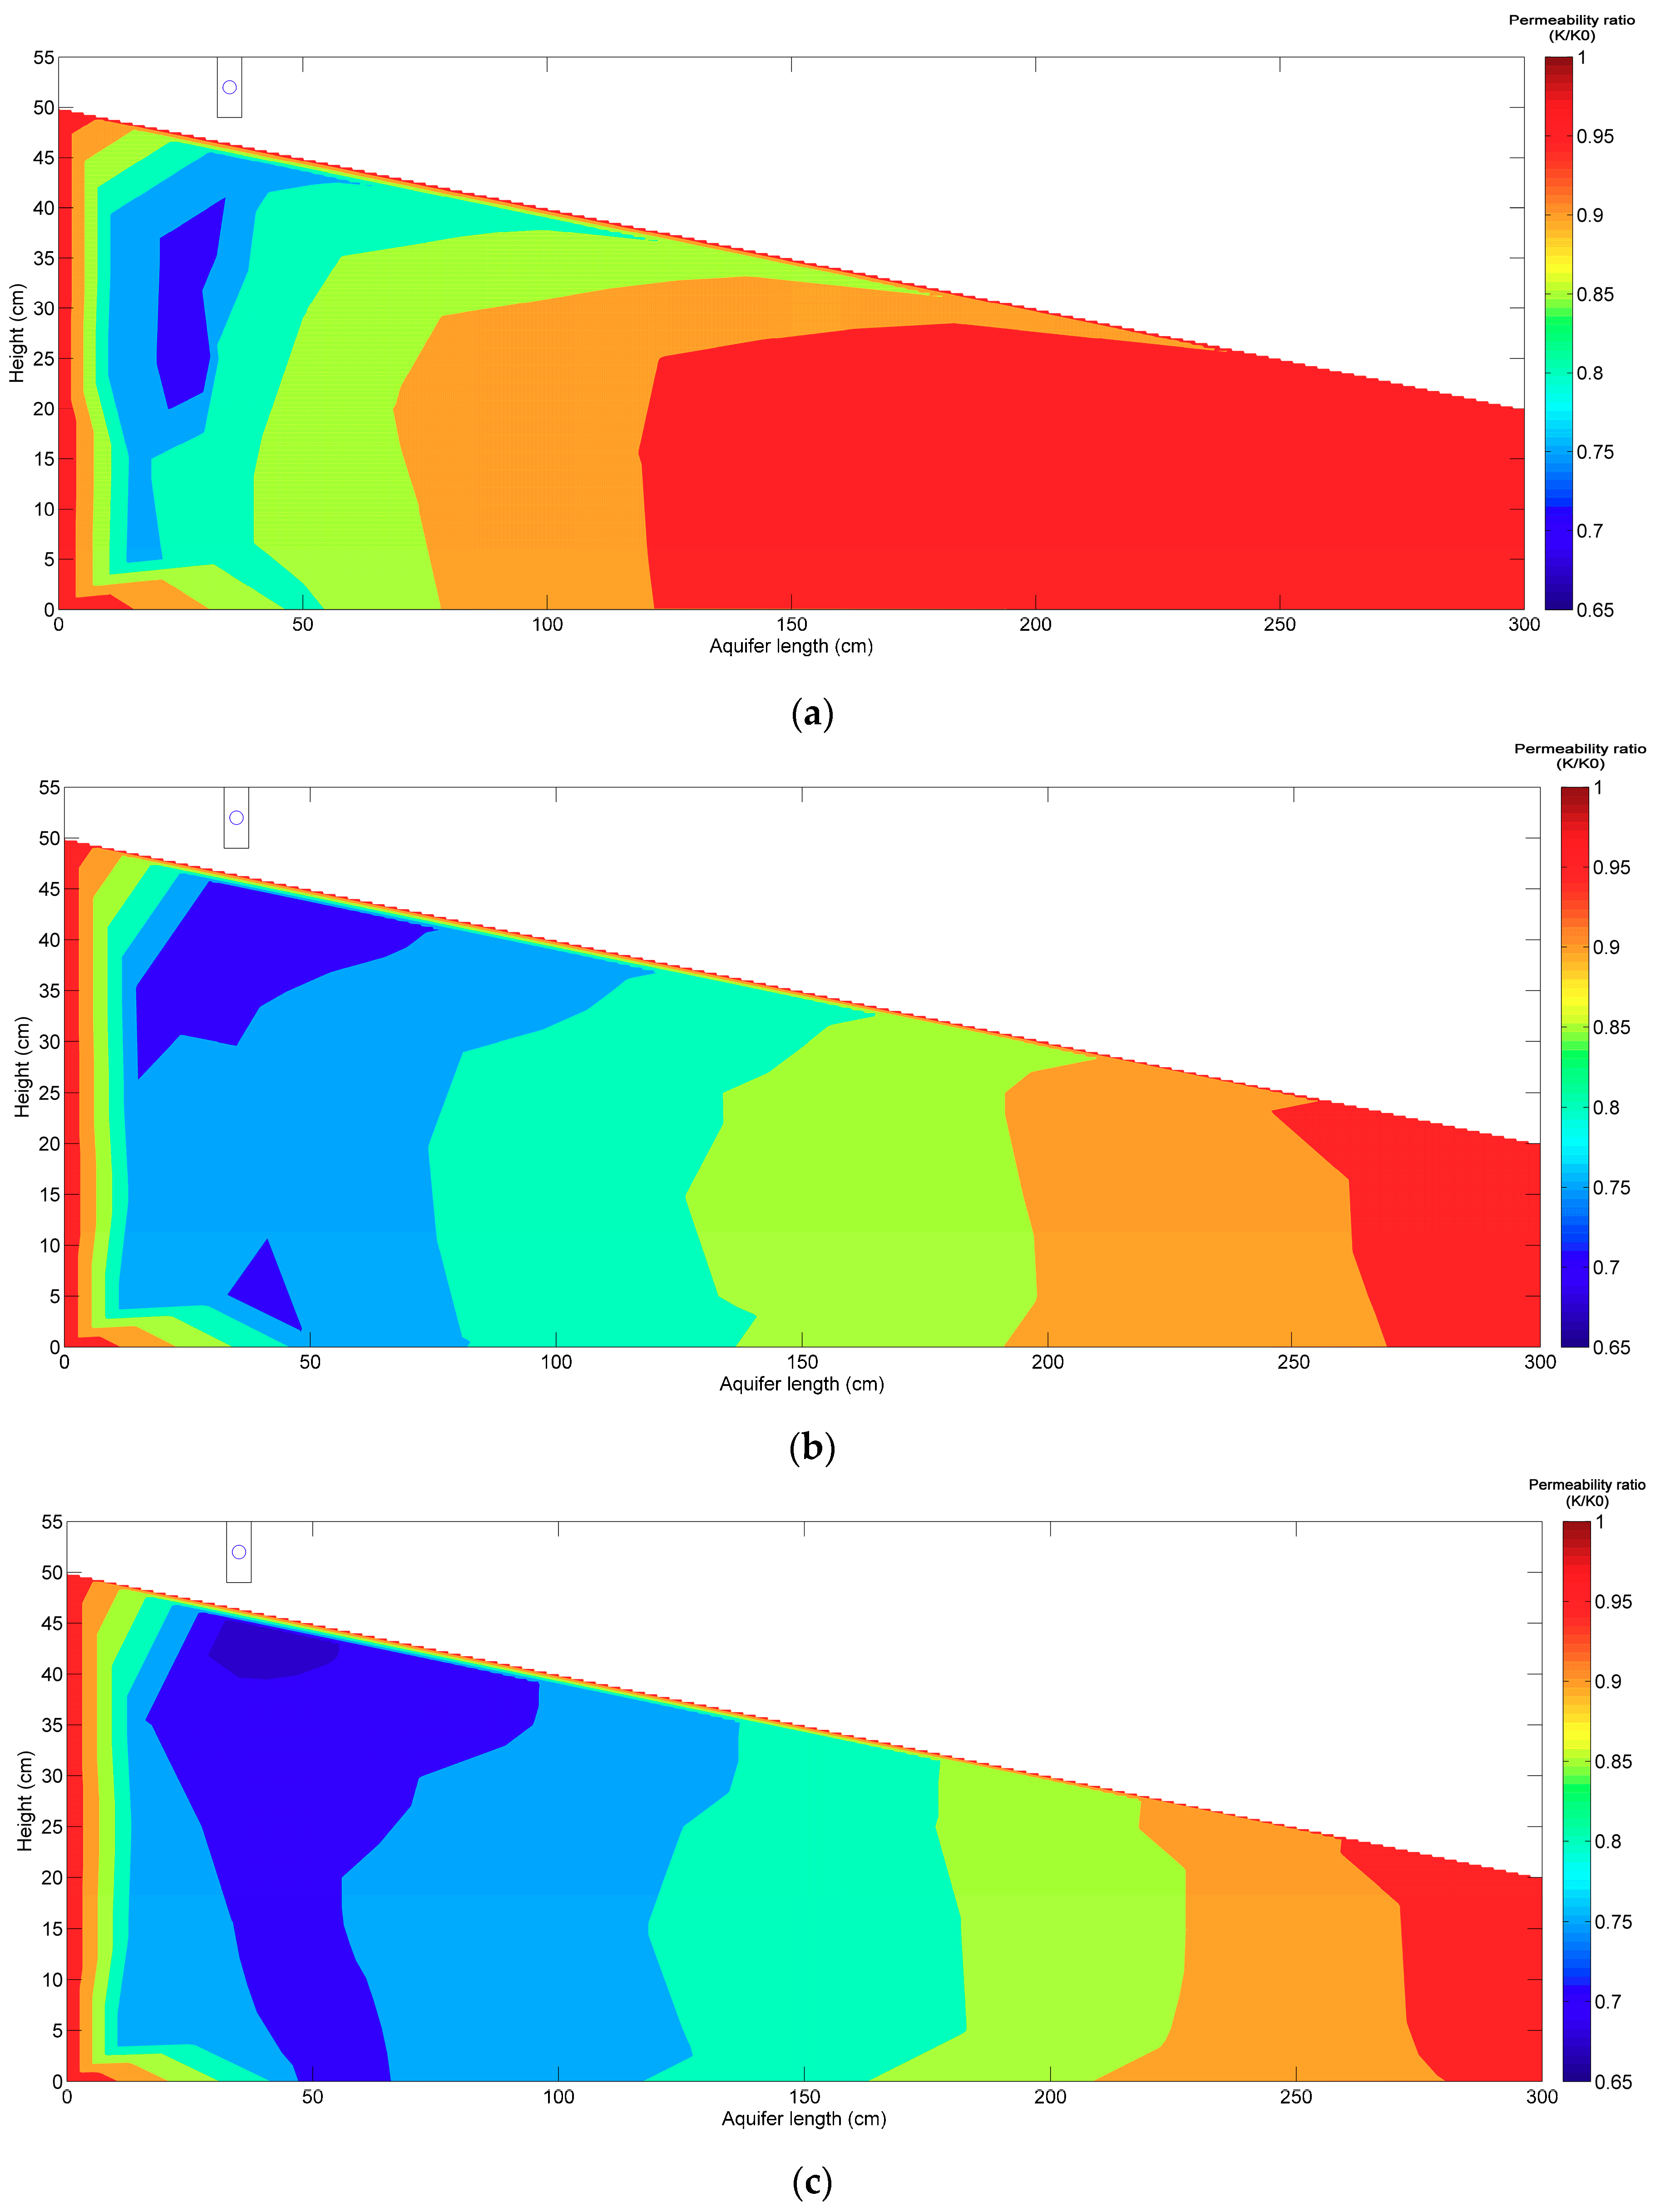
3.3. Permeability Reduction of the Porous Medium

When SP (suspended particles) in the stormwater are transported through the filtration system, a large fraction of SP are retained in the filter, but there are still some SP that enter into the aquifer. The deposition of these fine SP may exhibit some influence on the aquifer. Figure 6 shows the water levels (for several points) against the time of stormwater infiltration. It is clear that all the water levels measured in the sand tank gradually declined in spite of some fluctuations (Figure 6). The fluctuations may reflect the unsteady transport of the SP, which will be discussed later. P2-1, closest to the infiltration basin, showed the largest decline in water level, indicating that an unsaturated zone was eventually formed just underneath filtration basin, and its depth increased with time. Similar trends of water levels were also observed for all the other pressure sensors. At the end of stormwater infiltration stage (t = 99 h), no stormwater was introduced into the infiltration basin. The water level of the infiltration basin dropped quickly below the basin surface, and pressure sensors responded quickly with declining water levels (Figure 6).
During early stage of stormwater infiltration, the basin surface was clean and no clogging layer was formed. The water table would rise up to the water level in the basin, and there was direct hydraulic connection between them (Figure 4b). As the depth of the water table below the water level in the basin was relatively small, the flow away from the basin would be mostly lateral and be controlled by the slope of the water table [6]. As the clogging layer developed and the infiltration rate in the infiltration basin became smaller than the hydraulic conductivity of the aquifer, the hydraulic connection was crippled and an unsaturated zone was formed. Thereafter, the deposition of the SP in the aquifer is governed by the horizontal hydraulic gradient.
The permeability reduction of the porous medium over time due to particle deposition was assessed by Kozeny-Carman equation. The effects of re-arrangement of aquifer itself was excluded in the self-filtration and the permeability reduction of the aquifer was caused by deposited SP. Figure 7 shows the spatial distribution of permeability within the aquifer at the early and late stage of stormwater infiltration. The permeability of initially uniform porous medium was obtained using Dupuit formula. The spatial distribution of the permeability became non-uniform after the SP infiltration (Figure 7a). And the permeability of non-uniform porous medium was estimated by Kozeny-Carman Equation (8) in conjunction with other relevant Equations (3)–(7). The permeability dropped obviously below filtration basin. At early stage, vertical flow with relatively high flow rates (Figure 4) carried SP into deeper length, but as the gradually formed clogging layer restricted the vertical flow, the worst reduction zone of permeability was limited to area around the infiltration basin, where permeability of porous medium is equal to 65% of the initial permeability. Thus, it was the top of the porous medium that was the most active in the deposition process, and decreased with length. This distribution of non-uniform permeability reduction increased as stormwater infiltration continued, and the scope of permeability reduction zone extended both downward and rightward (Figure 7c). The horizontal hydraulic gradient might contribute to the SP transport, as permeability reduction distribution occurred along the gradient around the water table. It is worth noting that the aquifer bottom (x = 50 cm) suffered relatively more permeability reduction at the end of the stormwater infiltration, which suggests gravity still significantly affected the trajectories of the SP. At low infiltration rates, the deposition of larger SP was mainly controlled by gravity, causing them to settle to the bottom of the tank [9].
Combined with results from self-filtration (Figure 3), it is possible that the permeability reduction could be overestimated, if the self-filtration was not accounted for. In that case, a bigger hydraulic conductivity (K) would be employed in the Kozeny-Carman equation, and permeability reduction due to self-filtration would be mistakenly attributed to deposited SP.

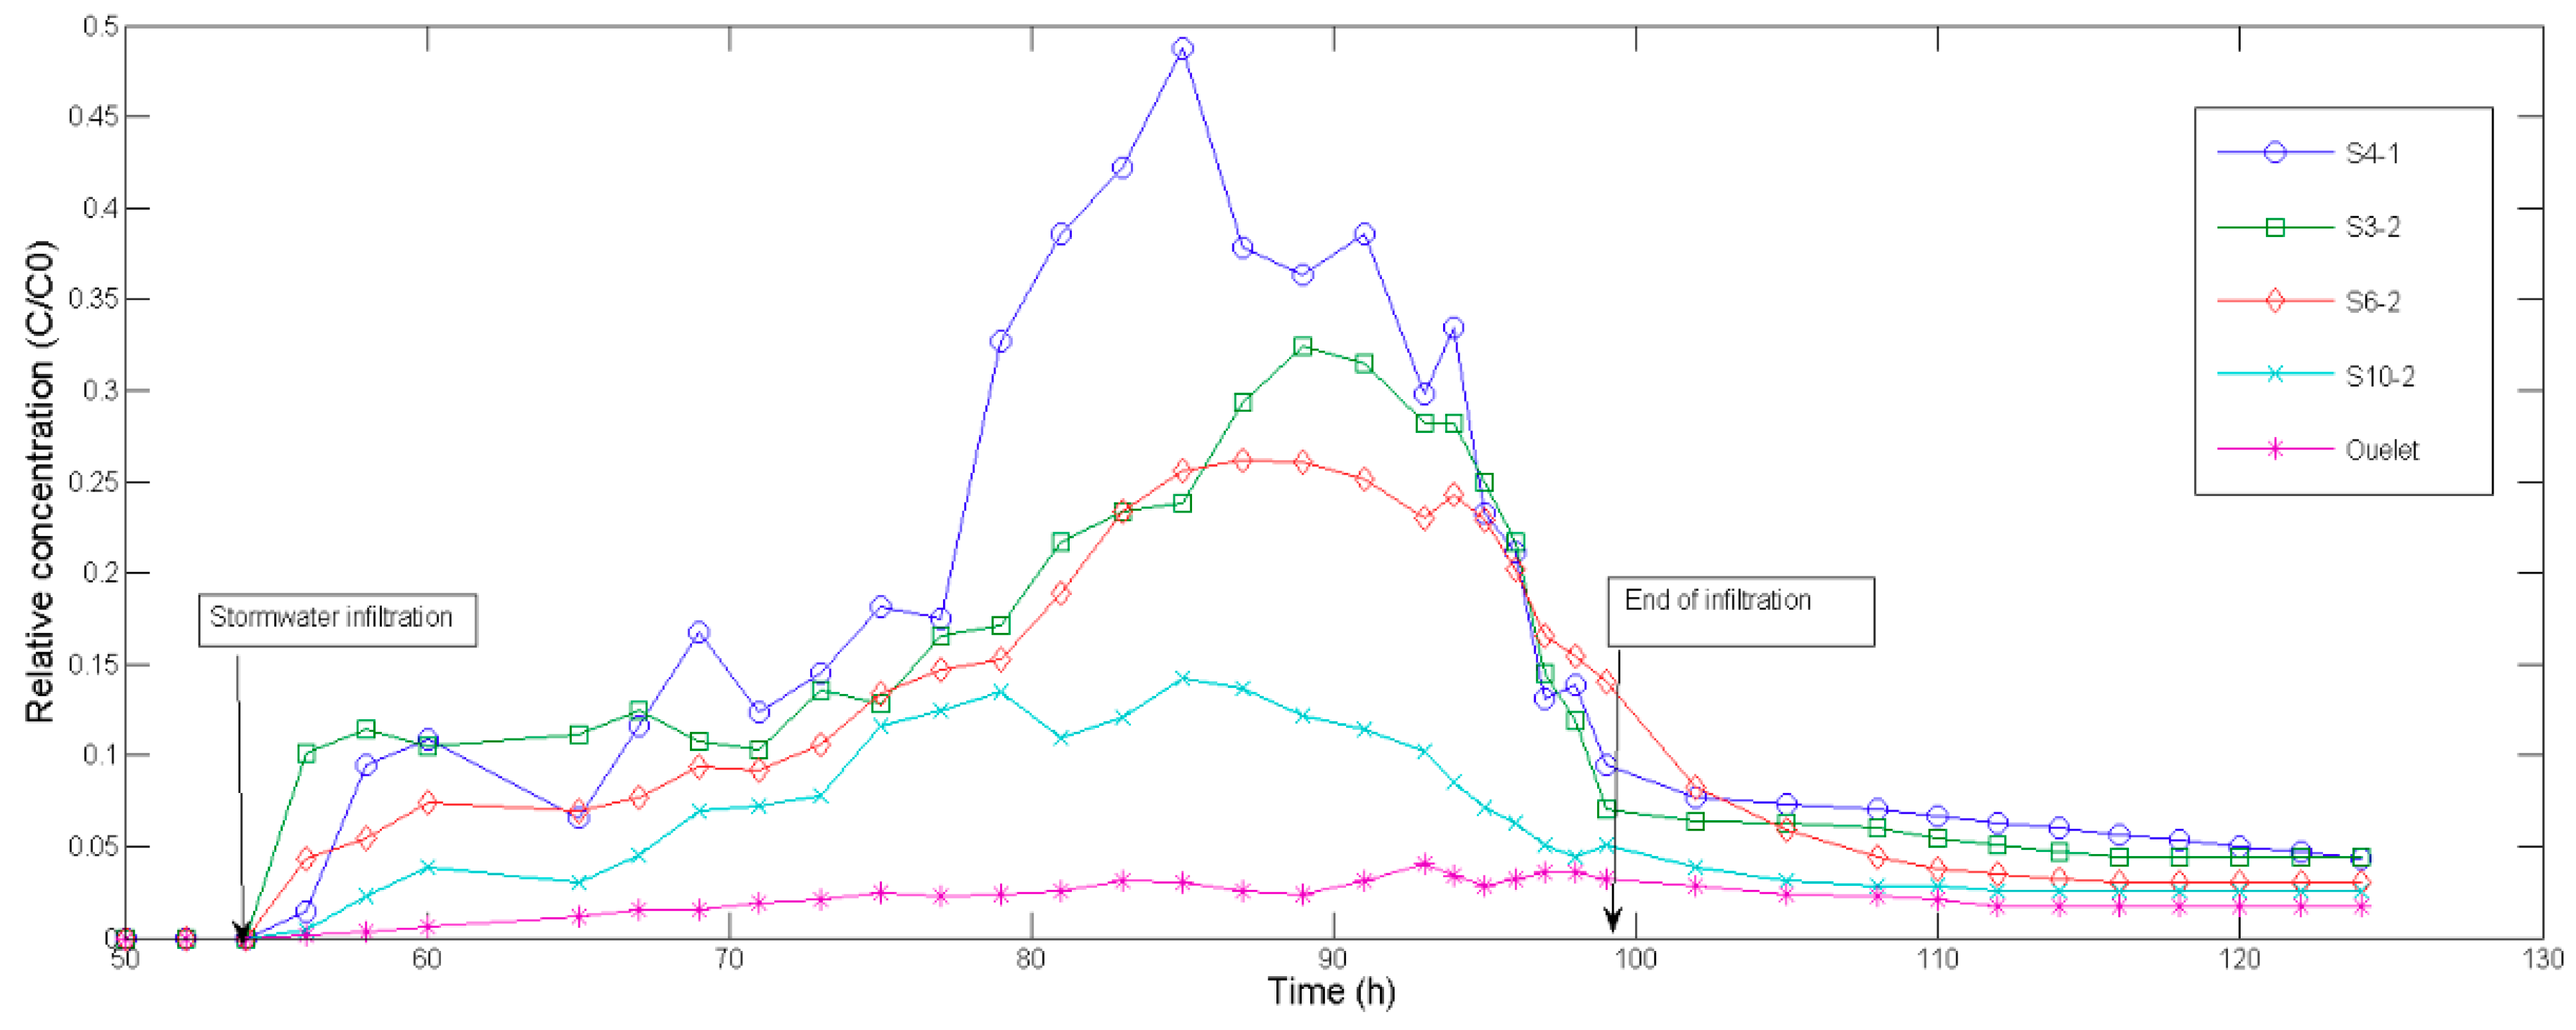
3.4. SP transport and Retention in the Porous Medium

To investigate the effects of the horizontal gradient on the transport and deposition of SP, the BTCs (Figure 8) are represented by a relative concentration as a function of time. Two obvious features can be seen from the figure. One is the high fluctuations of BTCs, as compared to results in sand column [9,13,15]. These fluctuations are similar to variations in head losses (Figure 6). The other is the extended tailing following breakthrough. It is particularly evident for outlet BTC, where persistent low concentrations could be detected, even a long period after the experiment ended.
Both evolutions can be attributed to the detachment of deposited SP [39]. Retained SP may aggregate at pore constrictions [40]. The retained matter has an unequally strong structure and is subject to hydrodynamic conditions of the flow. Because the deposit reduces the porosity, the interstitial velocity thus increases. This increase in interstitial velocity, accompanied by pressure drop, causes a certain detachment due to an increase in hydrodynamic forces.
The detachment in this study is contrary to what was observed by Reddi et al. [30] for filter material in a sand column, wherein it was stated that once SP transported and settled in pores, it remained there under constant head conditions. The difference may be that hydrodynamic forces act vertically in a sand column, while horizontal hydrodynamic forces in this study act in more than one direction due to a physical perturbation such as a lift force and a torque [41]. These facilitate the release of fine SP. As a result, not all of the findings from sand column are valid when applied to clogging studies in a 2-D sand tank.
The deposited SP causes non-uniform permeability reduction within the porous medium (Figure 7), but these effects seem to be reversible due to the release of SP as well as observed extended tailing caused by the hydraulic gradient. Particle deposition in porous media is inherently an unsteady-state process. The extent of deposition will cause a non-uniform permeability reduction of the porous medium, and thus disturb the hydrodynamic forces; in turn, the variations of water velocities in pore scale will affect the transport and deposition of SP. Apart from the clogging layer formed on the basin surface and the non-uniform permeability reduction of the porous, special attention should be given to the adverse effects of extended tailing. Since many pollutants are associated with suspended sediments [42,43], the contaminated SP may pose significant long-term risk to drinking water wells. Therefore, pre-treatment and a risk assessment should be made prior to stormwater infiltration.

4. Conclusions

This study focuses on the impacts of both SP’s polydispersity on the performance of infiltration basin as well as how deposited SP (suspended particles) interacts with the groundwater flow. The sand tank experiment showed that the performance of stormwater infiltration systems is highly dependent on the formation of a clogging layer at the filter surface. Although in low content of larger SP (>18.39 μm), it accelerates the formation of the clogging layer. Particle deposition in porous media is inherently a transient process. The SP deposition causes non-uniform permeability reduction of the porous medium; in turn, the variations of hydrodynamic forces affect the transport and deposition process. The Kozeny-Carman model, coupled with other relevant models, could successfully estimate the non-uniform permeability reduction because of SP accumulations. However, the non-uniform reduction will be overestimated if the self-filtration is not taken into account. Further, the permeability reduction appears to be reversible, as the deposited SP can be released. Extended tailing due to release of deposited SP is obvious, and effective measures should be taken to eliminate the adverse effects of extended tailing prior to stormwater infiltration. As the transport and deposition of SP in a 2-D sand tank exhibit different behavior to that in 1-D sand column, further experiments need to be conducted to analyze the influence of hydraulic gradients (such as low hydraulic gradient and high hydraulic gradient) and stormwater characteristics (such as its concentration, composition). A greater understanding of these factors will provide deeper insights into how SP transport and deposit in a saturated medium. Consequently, these insights will increase stormwater applications.

Author Contributions

Conceptualization, Z.Z., L.S. and X.M.; methodology, Z.Z. and X.M.; software, Z.Z. and X.M.; validation, Z.Z.; formal analysis, X.M.; investigation, X.M. and Z.Z.; resources, X.M. and L.S.; data curation, Z.Z.; writing—original draft preparation, Z.Z.; writing—review and editing, L.S. and E.C.M.; supervision, L.S.; project administration, X.M.; funding acquisition, X.M., L.S.

Funding

The research work is funded by the National Natural Science Foundation of China project (D010102-41501045); project (2017YFC0405700); the Fundamental Research Funds for the Central Universities (2018B607X14) and Postgraduate Research & Practice Innovation Program of Jiangsu Province (KYCX18_0579). The research work is also funded by the National Natural Science Foundation of China project entitled “Study on Water Cycle Evolution of Groundwater Reservoir in the Arid Area under Artificial Regulation” (No. 41572210).

Acknowledgments

The authors acknowledge valuable comments from the reviewers, which led to significant improvement of the paper.

Conflicts of Interest

The authors declare no conflict of interest.

References

  1. Chang, N.B.; Lu, J.W.; Chui, T.F.M.; Hartshorn, N. Global policy analysis of low impact development for stormwater management in urban regions. Land Use Policy 2018, 70, 368–383. [Google Scholar] [CrossRef]
  2. Stéphanie, R.P.; Ragusa, S.; Sztajnbok, P.; Vandevelde, T. Interrelationships between biological, chemical, and physical processes as an analog to clogging in aquifer storage and recovery (ASR) wells. Water Res. 2000, 34, 2110–2118. [Google Scholar]
  3. Xu, Y.; Shu, L.; Zhang, Y.; Wu, P.; Eshete, C.M. Physical experiment and numerical simulation of the artificial recharge effect on groundwater reservoir. Water 2017, 9, 908. [Google Scholar]
  4. Liang, X.; Zhan, H.; Zhang, Y.K. Aquifer recharge using a vadose zone infiltration well. Water Resour. Res. 2018, 54, 8847–8863. [Google Scholar] [CrossRef]
  5. Siriwardene, N.R.; Deletic, A.; Fletcher, T.D. Clogging of stormwater gravel infiltration systems and filters: Insights from a laboratory study. Water Res. 2007, 41, 1433–1440. [Google Scholar] [CrossRef]
  6. Bouwer, H. Artificial recharge of groundwater: Hydrogeology and engineering. Hydrogeol. J. 2002, 10, 121–142. [Google Scholar] [CrossRef]
  7. Fetzer, J.; Holzner, M.; Plotze, M.; Furrer, G. Clogging of an alpine streambed by silt-sized particles-insights from laboratory and field experiments. Water Res. 2017, 126, 60–69. [Google Scholar] [CrossRef] [PubMed]
  8. Kandra, H.S.; Mccarthy, D.; Fletcher, T.D.; Deletic, A. Assessment of clogging phenomena in granular filter media used for stormwater treatment. J. Hydrol. 2014, 512, 518–527. [Google Scholar] [CrossRef] [Green Version]
  9. Ahfir, N.D.; Wang, H.Q.; Benamar, A.; Alem, A.; Massei, N.; Dupont, J.P. Transport and deposition of suspended particles in saturated porous media: Hydrodynamic effect. Hydrogeol. J. 2007, 15, 659–668. [Google Scholar] [CrossRef]
  10. Lloyd, S.D.; Wong, T.H.F.; Liebig, T.; Becker, M. Sediment characteristics in stormwater pollution control ponds. Aust. J. Water Res. 2002, 5, 137–145. [Google Scholar] [CrossRef]
  11. Kandra, H.S.; Deletic, A.; Mccarthy, D. Assessment of impact of filter design variables on clogging in stormwater filters. Water Resour. Manag. 2014, 28, 1873–1885. [Google Scholar] [CrossRef]
  12. Sébastien, L.C.; Fletcher, T.D.; Deletic, A.; Barraud, S.; Poelsma, P. The influence of design parameters on clogging of stormwater biofilters: A large-scale column study. Water Res. 2012, 46, 67743–67752. [Google Scholar]
  13. Alem, A.; Ahfir, N.D.; Elkawafi, A.; Wang, H.Q. Hydraulic operating conditions and particle concentration effects on physical clogging of a porous medium. Transp. Porous Med. 2015, 106, 303–321. [Google Scholar] [CrossRef]
  14. Jegatheesan, V.; Vigneswaran, S. The effect of concentration on the early stages of deep bed filtration of submicron particles. Water Res. 1997, 31, 2910–2913. [Google Scholar] [CrossRef]
  15. Alem, A.; Elkawafi, A.; Ahfir, N.D.; Wang, H.Q. Filtration of kaolinite particles in a saturated porous medium: Hydrodynamic effects. Hydrogeol. J. 2013, 21, 573–586. [Google Scholar] [CrossRef]
  16. Bradford, S.A.; Bettahar, M.; Simunek, J.; Genuchten, M.T.V. Straining and attachment of colloids in physically heterogeneous porous media. Vadose Zone J. 2003, 3, 384–394. [Google Scholar] [CrossRef]
  17. Chang, Y.I.; Chen, S.C.; Chern, D.K. Hydrodynamic field effect on Brownian particles deposition in porous media. Sep. Purif. Technol. 2002, 27, 97–109. [Google Scholar] [CrossRef]
  18. Molnar, I.L.; Johnson, W.P.; Gerhard, J.I.; Willson, C.S.; O’Carroll, D.M. Predicting colloid transport through saturated porous media: A critical review. Water Resour. Res. 2015, 51, 6804–6845. [Google Scholar] [CrossRef] [Green Version]
  19. Nelson, K.E.; Ginn, T.R. New collector efficiency equation for colloid filtration in both natural and engineered flow conditions. Water Resour. Res. 2011, 47, 143–158. [Google Scholar] [CrossRef]
  20. Tien, C.; Payatakes, A.C. Advances in deep bed filtration. AIChE J. 1979, 25, 737–759. [Google Scholar] [CrossRef]
  21. Rege, S.D.; Fogler, H.S. A network model for deep bed filtration of solid particles and emulsion drops. AIChE J. 2010, 34, 1761–1772. [Google Scholar] [CrossRef]
  22. Mays, D.C.; Hunt, J.R. Hydrodynamic aspects of particle clogging in porous media. Environ. Sci. Technol. 2005, 39, 577–584. [Google Scholar] [CrossRef]
  23. Mays, D.C.; Hunt, J.R. Hydrodynamic and chemical factors in clogging by montmorillonite in porous media. Environ. Sci. Technol. 2007, 41, 5666–5671. [Google Scholar] [CrossRef]
  24. Johnson, W.P.; Anna, R.; Eddy, P.; Markus, H. Why variant colloid transport behaviors emerge among identical individuals in porous media when colloid-surface repulsion exists. Environ. Sci. Technol. 2018. [Google Scholar] [CrossRef] [PubMed]
  25. Li, H.; Davis, A.P. Urban particle capture in bioretention media. II: Theory and model development. J. Environ. Eng. 2008, 134, 419–432. [Google Scholar] [CrossRef]
  26. Bradford, S.A.; Simunek, J.; Bettahar, M.; Genuchten, M.T.V.; Yates, S.R. Modeling colloid attachment, straining, and exclusion in saturated porous media. Environ. Sci. Technol. 2003, 37, 2242–2250. [Google Scholar] [CrossRef]
  27. Herzig, J.P.; Leclerc, D.M.; Goff, P.L. Flow of suspensions through porous media-application to deep filtration. Ind. Eng. Chem. 1970, 62, 8–35. [Google Scholar] [CrossRef]
  28. Xu, S.; Gao, B.; Saiers, J.E. Straining of colloidal particles in saturated porous media. Water Resour. Res. 2006, 42, 731–741. [Google Scholar] [CrossRef]
  29. Vaughan, P.R.; Soares, H.F. Design of filters for clay cores of dams. J. Geotech. Eng. 1982, 108, 17–31. [Google Scholar]
  30. Reddi, L.N.; Xiao, M.; Hajra, M.G.; Lee, I.M. Physical clogging of soil filters under constant flow rate versus constant head. Can. Geotech. J. 2005, 42, 804–811. [Google Scholar] [CrossRef]
  31. Fetter, C.W. Applied Hydrogeology; Prentice Hall: Upper Saddle River, NJ, USA, 2001; p. 598. [Google Scholar]
  32. Atlabachew, A.; Shu, L.; Wu, P.; Zhang, Y.; Xu, Y. Numerical modeling of solute transport in a sand tank physical model under varying hydraulic gradient and hydrological stresses. Hydrogeol. J. 2018, 26, 2089–2113. [Google Scholar] [CrossRef]
  33. Lang, J.S.; Giron, J.J.; Hansen, A.T.; Trussell, R.R.; Hodges, W.E.J. Investigating filter performance as a function of the ratio of filter size to media size. J. Am. Water Works Assoc. 1993, 85, 122–130. [Google Scholar] [CrossRef]
  34. Zamani, A.; Maini, B. Flow of dispersed particles through porous media-deep bed filtration. J. Petrol. Sci. Eng. 2009, 69, 71–88. [Google Scholar] [CrossRef]
  35. Boller, M.A.; Kavanaugh, M.C. Particle characteristics and head loss increase in granular media filtration. Water Res. 1995, 29, 1139–1149. [Google Scholar] [CrossRef]
  36. De Marsily, G. Quantitative Hydrogeology: Groundwater Hydrology for Engineers; Academic Press: Cambridge, MA, USA, 1986; p. 158. [Google Scholar]
  37. Xu, S.; Saiers, J.E. Colloid straining within water-saturated porous media: Effects of colloid size nonuniformity. Water Resour. Res. 2009, 45, 641–648. [Google Scholar] [CrossRef]
  38. Mousavi, S.F.; Rezai, V. Evaluation of scraping treatments to restore initial infiltration capacity of three artificial recharge projects in central Iran. Hydrogeol. J. 1999, 7, 490–500. [Google Scholar] [CrossRef]
  39. Zhang, P.; Johnson, W.P.; Scheibe, T.D.; Choi, K.H.; Mailloux, B.J. Extended tailing of bacteria following breakthrough at the narrow channel focus area, Oyster, Virginia. Water Resour. Res. 2001, 37, 2687–2698. [Google Scholar] [CrossRef]
  40. Elimelech, M.; Jia, X.; Gregory, J.; Williams, R. Particle deposition and aggregation. Part. Deposition Aggregation 1998, 88, 13–15. [Google Scholar]
  41. Sen, T.K.; Khilar, K.C. Review on subsurface colloids and colloid-associated contaminant transport in saturated porous media. Adv. Colloid Interface Sci. 2006, 119, 71–96. [Google Scholar]
  42. Francey, M.; Fletcher, T.D.; Deletic, A.; Duncan, H.P. New insights into water quality of Urban stormwater in South Eastern Australia. J. Environ. Eng. 2010, 136, 381–390. [Google Scholar] [CrossRef]
  43. Han, Y.H.; Lau, S.L.; Kayhanian, M.; Stenstrom, M.K. Correlation analysis among highway stormwater pollutants and characteristics. Water Sci. Technol. 2006, 53, 235–243. [Google Scholar] [CrossRef] [PubMed]
Figure 1. Illustration of the experimental apparatus. (a) Sketch map. A and C represent upstream and downstream constant heads respectively (upstream 50 cm and downstream 20 cm); B is the sand aquifer. (b) Physical model. An infiltration basin is located 45 cm downstream of the upstream constant head with water level kept at 52 cm. The experiment is divided into three stages: (1) self-filtration stage (no water infiltration); (2) clean water infiltration stage; and (3) stormwater infiltration stage. The hydraulic conductivity (K) was measured during the self-filtration stage; the concentrations of SP were measured during the stormwater infiltration stage; and the hydraulic heads were monitored by pressure sensors and logged in a computer.
Water 11 01083 g001
Figure 2. Correlation between turbidity and concentration.
Water 11 01083 g002
Figure 3. Evolution of outlet discharge rate during the whole experiment, including self-filtration stage (no water infiltration, and only the results of last two days are presented here); clean water infiltration stage; and stormwater infiltration (red and blue lines represent median values and orange area represents 95% confidence interval). Hydraulic conductivity (K) was calculated by the application of the Dupuit discharge formula.
Water 11 01083 g003
Figure 4. Simulated groundwater flow (solid line) of the sand tank model by MODFLOW and actual groundwater flow (dotted line) interpolated by data from pressure sensors. (a) Self-filtration stage. (b) Clean water infiltration stage. The arrow size indicates the velocity of the water flow.
Water 11 01083 g004
Figure 5. (a) Dark clogging layer at the end of experiment relative to the white porous medium. (b) Characterization of the PSD of the SP retained on the basin bottom at different times (t1, t2 and t3) during the experiment under constant head. The initial PSD of injected SP is also represented with a red line.
Water 11 01083 g005
Figure 6. The evolution of water levels for typical pressure sensors (P2-1, P1-4, P2-5) over the stormwater infiltration period.
Water 11 01083 g006
Figure 7. Spatial distribution of permeability estimated by Kozeny-Carman equation at the early (a, t1), middle (b, t2) and end (c, t3) stages of stormwater infiltration.
Water 11 01083 g007
Figure 8. Observed breakthrough curves of the suspended particles (SP) for different sampling ports.
Water 11 01083 g008

