Impacts of Land Cover/Use Changes on Hydrological Processes in a Rapidly Urbanizing Mid-latitude Water Supply Catchment


1
Department of Geomatics Engineering, Civil Engineering Faculty, Istanbul Technical University, Maslak/Sarıyer/Istanbul 34467, Turkey
2
Istanbul Water and Sewerage Administration, Eyüpsultan/Istanbul 34060, Turkey
3
Department of Environmental Engineering; Istanbul Technical University, Maslak, Sarıyer/İstanbul 34467, Turkey
4
Faculty of Aquatic Sciences, Istanbul University, Laleli/Fatih/Istanbul 34452, Turkey
*
Author to whom correspondence should be addressed.
Water 2019, 11(5), 1075; https://doi.org/10.3390/w11051075
Submission received: 21 March 2019
/
Revised: 15 May 2019
/
Accepted: 20 May 2019
/
Published: 23 May 2019
(This article belongs to the Special Issue Hydrologic Modelling for Water Resources and River Basin Management)
Abstract
:This research aimed to evaluate the impact of land cover/use changes on watershed responses and hydrological processes by applying the Soil and Water Assessment Tool (SWAT) distributed hydrologic model to the Buyukcekmece Water Basin of Istanbul Metropolitan city. SWAT model was run for two different scenarios for the 40-year period between 1973 and 2012, after completing calibration procedures under gauge-data scarce conditions. For the first scenario, 1990 dated Land cover/land use (LCLU) map and meteorological data obtained between 1973 and 2012 were used. For the second scenario, 2006 dated LCLU map and same meteorological data were used to analyze the impact of changing landscape characteristics on hydrological processes. In the selected watershed, LCLU changes started towards the end of the 1980s and reached a significant status in 2006; therefore, 1990 and 2006 dated LCLU maps are important to model human impact period in the watershed. Afterwards, LCLU changes within sub-basin level were investigated to quantify the effects of different types of land changes on the major hydrological components such as actual evapotranspiration, percolation, soil water, base flow, surface runoff and runoff. Our analysis indicated that, under the same climatic conditions, changes in land cover/use, specifically urbanization, played a considerable role in hydrological dynamics with changes on actual transpiration, base flow, surface runoff, runoff, percolation and soil water mainly due to urban and agricultural area changes. Among the different hydrological components analyzed at watershed level, percolation, ET and base flow were found to be highly sensitive to LCLU changes, whereas soil water was found as the least sensitive to same LCLU changes.
1. Introduction
Land cover/land use (LCLU) change has been significantly impacting global, regional and local climate, hydrological processes, water resources, soils and environment [1,2,3]. Population increase, and socio-economic and industrial development have been triggering human-induced LCLU changes such as deforestation; expansion of urban, industrial and commercial areas; agricultural intensification; and derogation of water bodies [2,4,5].
Pressure on water resources have been increasing due to the human induced activities and climate change, which in turn affect water quality and supply due to the increased surface runoff, reduced groundwater recharge and transfer of pollutants [5,6]. Water availability, protection, and management of water resources are key aspects of the environment and socio-economic systems. Sustainable development of water resources and effective management of these resources effectively require understanding of the responses of hydrological processes to LCLU changes [2,7,8,9].
Different land cover types have different albedo, roughness length, root depths, and leaf area values, which impact the land surface-atmosphere interactions by affecting temperature, humidity, wind speed and precipitation [10,11,12,13]. Changes in land cover will have impact on these interactions resulting in differences in surface moisture, heat, and momentum fluxes [2,13,14]. Spatial distribution, size, extent and location of land cover changes are important to determine to what extent these changes could affect local, regional, and global climate and hydrological processes [15]. The hydrology of a region could be affected as a result of changes in vegetation since these changes impact the infiltration rate, soil moisture, root depth and evapotranspiration [14,16]. Hydrological variability might occur in the form of rainfall–runoff response and erosion with the contribution of three primary watershed properties: soil, land cover, and topography [17].
Conversion of natural land cover into different landscape types such as agriculture and urban have strong influences on soil integrity, nutrient fluxes, and native species assemblages. Land cover changes could affect the overall health and function of a watershed [18]. The runoff from a watershed could be altered by land cover change induced alterations such as infiltration, evapotranspiration, interception and groundwater recharge, which finally affect the period and amounts of surface and river runoff [17]. Additionally, precipitation of a region might decrease as a result of deforestation causing decrease in evapotranspiration and moisture flux convergence [19]. Deforestation may cause decrease in evapotranspiration induced by the roughness decrease and albedo increase, which in turn affect the intensity of precipitation and may produce shifts in the precipitation patterns [20]. Conversion from forested or agricultural lands into urbanized areas changes the runoff response of the watershed because of the changes in spatial distribution of vegetation, surface roughness, and evapotranspiration [21]. Great surface runoff increase might occur as a result of small increases in urban expansion since urbanization causes decrease in infiltration that impacts aquifer recharge and streamflow regimes. Therefore, quantification of urbanization effects on streamflow is significant for the development of mitigation plans to cope with anthropogenic impacts on watershed processes [22]. Increase in population as well as increase in migration to cities have major impacts on water resources. Increase of artificial surfaces and specialized agriculture resulted in the increase of the peak and total runoff formation between 1954 and 2007 in Elsa River basin [5]. Urban expansion, farmland decrease and the accompanied water use change for irrigation resulted in increase of surface runoff and streamflow during the period of 1986–2012 in Loess Plateau region of China [6]. The potential effects of varying degrees of urban expansion on the frequency of discharge, velocity, and water depth are investigated in watershed areas [22].
This study aimed to evaluate the impacts of LCLU changes on hydrological processes at watershed scale by applying the Soil and Water Assessment Tool (SWAT) [23], distributed hydrologic model for the Buyukcekmece Water Basin of Istanbul Metropolitan city. Newly generated LCLU maps, soil map and digital elevation model were introduced to the model. Spatial distributions of LCLU classes within the sub-basin level were evaluated to quantify the effects of different forms of LCLU changes such as urbanization and agricultural area conversions on the actual evaporation, soil water, percolation, surface runoff, and base flow in a water supply catchment and to analyze which components are more sensitive to different LCLU changes.
2. Materials and Methods
2.1. Study Area and Data
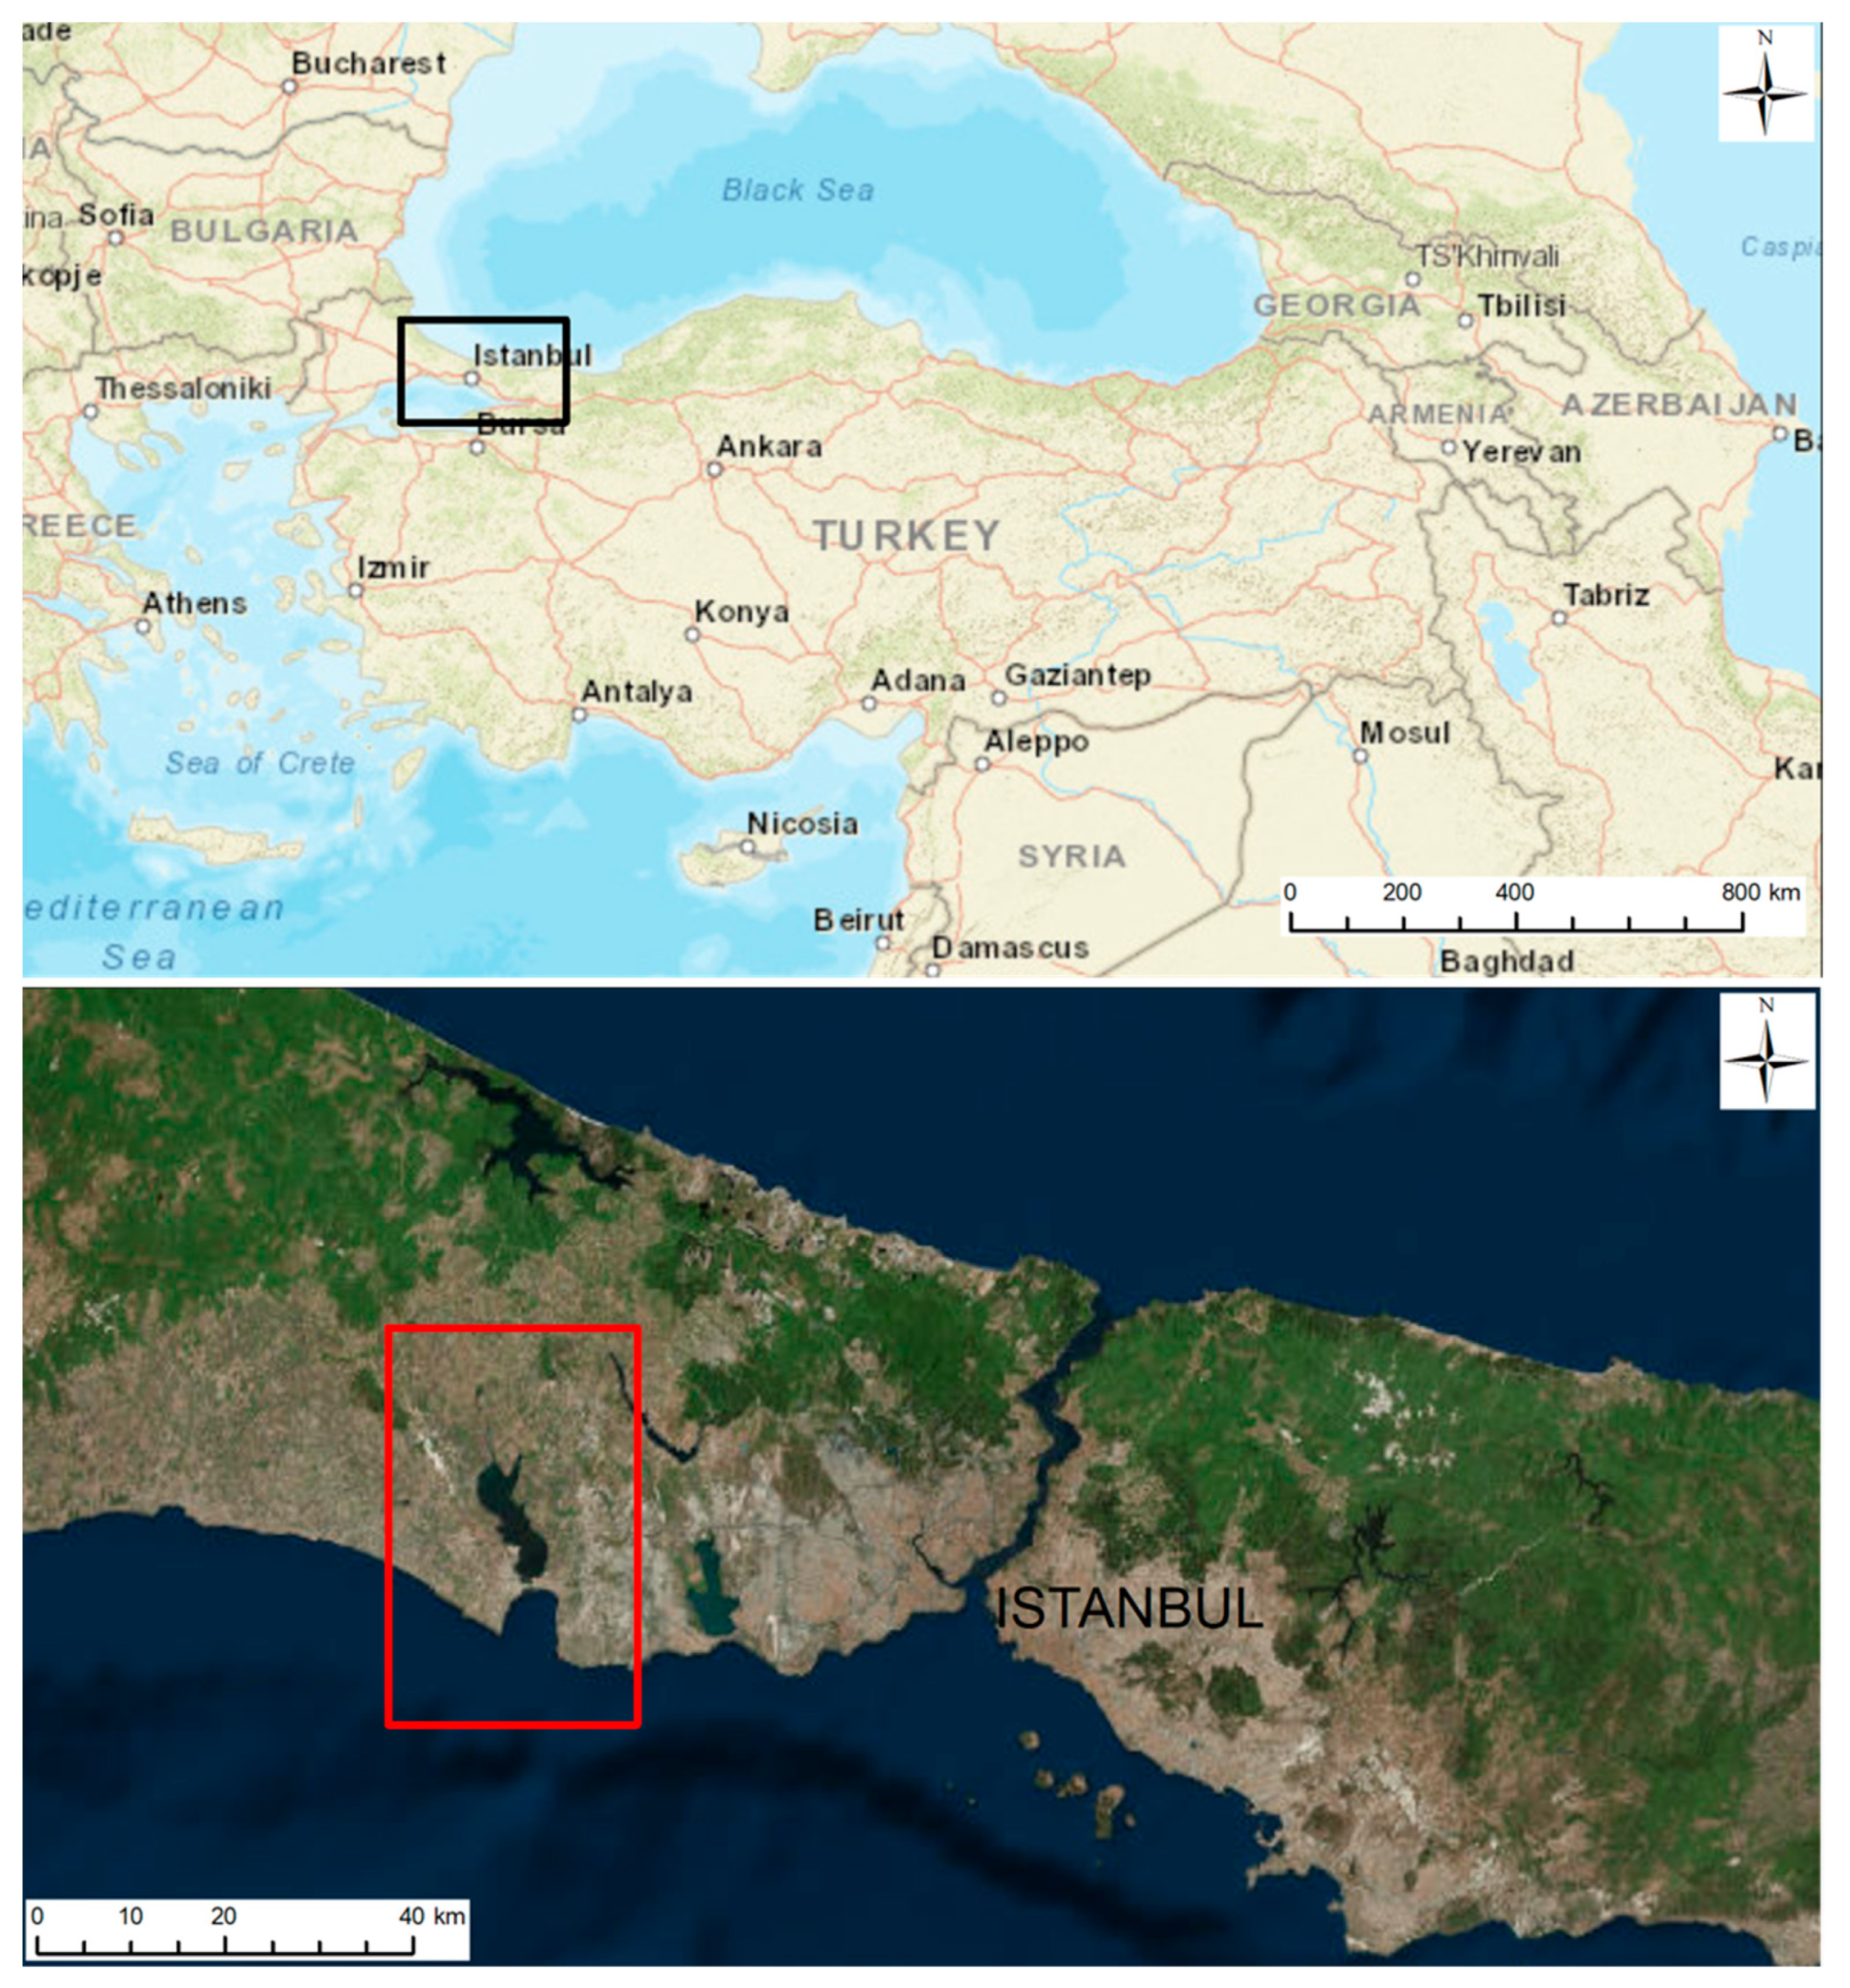
The study area is located in the drainage area of the Buyukcekmece Reservoir, Istanbul. Part of the study area close to the lake is under protection and human-induced activities and urbanization need to be kept in very limited scale and controlled by the officials to protect this fresh water resource. However, there is still illegal construction within the water basin area, which should be closely monitored. The Buyukcekmece Reservoir is one of the important water sources of Istanbul supplying water to almost 2,000,000 people. The reservoir was originally a lagoon until 1987, when a dam was constructed to isolate the freshwater from the sea. The reservoir has a surface area of 28.50 ha at standard operation level and its drainage area is 622 km2 [24]. Figure 1 shows the location of the study area.
Maps having different scales were used in this research for different stages of the work. Maps of 1/5000 scale were used for the ortho-rectification of very high-resolution IKONOS satellite images, which were used to assess the accuracy of CORINE based LCLU maps. Additionally, elevation information from these maps were used to create a high-resolution Digital Elevation Model (DEM) with 3 m × 3 m raster resolution. Digital elevation models are needed to determine drainage areas in the basin and to calculate aspect, slope, slope distance, and drainage network while calculating sub basin parameters. Having a higher resolution DEM provides better details for drainage, slope and related parameters, therefore better identification of hydrological response units compared to the freely available DEM within the SWAT model.
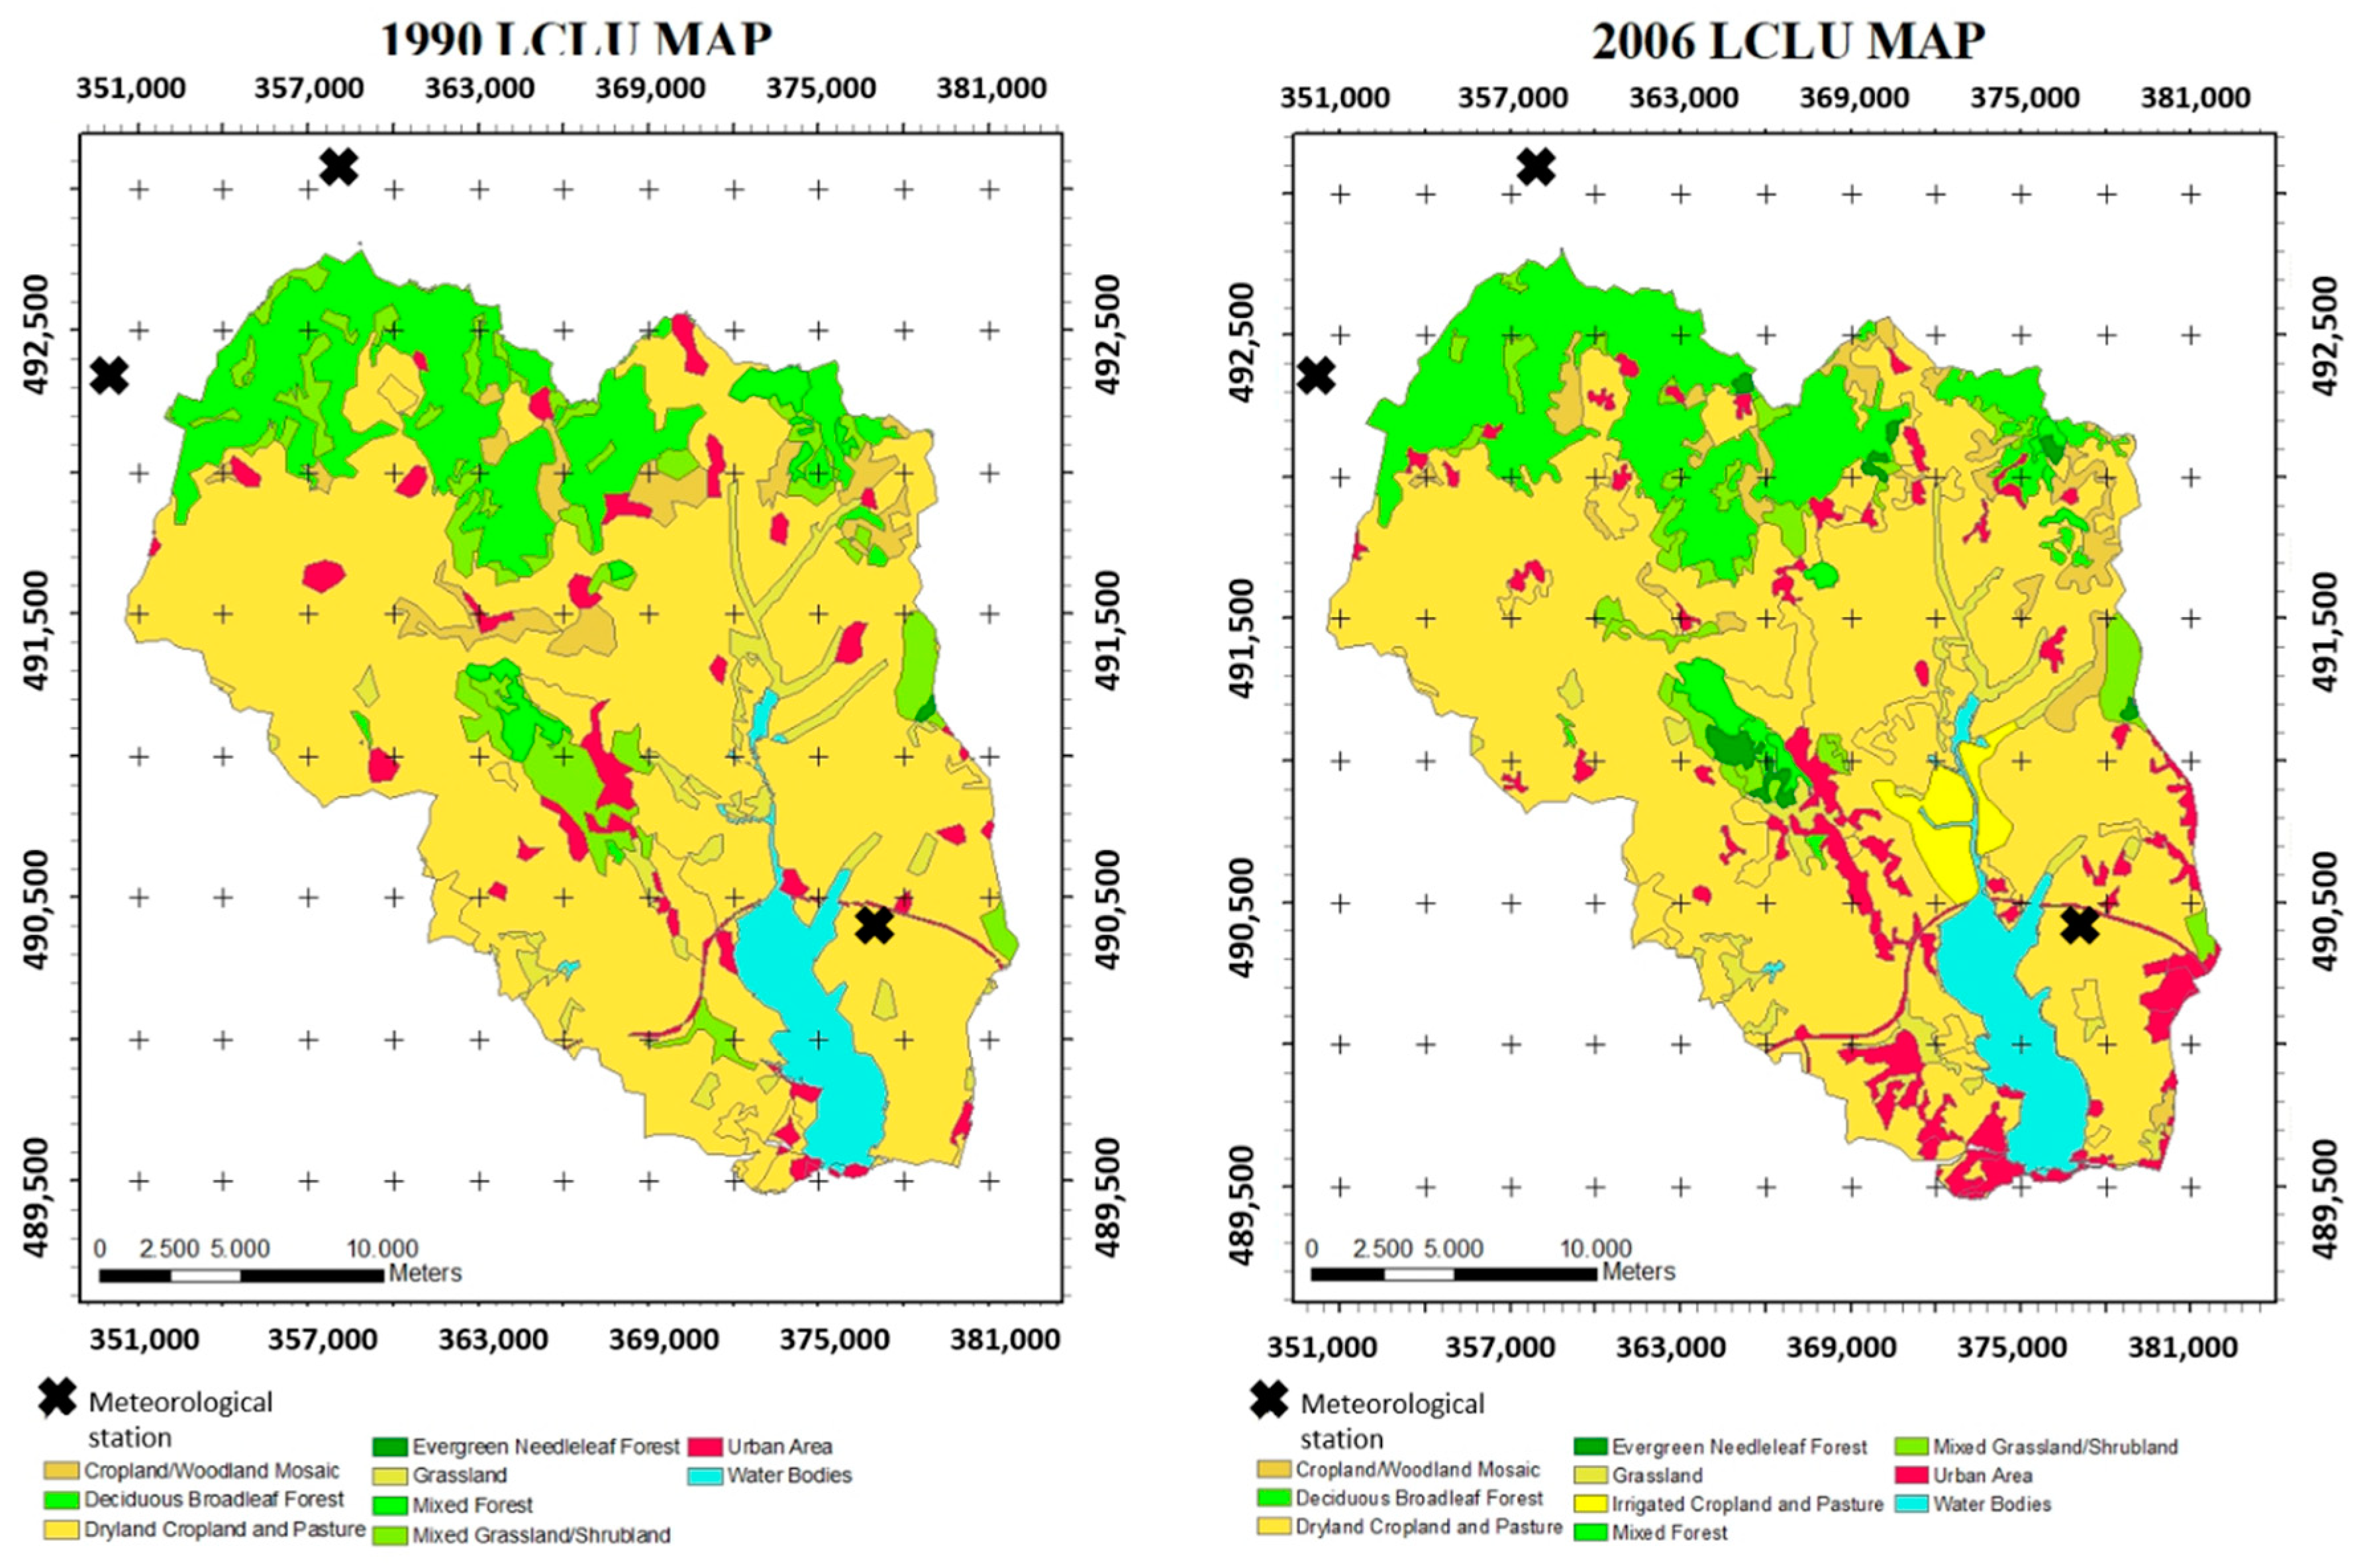
Coordination of Information on the Environment (CORINE) database is available for several European countries for 1990 and 2006 [25]. Therefore, 1990 and 2006 dated CORINE LCLU maps of the region were obtained and geometrically corrected to be compatible with all geographic datasets. The year 1990 was important for this research since LCLU changes were mostly started to occur in Istanbul by the end of the 1980s and land cover status was stable between 1970 and 1990. Moreover, significant land changes occurred in the area between 1990 and 2006 (Figure 2). These LCLU maps were converted into 16 different land cover classes to be compatible with SWAT hydrological model class definitions. Since CORINE system has 44 different LCLU classes, some LCLU classes were merged to create new 24-class LCLU maps of the study region. For example, CORINE has 11 different sub-classes under artificial surface class such as continuous urban fabric, discontinuous urban fabric, industrial or commercial units, road and rail networks and associated land, port areas, airport, etc. All of these artificial surface sub-level classes were merged and an Urban Area class was formed. Similar approach was followed to create Dryland Cropland and Pasture and Irrigated Cropland and Pasture classes. Land cover classes used in this research were: Urban Area, Dryland Cropland and Pasture, Irrigated Cropland and Pasture, Cropland/Woodland Mosaic, Grassland, Mixed Grassland/Shrubland, Deciduous Broadleaf Forest, Evergreen Needleleaf Forest, Mixed Forest and Water bodies.
Table 1 summarizes LCLU classes within the watershed for 1990 and 2006; DIFF indicates change of each class between 1990 and 2006. There was an increase of 1762.24 ha (2.89%) for urban areas between 1990 and 2006. Irrigated Cropland and Pasture had the second biggest increase of 1236.68 ha (2.03%) during this period. In addition, the total areas of Deciduous Broadleaf Forest and Evergreen Needleleaf Forest classes increased by 891.87 ha (1.45%) and 467.99 ha (0.77%), respectively. The major decrease was for Dryland Cropland and Pasture class with a value of 2141.75 ha; there was a considerable decrease of 1948.08 ha for Mixed Grassland/Shrubland class as well. These decreases amounted to −3.60% and −3.21%, respectively.
2.2. Soil and Water Assessment Tool (SWAT)
We used the Soil and Water Assessment Tool (SWAT) distributed hydrological model to simulate hydrologic responses of Buyukcekmece watershed to LCLU changes between 1973 and 2012. The SWAT model is a distributed physically-based model in which continuous daily time-step computations can be done to assess the impacts of climate and land management on hydrological components, sediment loading, and pollution transport in watersheds [23,26].
SWAT is one of the most widely used open source water quality and watershed model worldwide; it is well known and documented and has been applied extensively for a broad range of hydrologic and/or environmental problems [27,28]. GIS-based preprocessors for model building and data entry and text-based model input and output suitable for automatic (script based) input data manipulation are possible in the SWAT model to facilitate its usage [23,26,29,30,31,32]. SWAT is a physically-based, computationally efficient, continuous time model with spatially explicit parameterization [33]. SWAT is operated on daily time steps, but it can aggregate the results to monthly or annual output.
The model divides watershed into sub-basins connected by a stream network. Sub-basins are discretized into Hydrologic Response Units (HRUs) consisting of unique soil, slope, and land use combinations. The local HRU water balance is presented by four storage volumes: snow, soil profile, shallow aquifer representing unconfined aquifers, and deep aquifer representing confined aquifers [23]. Runoff is generated for each HRU, but is routed over the sub-basins. In this study, 56 sub-basins and 1267 HRUs were generated for the research area within the SWAT model.
The main input for the SWAT model was meteorological data for the period 1970–2012 obtained from the State Meteorological Office [34]. Daily time series of precipitation, temperature, pressure, relative humidity, wind speed, wind direction and solar radiation were obtained from three meteorological stations located within 10 km buffer zone of the Buyukcekmece Water basin, which represent the local meteorological forcing within the study area.
2.3. Model Inputs
The input data used in the SWAT model included a DEM, soil data, LCLU maps and climate data. The DEM with 3 m grid resolution was introduced to SWAT model to improve the boundary determination of sub-basins and HRUs.
Land cover information is one of the essential inputs of the SWAT model having strong impact on the delineation of hydrological response units (HRUs) and simulation of stream flows and water quality. LCLU maps were obtained from CORINE dataset for 1990 and 2006 and revised maps in terms of different LCLU definitions were introduced into the SWAT model to simulate the impacts of LCLU changes on hydrological components. After the calibration of the model, the first scenario (S1) was run with 1990 dated LCLU map and meteorological data from 1973 to 2012 and the second scenario (S2) was run with 2006 dated LCLU map and same meteorological data.
SWAT input data related to soils were generated using a 1/25,000 scale soil map of the area, which was obtained from Istanbul Metropolitan Municipality.
3. Results and Discussions
3.1. Model Application
To assess the impacts of LCLU changes on hydrological conditions, the calibrated model was run for 1990 and 2006 dated LCLU maps with constant DEM, soil and meteorological data from January 1973 to December 2012 in Buyukcekmece watershed. Hydrological models need a warm-up time to be as independent as possible from initial conditions that technically cannot be provided precisely; therefore, simulations were initiated from 1973. This is the case for many models since it is impossible to provide all of the model domain with correct land based initial conditions (such as soil moisture, ground water amount in the aquifers, etc.) and some processes incorporated into hydrological models usually respond slower to changes (on the scale of years) than the processes in water body only models (on the scale of days to weeks, and maximum months). The year 1973 was selected because it is the earliest year where adequate meteorological forcing data are available, thus the model was run benefitting from a relatively long warm-up period.
The simulation results were used to analyze at watershed and sub-basin scales. A cumulative evaluation was conducted at watershed scale to evaluate the impacts of LCLU changes on hydrological components. Afterwards, LCLU changes at sub-basin scale in conjunction with individual hydrological component changes were evaluated to better understand sensitivity of these components to different LCLU changes.
The model results were used to calculate the water potential of the watershed. The water potential is defined as the possible annual water withdrawal from the Buyukcekmece reservoir considering that all of the outflow would be allocated for water supply of Istanbul Metropolitan area and no concerns would have been made for downstream water release since Buyukcekmece reservoir is neighboring the Marmara Sea and there are no major downstream river ecosystems available within the basin that would need some ecological flow. The water budget calculations were done using two components: (1) the water budget of the drainage area that was modeled in the study using SWAT; and (2) the calculation of the reservoir water budget. The only inflows reaching the Buyukcekmece reservoir are river outflows from its watershed. This river outflows were already calculated by SWAT model and form the most important input for the lake water budget. Since almost all the water from the Buyukcekmece reservoir is withdrawn and not released downstream, being a freshwater resource controlled by Istanbul Municipality, evaporation from the reservoir surface would be the only outflow left to be considered for the water budget of the reservoir. Long-term evaporation data were obtained from the State Meteorological Service. Finally, the water potential was calculated using the equation below.
Water Potential = SWAT calculated outflows from the watershed − Evaporation from the reservoir water surface
SWAT-CUP [32], a popular automatic calibration and uncertainty analysis tool for SWAT model, was used for the parameter sensitivity analysis in the Buyukcekmece Basin. In this study, due to the limited available observed data in the basin, two-step calibration procedure was applied. First, the calibration was conducted at the gauge station located at the upstream of northern part of the basin, for the monthly streamflow data by using SUFI-2 algorithm [35,36] in the SWAT-CUP software with sensitive parameters. This stage could be considered as a pre-calibration step for the entire watershed. Parameterization obtained in this step was also applied for the ungauged part of the basins. The gauge station used for model calibration covers 15% of the total watershed. However, this is the only available dataset that could be used for the region. SWAT, selected as the hydrological simulation tool in this study, has been applied to poorly gauged [37,38] or even ungauged [39,40,41] watersheds and is designed to produce reasonably precise results in such cases [42]. Studies have demonstrated the capabilities of SWAT to represent basin hydrology and make satisfactory river flow predictions in poorly monitored catchments [43,44].
The basic LCLU distribution of the entire watershed was compared to the LCLU distribution of the calibrated area as given in Table 2.
As shown in Table 2, the pre-calibrated area does (of course) not have an identical land use-land cover distribution with the watershed, however we concluded that the calibrated area is a close enough sample to represent the rest of the watershed that transferring the parameters for each land use class to the rest of the watershed of the same land use class is adequate.
To improve the model performance, in the second step, manual calibration was conducted for the ungauged part of the basin by using water potential (defined above) of the reservoir at an annual basis. Six suggested sensitive model parameters by Abbaspour et al. [45] were selected and 480 simulations were conducted for the sensitivity analysis and streamflow calibration (Table 3).
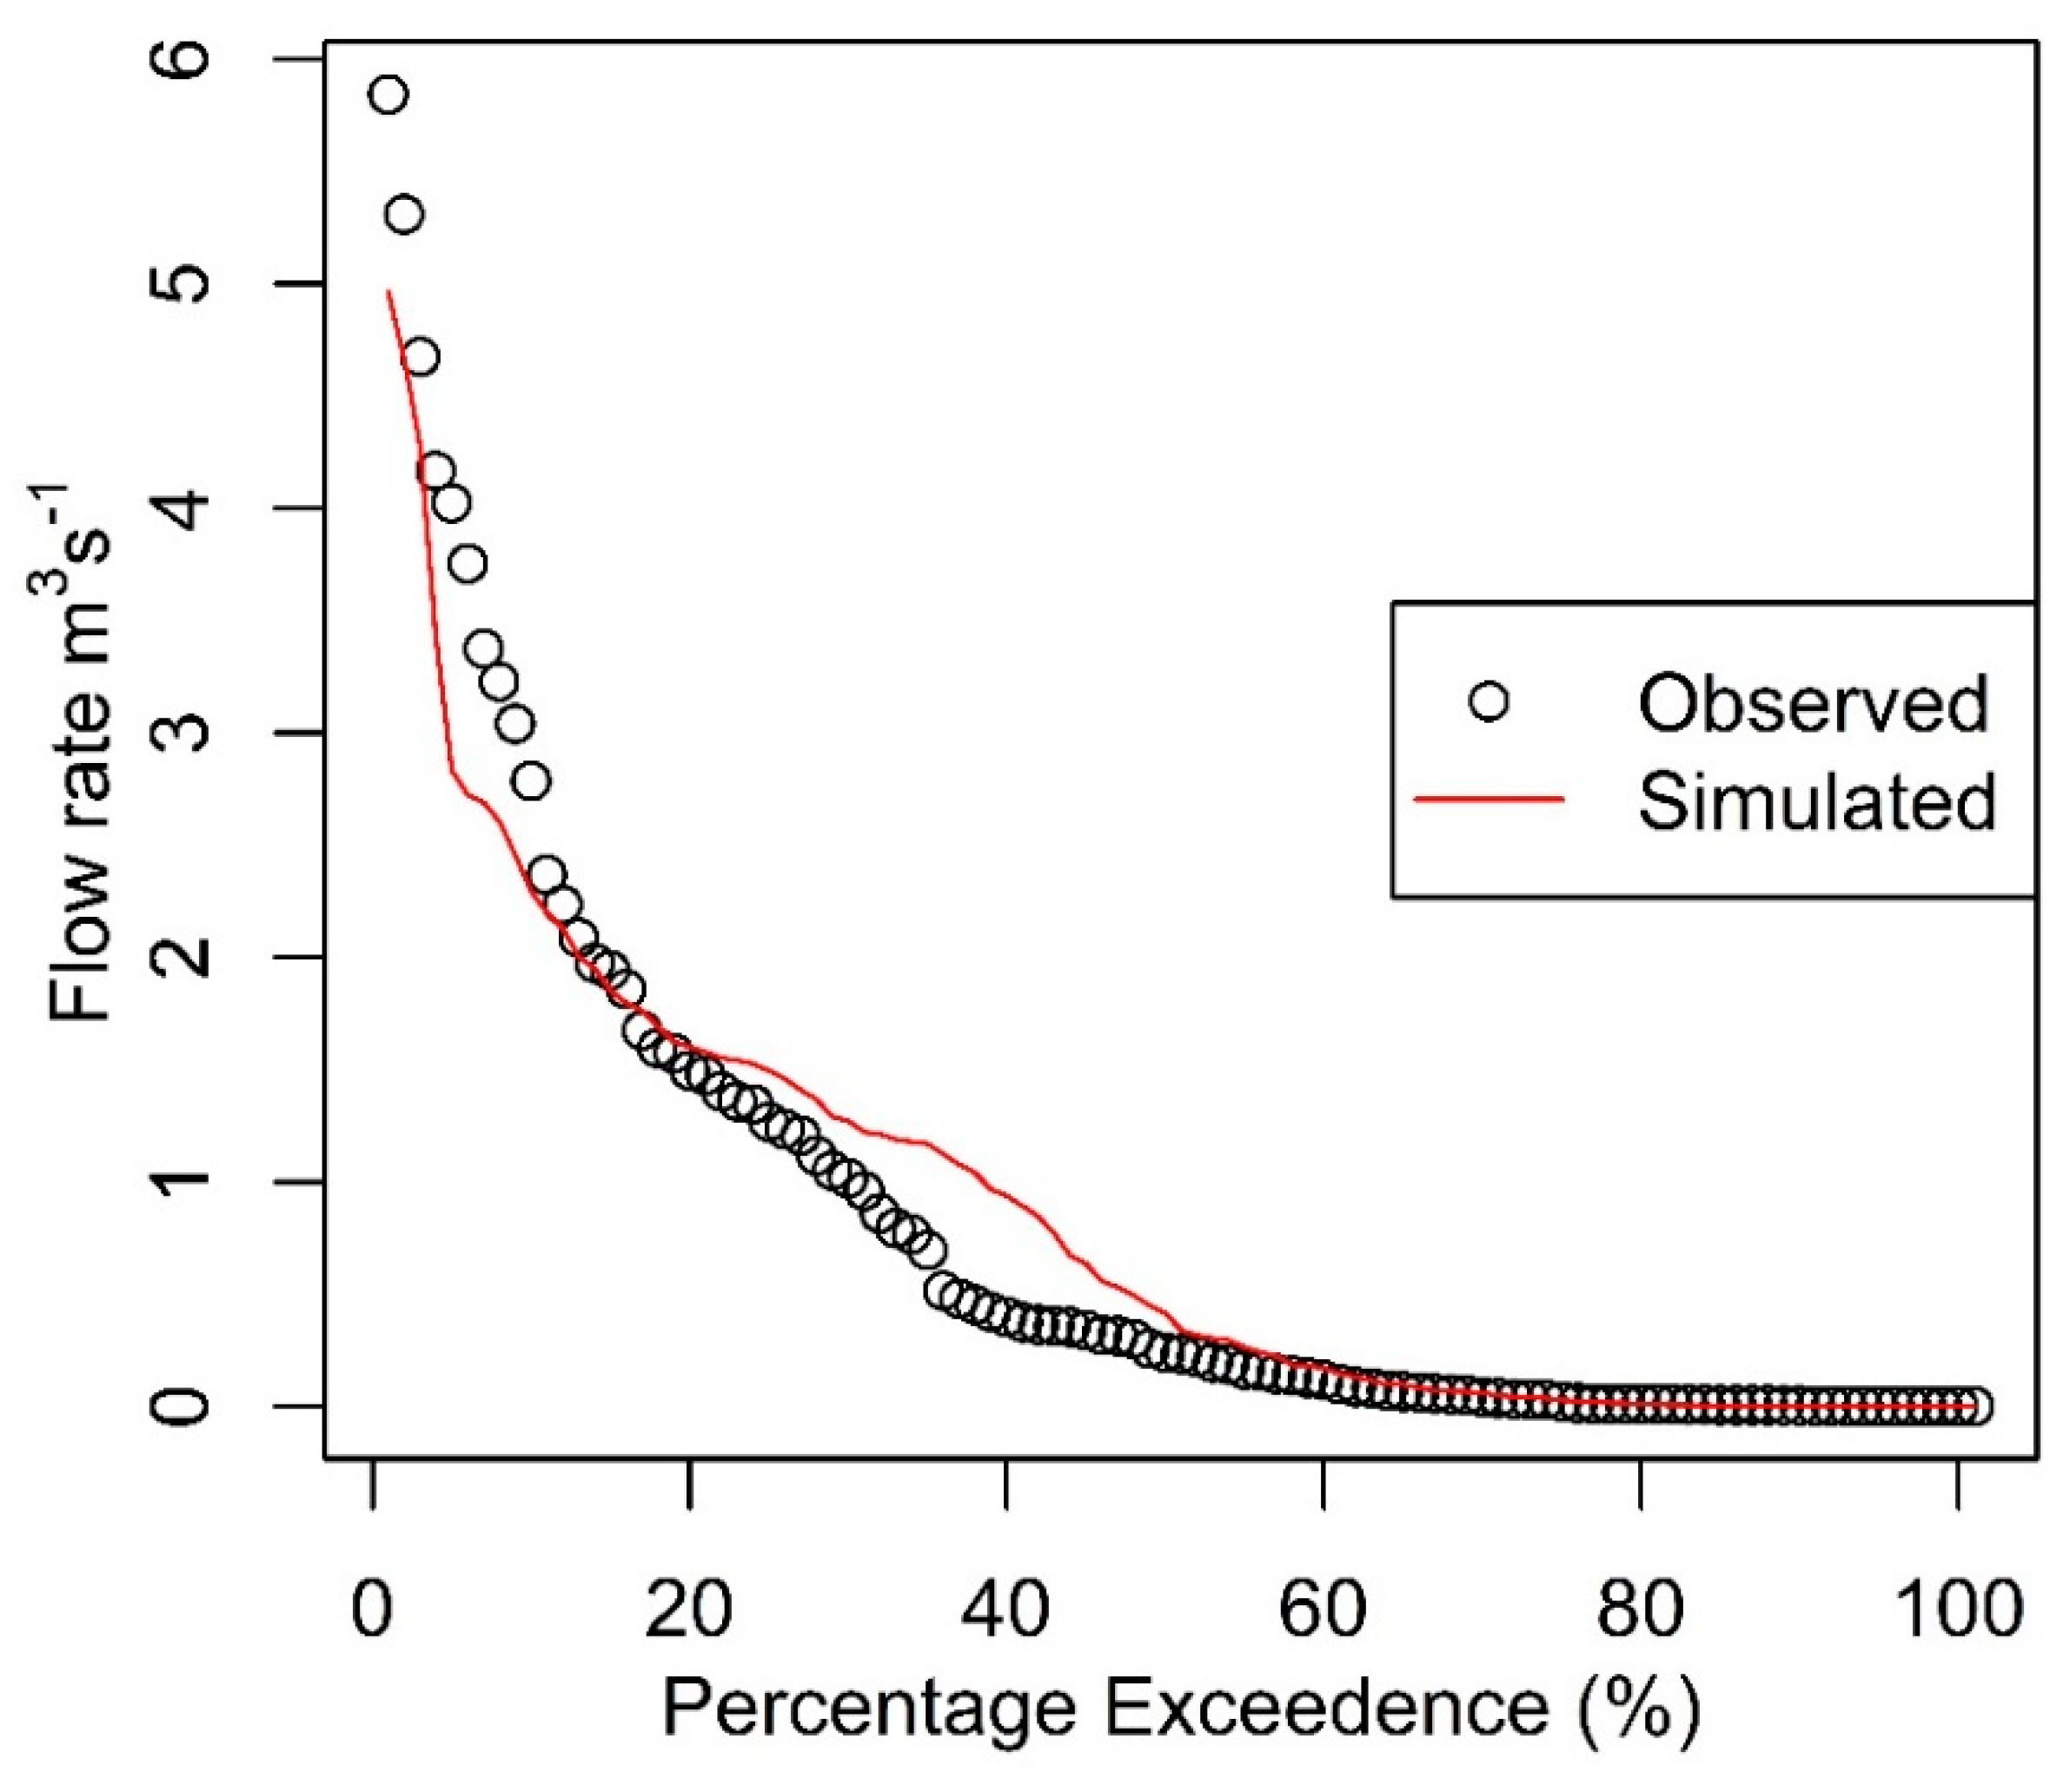
These parameters were used as well as similar approaches conducted by Cuceloglu et al. [46] in the region. CN2 was the most influential parameters on the streamflow estimations followed by the SOL_AWC and ESCO. These parameters have significant impacts on stream flow simulations, especially for the peak flows, as stated by Abbaspour et al. [45]. Although other parameters used in this study (GW_REVAP, GWQMN and REVAPMN) showed relatively less sensitivity, they were also useful to adjust base flow simulations. Flow duration curve of the model prediction and observed data at the gauge stations were plotted to the graphical representation of the model performance (Figure 3).
Model results yielded in poor performances of peak flow estimation observed after the first step calibration. NSE and PBIAS values were obtained as 0.52% and 19.2%, respectively. Considering the main objectives of this study, estimating water budget receiving the Buyukcekmece at annual basis with lower PBIAS was satisfactory for the model performance. The second step manual calibration procedure was conducted based on consistency checking of the water potential. The water potential calculated by this approach was compared with the water amount withdrawn for the Istanbul Metropolitan area from 2000 to 2012 on which the reservoir potential was totally consumed for the water supply. Finally, Percent bias (PBIAS) between the calculated water potential and water supplied to Istanbul Metropolitan area was less than 1%.
3.2. LCLU Changes within the Watershed and the Impacts of LCLU Changes on Hydrological Components at the Watershed Scale
At the watershed level, main LCLU changes during the 16-year period were urbanization, changes in agricultural patterns from dry to irrigated, and increase of some forest areas because of plantation. Urban areas covered 4.12% and 7.01% of the watershed in 1990 and 2006, respectively. Dryland croplands were 67% in 1990 and 63.4% in 2006. Although there was no irrigated cropland in 1990, this class increased to 2% during 16-year period. Mixed grassland/shrubland class decreased from 7% to 3.78% between 1990 and 2006. Deciduous broadleaf forest areas increased from 13.6% to 15.07% during the same period. Cumulative evaluation of these changes resulted in increase of annual average actual evaporation from 398.8 to 411.9 mm; decrease of the average annual percolation value from 255.6 to 234.8 mm; decrease of average annual base flow from 135.479 mm to 120.580 mm; increase of surface runoff from 127.221 mm to 134.991 mm; decrease of runoff from 264.807 mm to 257.550 mm; and decrease of soil water from 76.007 mm to 73.921 mm at watershed scale. At watershed scale, percolation was found as the most affected component by changes in land cover/use, whereas slight changes were observed for soil water with same land changes. Percolation, ET and base flow were more sensitive to LCLU changes in the studied watershed, whereas soil water did not present high sensitivity.
Water potential of the water basin illustrates differences with respect to LCLU changes. Water potential of the watershed was calculated using average annual runoff values obtained from the simulations of 1990 and 2006 dated LCLU maps. Our results indicate that water potential was 158,670,060.00 m3 and 154,321,728.50 m3 with 1990 and 2006 dated LCLU maps, respectively. LCLU changes within the watershed resulted in decrease of water potential by on average 4,348,332.00 m3.
3.3. LCLU Changes and Their Impacts on Hydrological Components at Sub-basin Scale
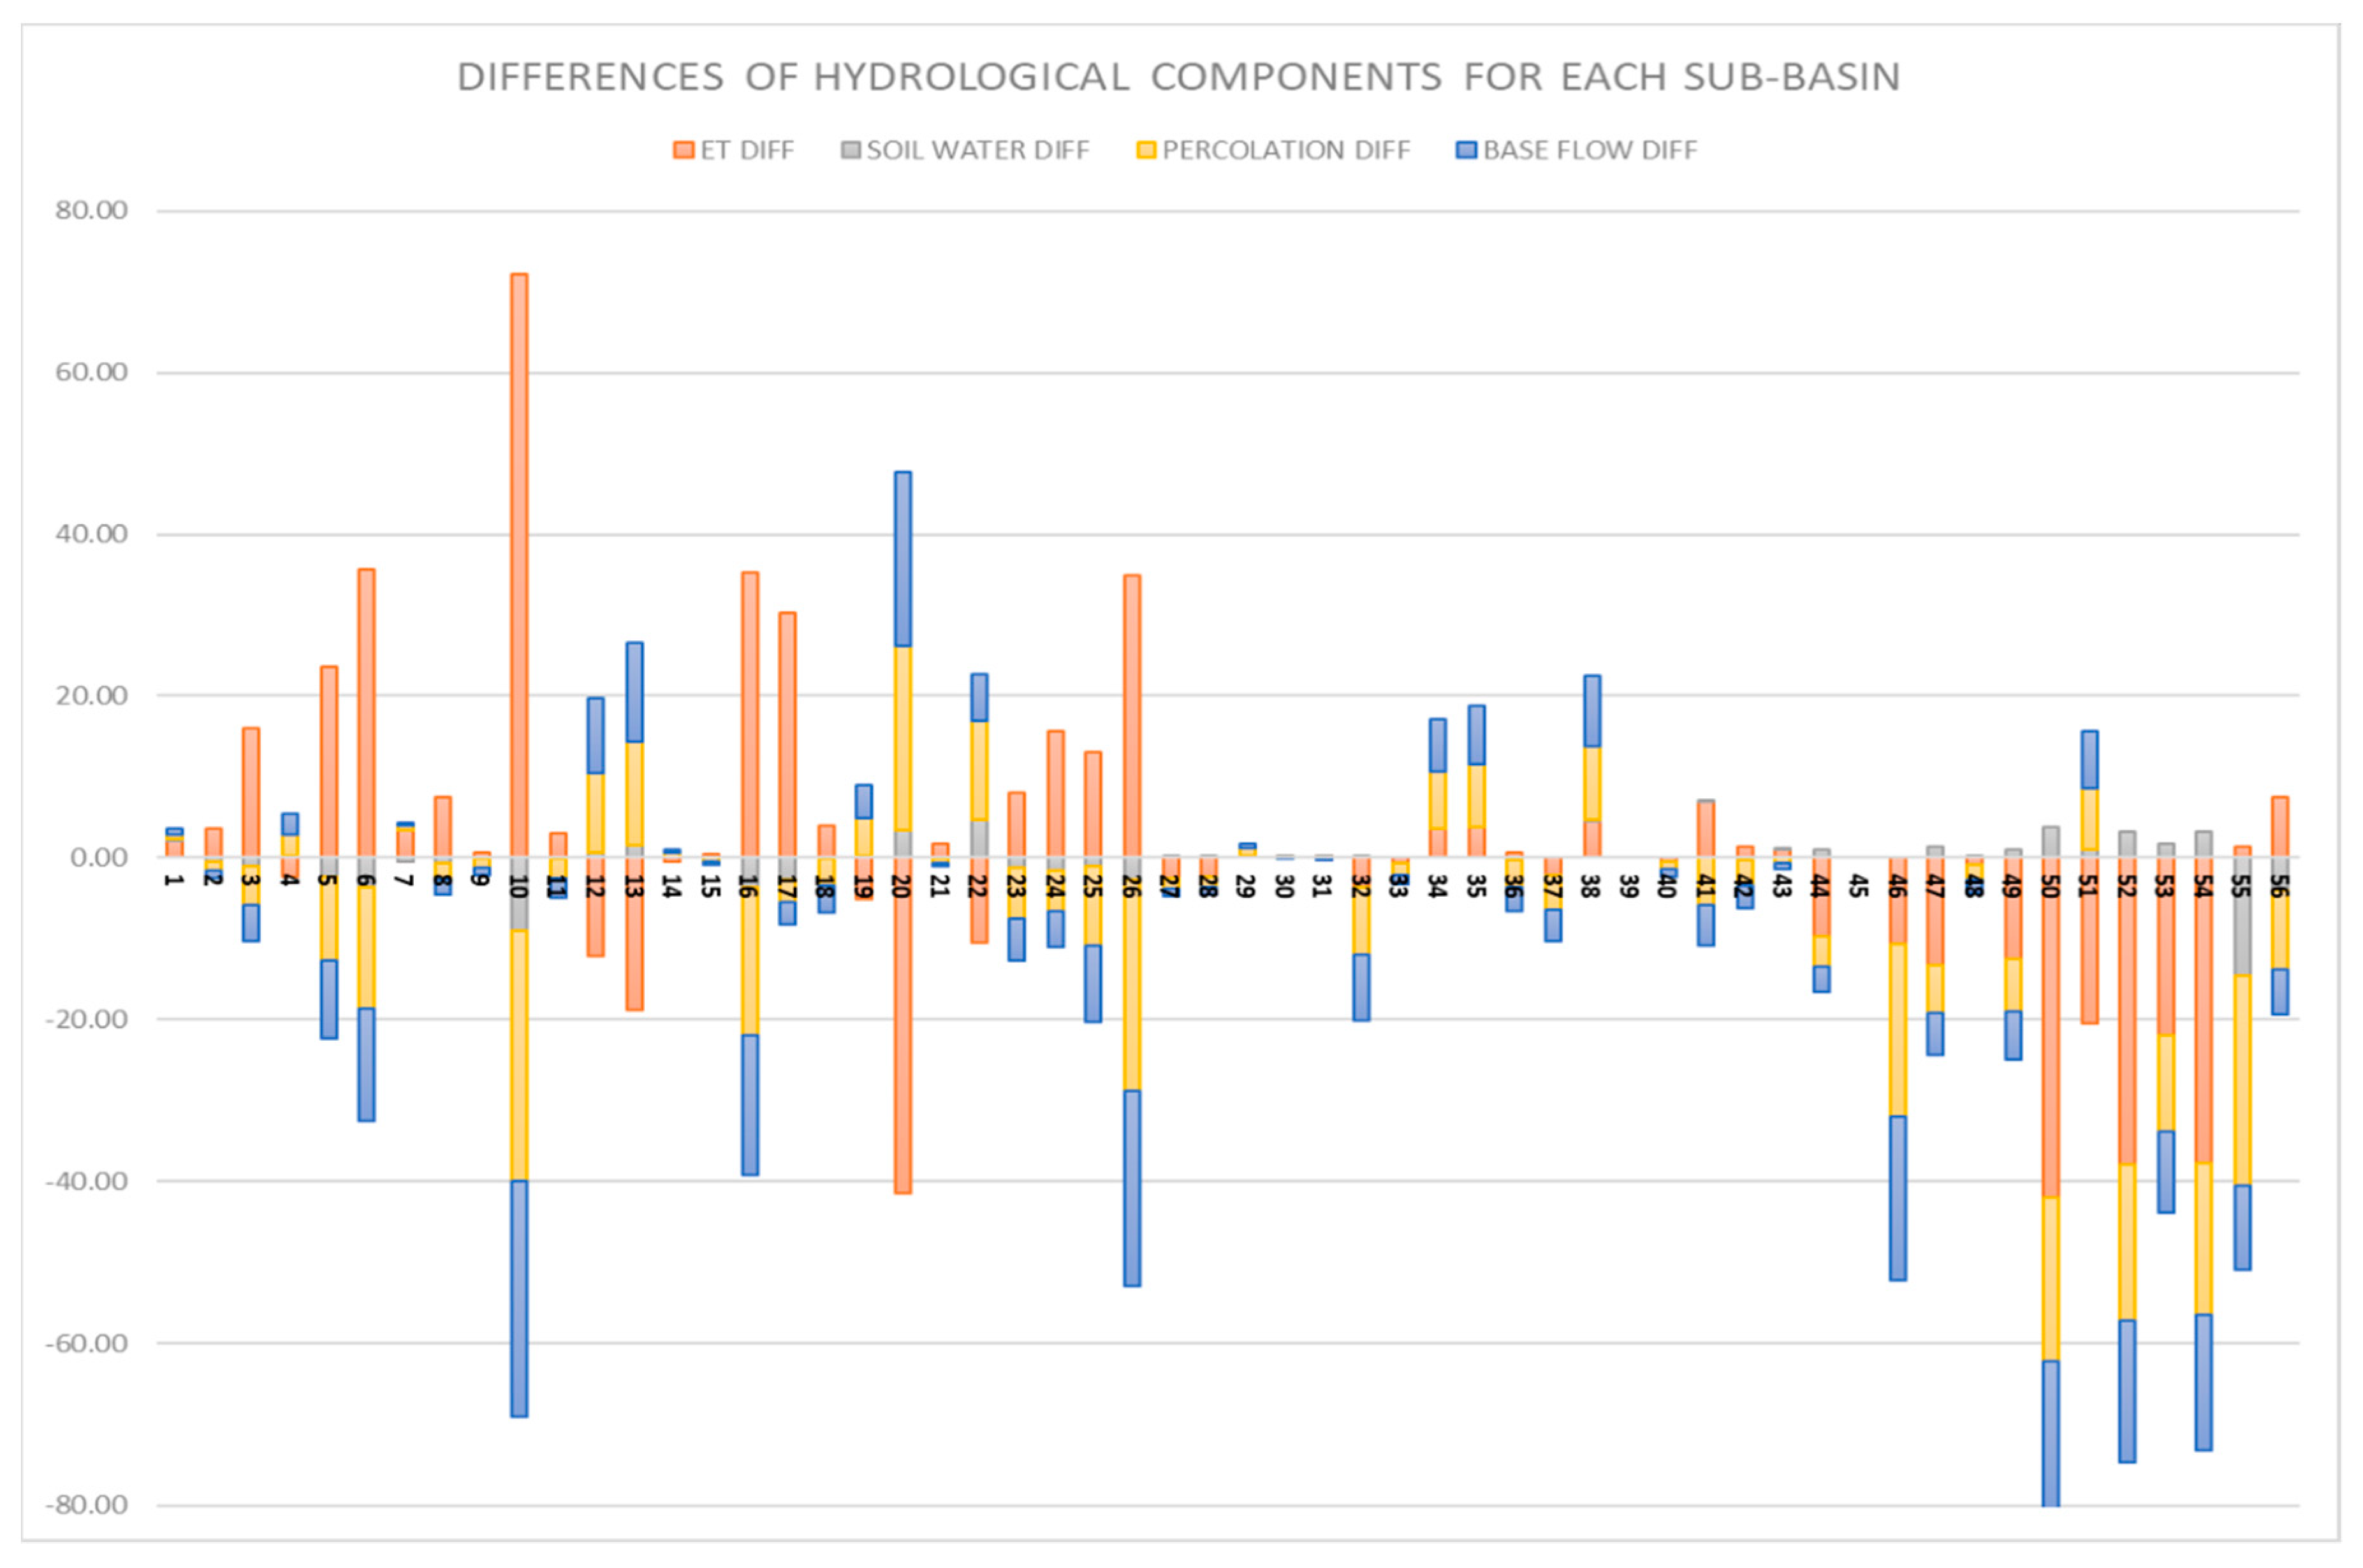
LCLUs within sub-basin level were investigated to quantify the effects of different forms of LCLU changes on the major hydrological components such as actual evapotranspiration, percolation, soil water, base flow, surface runoff and runoff. To find sub-basins that were exposed to changes of hydrological components with the modification of landscape, we calculated the long term (1980–2012) annual average values of ET, soil water, percolation and base flow for each sub-basin obtained from SWAT model outputs for S1 and S2 conducted with two different LCLU maps. Then, we found the long-term annual average differences by subtracting average values obtained from S2 and S1. As shown in Figure 4, for some sub-basins, such as 1, 2,4, 9, 11, 14, 15, 29, 30, 31, 39, and 40, only slight differences were observed for ET, soil water, percolation and base flow. However, high differences were obtained for these four hydrological components for Sub-Basins 10, 16, 20,26, 50 52, 53, 54, 55, and 56.
The first selected sub-basin representing an urbanization case is given below. This is Sub-Basin 54 in our SWAT model experiment, which exhibited considerable ET, percolation, and base flow decreases and slight soil water increase based on our long-term annual average difference calculations (Figure 4). Table 3 summarizes the LCLU changes in this sub-basin between 1990 and 2006. Class name and corresponding total occupied areas of each class for 1990 (1990 LC) and 2006 (2006 LC) years are presented in Table 4. The term Diff is used as the abbreviation for difference to show the LCLU change difference of each class between 1990 and 2006 for the selected sub-basin. We use the same terminology in Table 5. As shown in Table 4, there was an increase of urban but decrease of dryland cropland and pasture class within this sub-basin caused by the conversion of dryland cropland and pasture to urban areas, which is one form of urbanization that the catchment has experienced. These changes resulted in decrease of actual evaporation, increase of soil water, very slight decrease of percolation, decrease of base flow, increase of surface runoff and increase of runoff for annual average values between 1973 and 2012. Since some vegetated areas were converted into impervious surfaces within this sub-basin, actual evapotranspiration decrease and surface runoff increase were more significant compared to changes of other hydrological components. Annual time series of these hydrological components complied with the generalized average difference obtained for each sub-basin
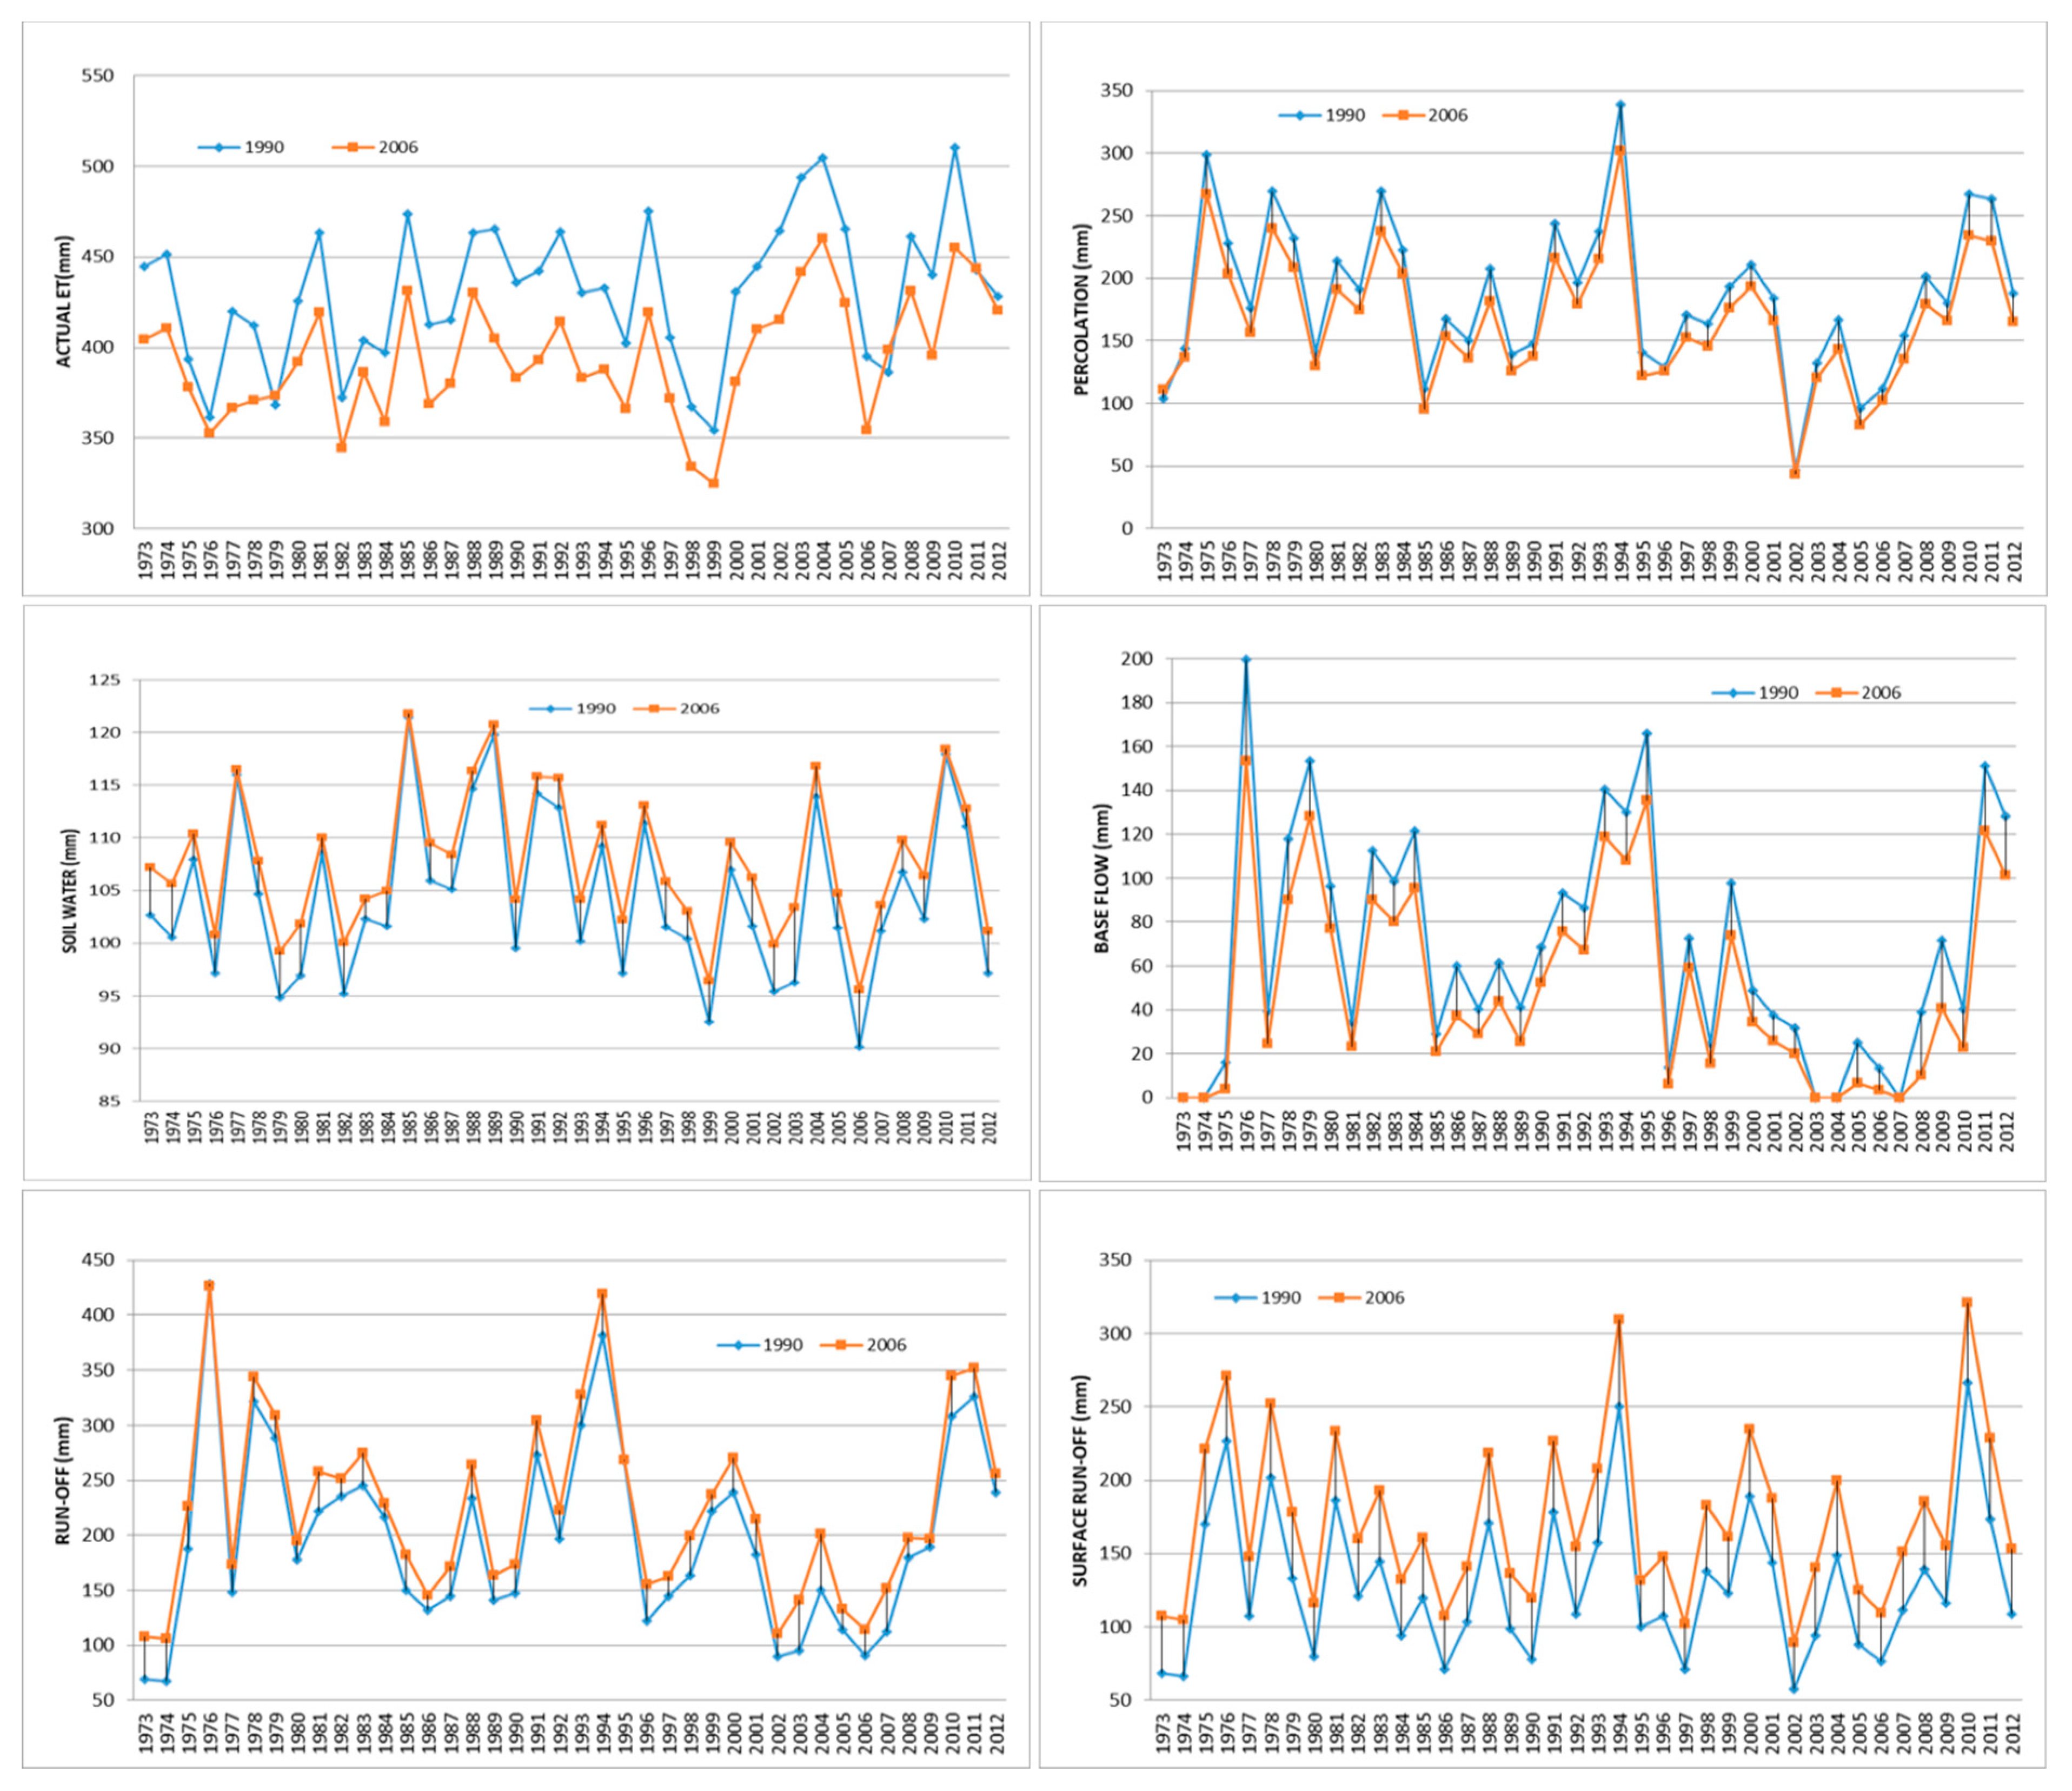
Changes in annual average patterns of actual evapotranspiration, percolation, soil water, base flow, surface runoff and runoff are presented at Figure 5. Average annual increase of the annual average actual evapotranspiration for the forty-year period was obtained as approximately 40 mm/year. Maximum annual average decrease of evapotranspiration was approximately 60 mm for 1989 and minimum annual average decrease was approximately 10 mm for 1983. Our results indicate that, in general, the highest differences for annual average actual evapotranspiration as a result of urbanization were obtained under extreme conditions such as in 1989 and 1990, which were recorded as dry years for Marmara Region, and 2010, a wet year.
LCLU changes between 1990 and 2006 for the second selected sub-basin is presented in Table 5. Similar patterns were obtained for the second sub-basin in which Dryland Cropland and Pasture were converted to urbanized areas.
In these two sub-basins, the LCLU change type was basically urbanization resulted in loss of fertile soils (Dryland Cropland and Pasture conversion to urban areas); reductions in actual evapotranspiration, percolation and base flow of the basin; and potentially increased surface runoff and runoff, which might further impact flood frequency and intensity [47,48,49]. Increased runoff and declined base flow and actual evapotranspiration would have negative impacts on water resources, especially in relation to erosion and sedimentation.
In most parts of the water basin, mostly dryland agriculture and pasture areas were converted into urban areas. Table 6 and Table 7 illustrates different forms of LCLU changes.
In the third selected sub-basin (Sub-Basin 11), most of the grasslands were converted into Dryland Cropland and Pasture class where cultivation land expanded clearly and resulted in decrease (average 40 mm) of actual evaporation, increase (5 mm) of soil water, very slight increase (10 mm) of percolation, increase of (20 mm) base flow, almost no change in surface runoff and increase (20 mm) of runoff.
The main LCLU changes within the fourth selected sub-basin (Sub-Basin 36), was conversion of Dryland Cropland, Pasture and Grassland, mostly into Irrigated Cropland and Pasture. There was a decrease (average 50 mm) of actual evaporation, increase (5 mm) of soil water, decrease (20 mm) of percolation, decrease of (20 mm) base flow, increase of surface runoff (40 mm) and increase (20 mm) of runoff. Conversion from dry to irrigated agriculture significantly changed the hydrological flows and actual evaporation. Among all on the sub-basins, the highest percolation decrease and surface runoff increase were observed in this region as a result of agricultural practice change.
Table 8 summarizes four different sub-basins that experienced urbanization in different amounts and resulting changes on annual average actual evapotranspiration, percolation, soil water, base flow, surface runoff and runoff. Dryland Cropland and Pasture areas were converted to urban areas between 1990 and 2006 and urban areas increased 2.01 km2, 0.31 km2 and 0.26 km2 for Sub-Basins 1, 2 and 3, respectively. For the fourth sub-basin, conversion from not only Dryland Cropland and Pasture (2.80 km2) but also from Grassland (0.12 km2) occurred and resulted in urban area (2.92 km2) increase.
4. Conclusions
Changes of hydrological components in Buyukcekmece Watershed of Istanbul with respect to changing LCLU were evaluated using SWAT model. Our results show that, under same climatic conditions, LCLU change played a significant role, since these changes affected surface runoff, runoff and, soil water, actual evaporation, percolation and base flow. In general, urbanization resulted in reductions in actual evapotranspiration, percolation and base flow of the sub-basins, and potentially increased surface runoff and runoff. The amount of increase or decrease for hydrological components was amplified in extreme years, which were recorded as extremely dry or wet. Although base flow and runoff showed parallel increase and decrease in most cases for different LCLU changes, surface runoff mostly reacted to urbanization with some increasing values, but did not represent significant changes for other LCLU changes.
LCLU changes impacts on hydrological components should be considered by policymakers involved in land use planning and watershed management for sustainable and effective management of water resources and prepare environmentally positive land use plans. Future projections of land cover/use could be modeled using remote sensing technology and land use models and simulated future land cover/use could be introduced to hydrological models to simulate the impacts of different land cover/use change scenarios on hydrological components. It is essential to produce and evaluate different projections of future water availability with respect to different land cover/use developments for the sustainable planning and management of water resources.
Author Contributions
Conceptualization, E.S., A.E. and M.Z.I.; methodology, E.S. and A.E.; software, M.Z.I., A.E. and G.C.; validation, M.Z.I., A.E. and G.C. and preparation, E.S., A.E. and M.Z.I.; formal analysis, M.Z.I. and G.C.; investigation, E.S. and M.Z.I.; resources, E.S. and A.E.; data curation, M.Z.I. and A.E.; writing—original draft preparation, E.S., M.Z.I. and A.E.; writing—review and editing, E.S., A.E. and G.C.; visualization, M.Z.I and G.C.; supervision, E.S. and A.E.; and project administration, E.S. and A.E.
Funding
This research received no external funding.
Acknowledgments
The authors would like to acknowledge the State Meteorological Institute of Turkey for making the meteorological time series available.
Conflicts of Interest
The authors declare no conflict of interest.
References
- Cotton, W.R.; Pielke, R.A. Human Impacts on Weather and Climate. Cambridge University Press: New York, NY, USA, 2017. [Google Scholar]
- Sertel, E.; Robock, A.; Ormeci, C. Impacts of land cover data quality on regional climate simulations. Int. J. Climatol. 2010, 30, 1942–1953. [Google Scholar] [CrossRef]
- Mahmood, R.; Pielke, R.A.; Hubbard, K.G.; Niyogi, D.; Dirmeyer, P.A.; McAlpine, C.; Carleton, A.M.; Hale, R.; Gameda, S.; Beltrán-Przekurat, A.; et al. Land cover changes and their biogeophysical effects on climate. Int. J. Climatol. 2014, 34, 929–953. [Google Scholar] [CrossRef]
- Eric, F.; Lambin, B.L.; Turner, H.J.; Geist, S.B.; Agbola, A.A.; John, W.; Bruce, O.T.; Coomes, R.D.; Günther., F.; Carl Folke, P.S.; et al. The causes of land-use and land-cover change: moving beyond the myths. Glob. Environ. Chang. 2001, 11, 261–269. [Google Scholar] [CrossRef]
- Napoli, M.; Massetti, L.; Orlandini, S. Hydrological response to land use and climate changes in a rural hilly basin in Italy. CATENA 2017, 157, 1–11. [Google Scholar] [CrossRef]
- Zhang, L.; Karthikeyan, R.; Bai, Z.; Srinivasan, R. Analysis of streamflow responses to climate variability and land use change in the Loess Plateau region of China. Catena 2017, 154, 1–11. [Google Scholar] [CrossRef]
- Cao, W.; Bowden, W.B.; Davie, T. Modelling impacts of land cover change on critical water resources in the Motueka River catchment, New Zealand. Water Resour. Manag. 2009, 23, 137–151. [Google Scholar] [CrossRef]
- Butt, A.; Shabbir, R.; Ahmad, S.S.; Aziz, N. Land use change mapping and analysis using Remote Sensing and GIS: A case study of Simly watershed, Islamabad, Pakistan. Egypt. J. Remote Sens. Space Sci. 2015, 18, 251–259. [Google Scholar] [CrossRef] [Green Version]
- Yan, R.; Zhang, X.; Yan, S.; Zhang, J.; Chen, H. Spatial patterns of hydrological responses to land use/cover change in a catchment on the Loess Plateau, China. Ecol. Indic. 2017. [Google Scholar] [CrossRef]
- Wei, X.; Zhang, M. Quantifying streamflow change caused by forest disturbance at a large spatial scale: A single watershed study. Water Resour. Res. 2010, 46, 1–15. [Google Scholar] [CrossRef]
- Pitman, A.J. The Evolution of, And Revolution In, Land Surface Schemes Designed For Climate Models. Int. J. Climatol. 2003, 23, 479–510. [Google Scholar] [CrossRef]
- Sy, S.; Noblet-Ducoudre, N.; Quesada, B.; Sy, I.; Dieye, A.M.; Gaye, A.T.; Sultan, B. Land-Surface Characteristics and Climate in West Africa: Models’ Biases and Impacts of Historical Anthropogenically-Induced Deforestation. Sustainability 2017, 9, 1917. [Google Scholar] [CrossRef]
- Pielke, R.A., Sr. Documentation of uncertainties and biases associated with surface temperature measurement sites for climate change assessment. Bull. Am. Meteorol. Soc. 2007, 88, 913–928. [Google Scholar] [CrossRef]
- Lee, S.J.; Berbery, E.H. Land Cover Change Effects on the Climate of the La Plata Basin. J. Hydrometeorol. 2012, 13, 84–102. [Google Scholar] [CrossRef]
- Marland, G. The climatic impacts of land surface change and carbon management, and the implications for climate-change mitigation policy. Clim. Policy 2003, 3, 149–157. [Google Scholar] [CrossRef] [Green Version]
- Matheussen, B.; Kirschbaum, R.L.; Goodman, I.A.; O’Donnell, G.M.; Lettenmaier, D.P. Effects of land cover change on streamfow in the interior Columbia River basin (USA and Canada). Hydrol. Process. 2000, 14, 867–885. [Google Scholar] [CrossRef]
- Baker, T.J.; Miller, S.E. Using the Soil and Water Assessment Tool (SWAT) to assess land use impact on water resources in an east African watershed. J. Hydrol. 2013, 486, 100–111. [Google Scholar] [CrossRef]
- Miller, S.N.; Kepper, W.G.; Mehaffey, M.H.; Hemandez, R.C.; Miller, D.C.; Goodrich, K.K.; Heggem, W.P. Integrating landscape assessment and hydrological modelling for land cover change analysis. J. Am. Water Res. Assoc. 2002, 38, 915–929. [Google Scholar] [CrossRef]
- Nobre, C.A.; Sellers, P.J.; Shukla, J. Amazonian deforestation and regional climate change. J. Clim. 1991, 4, 957–988. [Google Scholar] [CrossRef]
- Hahmann, A.N.; Dickinson, R.E. RCCM2-BATS model over tropical South America: Application to tropical deforestation. J. Clim. 1997, 10, 1944–1964. [Google Scholar] [CrossRef]
- Costa, M.H.; Botta, A.; Cardille, J.A. Effects of large-scale changes in land cover on the discharge of the Tocantins River, Amazonia. J. Hydrol. 2003, 283, 206–217. [Google Scholar] [CrossRef]
- Chu, M.L.; Knouft, J.H.; Ghulam, A.; Guzman, J.A.; Pan, Z. Impacts of urbanization on river flow frequency: A controlled experimental modeling-based evaluation approach. J. Hydrol. 2013, 495, 1–12. [Google Scholar] [CrossRef]
- Neitsch, S.L.; Arnold, J.G.; Kiniry, J.R.; Williams, J.R. Soil and Water Assessment Tool Theoretical Documentation Version 2009; Texas Agricultural Experiment Station: College Station, TX, USA, 2011. [Google Scholar]
- Imamoglu, Z.; Sertel, E. Analysis of different interpolation methods for soil moisture mapping using field measurements and remotely sensed data. Int. J. Environ. Geoinform. 2016, 3, 11–25. [Google Scholar] [CrossRef]
- Copernicus Program. Available online: https://land.copernicus.eu/pan-european/corine-land-cover (accessed on 22 May 2019).
- Arnold, J.G.; Srinivasan, R.; Muttiah, R.S.; Williams, J.R. Large area hydrologic modeling and assessment-Part 1: Model development. J. Am. Water Resour. Assoc. 1998, 34, 73–89. [Google Scholar] [CrossRef]
- Gassman, P.W.; Sadeghi, A.M.; Srinivasan, R. Applications of the SWAT model special section: Overview and insights. J. Environ. Qual. 2014, 43, 1–8. [Google Scholar] [CrossRef]
- Douglas-Mankin, K.R.; Srinivasan, R.; Arnold, J.G. Soil and Water Assessment Tool (SWAT) model: Current developments and applications. Trans. ASABE 2010, 53, 1423–1431. [Google Scholar] [CrossRef]
- Wu, Y.; Chen, J. Modeling of soil erosion and sediment transport in the East River Basin in southern China. Sci. Total Environ. 2012, 441, 159–168. [Google Scholar] [CrossRef] [PubMed]
- Wilson, C.O.; Weng, Q. Simulating the impacts of future land use and climate changes on surface water quality in the Des Plaines River Watershed, Chicago Metropolitan Statistical Area, Illinois. Sci. Total Environ. 2011, 409, 4387–4405. [Google Scholar] [CrossRef]
- Gassman, P.W.; Reyes, M.R.; Green, C.H.; Arnold, J.G. The soil and water assessment tool: Historical development, applications, and future research directions. Trans. ASABE 2007, 50, 1211–1250. [Google Scholar] [CrossRef]
- Narula, K.K.; Gosain, A.K. Modeling hydrology, groundwater recharge and non-point nitrate loadings in the Himalayan Upper Yamuna Basin. Sci. Total Environ. 2013, 468–469, S102–S116. [Google Scholar] [CrossRef]
- Abbaspour, K.C.; Johnson, C.A.; van Genuchten, M.T. Estimating Uncertain Flow and Transport Parameters Using a Sequential Uncertainty Fitting Procedure. Vadose Zone J. 2004, 3, 1340–1352. [Google Scholar] [CrossRef]
- State Meteorological Institute of Turkey. Available online: https://www.mgm.gov.tr/ (accessed on 22 May 2019).
- Abbaspour, K.C.; Yang, J.; Maximov, I.; Siber, R.; Bogner, K.; Mieleitner, J.; Zobrist, J.; Srinivasan, R. Modelling hydrology and water quality in the pre-alpine/alpine Thur watershed using SWAT. J. Hydrol. 2007, 333, 413–430. [Google Scholar] [CrossRef]
- Mekonnen, M.A.; Wörman, A.; Dargahi, B.; Gebeyehu, A. Hydrological modelling of Ethiopian catchments using limited data. Hydrol. Process. 2009, 23, 3401–3408. [Google Scholar] [CrossRef]
- Panagopoulos, Y.; Makropoulosa, C.; Baltas, E.; Mimikoua, M. SWAT parameterization for the identification of critical diffuse pollution source areas under data limitations. Ecol. Model. 2011, 222, 3500–3512. [Google Scholar] [CrossRef]
- Tolentino, E.; Ella, V. Assessment of SWAT Model Applicability and Performance for Predicting Surface Runoff in an Ungauged Watershed in the Philippines. IAMURE Int. J. Ecol. Conserv. 2016, 17, 142–160. [Google Scholar] [CrossRef]
- Sisay, E.; Khare, D.; Haleform, A.; Singh, L. Hydrological modelling of ungauged urban watershed using SWAT model. Model. Earth Syst. Environ. 2017, 3. [Google Scholar] [CrossRef]
- Zhang, L.; Lu, J.; Chen, X.; Sauvage, S.; Sánchez Pérez, J. Stream flow simulation and verification in ungauged zones by coupling hydrological and hydrodynamic models: a case study of the Poyang Lake ungauged zone. Hydrol. Earth Syst. Sci. 2017, 1–26. [Google Scholar] [CrossRef]
- Devi, G.K.; Ganasri, B.P.; Dwarakish, G.S. A review on hydrological models. International conference on water resources, coastal and ocean engineering (ICWRCOE’15). Aquat. Proc. 2015, 4, 1001–1007. [Google Scholar]
- Stehr, A.; Debels, P.; Romero, F.; Alcayaga, H. Hydrological Modelling with SWAT under Conditions of Limited Data Availability: Evaluation of Results from A Chilean Case Study. Hydrol. Sci. J. 2008, 53, 588–601. [Google Scholar] [CrossRef]
- Du, B.; Ji, X.; Harmel, D.R.; Hauck, L. Evaluation of a Watershed Model for Estimating Daily Flow Using Limited Flow Measurements1. J. Am. Water Resour. Assoc. 2009, 45, 475–484. [Google Scholar] [CrossRef]
- Abbaspour, K.C.; Rouholahnejad, E.; Vaghefi, S.; Srinivasan, R.; Yang, H.; Klove, B. A continental-scale hydrology and water quality model for Europe: Calibration and uncertainty of a high-resolution large-scale SWAT model. J. Hydrol. 2015, 524, 733–752. [Google Scholar] [CrossRef] [Green Version]
- Abbaspour, K.C. User Manual for SWAT-CUP, SWAT Calibration and Uncertainty Analysis Programs; Eawag: Zurich, Switzerland, 2011. [Google Scholar]
- Cuceloglu, G.; Abbaspour, K.C.; Ozturk, I. Assessing the Water-Resources Potential of Istanbul by Using a Soil and Water Assessment Tool (SWAT) Hydrological Model. Water 2017, 9, 814. [Google Scholar] [CrossRef]
- Aronica, G.; Cannarozzo, M. Studying the hydrological response of urban catchments using a semi-distributed linear non-linear model. J. Hydrol. 2000, 238, 35–43. [Google Scholar] [CrossRef]
- Rose, S.; Peters, N.E. Effects of urbanization on streamflow in the Atlanta area (Georgia, USA): a comparative hydrological approach. Hydrol. Process. 2001, 15, 1441–1457. [Google Scholar] [CrossRef]
- Ettehadi Osgouei, P.; Kaya, S.; Sertel, E.; Alganci, U. Separating Built-Up Areas from Bare Land in Mediterranean Cities Using Sentinel-2A Imagery. Remote Sens. 2019, 11, 345. [Google Scholar] [CrossRef]
Figure 1.
Study area.

Figure 2.
The 1990 and 2006 LCLU maps of the study area and locations of the meteorological stations.
Figure 2.
The 1990 and 2006 LCLU maps of the study area and locations of the meteorological stations.

Figure 3.
Flow duration curve at the gauge station after first step calibration.

Figure 4.
Differences of long-term annual average ET, soil water, percolation and base flow.

Figure 5.
Annual average actual evapotranspiration, percolation, soil water, base flow, surface runoff and runoff time-series with two different LC in the first sub-basin.
Figure 5.
Annual average actual evapotranspiration, percolation, soil water, base flow, surface runoff and runoff time-series with two different LC in the first sub-basin.


Table 1.
LCLU classes obtained for 1990 and 2006.
| CODE | CLASS NAME | 1990 (Ha) | 2006 (Ha) | DIFF | 1990 (%) | 2006 (%) | DIFF (%) |
|---|---|---|---|---|---|---|---|
| 1 | Urban Area | 2505.15 | 4267.38 | 1762.24 | 4.12 | 7.01 | 2.89 |
| 2 | Dryland Cropland and Pasture | 40750.24 | 38608.49 | −2141.75 | 67.04 | 63.44 | −3.60 |
| 3 | Irrigated Cropland and Pasture | - | 1236.68 | 1236.68 | - | 2.03 | 2.03 |
| 6 | Cropland/Woodland Mosaic | 2101.68 | 2172.98 | 71.30 | 3.46 | 3.57 | 0.11 |
| 7 | Grassland | 1932.78 | 1761.05 | −171.73 | 3.18 | 2.89 | −0.29 |
| 9 | Mixed Grassland/Shrubland | 4252.60 | 2304.51 | −1948.08 | 7.00 | 3.79 | −3.21 |
| 11 | Deciduous Broadleaf Forest | 8281.36 | 9173.23 | 891.87 | 13.62 | 15.07 | 1.45 |
| 14 | Evergreen Needleaf Forest | 34.41 | 502.39 | 467.99 | 0.06 | 0.83 | 0.77 |
| 15 | Mixed Forest | 861.42 | 726.04 | −135.38 | 1.42 | 1.19 | −0.22 |
| 16 | Water bodies | 67.23 | 110.19 | 42.96 | 0.11 | 0.18 | 0.07 |
Table 2.
Comparison of the basic land use distribution of the entire watershed with the gauged (pre-calibrated) area.
Table 2.
Comparison of the basic land use distribution of the entire watershed with the gauged (pre-calibrated) area.
| Land Use-Land Cover | Percentage of Area Covered in the Entire Watershed | Percentage of Area Covered in the Calibrated Area |
|---|---|---|
| Agriculture | 70.1 | 64.4 |
| Forest | 15.2 | 20.8 |
| Grassland | 14.7 | 14.8 |
Table 3.
Model parameters, their description, and sensitivity analysis results (see SWAT-CUP manual [45] for more details on parameterization).
Table 3.
Model parameters, their description, and sensitivity analysis results (see SWAT-CUP manual [45] for more details on parameterization).
| Parameters | Description | t Value | p Value |
|---|---|---|---|
| r__CN2.mgt | SCS runoff curve number for moisture condition II | −37.34 | 0.00 |
| v__SOL_AWC.sol | Soil available water storage capacity (mm H2O/mm soil) | 2.86 | 0.004 |
| v__ESCO.hru | Soil evaporation compensation factor | −2.46 | 0.014 |
| r__GW_REVAP.gw | Groundwater revap. Coefficient | 1.77 | 0.076 |
| v__GWQMN.gw | Threshold depth of water in shallow aquifer for return flow (mm) | 0.95 | 0.343 |
| r__REVAPMN.gw | Threshold depth of water in the shallow aquifer for “revap” (mm) | −1.07 | 0.281 |
Table 4.
LCLU changes between 1990 and 2006 in the first selected sub-basin (sub-basin 54).
| Class Code | Class Name | 1990 LC (km2) | 2006 LC (km2) | Diff (km2) |
|---|---|---|---|---|
| 1 | Urban Area | 0.73 | 2.75 | 2.01 |
| 2 | Dryland Cropland and Pasture | 2.66 | 0.69 | −1.98 |
Table 5.
LCLU changes between 1990 and 2006 in the second sub-basin.
| Class Code | Class Name | 1990 LC (km2) | 2006 LC (km2) | Diff (km2) |
|---|---|---|---|---|
| 1 | Urban Area | 0.04 | 0.36 | 0.31 |
| 2 | Dryland Cropland and Pasture | 0.45 | 0.13 | −0.31 |
Table 6.
LCLU changes between 1990 and 2006 in the third selected sub-basin (Sub-Basin 11).
| Class Code | Class Name | 1990 LC (km2) | 2006 LC (km2) | Diff (km2) |
|---|---|---|---|---|
| 2 | Dryland Cropland and Pasture | 2.01 | 2.26 | 0.26 |
| 7 | Grassland | 1.29 | 1.03 | -0.25 |
Table 7.
LCLU changes between 1990 and 2006 in the fourth selected sub-basin (Sub-Basin 36).
| Class Code | Class Name | 1990 LC (km2) | 2006 LC (km2) | Diff (km2) |
|---|---|---|---|---|
| 1 | Urban Area | 0.08 | 0.25 | 0.16 |
| 2 | Dryland Cropland and Pasture | 7.20 | 3.07 | −4.13 |
| 3 | Irrigated Cropland and Pasture | - | 4.55 | 4.55 |
| 7 | Grassland | 0.58 | - | −0.58 |
Table 8.
Statistics of differences in average annual actual ET, percolation, soil water, surface runoff, base flow and runoff values as a result of changing land cover.
Table 8.
Statistics of differences in average annual actual ET, percolation, soil water, surface runoff, base flow and runoff values as a result of changing land cover.
| Actual ET | Surface Runoff | ||||||||
| 1 | 2 | 3 | 4 | 1 | 2 | 3 | 4 | ||
| MIN | −60.46 | −66.86 | −61.75 | −30.54 | MIN | 30.94 | 32.98 | 31.26 | 15.39 |
| MAX | −17.88 | −20.28 | −18.04 | −2.33 | MAX | 59.86 | 68.73 | 65.56 | 45.08 |
| AVERAGE | −41.96 | −46.71 | −42.30 | −13.14 | AVERAGE | 43.34 | 47.45 | 45.20 | 26.44 |
| Percolation | Base Flow | ||||||||
| 1 | 2 | 3 | 4 | 1 | 2 | 3 | 4 | ||
| MIN | −36.58 | −39.62 | −37.74 | −34.52 | MIN | −45.97 | −35.45 | −32.86 | −31.00 |
| MAX | −2.70 | −2.81 | −2.60 | −12.25 | MAX | −7.66 | −7.94 | −8.26 | −7.81 |
| AVERAGE | −19.64 | −21.21 | −20.25 | −21.69 | AVERAGE | −19.38 | −20.94 | −19.88 | −20.40 |
| Soil Water | Run Off | ||||||||
| 1 | 2 | 3 | 4 | 1 | 2 | 3 | 4 | ||
| MIN | −0.82 | 0.65 | 0.46 | 0.38 | MIN | 7.52 | 10.33 | 8.42 | −5.06 |
| MAX | 0.38 | 8.04 | 7.48 | 7.13 | MAX | 51.44 | 56.09 | 52.38 | 15.55 |
| AVERAGE | −0.03 | 3.71 | 3.22 | 3.16 | AVERAGE | 26.40 | 29.20 | 26.91 | 5.38 |
© 2019 by the authors. Licensee MDPI, Basel, Switzerland. This article is an open access article distributed under the terms and conditions of the Creative Commons Attribution (CC BY) license (http://creativecommons.org/licenses/by/4.0/).
Share and Cite
MDPI and ACS Style
Sertel, E.; Imamoglu, M.Z.; Cuceloglu, G.; Erturk, A. Impacts of Land Cover/Use Changes on Hydrological Processes in a Rapidly Urbanizing Mid-latitude Water Supply Catchment. Water 2019, 11, 1075. https://doi.org/10.3390/w11051075
AMA Style
Sertel E, Imamoglu MZ, Cuceloglu G, Erturk A. Impacts of Land Cover/Use Changes on Hydrological Processes in a Rapidly Urbanizing Mid-latitude Water Supply Catchment. Water. 2019; 11(5):1075. https://doi.org/10.3390/w11051075
Chicago/Turabian StyleSertel, Elif, Mehmet Zeki Imamoglu, Gokhan Cuceloglu, and Ali Erturk. 2019. "Impacts of Land Cover/Use Changes on Hydrological Processes in a Rapidly Urbanizing Mid-latitude Water Supply Catchment" Water 11, no. 5: 1075. https://doi.org/10.3390/w11051075
Note that from the first issue of 2016, this journal uses article numbers instead of page numbers. See further details here.