Article

Stable Hydrogen and Oxygen Isotope Characteristics of Bottled Water in China: A Consideration of Water Source

1
College of Geography and Environmental Science, Northwest Normal University, Lanzhou 730070, China
2
Laboratory of Atmospheric Physics, Physics Department, University of Patras, GR-265 00 Patras, Greece
3
Northeast Institute of Geography and Agroecology, Chinese Academy of Sciences, Jilin 130102, China
4
State Key Laboratory of Earth Surface Processes and Resource Ecology, Beijing Normal University, Beijing 100875, China
*
Author to whom correspondence should be addressed.
Water 2019, 11(5), 1065; https://doi.org/10.3390/w11051065
Submission received: 18 April 2019 / Revised: 16 May 2019 / Accepted: 17 May 2019 / Published: 22 May 2019
(This article belongs to the Section Water Quality and Contamination)

Abstract

:
The origin of bottled water can be identified via its stable isotope signature because of the spatial variation of the stable isotope composition of natural waters. In this paper, the spatial pattern of δ2H and δ18O values were analyzed for a total of 242 bottled water samples produced at 137 sites across China that were randomly purchased during 2014–2015. The isotopic ratios of bottled water vary between −166‰ and −19‰ for δ2H, and between −21.6‰ and −2.1‰ for δ18O. Based on multiple regression analyses using meteorological and geographical parameters, an isoscape of Chinese bottled water was created. The results showed that altitude among spatial parameters and precipitation amount and air temperature among meteorological parameters were major natural factors determining the isotopic variation of bottled water. Our findings indicate the potential and the significance of the use of stable isotopes for the source identification of bottled water. An analysis of different origin types (spring, glacier and unmarked) and several different brands of bottled water in the same location reflected different production processes and source signatures.

1. Introduction

In the past few decades, with the increasing public focus on drinking water quality worldwide, bottled or packaged water has become an important component of human dietary intake [1]. Generally, bottled water is a quality-assured water product, usually originating from local, natural water (especially surface and ground water), and sometimes from remote areas such as high-elevation glaciers and desalination of deep-sea water. Because of the possible good quality of water sources, bottled water labelled as free from human disturbance is very expensive, but the reported production location is commonly disputed. The water source origin cannot be easily identified by chemical methods, such as ion and trace elements analyses.
As a natural tracer, stable isotopes of hydrogen and oxygen are effective at diagnosing water sources [2] and have been used to detect the authenticity and origin of food or beverages, such as the origin authenticity of roasted coffee [3], the measurement of adjuncts in hard ciders [4,5], the identification of the geographical origin of milk [6,7] and to trace the authenticity and geographical origin of Italian extra-virgin olive oils [8]. Global research on bottled water indicated that the stable hydrogen and oxygen isotopes present in bottled water record information about the sources from which the water was derived [9]. In the United States, it was found that the isotopic composition of water in the body of local residents is similar to that of local tap water by comparing the δ2H and δ18O values of bottled water, beer, soda, and tap water [10]. Other researchers found that production process may influence the isotopic composition of flavored water and artificially sparkling water [11,12,13]. Some studies investigated the environmental elements that may affect the isotopic composition of bottled water (temperature, precipitation amount, altitude, latitude), and a latitude effect was exhibited in many case studies [14,15,16].
For Chinese bottled water, nationwide investigations are relatively limited. Bottled water samples produced at 36 sites were analyzed for stable isotopes and chemical ions by [17], but the water source signatures were not adequately considered. In Taiwan Island, studies examined the deep-sea drinking water available for purchase and concluded that most samples originated from local tap water, rather than the deep sea [18].
The aim of this paper was to present isoscapes of bottled water across China for the first time based on a newly compiled database, aimed as a reference for forensic identification and food science [19]. Considering the vital role of precipitation in the hydrological cycle, we compared the isotope values of bottled water and precipitation (simulated with Glable Network Isotopes in Precipitation (GNIP) and the Chinese Network of Isotopes in Precipitation (CHNIP)) in China. We also focused on the links between bottled and tap water. By comparing the stable isotope ratios of bottled water from the same production place but of different brands and types, different production processes and source characteristics were revealed and discussed.

2. Materials and Methods

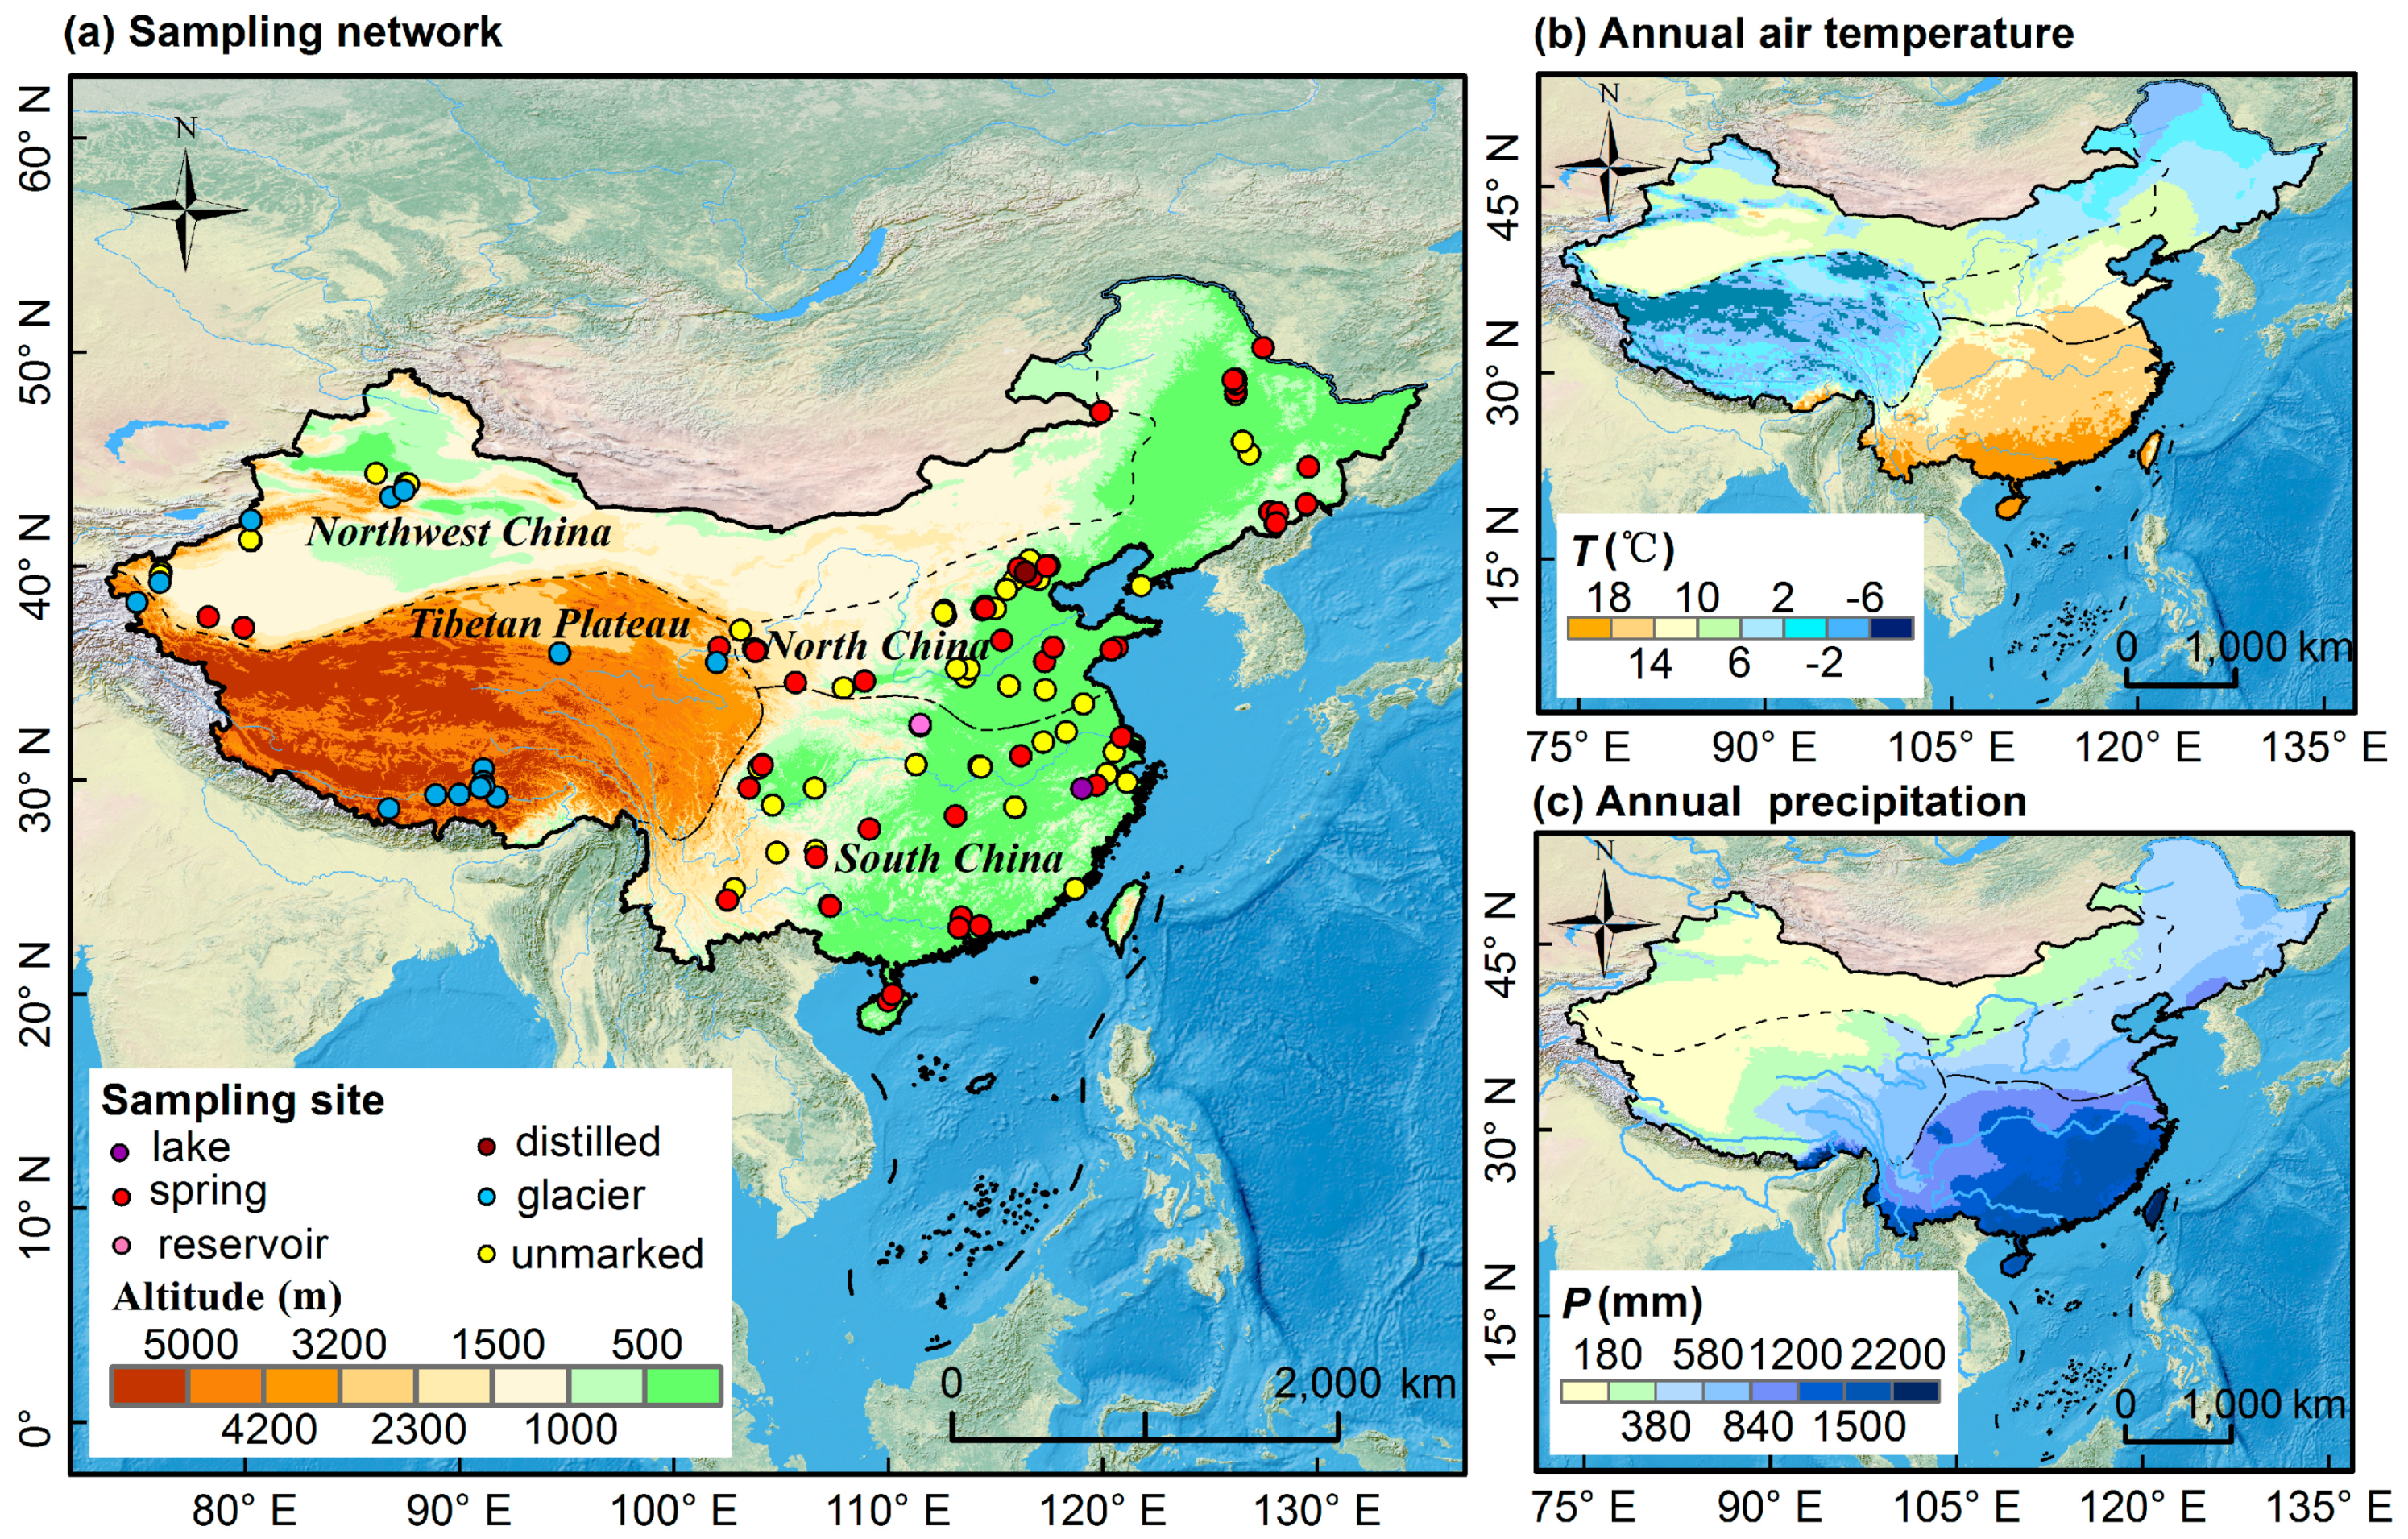
2.1. Bottled Water Isotope Database

In this study, 167 bottled water samples produced at 112 sites across China between July 2014 and December 2015 were randomly purchased by volunteers nationwide during the same period (Figure 1). All sealed water bottles were delivered to the Stable Isotope Laboratory, College of Geography and Environmental Science, Northwest Normal University, Lanzhou by express mail and were analyzed practically upon their reception in order to minimize any storage effects. The basic information on the labels of each sample, such as the brand, water source location, production date and factory were recorded. The stable oxygen and hydrogen isotope compositions were analyzed using the Liquid Water Isotope Analyzer DLT-100 (Los Gatos Research, USA) laser spectrometer. Isotope standards and samples were injected sequentially six times using a microliter syringe; the arithmetic average of the last four injections was used as the final measurement result.
The isotope ratios of 18O/16O and 2H/1H in the water samples were expressed as δ18O and δ2H, relative to their deviation from the Vienna Standard Mean Ocean Water (V-SMOW).
δ sample = R sample R standard R standard × 1000
where Rsample is the ratio of 18O/16O (2H/1H) in the water sample, and Rstandard is the ratio of 18O/16O (2H/1H) in V-SMOW [20]. The measurement uncertainty for δ18O and δ2H were ± 0.3‰ and ± 1‰, respectively.
In addition, 108 samples produced from 36 sites (three replicated samples per site) of Chinese bottled water from a previous study [17] were also taken into account. The stable hydrogen and oxygen isotope compositions were analyzed using a laser spectroscopy instrument (Los Gatos Research, USA) with the measurement uncertainty ± 0.2‰ and ± 0.6‰ for δ18O and δ2H, respectively. The samples of [17] were purchased in July 2014. Across the 36 production locations described in [17], 11 sites coincide with our sites and have similar values to corresponding sites in our database. Therefore, we only added the other 25 sites, including 75 samples that differed from our sites into our database. As presented in Figure S1 in the Supplementary Material, the stable hydrogen and oxygen isotope ratios of the 11 sites were like those of the corresponding samples in our database, and the coefficients of determination (r2) were found to be 0.960 for δ18O and 0.961 for δ2H, respectively.
Our database included a total of 242 bottled water samples from 137 sites (shown in Table S1 in the Supplementary Material), including 167 samples collected by our volunteers from 112 sites and 75 samples collected from 25 sites as originally reported [17]. According to the labels, the 242 samples from the 137 sites were classified into six types, i.e., distilled-sourced water (n = 1), glacier-sourced water (n = 16), reservoir-sourced water (n = 1), lake-sourced water (n = 1), spring-sourced water (n = 47), and unmarked sourced water (n = 71). Most unmarked source bottled water samples were purified based on their labels. Purified defines water that has been produced by distillation, deionization, reverse osmosis, or other suitable processes that meet the standards of the Chinese National Health Commission. As noted by the labels, reverse osmosis technology was used for most of the purified water samples.

2.2. Precipitation Isotope Database

We used the Regionalized Cluster-based Water Isotope Prediction (RCWIP) model version 1.00 [23,24] to understand the relationship between the stable isotope compositions of bottled water and precipitation. The global grid database has been widely applied in many areas of the world in recent years [25,26,27]. The GNIP [28] and CHNIP (Chinese Network of Isotopes in Precipitation) [29] across China were applied to verify the RCWIP database. The coefficients of determination (r2), between observations and estimates were 0.651 (δ2H) and 0.731 (δ18O), respectively, indicating that the database is generally acceptable for describing the isotope signature of precipitation in China.

2.3. Tap Water Database

A nationwide database of tap water across China for 2014–2016, provided by [27], was applied in this study. The δ2H and δ18O values of tap water collected near the production locations of various bottled water samples were selected. The sampling period of [27] coincides with this study and provides a good platform to compare the isotopic signatures of bottled water and that of local tap water. The tap water samples were analyzed using the same instrument, i.e. the Liquid Water Isotope Analyzer DLT-100 (Los Gatos Research, USA) in our laboratory; the measurement uncertainty (standard deviation) is ± 0.6‰ for δ2H and ± 0.2‰ for δ18O.

2.4. Other Databases

Previous studies [29,30] have shown that differences of latitude (L), altitude (A), precipitation amount (P), and distance from the coast (continentality effect) in different regions are major natural causes effecting the spatial distribution of precipitation; as such; we use L, A, P, air temperature (T), longitude (O), solar radiation (R), wind speed (S) and water vapor pressure (V) in China from 1970–2000, derived from the WorldClim-Global Climate Data version 2 (Fick et al. [22]; http://worldclim.org/version2), in order to understand the impact of the meteorological parameters on the spatial distribution of bottled water isotopes.

2.5. Bottled Water Isoscape Prediction AND Other Methods

Several methods based on the previous studies of tap water and precipitation isoscapes [23,27,30,31,32,33,34,35] were considered in order to predict a more accurate bottled water spatial distribution. Candidate methods include: (1) A model that uses latitude and elevation was proposed for the first time by Bowen et al. [31] (δ = aL2 + bL + cA + d) in order to predict global precipitation isotopes signatures. This model has been well applied to the United States tap water isotopes [36] and to isotopes of precipitation in China [30,34]; (2) a multiple method was applied in [37] for Chinese tap water: δ = aL + bO + cA + d; (3) another model that uses meteorological parameters in [37] is δ = aT + bP + c; (4) more meteorological parameters have been included in the multiple regression δ = aT + bP + cR + dS+ eV + f; (5) similar to [31], L, O, A, L2, O2, and A2 were added in a stepwise regression; (6) from [29] and [32], the stepwise regression includes T, P, R, S, V, T2, P2, R2, S2 and V2; (7) based on all 16 parameters (L, O, A, T, P, R, S, V, L2, O2, A2, T2, P2, R2, S2 and V2) mentioned in [27], eight parameters (P, P2, T, T2, V, V2, A, and A2) with higher correlation coefficients (shown in Table S2 in the Supplementary Material) with bottled water were selected for stepwise regression fitting.
We compared the coefficient of determination (r2), the Akaike’s Information Criterion (AIC) which estimates of a measure of fit of the model [38], the mean absolute error (MAE) that can accurately reflect the actual prediction error, the mean bias error (MBE) representing the deviation of any value in a set of measurements, and the root mean square error (RMSE) that can reflect the accuracy of the measurement to select the most accurate model to determine the bottled water isoscape in China. The higher the r2 and the smaller the absolute values of other indicators, the more accurate the simulation results. According to the above selection criteria, we chose the last method to predict the bottled water isoscape. The long-term climatic parameters are derived from the WorldClim-Global Climate Data version 2 ([22]; (https://lta.cr.usgs.gov/GTOPO30)). The spatial parameters for China are derived from the Global 30 Arc-Second Elevation map. The IDW (inverse distance weighted) method was used in the final isoscape, which is a combination of regressed estimates and interpolated residual error. Pearson’s correlation (r) and linear regression were applied in this study. Because the t-test seem to be the most used for meteoric water lines [39], we used a t-test for the comparison of linear regression slopes.

3. Results and Discussion

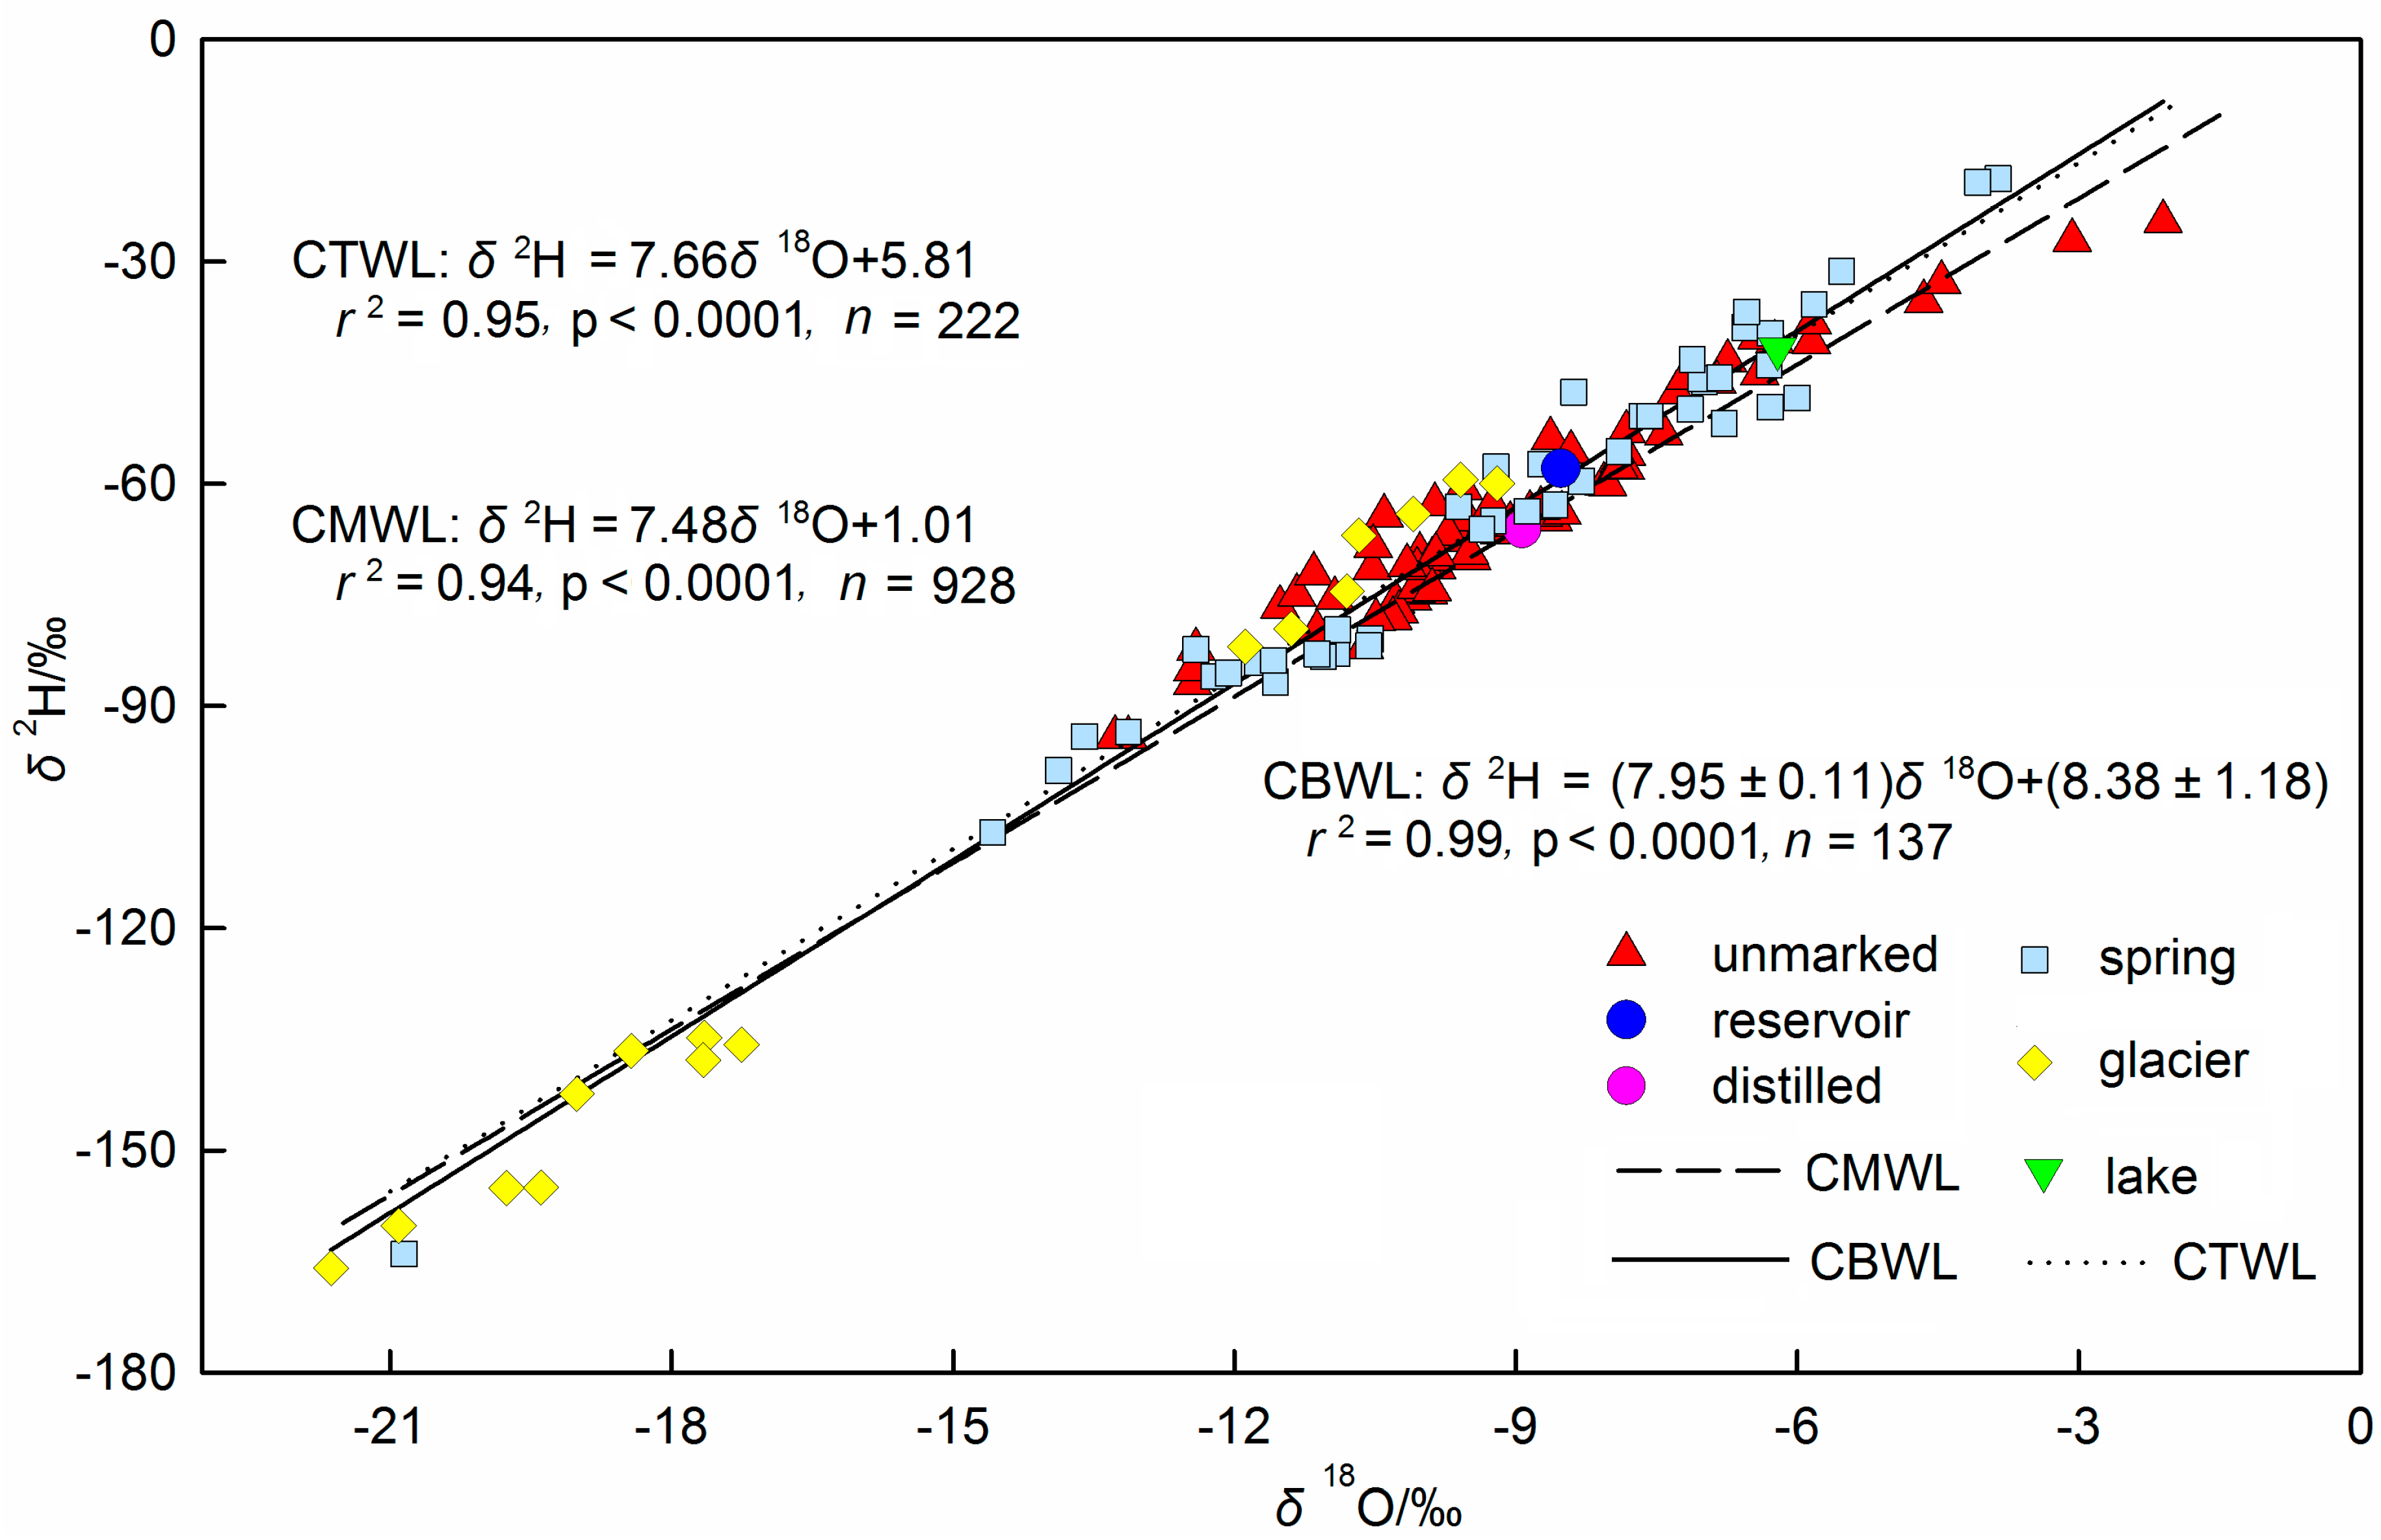
3.1. Basic Isotopic Characteristics of Bottled Water

A database of stable hydrogen and oxygen isotopes of bottled water sampled across China was developed. As shown in Table 1, there is significant variation in the δ18O and δ2H values of bottled water. The values of δ18O of all samples vary from −2.1‰ to −21.6‰ and those of δ2H vary from −19‰ to −166‰. It is the spring-sourced bottled water that demonstrates the largest variation in δ2H and δ18O values (145 ‰ and 11.7 ‰, respectively) among the three types of bottled water, while variation is smallest for water extracted from unmarked samples (70‰, and 11.2‰, respectively).
The δ2H and δ18O values of all bottled water exhibit significant covariance (Figure 2). Best-fit lines for the Chinese bottled water (CBWL), Chinese tap water (CTWL) [27] using station means, and Chinese meteoric water (CMWL) [29] are described by the equations:
δ 2 H = ( 7.95 ± 0.11 ) δ 18 O + ( 8.36 ± 1.18 ) ,   r 2 = 0.973 , p < 0.0001 , n = 137
δ 2 H = 7.66 δ 18 O + 5.81 ,   r 2 = 0.95 , p < 0.0001 , n = 222
δ 2 H = 7.48 δ 18 O + 1.01 ,   r 2 = 0.94 , p < 0.0001 , n = 928
The difference between the slopes of the bottled water, meteoric precipitation, and tap water lines (a = 7.95, 7.66, and 7.48, respectively) is not statistically significant (p > 0.05). The slope of the bottled water regression line is identical to the slope of the Global Meteoric Water Line (GMWL: δ2H = 8.14 (± 0.02) δ18O + 10.9 (± 0.2), r = 0.98) [40], which depicts the global relationship between δ2H and δ18O.

3.2. Isoscape of Chinese Bottled Water

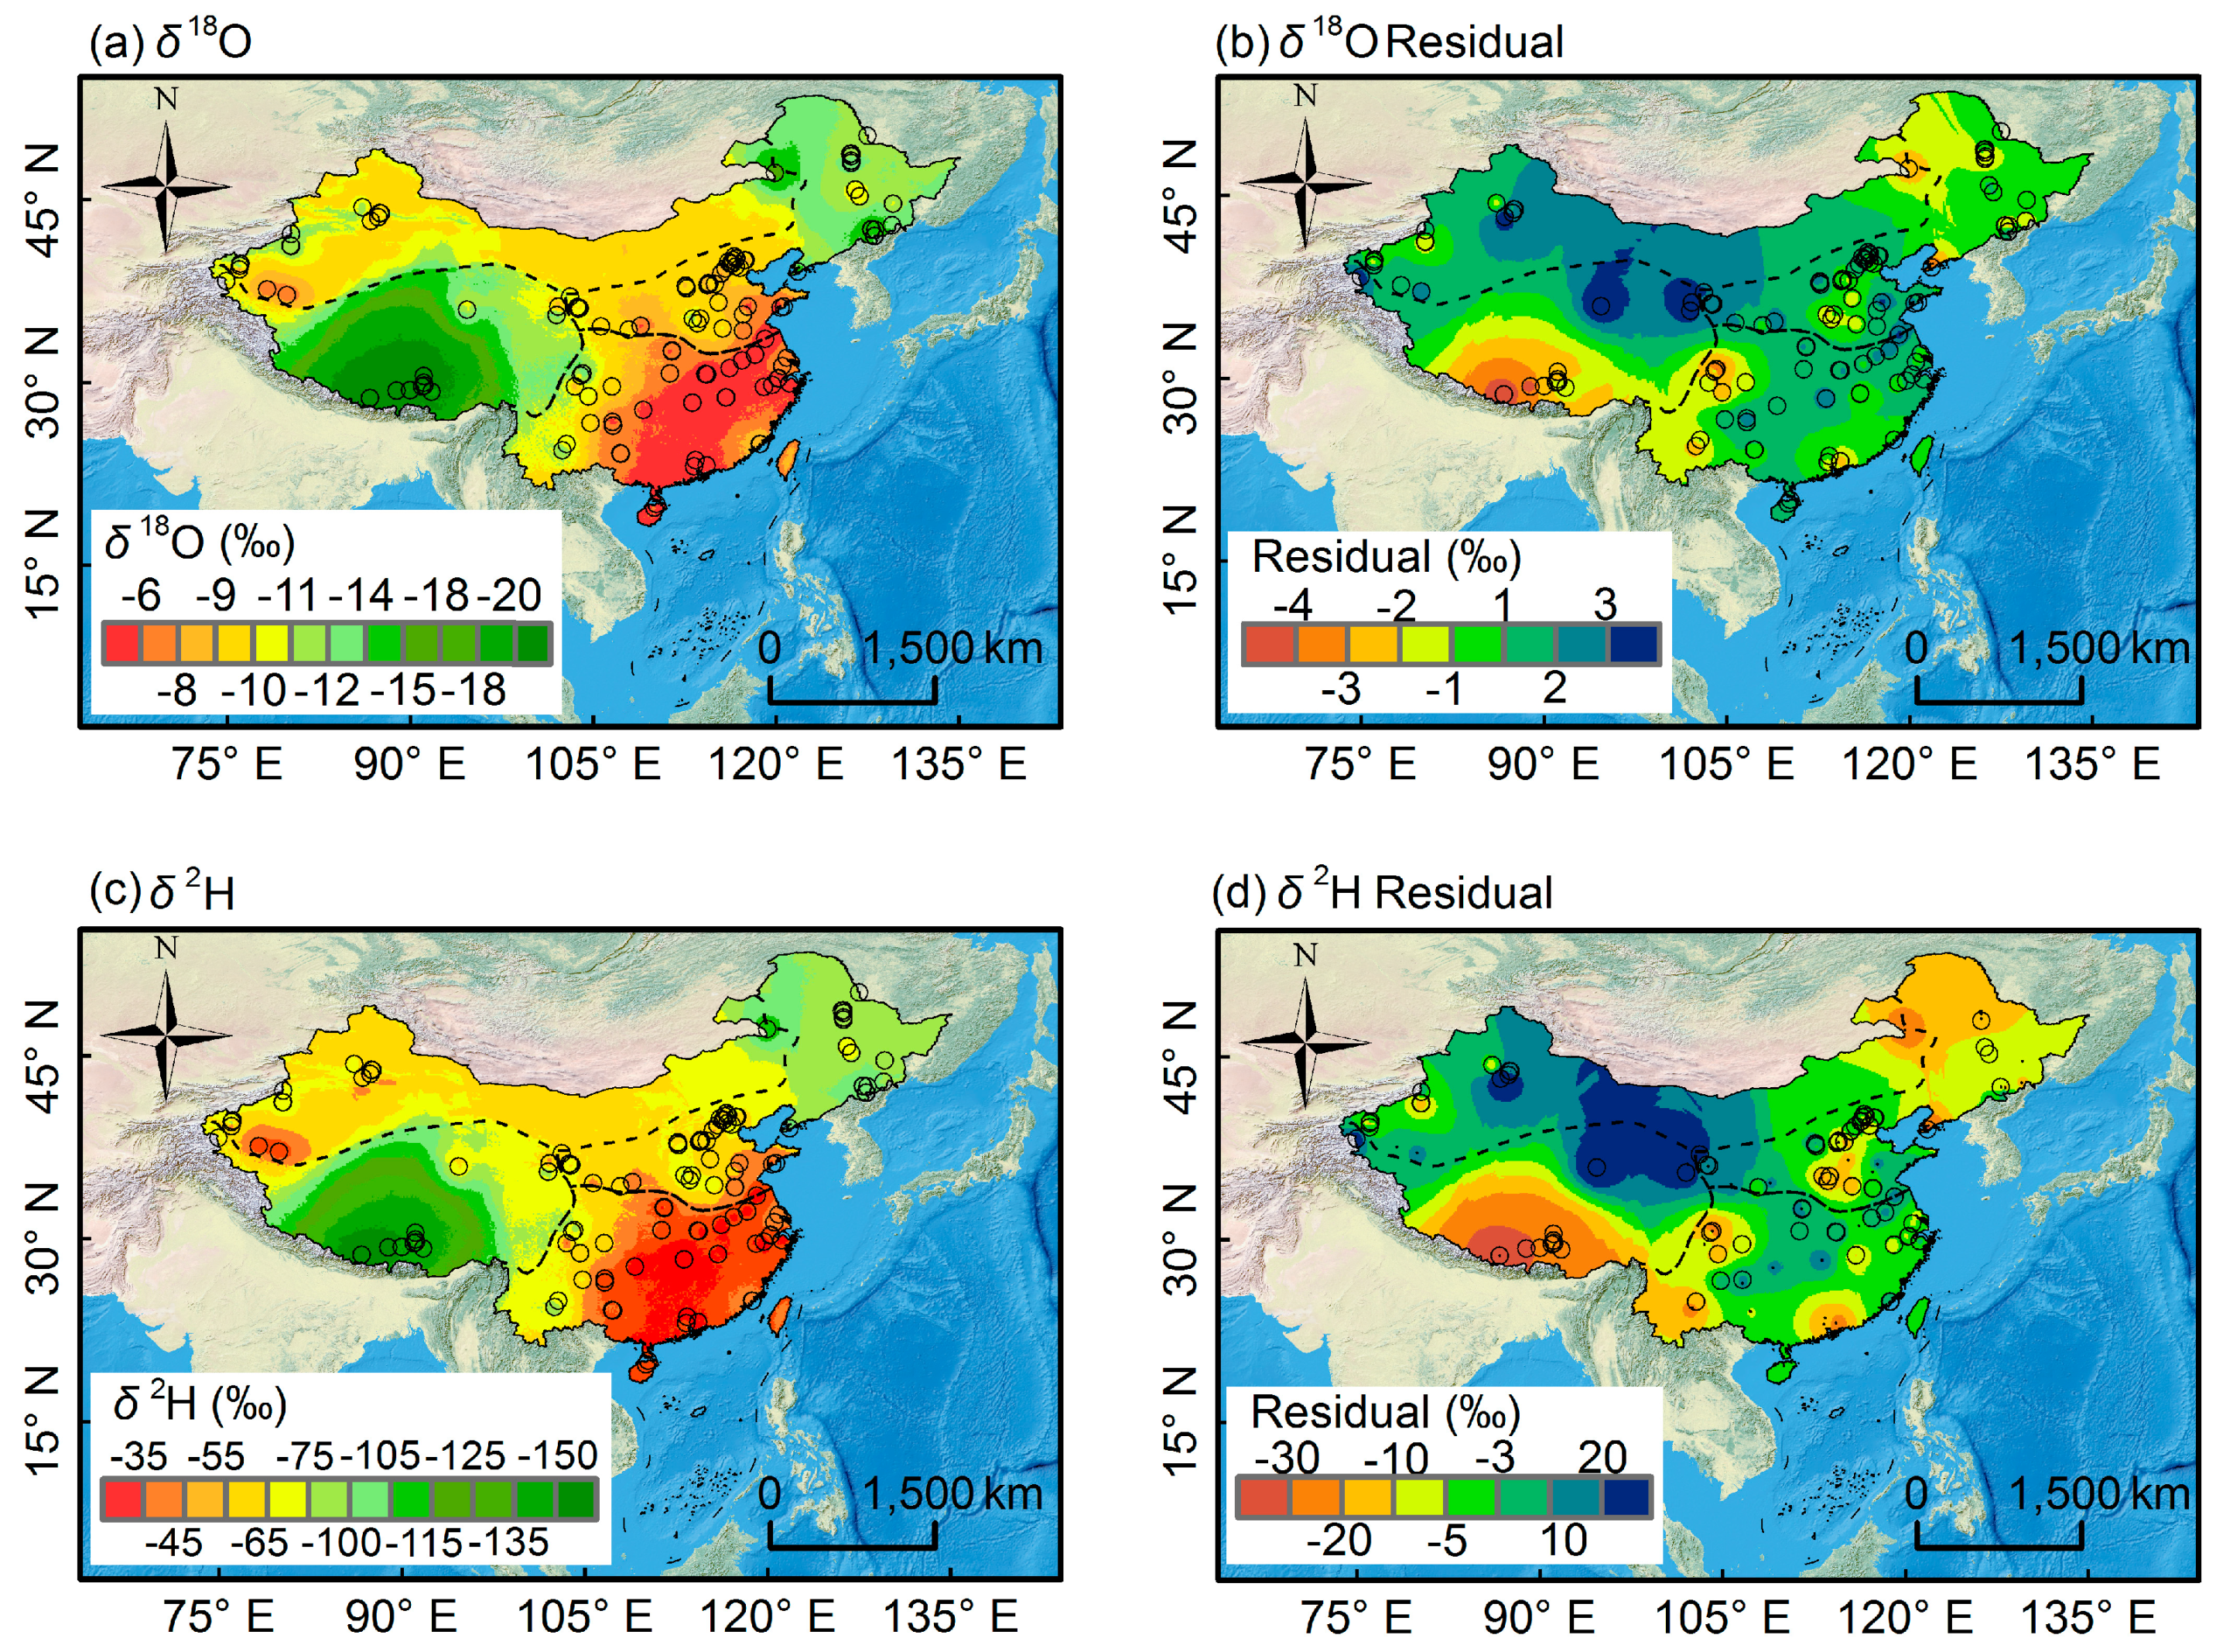
3.2.1. Spatial Pattern of Bottled Water Isotopes

The geospatial distribution of bottled water isotope ratios has been analyzed in detail. Based on the seven methods presented in Table 2, the final method was selected first to predict the Chinese bottled water isoscape (Figure 3a,c).
The highest δ2H and δ18O values (−20‰ and −4.1‰) are observed at the Changsha site in the southeast and the lowest δ2H and δ18O values (−164‰ and−21.1‰) are observed at the Xigazê site in the Tibetan Plateau. The δ18O and δ2H values in some of the mountainous locations in the northeast and northwest of China, as well as in the Qinghai–Tibet Plateau in southwest China, are significantly lower than in the low elevation areas. Bottled water and precipitation [29,30] isoscapes show similar/the same behavior; isotope values of bottled water decrease from the southeastern coastal regions with low latitude and heavy precipitation towards the North China Plain northwestern regions at high latitude, and the Tibetan Plateau.

3.2.2. Correlations between Isotope Values in Bottled Water and Environmental Parameters

In addition to the distribution of isotopes in precipitation, the spatial distribution of bottled water isotopes may also depend on environmental parameters such as P, T, L, and A. Figure 4 presents correlations between the δ2H parameters P, T, L and A, and Figure S2 presents these for δ18O.
Across China, the respective correlation coefficients (r) between δ2H and δ18O in bottled water and the precipitation amount, temperature and altitude were 0.505, 0.607, −0.602 for δ2H and 0.505, 0.620, −0.627 for δ18O, respectively. The significance levels for both isotope ratios were set to α = 0.01 (Figure 4 and Figure S2). The relationships between bottled water isotopes and these elements were different in the various sub-regions (Figure 4 and Figure S2) of China. In north China, at higher latitude, the isotope values were gradually depleted, and with increasing air temperature, the isotope values were gradually enriched. This observation indicates that the ‘temperature effects’ [41] and ‘latitude effects’ [42] play a significant role in the isotopic signatures of bottled water in north China. Additionally, the progressively lower isotopic ratios of bottled water towards higher latitudes in northwest China indicate that the ‘latitude effect’ plays an important role in parts of China at higher latitudes. In the Tibetan Plateau, the δ2H and δ18O isotopes in bottled water are highly correlated with latitude (r = 0.938 and 0.928 for δ2H and δ18O, respectively); the significance levels of both were set to α = 0.01. It can be noted that the isotopic values of bottled water decrease as altitude increases. Therefore, the ‘altitude effect’ [43] is also present in bottled water from the Tibetan Plateau.

3.3. Relationship between Isotopes in Bottled Water and Precipitation Isotopes

Bottled water does not directly reflect the natural process of the hydrological cycle, but may retain information about its source precipitation. The stable isotope ratios of all bottled waters across China correlate significantly with those of precipitation, with correlation coefficients (r) of 0.859 (δ2H) and 0.752 (δ18O) (Figure 5 and Figure S3a), respectively, at the α = 0.01 significance level. In Figure 6, it is shown that the isotope values of most bottled waters were close to those of corresponding precipitation. These results indicate that although bottled water is affected by many natural or anthropogenic parameters, bottled water still retains the information about its source. Bottled water has isotope values that are different from those of precipitation in both the Tibetan Plateau and in northwest China, where glacier-derived bottled water sites are located (Figure 6a,b). The correlations between the stable isotope ratios of bottled water from different water origins and the corresponding precipitation differ. The correlation coefficients between the stable isotope ratios of spring-sourced bottled water and local precipitation was the highest (r = 0.789 and 0.655 for δ2H and δ18O, respectively) for three different sites (Figure 5b and Figure S3b). The correlation between the stable isotope ratios of unmarked source bottled water and local precipitation was the lowest (r = 0.469 and 0.248 for δ2H and δ18O, respectively) (Figure 5d and Figure S3d).

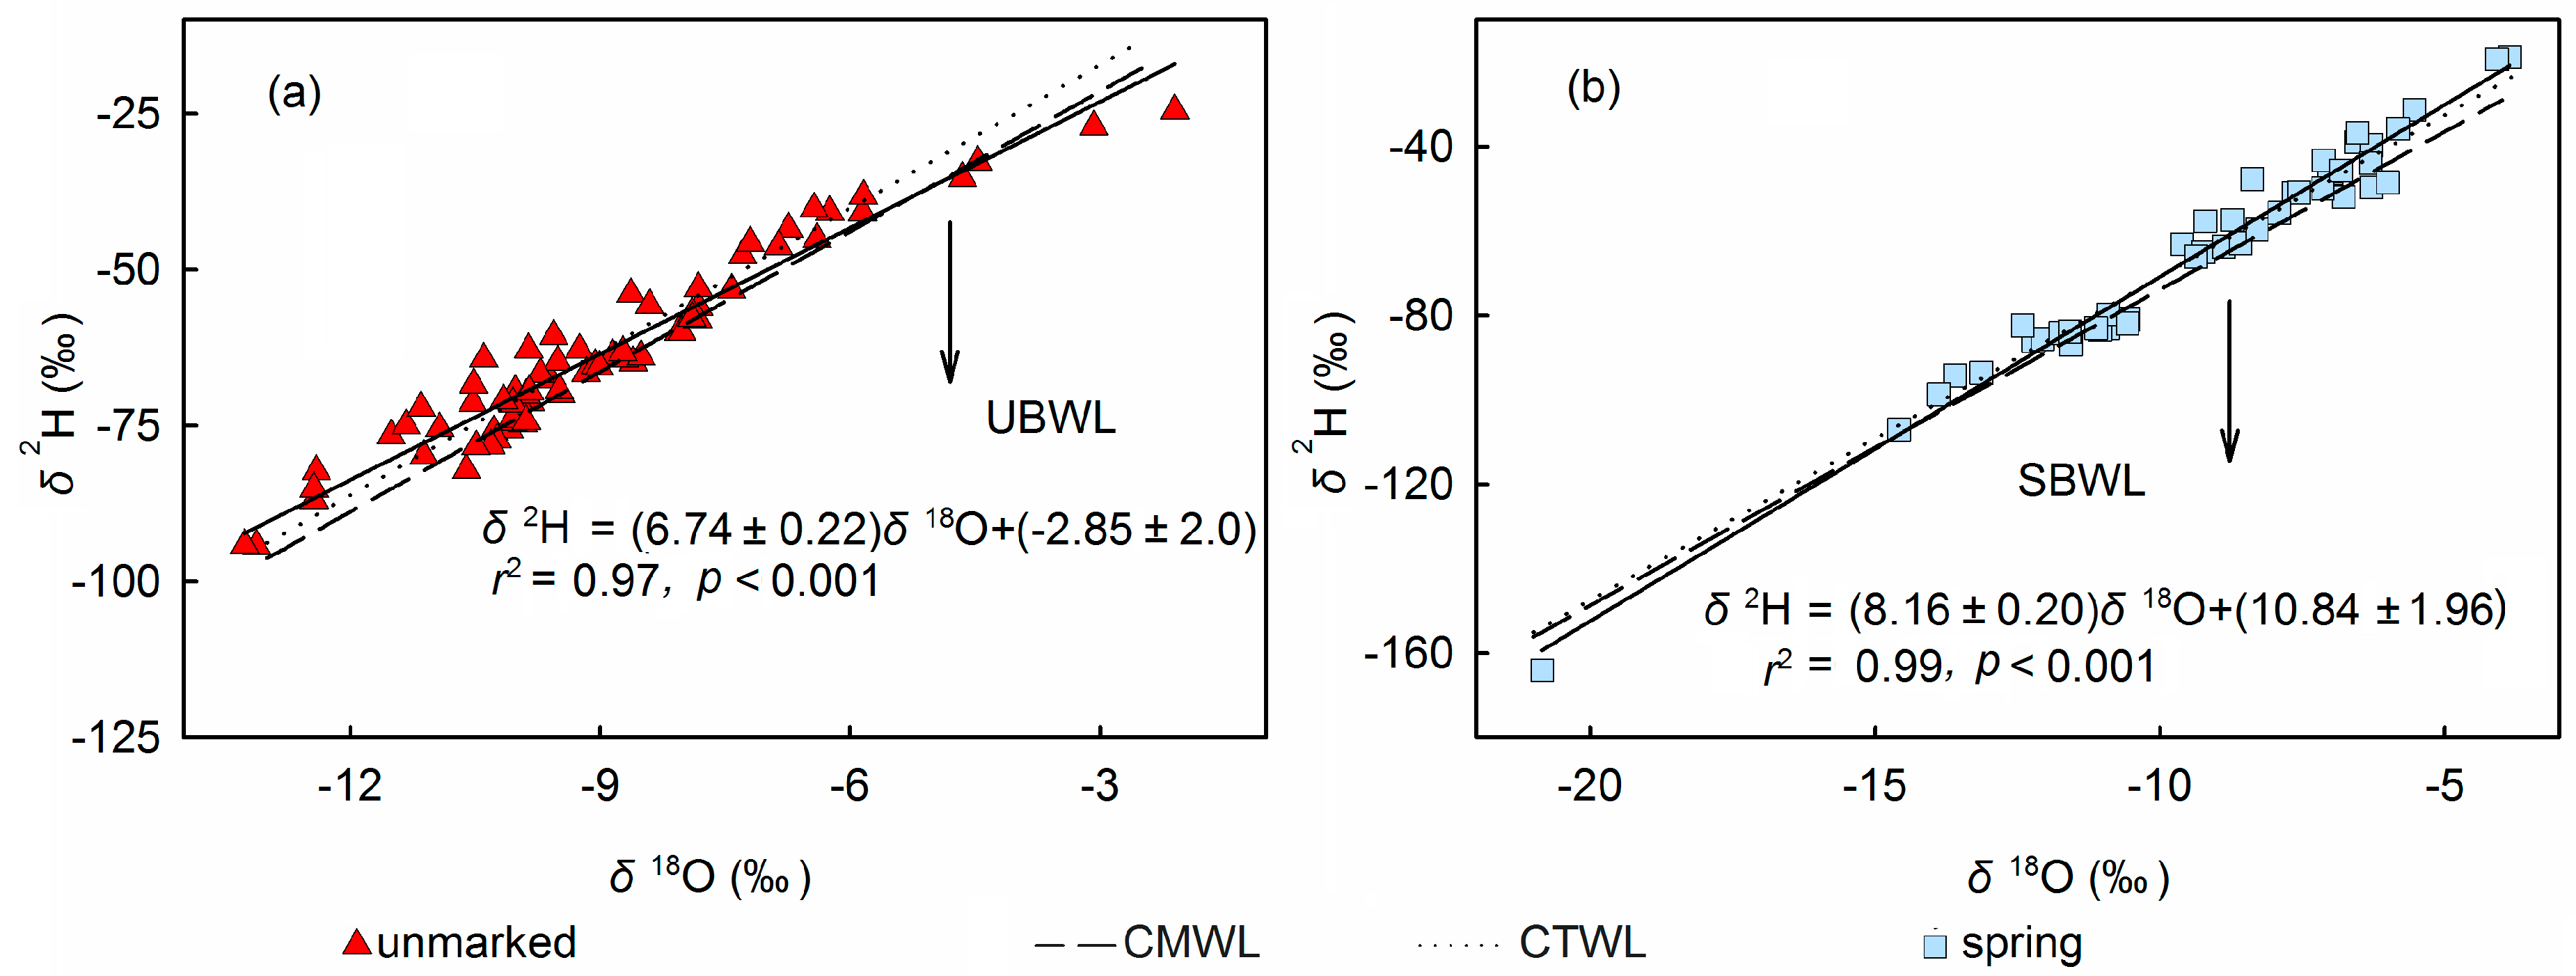
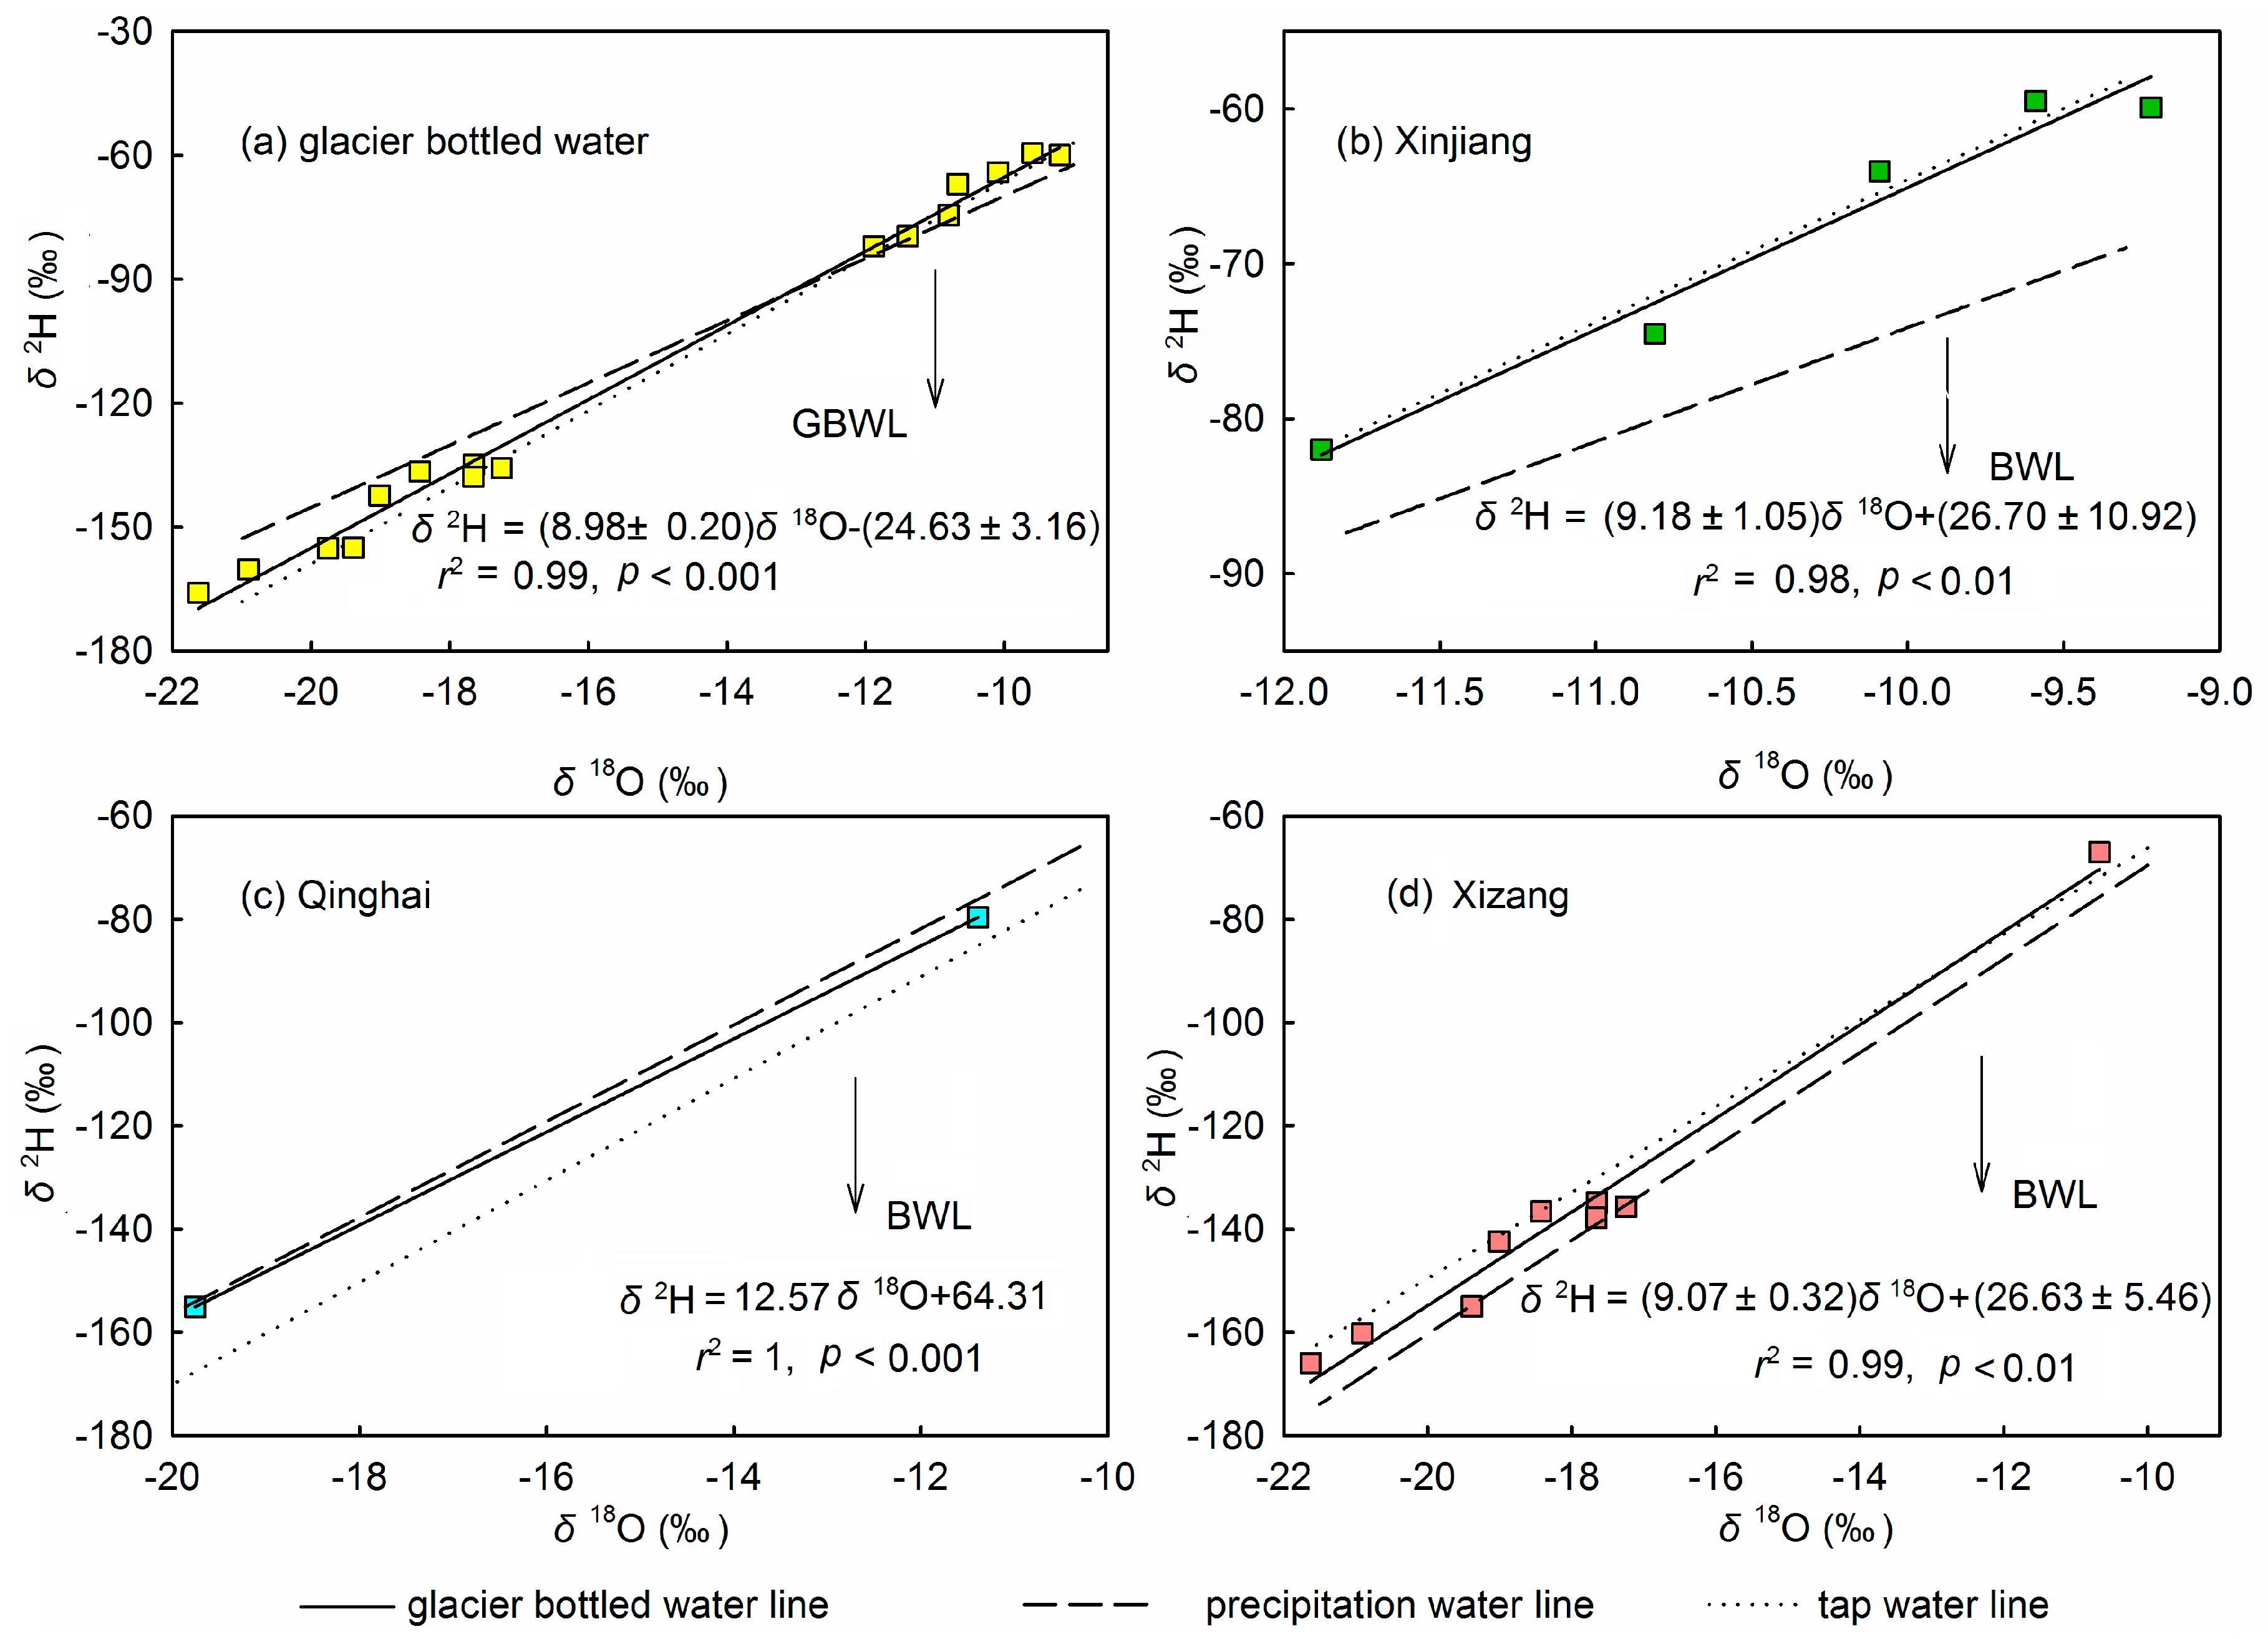
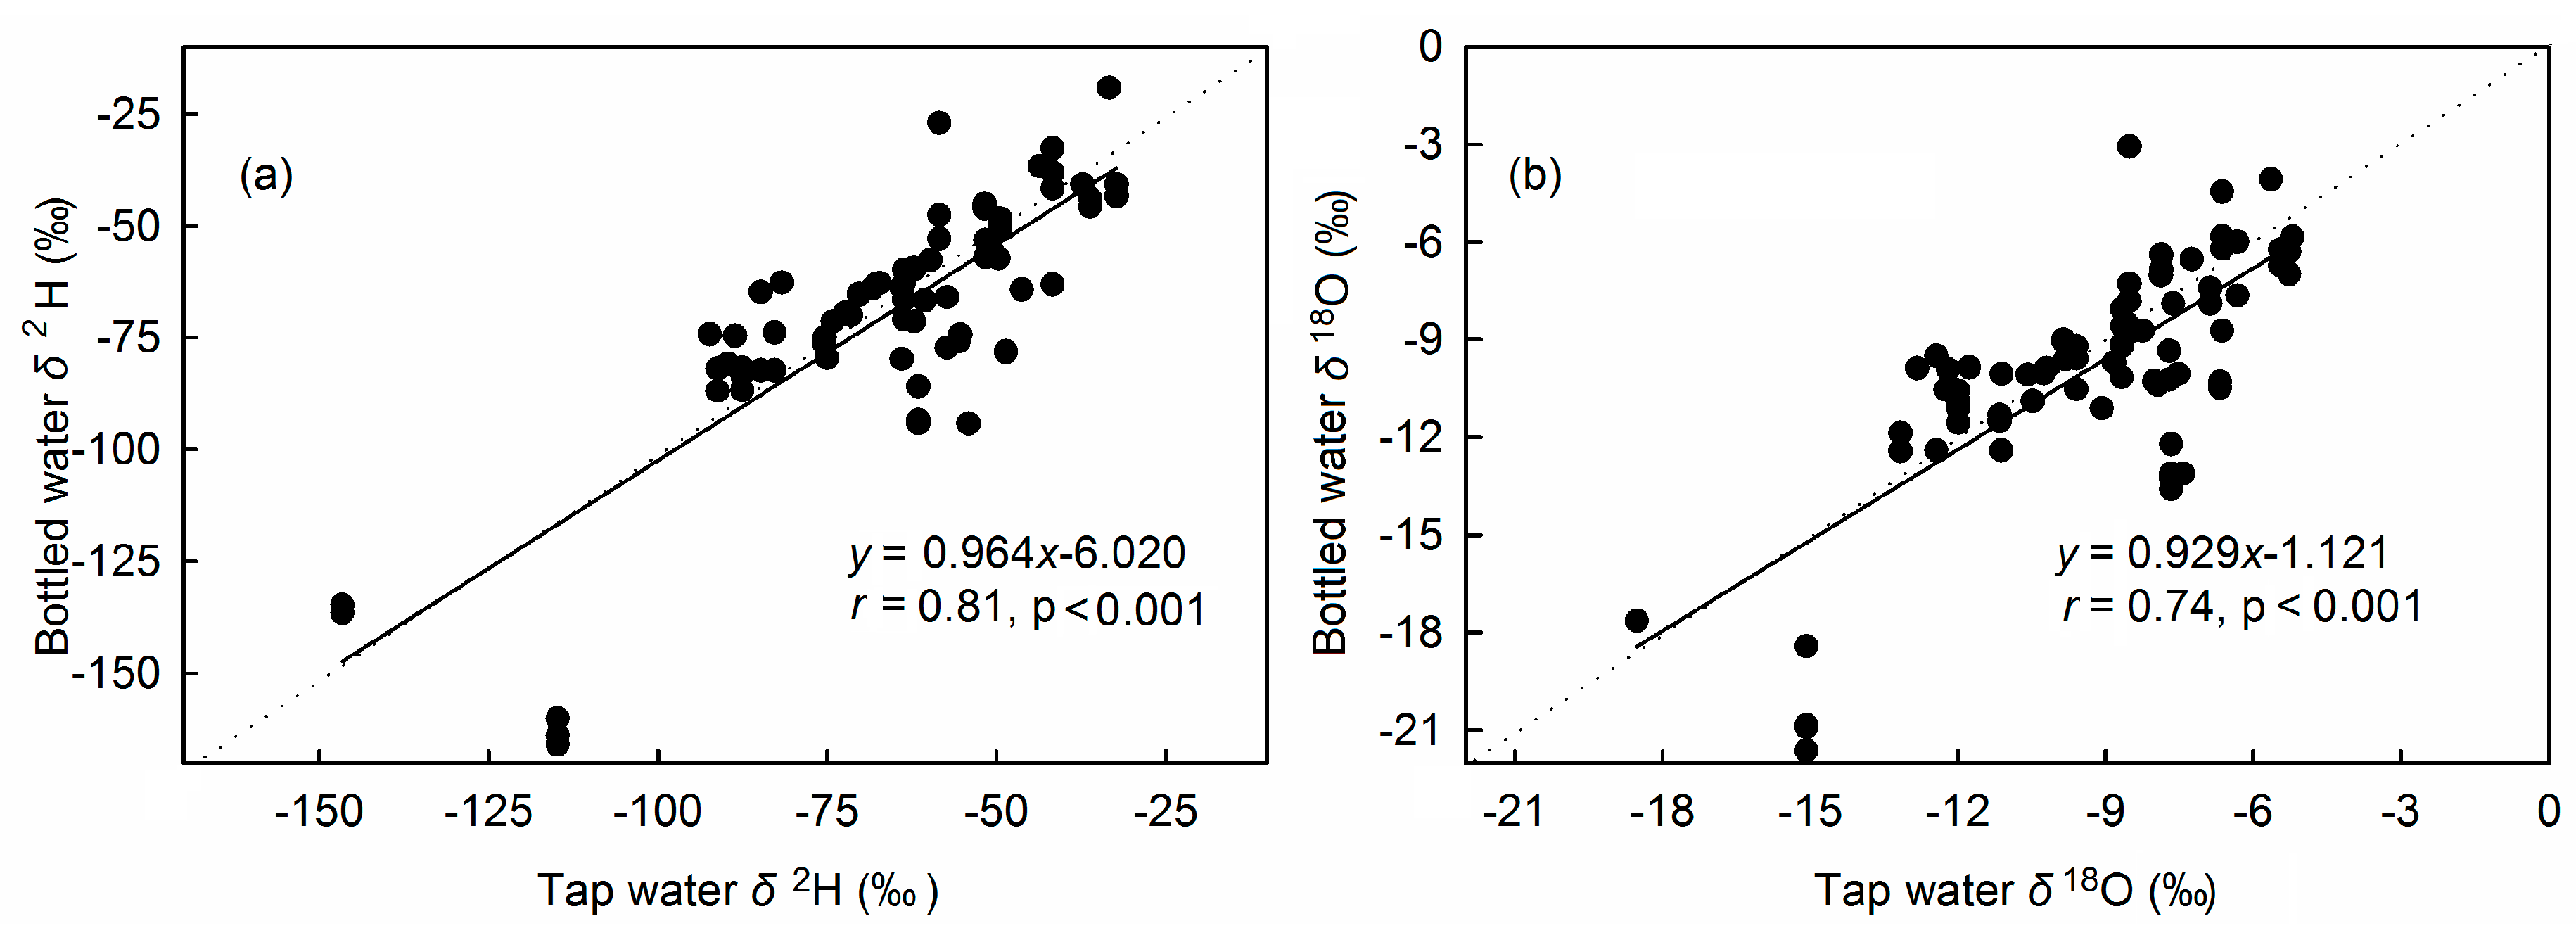
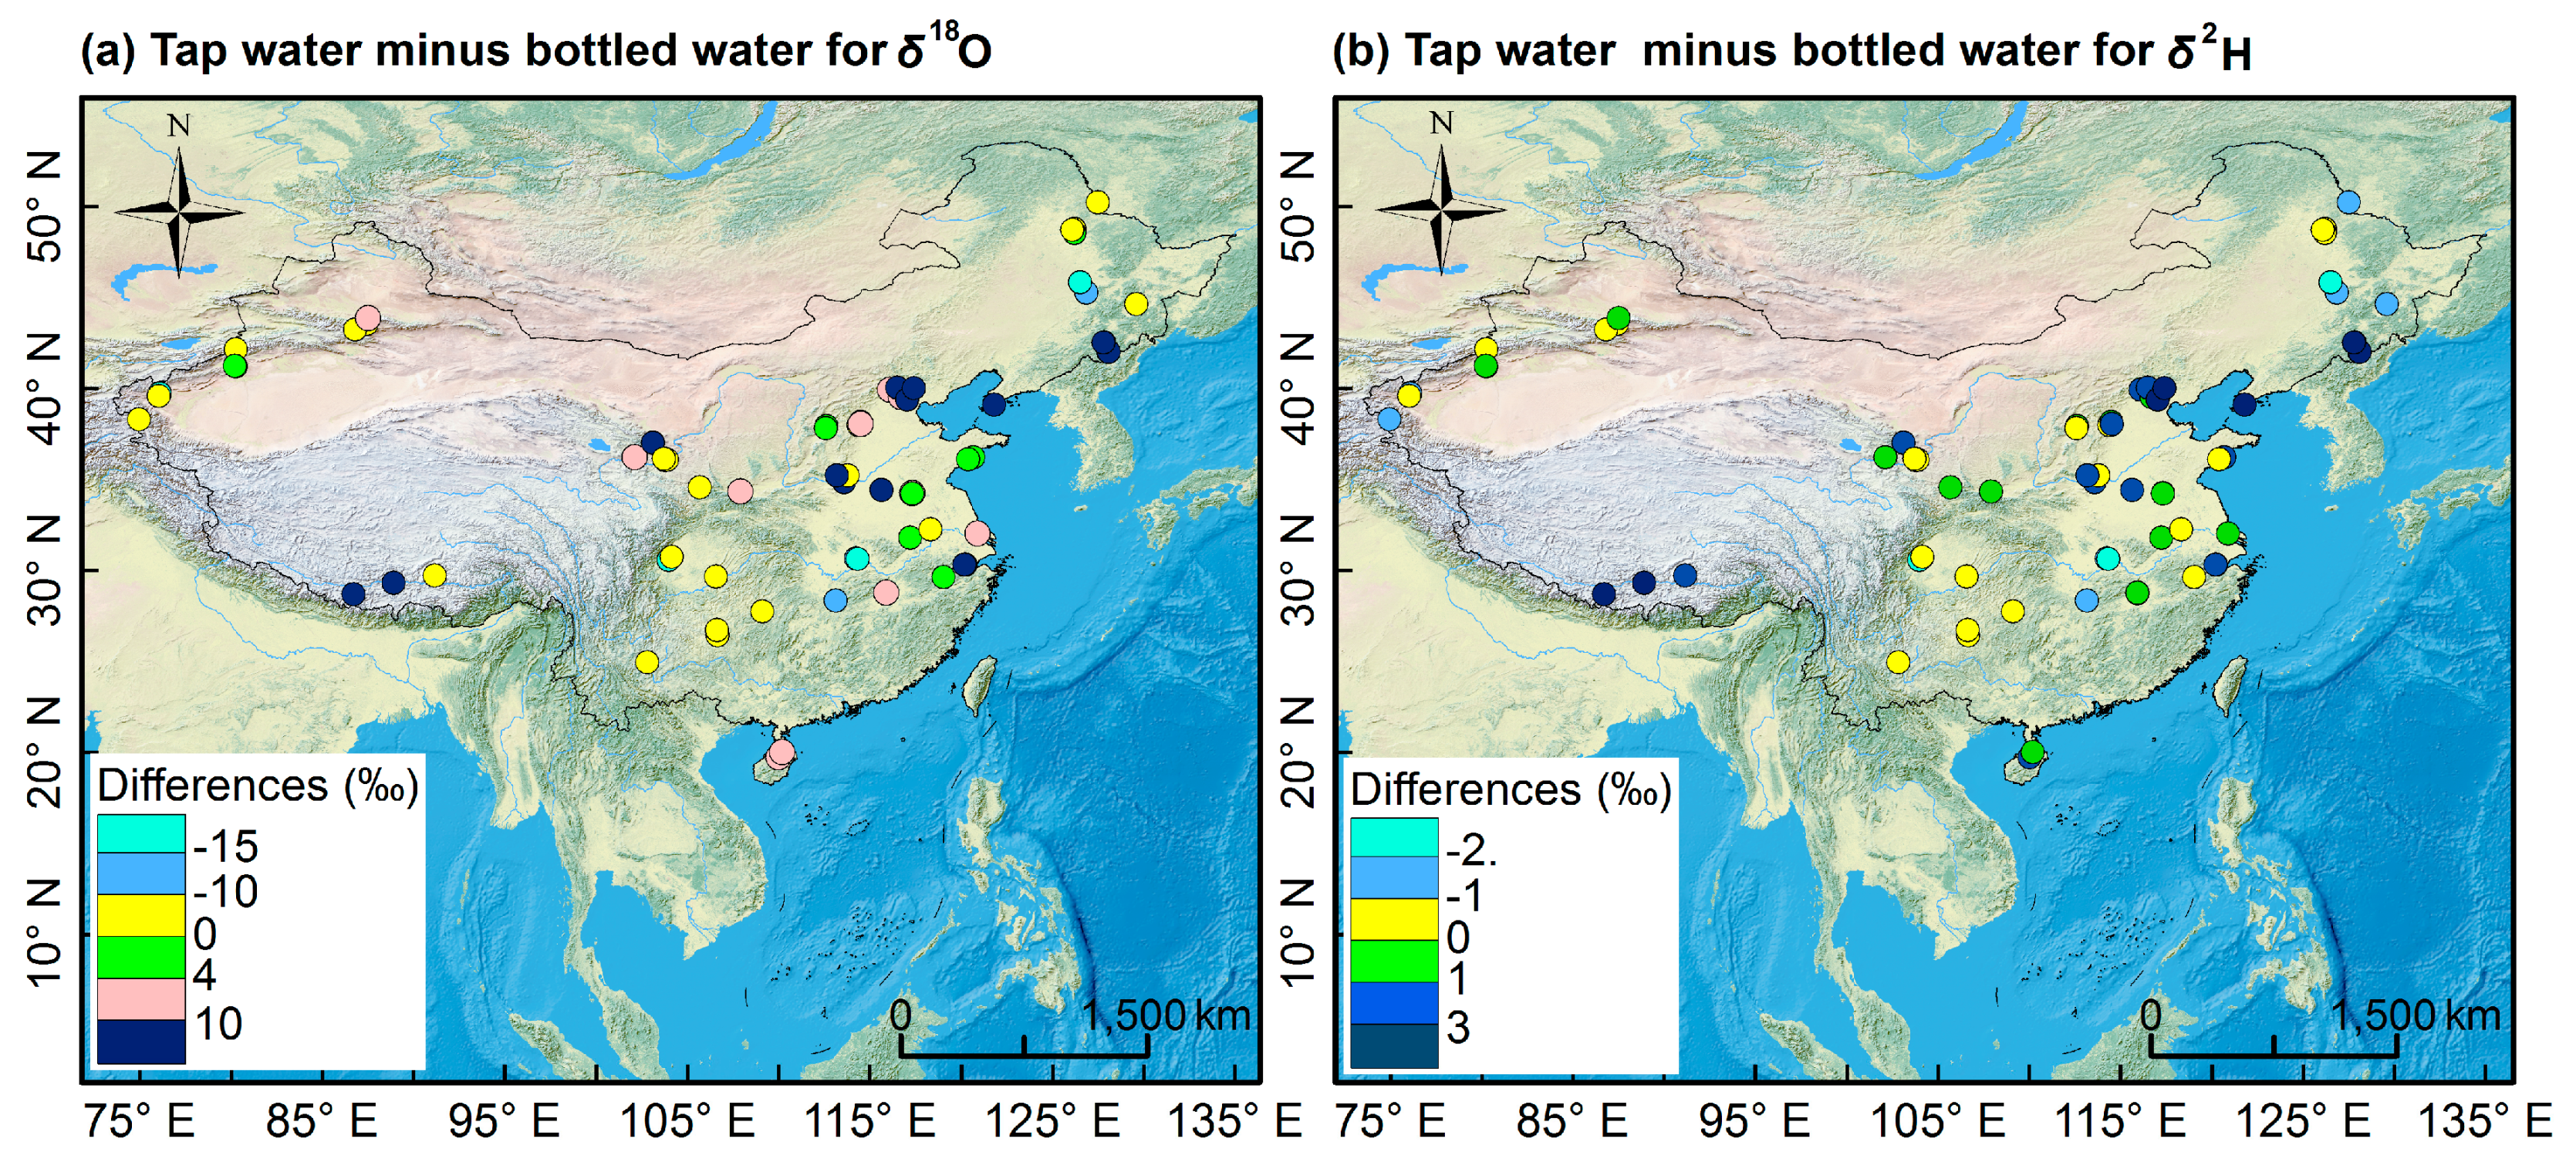
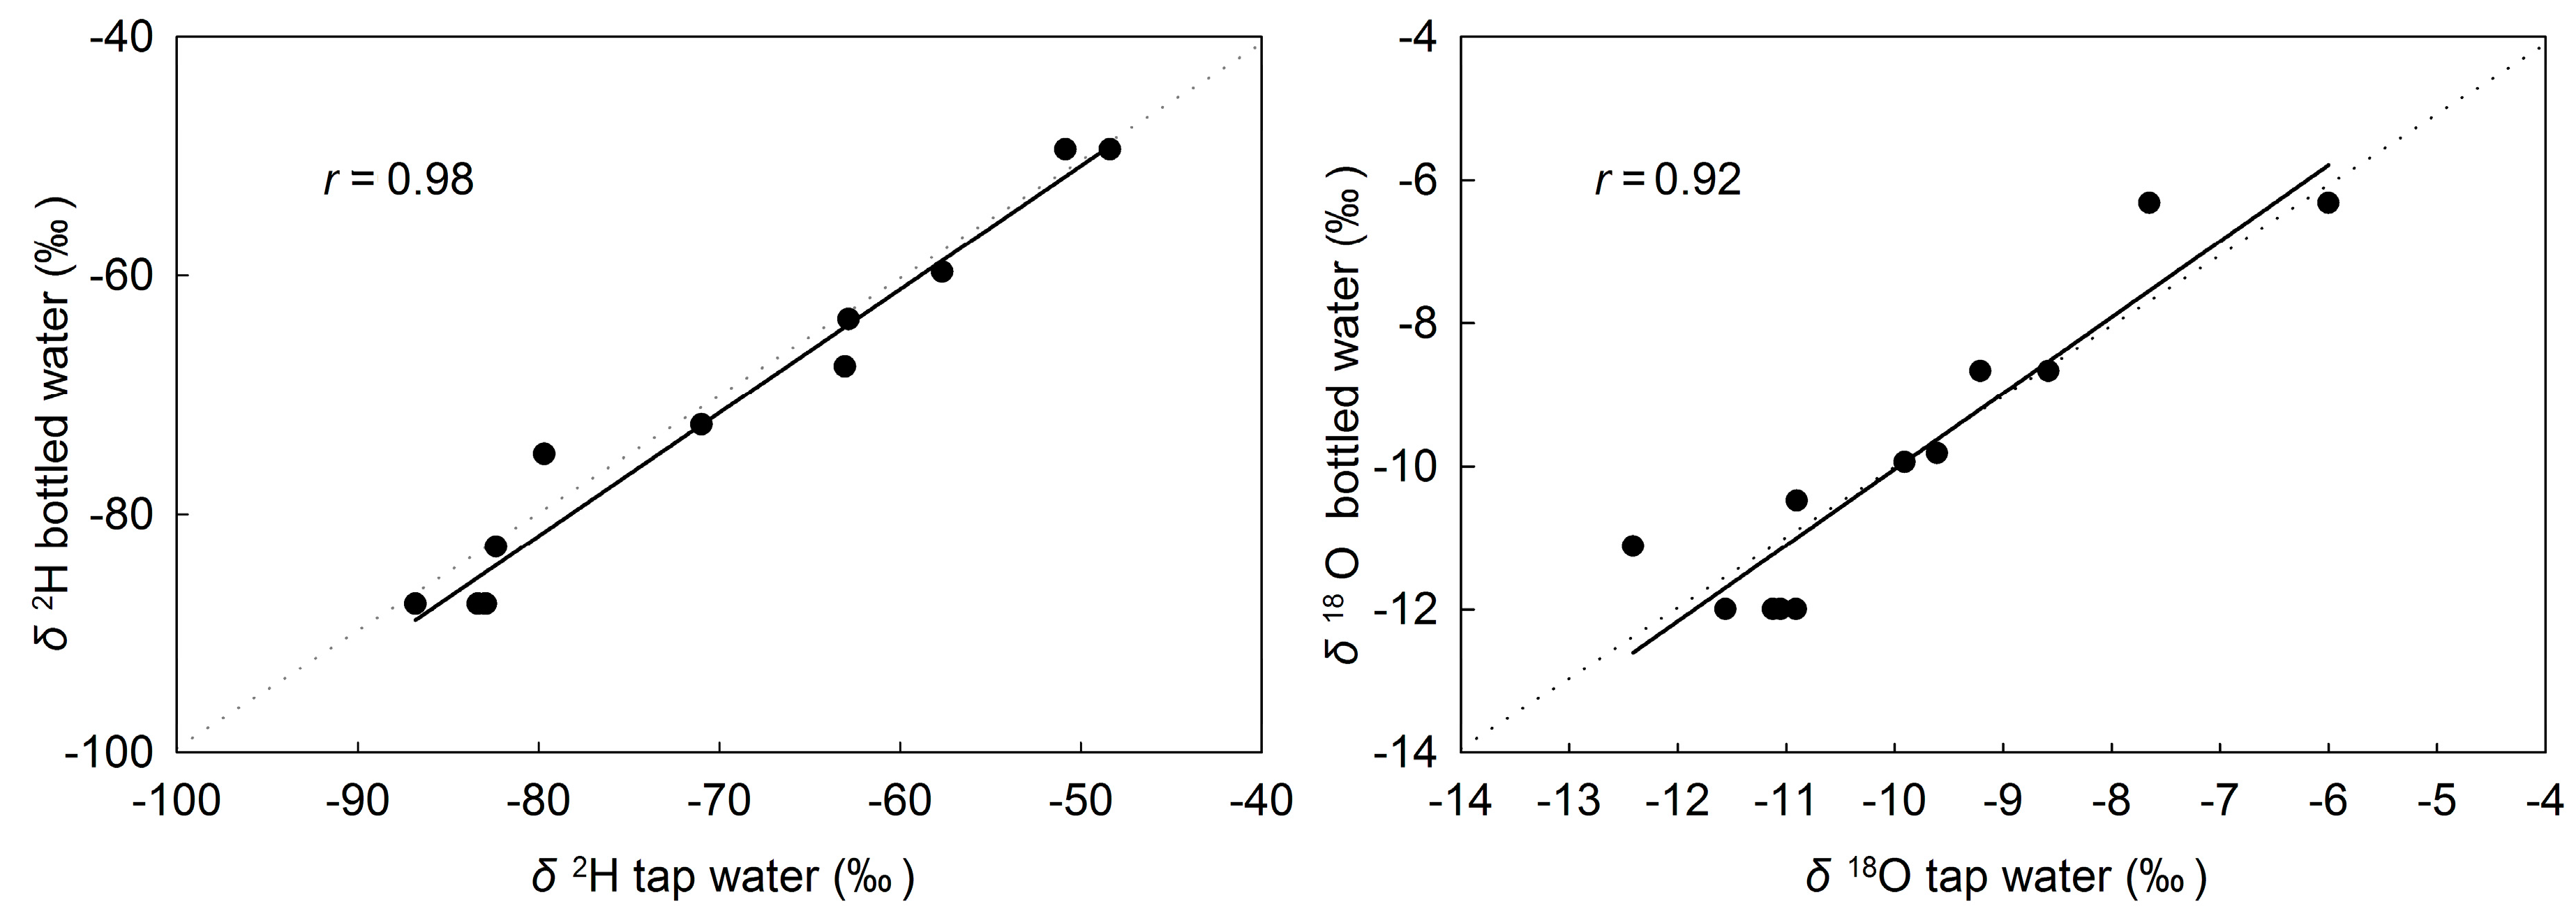
3.4. Source Water Relationship

The regression line describing the relationship between δ2H and δ18O values in unmarked source bottled water is close to both the CTWL and CMWL (Figure 7), with a slope of 6.74 and a y-intercept of −2.85 (p > 0.05) [39]. Both the slope and the y-intercept in the equation are lower than those of the CMWL; some of the samples are distributed below and to the right of the CMWL, which may reflect the effects of evaporation in the unmarked source bottled water.
The spring-sourced bottled water regression line was nearly identical to the CTWL (Figure 7), with a slope of 8.16 and a y-intercept of 10.84. The spring-sourced bottled water samples are mostly concentrated near the CTWL, and most samples were distributed above and to the left of the CMWL.
Like the two types of bottled water mentioned above, the glacier-sourced bottled water line is also close to the CMWL (Figure 8). Despite the significant variations between the different origins of bottled water, the spring-, unmarked and glacier-sourced bottled water lines are all close to the CTWL. Also, the correlation coefficients (r) between isotopes of bottled water and local tap water isotopes values (Figure 9) are high (0.81 and 0.74 for δ2H and δ18O, respectively) and isotope values of most bottled waters were close to those of corresponding tap water (Figure 10). Our results are similar to those of the bottled water surveys performed by [9] and [10]: “namely, bottled water is generally analogous to local environmental water and tap water is a reasonable proxy for most purchased beverages”.
We estimated the “tap water lines” in order to compare them with glacier-sourced bottled water in the area of glacial water samples using an ordinary least squares regression. Best-fit lines for Xinjiang, Qinghai and Xizang tap water and local meteoric water are shown as follow equations. The distribution of glacier bottled water and tap water in corresponding areas are shown in Figure S4 in the Supplementary Material.
δ 2 H = ( 8.69 ± 0.28 ) δ 18 O + ( 21.76 ± 2.27 ) ,   r 2 = 0.94 , p < 0.0001   ( for   Xinjiang )
δ 2 H = ( 9.13 ± 0.32 ) δ 18 O + ( 23.78 ± 2.70 ) ,   r 2 = 0.96 ,   p < 0.0001   ( for   Qinghai )
δ 2 H = ( 9.46 ± 0.14 ) δ 18 O + ( 23.01 ± 2.24 ) ,   r 2 = 0.99 , p < 0.0001   ( for   Xizang )
δ 2 H = ( 9.21 ± 0.07 ) δ 18 O + ( 25.99 ± 0.89 ) ,   r 2 = 0.99 ,   p < 0.001   ( for   tap   water   in   three   areas )

3.5. Discussion

Comparing the pattern of the mapped residuals with the equivalent patterns for precipitation [30] and tap water [27], we found that there are negative residual values in the southern Tibetan Plateau, but positive residuals values in northwest China and the northeastern Tibetan Plateau (Figure 3b,d). Negative residual values, representing higher estimated values in southern Tibetan Plateau may be affected by strong convective precipitation processes that occur during the monsoon period [30]. The total number of sites does not appear to be the main reason for large absolute values of the residuals since we found that tap water samples in [27] were denser in these areas. One reason is that δ2H and δ18O values of precipitation originating from warm and wet water vapor from the Indian Ocean tended to be lower [46]. Another reason is that the water vapor was transported by strong convection on the plateau surface and then uplifted over the Tibetan Plateau and the Himalayas, resulting in isotope depletion [47]. Positive residual values representing lower estimated values may be related to the inland water cycle, characterized by enriched isotopes under the influence of dry continental air masses [48].
The fact that no obvious consistent characteristics occurred in bottled water from unmarked sources could be attributed to several factors. First, from the labels, we know that unmarked source bottled water was almost purified water, and the sources of these unmarked bottled water were unknown. Tap water, lake water, groundwater or river water could be the sources of these unmarked bottled waters. Different water origins may affect the value of bottled water isotope values. For example, in Case 1 (Table S4 in the Supplementary Material), the δ18O and δ2H values of two brands of unmarked source bottled water from the same city (Chengdu), both purified using reverse osmosis technology, were different (the values of δ2H (δ18O) were −65‰ (−9.5‰) and −82‰ (−12.4‰)). Second, the production and storage processes of the different brands of bottled water are not the same; such variations may cause differences in the isotope signature of bottled water.
Although there may be multiple explanations for the spring-sourced observations, we present two theories here. First, it is possible that some spring-sourced bottled and tap water originate from the same water source. Within our sample set, a group of spring-sourced bottled water samples from eleven sites were compared with local tap water to investigate the possibility of such a link (Figure 11 and Table S5 in the Supplementary Material). Plots of spring-sourced bottled water vs. tap water isotopic values (Figure 11) reveal a significant interdependency between spring-sourced bottled water and tap water, according to the 1:1 relationship. The average δ18O and δ2H values of eleven spring-sourced bottled water samples (−9.9‰ and −71‰, respectively) were significantly close to corresponding tap water isotope ratios (−9.9‰ and −73‰, respectively), with high Pearson correlation coefficients (r = 0.98 and 0.92, respectively) (Figure 11). Research on tap water in China indicated that the water supplies in some provinces of north China include groundwater, with many areas entirely relying on groundwater as a primary water source [27]. From Table S5 in the Supplementary Material, we find that the water source sites of the eleven spring-sourced bottled water samples were almost all from north China. Second, the slope and y-intercept are higher than those of the CMWL, indicating that there was no obvious evaporation of spring-sourced bottled water, which may be affected by the source of spring water, a bottling process that was less-affected by human factors, and the altitude at which it is located.
The higher y-intercept of the tap water line in three different places suggests that fractionation took place during the transportation and storage process. It is observed that the glacier bottled water line in Xinjiang (Figure 8b) is close to the tap water line, but is far from the local precipitation water line, suggesting a close relationship between the glacier bottled water and local tap water. On the contrary, the bottled water line of Qinghai (Figure 8c) is close to the local atmospheric water line and far from the local tap water line, whereas the bottled water line in Xizang (Figure 8d) is close to both the tap water line and the precipitation line.
It is difficult to collect all possible sources (spring water, lake water, groundwater, river water, and concurrent precipitation) of bottled water across China to compare with bottled water, as well as to examine the complex bottled water processing systems and transportation processes. However, comparing different brands and types of bottled water that originate from the same place can reflect water source signatures. As with Case 1 mentioned above (Table S4), the isotope values of unmarked source bottled water in the same places are different, which roughly reflects the different water sources or different processing processes of these unmarked sourced bottled waters. For example, one of the four different brands of bottled water in Baoding is significantly different (p > 0.05) from the other three and local tap water, because of the artificial addition of oxygen to the bottled water of this brand (Table S4). In Case 2 (Table S4 in the Supplementary Material), the δ18O and δ2H values of different brands of bottled water from the same or different origin (all are spring or some are spring while others are unmarked) are close to each other, indicating that the origin of bottled water from the same city were similar in some places. Additionally, this will help us to identify the source of unmarked source bottled water. For example, the isotope ratios of tap water, spring-sourced and unmarked source bottled water in Shijiazhuang are close. From [27], we know that most tap water in north China comes from groundwater. Therefore, we could judge that unmarked source bottled water from that region was groundwater-sourced as well. In Case 3 (Table S4 in the Supplementary Material), different brands and sources of bottled water have significant differences.
The limitations of this work arise from the complexity of the natural water cycle and human activity-affected processes, as well as from data constraints. Our randomly collected samples were not enough to support our analysis of seasonal variations in bottled water. More work related to sampling duration and spatial coverage is needed to better represent the spatial and temporal patterns across China. Due to the difficulties in sampling surface water, groundwater and concurrent precipitation, as well as examining the complex bottled water processing system and transportation processes, it is difficult to trace the initial origin of all bottled water and quantitatively analyze the effects of production and transportation on bottled water. Further work is needed to better understand the impacts of human activity on bottled water.

4. Conclusions

The work presented here builds a bottled water database and an isoscape of China. The latitude effect, temperature effect, and altitude effect play important roles in the spatial variation of bottled water. The results showed a high correlation between bottled water and precipitation in the place of production. The congruence between spring-sourced, unmarked-sourced and glacier-sourced bottled water lines and the CTWL implies that the isotope signature of bottled water is generally analogous to that of the local environment. Differences in information regarding the water source and production process were shown by comparing the tap water line and atmospheric water line with different bottled water lines. The isotope ratios for eleven spring-sourced bottled water samples in our collection suggest that the stable isotope technique can be used to identify bottled water sources. Different bottled water isotopic signatures from the same place of production may reflect the differences in water source signatures and production technology.

Supplementary Materials

The following are available online at https://www.mdpi.com/2073-4441/11/5/1065/s1, Table S1: Inventory of sampling stations, Table S2: Correlation coefficients (r) between measured δ2H and δ18O values of bottled water and 16 climatic parameters, Table S3: Regional precipitation water lines, Table S4: Different brands and origins bottled water in same place of production. We use the annual average δ18O and δ2H values of tap water provided by [27], Table S5: Comparison of isotope ratios of spring-sourced bottled water from 11 sites in this study and local tap water in [27]; Figure S1: Correlations between 11 sites in [17] to our current of δ18O (δ2H) values in bottled water. The dotted line is the line of equality (y = x) and the solid line is the linear least squares fitting; Figure S2: Correlations between measured δ18O values of bottled water and four environmental factors using precipitation amount, temperature, altitude and latitude during 1970–2000, derived from the WorldClim-Global Climate Data version 2 ([22]; http://worldclim.org/version2), Figure S3: Correlations between δ18O in precipitation and (a) all bottled water, (b) spring bottled water, (c) glacier bottled water and (d) unmarked bottled water using annual databases of RCWIP. The solid line is the linear least squares fitting. The dotted line is the line of equality (y = x), Figure S4. The distribution of glacier bottled water and tap water sample locations in Xinjiang, Qinghai and Xizang. Base map as in Figure 1.

Author Contributions

M.Z., S.W., A.A.A., R.G. and X.L. performed background research and designed the study. R.G. performed the data analyses and wrote the manuscript. B.S., X.Q., R.J., M.S., S.Z. and Y.Z. contributed to data analysis and manuscript preparation.

Funding

This work was supported by the National Natural Science Foundation of China Nos. 41771035 and 41701028, and the Scientific Research Program of Higher Education Institutions of Gansu Province No. 2018C-02.

Acknowledgments

The authors greatly thank the colleagues in the Northwest Normal University for their helps in samples preparation and laboratory analysis.

Conflicts of Interest

The authors have declared no conflict of interest. The work described here has not been submitted elsewhere for publication, in whole or in part, and all the authors listed have approved the manuscript that is enclosed.

References

  1. Mustafe, P.; Arbenita, Q. The Bottled Water Market and Consumer Behavior. Int. J. Sustain. Econ. Manag. (IJSEM) 2018, 7, 35–45. [Google Scholar] [CrossRef]
  2. Gat, J.R. Oxygen and hydrogen isotopes in the hydrologic cycle. Annu. Rev. Earth Planet. Sci. 1996, 24, 225–262. [Google Scholar] [CrossRef]
  3. Carter, J.F.; Yates, H.S.A.; Tinggi, U. Isotopic and Elemental Composition of Roasted Coffee as a Guide to Authenticity and Origin. J. Agric. Food Chem. 2015, 63, 5771–5779. [Google Scholar] [CrossRef]
  4. Carter, J.F.; Yates, H.S.A.; Tinggi, U. Stable Isotope and Chemical Compositions of European and Australasian Ciders as a Guide to Authenticity. J. Agric. Food Chem. 2015, 63, 975–982. [Google Scholar] [CrossRef]
  5. Singerling, S.A.; Burkemper, L.K.; Sharp, Z.D. Measurement of Adjuncts in Hard Ciders Obtainable in the United States Using Carbon Isotopes. J. Agric. Food Chem. 2018, 66, 11422–11425. [Google Scholar] [CrossRef]
  6. Behkami, S.; Zain, S.M.; Gholami, M.; Bakirdere, S. Isotopic ratio analysis of cattle tail hair: A potential tool in building the database for cow milk geographical traceability. Food Chem. 2017, 217, 438–444. [Google Scholar] [CrossRef]
  7. Liu, H.; Zhao, Q.; Guo, X.; Tang, C.; Yu, X.; Zhan, T.; Qin, Y.; Zhang, J. Application of isotopic and elemental fingerprints in identifying the geographical origin of goat milk in China. Food Chem. 2019, 277, 448–454. [Google Scholar] [CrossRef]
  8. Chiocchini, F.; Portarena, S.; Ciolfi, M.; Brugnoli, E.; Lauteri, M. Isoscapes of carbon and oxygen stable isotope compositions in tracing authenticity and geographical origin of Italian extra-virgin olive oils. Food Chem. 2016, 202, 291–301. [Google Scholar] [CrossRef] [Green Version]
  9. Bowen, G.J.; Winter, D.A.; Spero, H.J.; Zierenberg, R.A.; Reeder, M.D.; Cerling, T.E.; Ehleringer, J.R. Stable hydrogen and oxygen isotope ratios of bottled waters of the world. Rapid Commun. Mass Spectrom. 2005, 19, 3442–3450. [Google Scholar] [CrossRef]
  10. Chesson, L.A.; Valenzuela, L.O.; O’Grady, S.P.; Cerling, T.E.; Ehleringer, J.R. Links between Purchase Location and Stable Isotope Ratios of Bottled Water, Soda, and Beer in the United States. J. Agric. Food Chem. 2010, 58, 7311–7316. [Google Scholar] [CrossRef]
  11. Brenčič, M.; Vreca, P. Identification of sources and production processes of bottled waters by stable hydrogen and oxygen isotope ratios. Rapid Commun. Mass Spectrom. 2006, 20, 3205–3212. [Google Scholar] [CrossRef]
  12. Brenčič, M.; Vreča, P. The use of a finite mixture distribution model in bottled water characterisation and authentication with stable hydrogen, oxygen and carbon isotopes—Case study from Slovenia. J. Geochem. Explor. 2010, 107, 391–399. [Google Scholar] [CrossRef]
  13. Dotsika, E.; Poutoukis, D.; Raco, B.; Psomiadis, D. Stable isotope composition of Hellenic bottled waters. J. Geochem. Explor. 2010, 107, 299–304. [Google Scholar] [CrossRef]
  14. Bong, Y.-S.; Ryu, J.-S.; Lee, K.-S. Characterizing the origins of bottled water on the South Korean market using chemical and isotopic compositions. Anal. Chim. Acta 2009, 631, 189–195. [Google Scholar] [CrossRef]
  15. Kim, G.-E.; Shin, W.-J.; Ryu, J.-S.; Choi, M.-S.; Lee, K.-S. Identification of the origin and water type of various Korean bottled waters using strontium isotopes. J. Geochem. Explor. 2013, 132, 1–5. [Google Scholar] [CrossRef]
  16. Rangarajan, R.; Ghosh, P. Tracing the source of bottled water using stable isotope techniques. Rapid Commun. Mass Spectrom. 2011, 25, 3323–3330. [Google Scholar] [CrossRef]
  17. Jiang, H.; Gu, H.; Yu, Y.; Chi, B.; Wang, H.; Zhou, J. Hydrochemical and Isotopic Characteristics of Bottled Drinking Water and Its Instruction Significance. Earth Envrion. 2015, 43, 403–414. [Google Scholar] [CrossRef]
  18. Peng, T.-R.; Liang, W.-J.; Liu, T.-S.; Lin, Y.-W.; Zhan, W.-J. Assessing the authenticity of commercial deep-sea drinking water by chemical and isotopic approaches. Isot. Environ. Health Stud. 2015, 51, 322–331. [Google Scholar] [CrossRef]
  19. Kuribayashi, T.; Sugawara, M.; Sato, K.; Nabekura, Y.; Aoki, T.; Kano, N.; Joh, T.; Kaneoke, M. Stable Isotope Analysis of Hydrogen and Oxygen in a Traditional Japanese Alcoholic Beverage, Sake, from Niigata Prefecture in Japan and Other Countries. Anal. Sci. 2017, 33, 979–982. [Google Scholar] [CrossRef] [Green Version]
  20. Mook, W.G. Environmental isotopes in the hydrological cycle. Principles Appl. 2002, 37, 327–332. [Google Scholar]
  21. Zhao, S. A New Scheme for Comprehensive Physical Regionalization in China. J. Geogr. Sci. 1983, 38, 1–10. (In Chinese) [Google Scholar] [CrossRef]
  22. Fick, S.E.; Hijmans, R.J. WorldClim 2: New 1-km spatial resolution climate surfaces for global land areas. Int. J. Climatol. 2017, 37, 4302–4315. [Google Scholar] [CrossRef]
  23. Terzer, S.; Wassenaar, L.I.; Araguás-Araguás, L.J.; Aggarwal, P.K. Global isoscapes for δ18O and δ2H in precipitation: Improved prediction using regionalized climatic regression models. Hydrol. Earth Syst. Sci. 2013, 17, 4713–4728. [Google Scholar] [CrossRef]
  24. IAEA (International Atomic Energy Agency). Regionalized Cluster-Based Water Isotope Prediction (RCWIP); IAEA: Vienna, Austria, 2018. [Google Scholar]
  25. Christner, E.; Kohler, M.; Schneider, M. The influence of snow sublimation and meltwater evaporation on δD of water vapor in the atmospheric boundary layer of central Europe. Atmos. Chem. Phys. 2017, 17, 1207–1225. [Google Scholar] [CrossRef]
  26. Seltzer, A.M.; Buizert, C.; Baggenstos, D.; Brook, E.J.; Ahn, J.; Yang, J.W.; Severinghaus, J.P. Does δ18O of O2 record meridional shifts in tropical rainfall? Clim. Past 2017, 13, 1323–1338. [Google Scholar] [CrossRef]
  27. Wang, S.; Zhang, M.; Bowen, G.J.; Liu, X.; Du, M.; Chen, F.; Qiu, X.; Wang, L.; Che, Y.; Zhao, G. Water source signatures in the spatial and seasonal isotope variation of Chinese tap waters. Water Resour. Res. 2018. [Google Scholar] [CrossRef]
  28. IAEA/WMO (International Atomic Energy Agency/World Meteorological Organization). Water Isotope System for Data Analysis, Visualization and Electronic Retrieval (WISER); IAEA/WMO: Vienna, Austria; Geneva, Switzerland, 2017. [Google Scholar]
  29. Liu, J.; Song, X.; Yuan, G.; Sun, X.; Yang, L. Stable isotopic compositions of precipitation in China. Tellus B Chem. Phys. Meteorol. 2014, 66, 22567. [Google Scholar] [CrossRef]
  30. Liu, Z.; Tian, L.; Chai, X.; Yao, T. A model-based determination of spatial variation of precipitation δ18O over China. Chem. Geol. 2008, 249, 203–212. [Google Scholar] [CrossRef]
  31. Bowen, G.J.; Revenaugh, J. Interpolating the isotopic composition of modern meteoric precipitation. Water Resour. Res. 2003, 39. [Google Scholar] [CrossRef]
  32. Lykoudis, S.P.; Argiriou, A.A. Gridded data set of the stable isotopic composition of precipitation over the eastern and central Mediterranean. J. Geophys. Res. Atmos. 2007, 112. [Google Scholar] [CrossRef] [Green Version]
  33. West, A.G.; Hultine, K.R.; Burtch, K.G.; Ehleringer, J.R. Seasonal variations in moisture use in a piñon–juniper woodland. Oecologia 2007, 153, 787–798. [Google Scholar] [CrossRef] [PubMed]
  34. Yang, J.; Qin, X.; Wu, J. The application of modified BW method in studying spatial distribution of δ18O in precipitation over China. J. Glaciol. Geocryol. 2014, 36, 1430–1439. (In Chinese) [Google Scholar]
  35. Hollins, S.E.; Hughes, C.E.; Crawford, J.; Cendón, D.I.; Meredith, K.T. Rainfall isotope variations over the Australian continent—Implications for hydrology and isoscape applications. Sci. Total Environ. 2018, 645, 630–645. [Google Scholar] [CrossRef]
  36. Bowen, G.J.; Ehleringer, J.R.; Chesson, L.A.; Stange, E.; Cerling, T.E. Stable isotope ratios of tap water in the contiguous United States. Water Resour. Res. 2007, 43. [Google Scholar] [CrossRef]
  37. Zhao, S.; Hu, H.; Tian, F.; Tie, Q.; Wang, L.; Liu, Y.; Shi, C. Divergence of stable isotopes in tap water across China. Sci. Rep. 2017, 7, 43653. [Google Scholar] [CrossRef] [Green Version]
  38. Akaike, H. A new look at the statistical model identification. IEEE Trans. Autom. Control 1974, 19, 716–723. [Google Scholar] [CrossRef]
  39. Boschetti, T.; Cifuentes, J.; Iacumin, P.; Selmo, E. Local Meteoric Water Line of Northern Chile (18° S–30° S): An Application of Error-in-Variables Regression to the Oxygen and Hydrogen Stable Isotope Ratio of Precipitation. Water 2019, 11, 791. [Google Scholar] [CrossRef]
  40. Gourcy, L.L.; Groening, M.; Aggarwal, P.K. Stable oxygen and hydrogen isotopes in precipitation. In Isotopes in the Water Cycle; Springer: Dordrecht, The Netherlands, 2005; pp. 39–51. [Google Scholar]
  41. Jouzel, J.; Lorius, C.; Petit, J.R.; Genthon, C.; Barkov, N.I.; Kotlyakov, V.M.; Petrov, V.M. Vostok ice core: A continuous isotope temperature record over the last climatic cycle (160,000 years). Nature 1987, 329, 403. [Google Scholar] [CrossRef]
  42. Poage, M.A.; Chamberlain, C.P.J.A.J.o.S. Empirical Relationships between Elevation and the Stable Isotope Composition of Precipitation and Surface Waters: Considerations for Studies of Paleoelevation Change. Am. J. Sci. 2001, 301, 1–15. [Google Scholar] [CrossRef]
  43. Gonfiantini, R.; Roche, M.-A.; Olivry, J.-C.; Fontes, J.-C.; Zuppi, G.M. The altitude effect on the isotopic composition of tropical rains. Chem. Geol. 2001, 181, 147–167. [Google Scholar] [CrossRef]
  44. Wang, S.; Zhang, M.; Hughes, C.E.; Zhu, X.; Dong, L.; Ren, Z.; Chen, F. Factors controlling stable isotope composition of precipitation in arid conditions: An observation network in the Tianshan Mountains, central Asia. Tellus B Chem. Phys. Meteorol. 2016, 68, 26206. [Google Scholar] [CrossRef]
  45. Yang, Y.; Wu, Q.; Yun, H.; Jin, H.; Zhang, Z. Evaluation of the hydrological contributions of permafrost to the thermokarst lakes on the Qinghai–Tibet Plateau using stable isotopes. Glob. Planet. Chang. 2016, 140, 1–8. [Google Scholar] [CrossRef]
  46. Tian, L.; Yao, T.; Numaguti, A.; Sun, W. Stable Isotope Variations in Monsoon Precipitation on the Tibetan Plateau. J. Meteorol. Soc. Jpn. Ser. Ii 2001, 79, 959–966. [Google Scholar] [CrossRef]
  47. Tian, L.; Masson-Delmotte, V.; Stievenard, M.; Yao, T.; Jouzel, J. Tibetan Plateau summer monsoon northward extent revealed by measurements of water stable isotopes. J. Geophys. Res. Atmos. 2001, 106, 28081–28088. [Google Scholar] [CrossRef]
  48. Tian, L.; Yao, T.; MacClune, K.; White, J.W.C.; Schilla, A.; Vaughn, B.; Vachon, R.; Ichiyanagi, K. Stable isotopic variations in west China: A consideration of moisture sources. J. Geophys. Res. Atmos. 2007, 112. [Google Scholar] [CrossRef]
Figure 1. (a) Spatial distribution of sampling sites of bottled water in China. The digital elevation model is derived from Global 30 Arc-Second Elevation (GTOPO30; https://lta.cr.usgs.gov/GTOPO30). Based on natural regionalization in China [21], the four natural sub-regions of China (Northwest China, North China, South China and the Tibetan Plateau) are shown by dashed grey lines. The satellite-derived land cover base map is from Natural Earth (http://www.naturalearthdata.com). Spatial distribution of annual mean air temperature (b) and precipitation amount (c) in China during 1970–2000, derived from the WorldClim-Global Climate Data version 2 ([22]; http://worldclim.org/version2). The six different dot colors in (a) represent the different origins of our bottled water samples.
Water 11 01065 g001
Figure 2. Correlation between δ2H and δ18O in bottled water across China. The dotted, solid and dashed lines are linear least squares fits for Chinese tap water (CTWL) [27], bottled water (CBWL) and precipitation/meteoric water (CMWL) [29], respectively.
Water 11 01065 g002
Figure 3. Spatial distribution of δ2H and δ18O values of bottled water and residuals (observation minus estimate) across China. Sub-region boundaries and base map as for Figure 1.
Water 11 01065 g003
Figure 4. Correlations between measured δ2H values of bottled water and four environmental parameters (annual mean precipitation P (mm), annual mean temperature T (°C), latitude L (°) and altitude A (m)) for the period 1970–2000. The top row shows all data for the whole of China, and below are the four natural regions.
Water 11 01065 g004
Figure 5. Correlations between δ2H in precipitation [25] and (a) all bottled water samples, (b) spring-sourced bottled water samples, (c) glacier-sourced bottled water samples and (d) source unmarked bottled water. The solid line is the linear least squares fitting. The dotted line is the line of slope equality (y = x).
Water 11 01065 g005
Figure 6. Differences between (a) δ18O values and (b) δ2H values of precipitation and bottled water samples. Sub-region boundaries and base map as in Figure 1.
Water 11 01065 g006
Figure 7. Comparison of the relationship between δ2H and δ18O of unmarked-sourced (a) and spring-sourced bottled water (b). The unmarked-sourced water (UBWL) and spring-sourced water (SBWL) lines are shown by solid lines.
Water 11 01065 g007
Figure 8. Hydrogen and oxygen isotope values of (a) all glacier-sourced bottled water, (b) glacier-sourced bottled water in Xinjiang, (c) glacier-sourced bottled water in Qinghai and (d) glacier-sourced bottled water in Xizang. The precipitation water lines in Xinjiang [44], Qinghai [45] and Xizang [29] are shown in Table S3. GBWL = glacier bottled water line.
Water 11 01065 g008
Figure 9. Correlation between δ2H (a) and δ18O (b) in bottled water and local tap water. From the tap water database provided by [27], 80 stations of tap water (Figure 1) adjacent to the origin of bottled water sites were examined. The dotted line is the line of equality (y = x).
Water 11 01065 g009
Figure 10. Difference between (a) δ18O values and (b) δ2H values of tap water using the tap water database and bottled water samples across China. The tap water database used was obtained from [27]. Sub-region boundaries and base map as in Figure 1.
Water 11 01065 g010
Figure 11. Hydrogen and oxygen isotope values of spring-sourced bottled water plotted against corresponding tap water isotope ratios. The dotted line is the line of equality (y = x) and the solid line is the linear least squares fitting.
Water 11 01065 g011
Table 1. Descriptive characteristics of bottled water stable isotope ratios.
Origin Types δ2H (‰)δ18O (‰)
MaxMinAverageMaxMinAverage
spring−19−164−64−3.9−20.9−9.1
glacier−59.5−166−113−9.2−21.6−15.3
unmarked−24−94−63−2.1−13.3−8.9
all−19−166−69−2.1−21.6−9.8
Table 2. Model equations of δ2H and δ18O in bottled water across China. r2 = coefficient of determination; radj2 = adjusted determination coefficient; n= The total number of our sampling sites; AIC = Akaike’s Information Criterion; MAE = mean absolute error; MBE = mean bias error; RMSE = root mean square error.
Equationr2radj2nAICMBEMAERMSE
δ18Oδ = −0.0479L2 + 2.474L − 0.012A − 83.4320.450.44137954.440.001.832.57
δ = −0.0186O − 0.107L − 0.00164A − 2.424970.4430.431137956.020.001.832.57
δ = 0.249T + 0.001461P − 13.4550.4120.403137963.730.001.892.68
δ = 0.212594T − 0.002013P − 0.000052137R + 3.252138V + 0.81497S − 6.8560.4660.446137954.100.001.832.53
δ = −0.002871A + 0.000000246A2 − 0.001690L2 − 5.66910.5010.490137940.700.001.862.45
δ = 12.009V − 4.293V2 + 0.011T2 − 18.5100.5200.509137935.500.001.822.40
δ = −18.4118 + 25.47523V − 0.000474A − 6.544752V2 − 0.00000715436P2 − 0.014221P − 0.374248T0.6690.654137909.360.001.622.14
δ2Hδ = −0.0479L2 + 2.474L − 0.012A − 83.4320.4200.4071371541.500.0015.0021.25
δ = −0.31286O − 0.837651L − 0.0137A + 7.30920.4240.4121371540.510.0014.9321.17
δ = 1.921313T + 0.0126991P − 98.79660.3910.3821371546.340.0014.8421.77
δ = 1.40594T − 0.01761P − 0.00047895R + 29.336S + 4.727976V − 30.0540.4700.4501371533.110.0014.8120.32
δ = −0.445895O − 0.025A − 0.01212L2
+ 0.0000194A2 + 12.575
0.4820.4561371528.640.1915.1420.14
δ = −279.0 −0.0171A + 0896T − 0.0000000097A − 0.003088630R − 0.002789O2 + 0.000012A2 + 0.1107P0.6790.6661371464.070.9412.4815.85
δ = −138.2152 + 216.728V − 0.00346A − 55.045V2 − 0.000067P2 − 0.1321P − 3.3981472T0.6150.5971371305.60−0.0213.6117.32

