Experimental Hydraulic Investigation of Angled Fish Protection Systems—Comparison of Circular Bars and Cables


1
Unit of Hydraulic Engineering, University of Innsbruck, Technikerstraße 13, 6020 Innsbruck, Austria
2
School of Engineering, Institute for Energy Systems, FloWave Ocean Energy Research Facility, The University of Edinburgh, Max Born Crescent, Edinburgh EH9 3BF, UK
*
Authors to whom correspondence should be addressed.
Water 2019, 11(5), 1056; https://doi.org/10.3390/w11051056
Submission received: 23 April 2019
/
Revised: 13 May 2019
/
Accepted: 14 May 2019
/
Published: 21 May 2019
(This article belongs to the Special Issue Environmental Hydraulics Research)
Abstract
:The requirements for fish protection at hydro power plants have led to a significant decrease of the bar spacing at trash racks as well as the need of an inclined or angled design to improve the guidance effect (fish-friendly trash racks). The flexible fish fence (FFF) is a new developed fish protection and guidance system, created by horizontally arranged steel cables instead of bars. The presented study investigated experimentally the head loss coefficient of an angled horizontal trash rack with circular bars (CBTR) and the FFF with identical cross sections in a flume (scale 1:2). Nine configurations of different bar and cable spacing (blockage ratio) and rack angles were studied for CBTR and FFF considering six different stationary flow conditions. The results demonstrate that head loss coefficient is independent from the studied Bar–Reynolds number range and increases with increasing blockage ratio and angle. At an angle of 30 degrees, a direct comparison between the two different rack options was conducted to investigate the effect of cable vibrations. At the lowest blockage ratio, head loss for both options are in similar very low ranges, while the head loss coefficient of the FFF increases significantly compared to the CBTR with an increase of blockage. Further, the results indicate a moderate overestimation with the predicted head loss by common head loss equations developed for inclined vertical trash racks. Thus, an adaption of the design equation is proposed to improve the estimation of head loss on both rack options.
1. Introduction
1.1. General
Fish protection and downstream migration measures are considered essential in the design, construction or retrofitting and operation of hydro power plants. Since downstream migrating fish, particularly juveniles, tend to swim within the main current, they will consequently pass the turbines without appropriate measures at the water intake [1]. Depending on site-specific conditions such as turbine type, total head, operation mode of the power plant or fish size, fish are injured, followed by a high risk of mortality [2]. Fish that refuse to enter the turbines remain in the reservoir area, sometimes for several days [3]. Physical barriers, particular trash racks with horizontal or vertical bars that are angled to the flow direction (angled trash racks) or inclined to the bottom (inclined trash racks), are one technical solution to prevent fish from turbine-passage and guide them to a bypass [4].
For these devices, bar spacing b has to be designed considering the target fish species and minimum fish sizes, while values of 10–30 mm are recommended [4,5,6]. Furthermore, a slight angle (≤45°) of the barrier to the flow direction is recommended, if an efficient bypass is located at the downstream end of the barrier [4,5,7,8].
Nevertheless, these solutions often lead to a great challenge for energy operators in consideration of increased operational and financial efforts, particularly due to debris related blockage and high head losses [8,9]. Particularly for run-of-river plants with low design heads, the head loss through a fish-friendly trash rack can cause significant relative energy production losses and hence should be part of the optimisation process of the intake structure [10]. Furthermore, for larger plants (design discharge ≥90 m3/s), these solutions are not yet feasible [11].
Therefore, an interdisciplinary research programme on a new developed fish protection system, called the flexible fish fence (FFF), was initiated. The FFF is a physical barrier, created by horizontal oriented steel cables instead of bars [9,12,13,14]. To divert fish towards the bypass, the flexible structure can be positioned in various (slight) angles to the flow direction. Thus, the fish protection effect of the FFF is similar to an angled trash rack with horizontal bars, but allows a favourable mode of operation: Local clogging at the FFF during normal operation (e.g., small branches leaves, grass) is mobilised and cleaned by releasing individual steel cables or cable clusters [9]. Since the FFF works only as a fish protection device, an additional thrash rack downstream of the FFF for turbine protection is necessary (if not already existing in the case of a retrofitting).
The presented study compared a trash rack with horizontal circular bars (geometrically similar to the FFF) to the new concept with the cables in an experiment in the flume. Therefore, the same cross section of the structure (diameter s is 5 mm) was chosen and the spacing b between them as well as the angle α of the installation in relation to the main flow direction was investigated. This allowed identifying the effect of the comparable flexible structure made of cables in relation to circular bars.
1.2. Basic Equations
The aim of the experimental study presented here was to investigate local head loss hv through a physical barrier similar or equal the flexible fish fence (FFF). In particular, it was evaluated how the specific geometry including the bar spacing, rack angle, bar shape and hydraulic conditions affect head loss through the FFF. The evaluation of the local head loss hv is based on Bernoulli’s equation and the comparison of two cross sections, which are numbered in flow direction. By assuming that the kinetic energy correction factor is equal to 1 (-), the head loss hv,total between two sections can be calculated as following [15]:
For this analysis, the elevation z1,2, pressure p1,2 and velocity v1,2 were needed for each cross section as well as two constants, namely density of water ρ and gravity acceleration g. Furthermore, the loss hv,cont based on surface roughness between the two measurement positions had to be eliminated to identify the local head loss hv due to the structure. For the current case, the flume was used in its horizontal position (z1 = z2) and the water depth h1,2 could replace the formulation of the pressure to
For most of the applications in turbulent flow conditions, the local head loss coefficient ξ can be introduced. This assumes a linear connection between hv and the velocity height :
A clear definition of the reference velocity vref was needed [16,17]. For the quantification of head loss at trash racks, the undisturbed cross upstream the structure was used (mean approach velocity) [18]. It was assumed that the velocity distribution over the complete cross section is homogeneous. For some applications and under specific circumstances, the velocity of the complete cross section of the trash rack can change significantly, which could be part of future investigations [19]. For the presented results, the velocity v1 was used as vref, hence this is a section that is in most cases easily accessible and does not include the influence of the trash rack (Section 3.2).
A differential pressure transmitter was applied in this study, which allowed directly measuring the differential pressure and increasing the accuracy of this value [15]. For free surface applications, at least one water depth is need in addition to to describe the flown through area. In the following case, the upstream water depth h1 was used as well as the continuity equation. Consequently, the local head loss coefficient ξ of the trash rack can be calculated as followed:
This evaluation was only based on the three measurements of the differential pressure , upstream water depth h1 and the discharge Q. The coefficient ξv,cont, which includes roughness and the influence of the support structure for the trash rack in the experimental set-up, had to be evaluated separately (Section 3.3).
1.3. Literature Values
A wide range of investigations are conducted to quantify the head loss (coefficient) through water intakes at hydro power plants in the past. However, most of them address conventional trash racks with vertical bars and a comparable big bar spacing. In the last years, the requirements changed since the awareness of the need for fish protection and downstream migration measures is increasing. Smaller spacing between the bars is needed as well as new developments.
One of the first fundamental investigations was carried out by Kirschmer [20] nearly a century ago. He studied the head loss on trash racks with vertical bars of several bar shapes, bar widths, bar spacings and rack inclinations. According to Kirschmer [20], the head loss coefficient is given by
where is the bar shape coefficient and considers the rack inclination β in relation to the initial vertical orientation of the bars. The geometry of the trash rack includes the bar width s and the bar spacing b. Those constants are connected with the velocity height using v as the approach velocity (comparable to the vref in Equation (3)). Extensive experiments on trash racks with vertical bars were also carried out by Meusburger [18], who expanded the basic equation introduced by Kirschmer [20]. The blockage ratio through the rack structure (including spacers and supporting elements) and through debris or trash clogging is added. Furthermore, the flow angle θ is taken in account based on adjusted calculation approaches [21,22,23]. Based on his results, the head loss coefficient is given by:
with defined by the head loss coefficient resulting from blockage, which depends on the blockage ratio p and the bar shape coefficient :
where is the area of bars; is the area through supports, spacers, etc.; and is the total area of the trash rack in the flow. The constant is a factor considering the approach flow angle and the blockage by clogging. Both factors were further described by Meusburger [18], but not considered in the current investigation.
Clark et al. [24] studied head loss on various trash configurations under pressurised flow conditions. However, research on hydraulic loss more and more focuses on fish friendly trash racks in recent years. Raynal et al. [25] tested inclined vertical trash racks with rectangular and hydrodynamic bar shapes, small bar spacings ( 30 mm) and a wide range of inclinations (β = 15° to 90°). Based on their results, they proposed a new head loss equation, where particular low angles and the separation of the blockage ratio due to bars and transversal elements are taken into account. However, their head loss equation is restricted to investigated bar shapes. Other fish-friendly solutions such as angled trash racks with vertical angled bars (bar racks) are investigated within various experiments [8,26,27,28]. With respect to the flow conditions at these trash rack types, where flow is deflected twice through the angled slats, the results and developed head loss formulas are not transferable to geometries similar to the FFF. Head loss on trash racks with horizontal bars, which are more similar to studied rack configurations, has still not been sufficiently investigated for a comparable wide parameter range. Szabo-Meszaros et al. [27] studied head losses and hydraulic conditions at six angled trash rack configurations (with vertical angled, vertical streamwise bars and horizontal bars of rectangular and hydrodynamic bar shape). The results show that head loss at horizontal trash racks is comparably low (and lowest with a hydrodynamic bar shape) and the hydraulic conditions at the bypass entrance are favourable from an ecological point of view [27]. Berger [29] studied head loss at horizontal trash racks with a rectangular bar shape for a wider range of blockage ratios (p = 0.34–0.57) and rack angles (α = 30°–70°), but similar to the above results are not directly transferable to the current study due to differences in the experimental design (e.g., they included a bypass and different hydraulic conditions).
According to the circular bar shape, length L and small bar spacings, the studied racks are highly vulnerable to flow-induced vibrations, which additionally affect head loss. In general, the vertical amplitudes of these vibrations are dependent on the frequency, the preload forces and cable length as well as the flow velocity [14]. This study evaluated basically the effect of blockage and rack angle on head loss on angled horizontal trash racks with circular bars (CBTR), where vibrations were firstly mitigated by an additional spacers. Further, the same parameters were studied at the FFF and compared with the former results to estimate the effect of cable vibrations on head loss. Finally, it was evaluated if the common formulas for head loss estimation (Equations (5) and (6)) at (inclined) trash racks with vertical bars are transferable to the rack configurations.
2. Materials and Methods
2.1. Experimental Setup
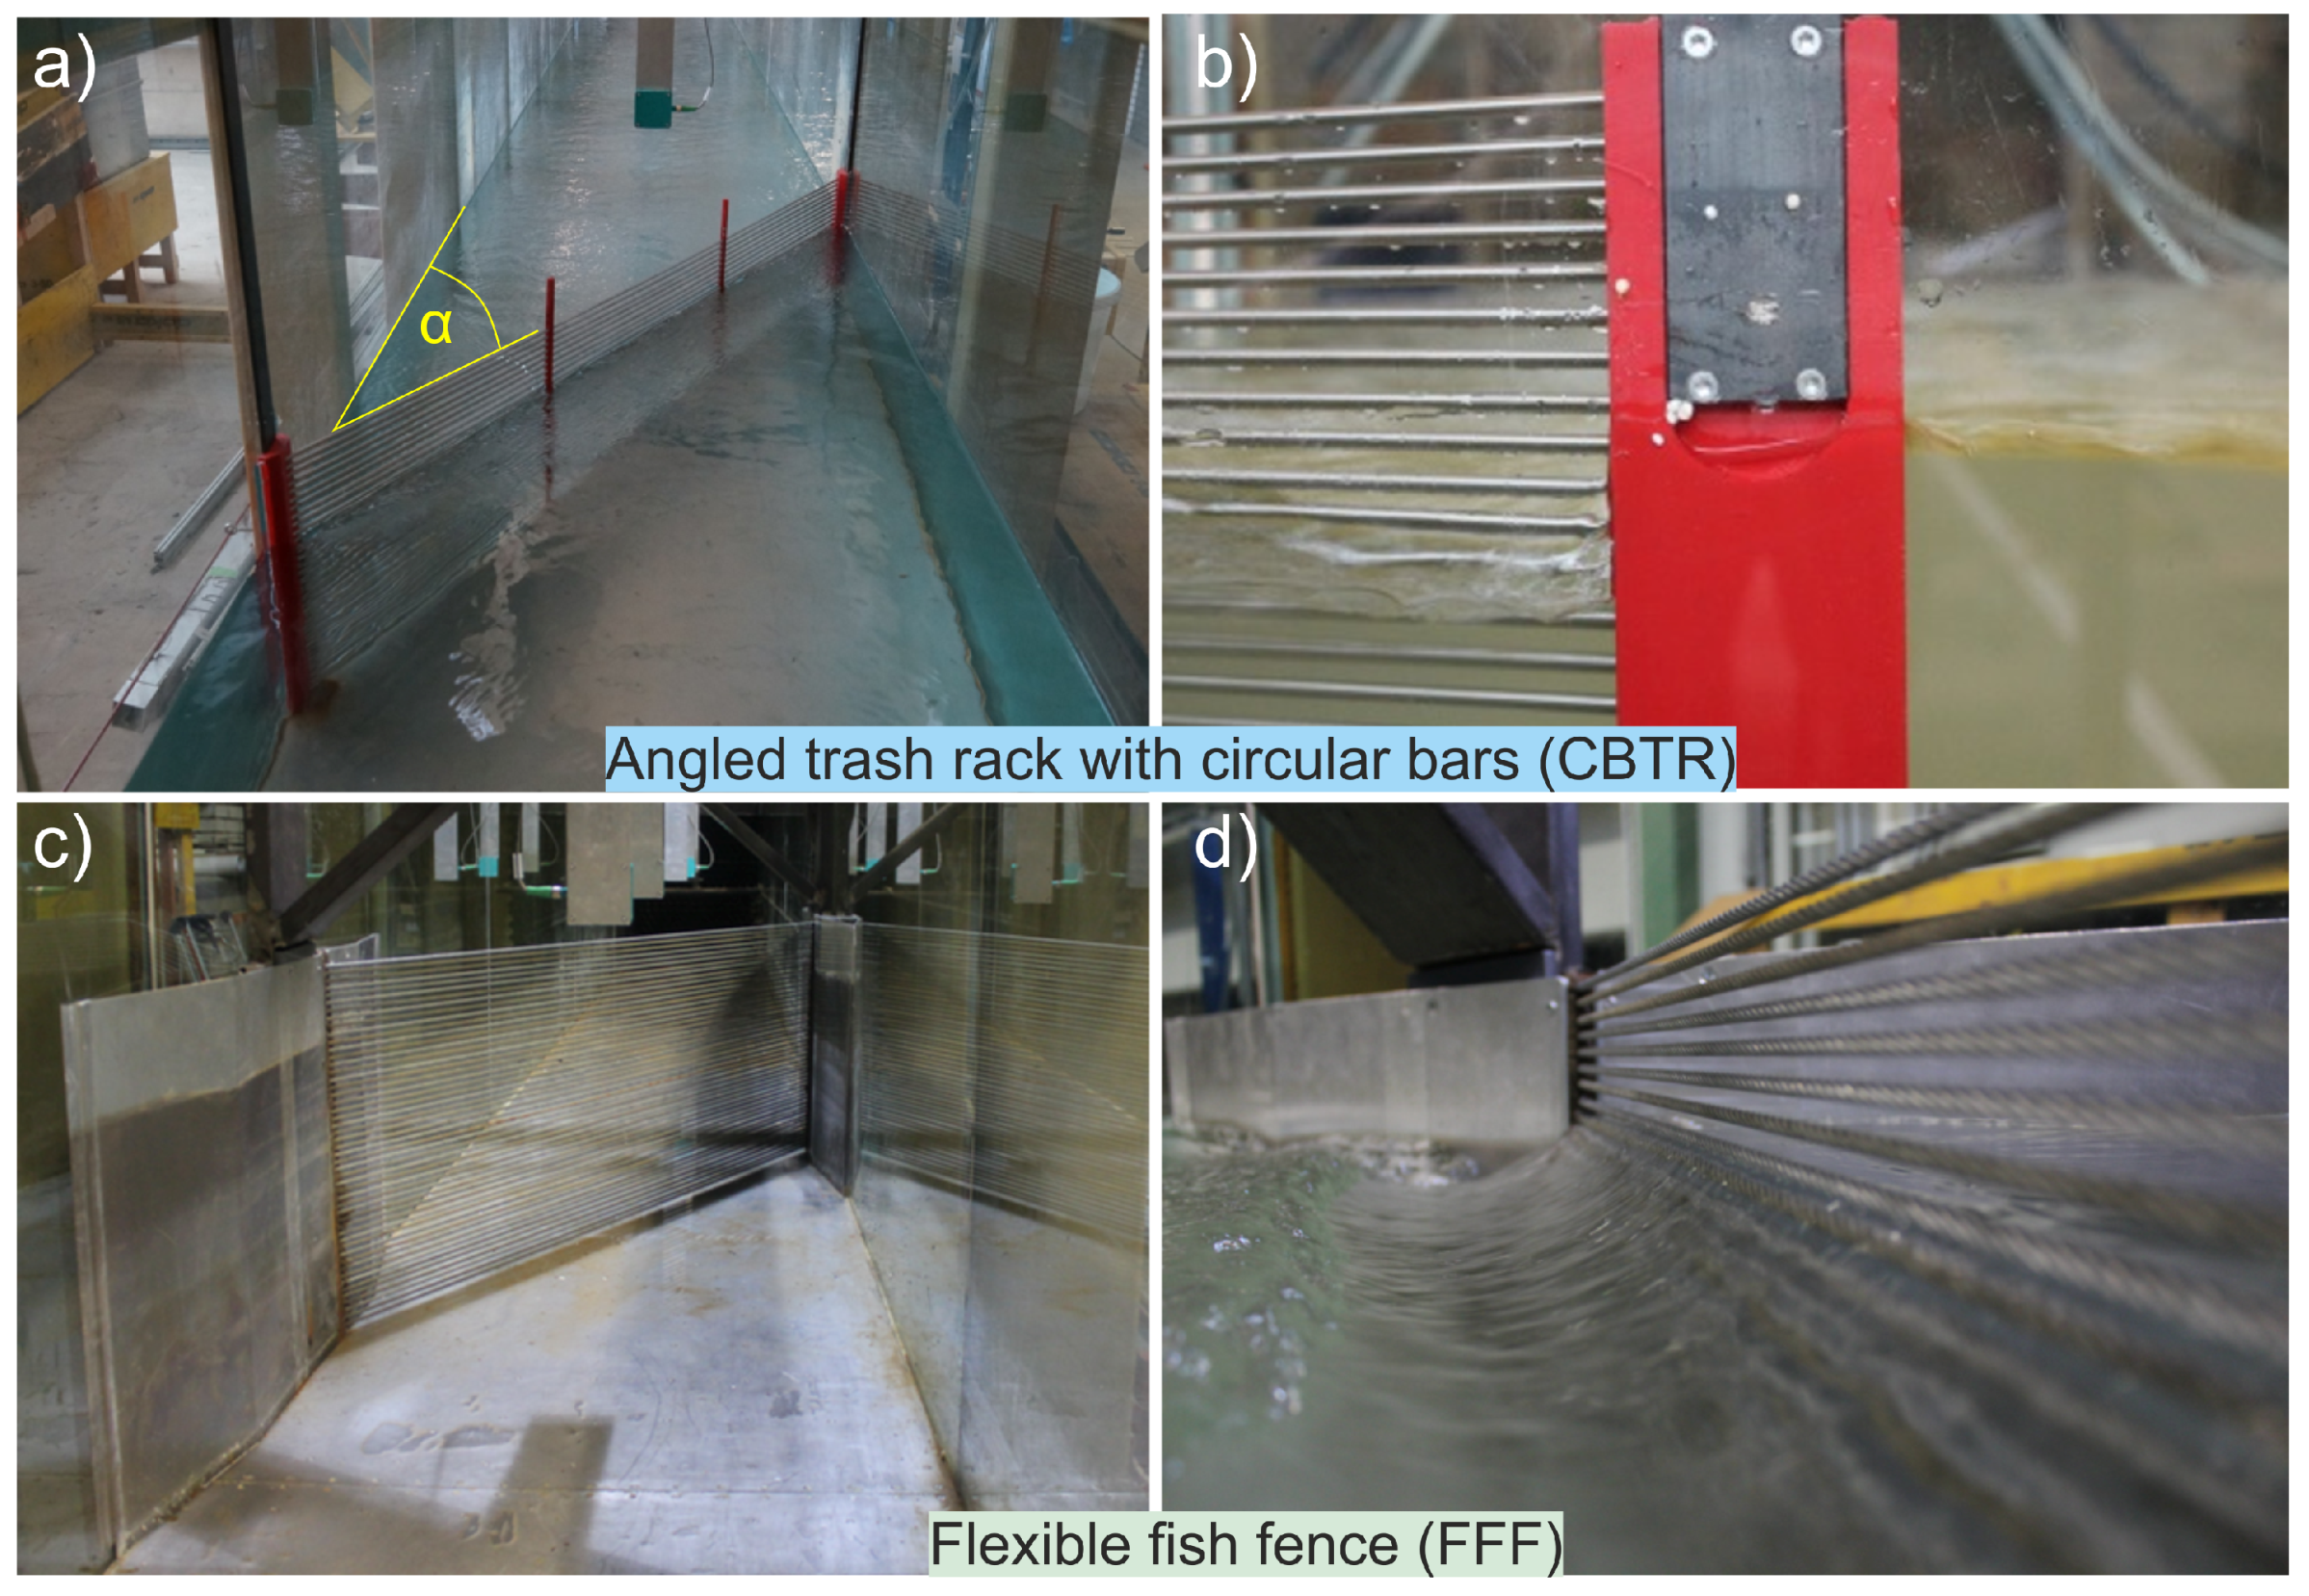
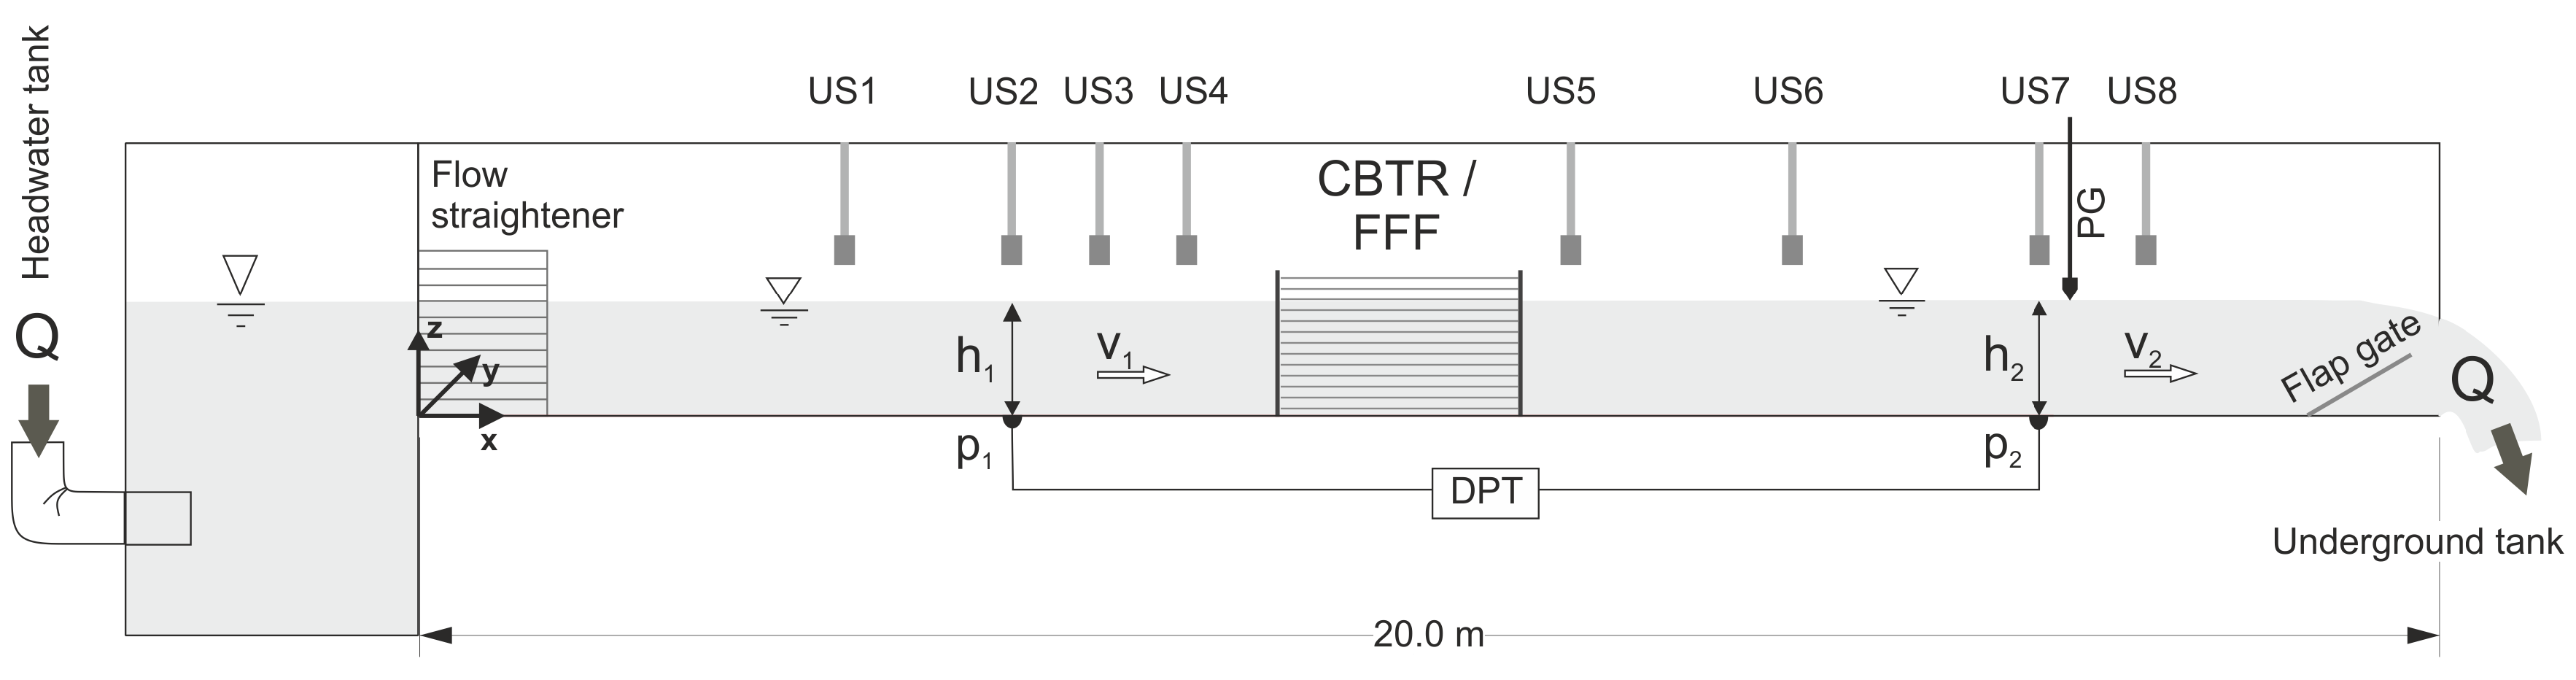
The experiments were carried out in a rectangular channel at the Hydraulic Engineering Laboratory at the University of Innsbruck and split into two different main configurations: (a) circular bars (CBTR); and (b) cables (FFF) (Figure 1). The flume is 20 m long and has a width B of 0.8 m. On both sides, 1 m high glass side walls allow observing the experiments. The water supply from an elevated tank fills up a tank and a flow straightener homogenises the flow further (Figure 2). At the outlet of the flume, the water flows over a flap gate into the underground tank, where it is pumped back to the elevated tank. It is noted that water temperature did not changed through this circulation process because of the high volume of both tanks. The discharge Q was varied from 50 to 230 L s−1, which corresponds to approach velocities from 0.16 to 0.72 m s−1, and bar Reynolds numbers from 750 to 3500. The Bar–Reynolds number is thereby defined by
All experiments were conducted with turbulent flow conditions (see Reynolds numbers in Table 1). In this definition, the velocity v1 in front of the installation was used and consequently the water depth h1 multiplied by the width B of the flume allowed connecting the discharge Q. With the kinematic viscosity ν, the properties of water were taken into account and, for the characteristic linear dimension, the diameter s of the bars/cables was used (Table 1).
A flap gate at the end of the flume allows controling the tailwater depth. In all experiments and independent of the discharge Q, the water depth of 0.4 m was maintained at the flap gate. This was controlled with a point gauge (PG) at x = 17 m, which is 0.3 m upstream of the ultrasonic sensor (US) 8.
The investigated trash racks were installed 9.6 m downstream from the channel inlet. The FFF requires high preload forces to tension the cables. A solid self-supporting structure had to be designed to install this in the glass-sided flume (Figure 1c). The influence of the supporting structure was minimised as far as possible. Separate experiments were conducted without the bars or cables to allow identifying head loss through the supporting structure at the flume walls together with the frictional loss. Based on the dominant influence of the free surface flow, an upscaling should be conducted according to Froude similarity [30]. All components were designed in a scale λ of 1:2, considering the ratio of water depth to bar width h/s ≥ 60, which ensured that the resistance of the bars does not depend on the Froude number [21].
2.2. Measurement
In each single experiment, the same procedure was applied. In a first step, the discharge Q through the flume was changed by the main inlet valve and then we waited until it was stable. Furthermore, the downstream water level at the end of the flume was adjusted to a water depth of 0.4 m. After steady flow conditions were reached, the measurement was conducted. Each condition was observed for approximately 10 min. At eight measuring points along the flume centre axis, the water levels were measured by ultrasonic sensors (US) (Figure 2) with an accuracy of ±1 mm and measurement frequency of 5 Hz. The point gauge was randomly used to control the measurement of the US8. Additionally, the pressure head loss through the CBTR and the FFF, respectively, was measured with a differential pressure transmitter (DPT) with a higher accuracy (±0.2 mm). Therefore, the two measuring points were located approximately 3 m upstream (measurement point US2) and around 6 m downstream of the racks (US7). Based on the measurements of the other US, it could be determined that US2 and US7 were in a homogeneous flow condition and not influenced by the racks or the flap gate (Figure 2).
The discharge Q was derived by two pipes from the headwater tank of the laboratory and measured with a magnetic inductive discharge-meters (MID) of ±1% accuracy. A plausibility check was conducted based on the needed weir height to reach the steady tail water height of 0.4 m. Therewith, all measurements, namely discharge and water depth, were redundant and could be checked independently.
2.3. Investigated Parameters
The circular cross section of the circular bars and the cables were identical with a diameter s of 5 mm, which allowed identifying the influence of cable vibrations. A supporting structure holds the rack at the side walls over a rack height of 0.5 m. Flow-induced vibrations were comparably strong based on the circular bar shape. These vibrations were intended to be excluded or even mitigated for the investigated option CBTR. Thus, additional spacers were applied (one for α = 90 and 45° and two for α = 30°, Figure 1a), which consist of rounded bars of a width of 5 mm and were tested as part of preliminary experiments.
In a first step, the bar spacing was varied from b = 5 mm to 15 mm, which reproduced full-scale bar spacing between 10 and 30 mm. Consequently, the ratio s/b [20] was 0.33–1.0 and blockage ratio p [18] ranged from 0.25 to 0.5, respectively. It is noted that the ratios s/b [20] and p/(1 − p) [18] were equal for both rack options since the few transversal elements installed at the CBTR had no significant effect on p. The second main parameter for the investigation is the rack angle α related to the flow direction (Figure 1). For the CBTR, three angles were studied from fish-friendly (α = 30° and 45°) to the conventional (α = 90°) resulting in variable lengths of the bars. For the FFF, fish-friendly solutions with smaller rack angles were the focus of the study. Thus, α was varied in a smaller range with α ≤ 40° (Table 1).
In total, nine different geometries were investigated under six steady discharges, as summarised in Table 1. Each measurement was repeated in a different order so that independence of the previous experiments could be ensured. Additional reference experiments allowed determining the head loss hv,cont, which includes the surface friction as well as the supporting structures (trash rack without bars or FFF without cables, respectively). Those were conducted for the whole discharge range and all observed angles α. Consequently, the main study was based on 216 basic experiments and 36 reference tests.
3. Results
3.1. Overview
The investigated head loss was comparably small and close to the measurement accuracy as well as the nearly unavoidable changes in the water level in the flume with higher discharge. Therefore, the verification process of the measurement process is of great importance and is presented in Section 3.2. The constant losses due to the supporting structure and friction are quantified in Section 3.3 and later excluded from the main results of the investigated different options. For each of the two options, namely the trash rack (CBTR) and the flexible fish fence (FFF), the effect on the head loss based on the spacing between bars or cables, respectively, as well as the angle α are considered in Section 3.4. A direct comparison was conducted for an angle α equal to 30°. Further, the measured head loss coefficients were compared with literature equations and a regression model is fitted to the data to adapt Equation (6) to the studied rack options. This would allow implementing the findings in future applications with comparable settings.
3.2. Measurement Accuracy and Data Verification
As a first step of the verification process, each individual measurement was analysed independently of the investigated option and parameter combination. It was assumed that the investigated rack geometry had no effect on the individual analysis. Consequently, all runs were simultaneously checked to verify the chosen analysis method for the measurements. The second part of the verification process focused on the calculation of the total head loss coefficient ξ*, which includes the constant losses due to the support structure and friction (Section 3.3). Generally, it was assumed that ξ* is a constant value and only depending on the geometry. This allowed connecting the local head loss hv with the velocity height in front of the installation, as presented in Equation (3). For the verification of the calculation, the total head loss hv,total based on Equation (1) was applied for the two main sections US2 and US7 (Figure 2).
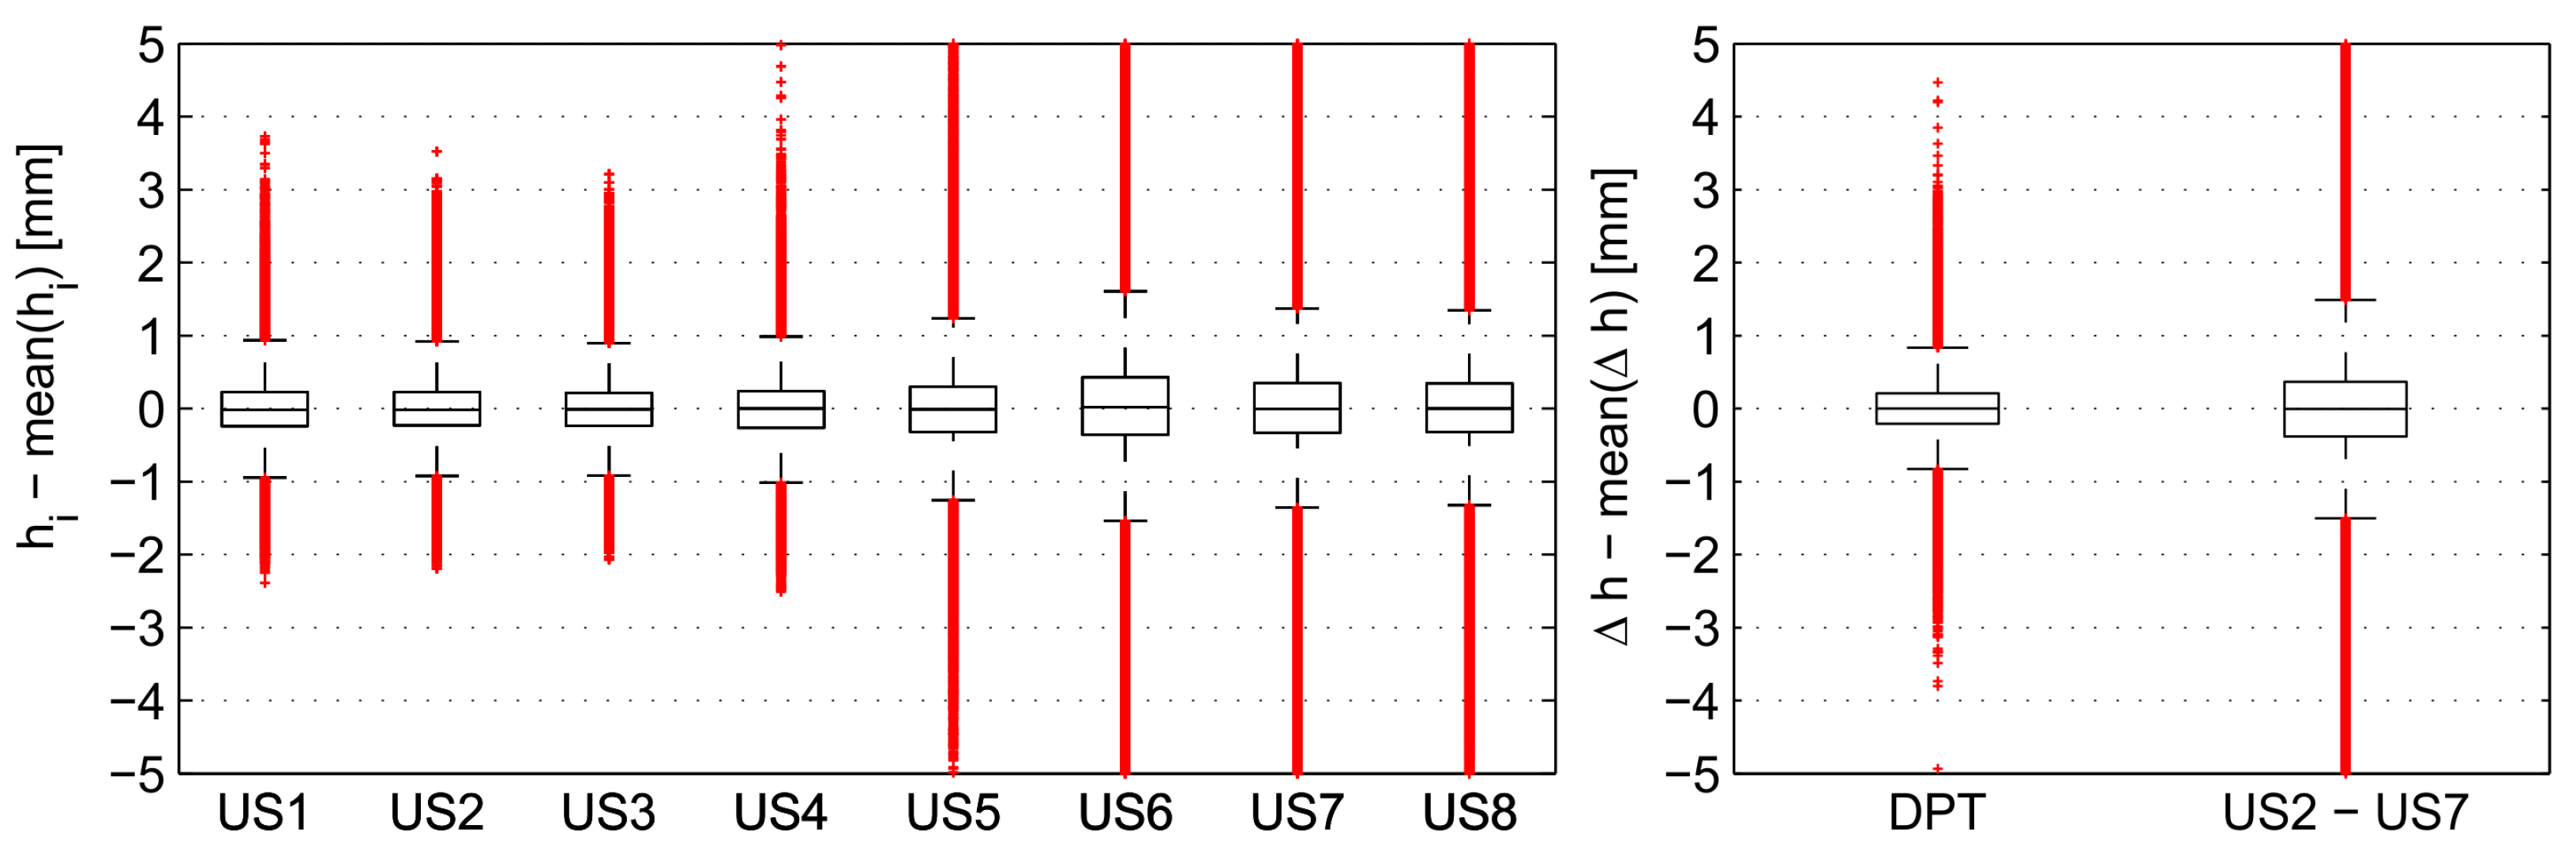
Figure 3 presents all measurements standardised by the mean value of each individual parameter combination for all eight ultrasonic sensors (US) as well as the two different approaches to evaluate the pressure difference between the two sections. The found deviations of the mean values are in the range of a few millimetres and can be caused by the measurement accuracy but more likely by waves. The scattering of the measured water depths downstream of the trash racks (US5–US8) is generally higher than for measurements upstream of the investigated structures. Increased turbulence causes this effect, as expected. Based on this analysis, the velocity v1 was chosen as a reference velocity vref in Equation (3) for the calculation of the total local head loss coefficient ξ*, respectively, ξ for the main investigations.
A similar analysis was conducted for the pressure difference between the two cross sections US2 and US7 (Figure 3). The direct measurement with the differential pressure transducer (DPT) shows a comparable result to the single US measurements upstream of the structure. The uncertainty would increase, if instead the second US measurement were used to evaluate the pressure difference (US2–US7 in Figure 3). To further investigate this, the parallel measurement with the differential pressure transmitter ΔhDPT can be put in opposition with the ultrasonic sensors difference ΔhUS = US2–US7, as shown in Figure 4. Ideally, all points of each individual measurement would lay on the blue line of equality for this analysis. Obviously, the pressure head values differ considerably and partially strong outliers are produced by the ultrasonic measurement, which can also be seen in Figure 3. If the individual measured values are averaged for each measurement (Figure 4, right), it can be seen that the single outliers do not have such a significant influence on the mean value. Nevertheless, the previous comparison highlights the importance of the DPT to measure the differential pressure ΔpDPT with a very high accuracy, as known from previous studies [15,19]. The DPT was further chosen as input values for the ξ-calculation based on Equation (4).
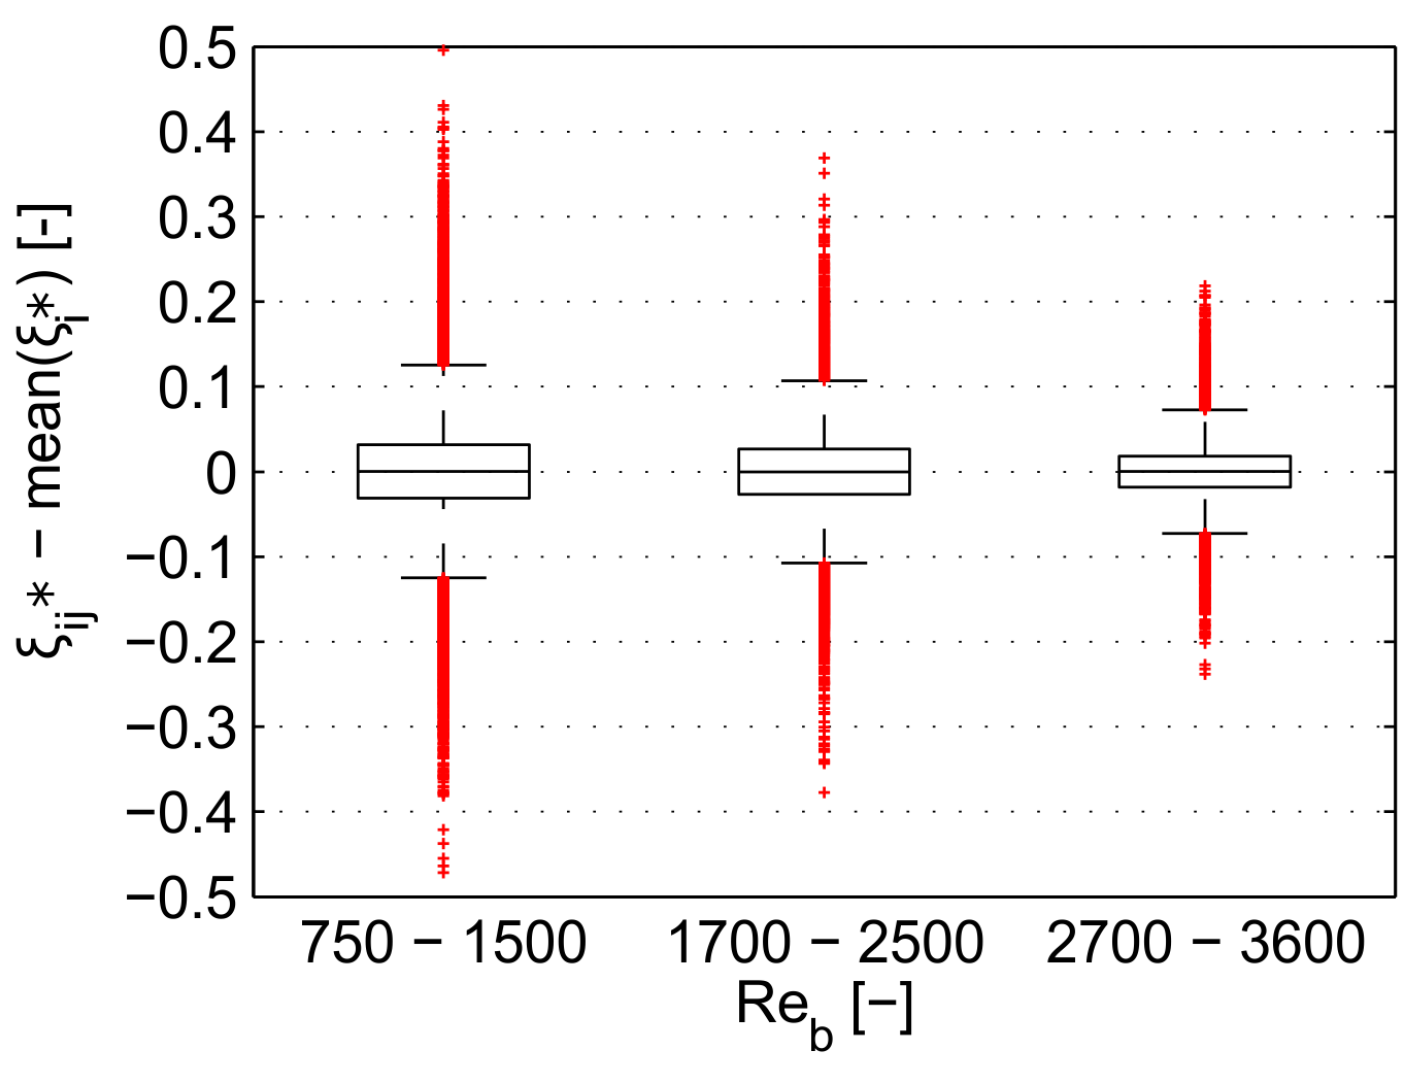
In the second part of the verification, the influences of the chosen measurement values h1, ΔpDPT and Q on the local head loss coefficient was investigated based on Equation (4). For this, the variable ξ* was used, which is based on the total loss including also those separately investigated (Section 3.3), hv,cont or ξv,cont. The coefficient was calculated based on each of the 2700 single measured values (j) for each parameter combination and rack option (i). Those results were standardised by the corresponding mean value of the measurement and presented in three classes depending on the Bar–Reynolds Number in Figure 5. The fluctuations are in the range of 0.1 (-) and decrease with a higher discharge. In a previous step, the influence of the averaging was investigated. The difference between the mean value of and a single calculation of the coefficient based on the previously averaged measurement values is negligible.
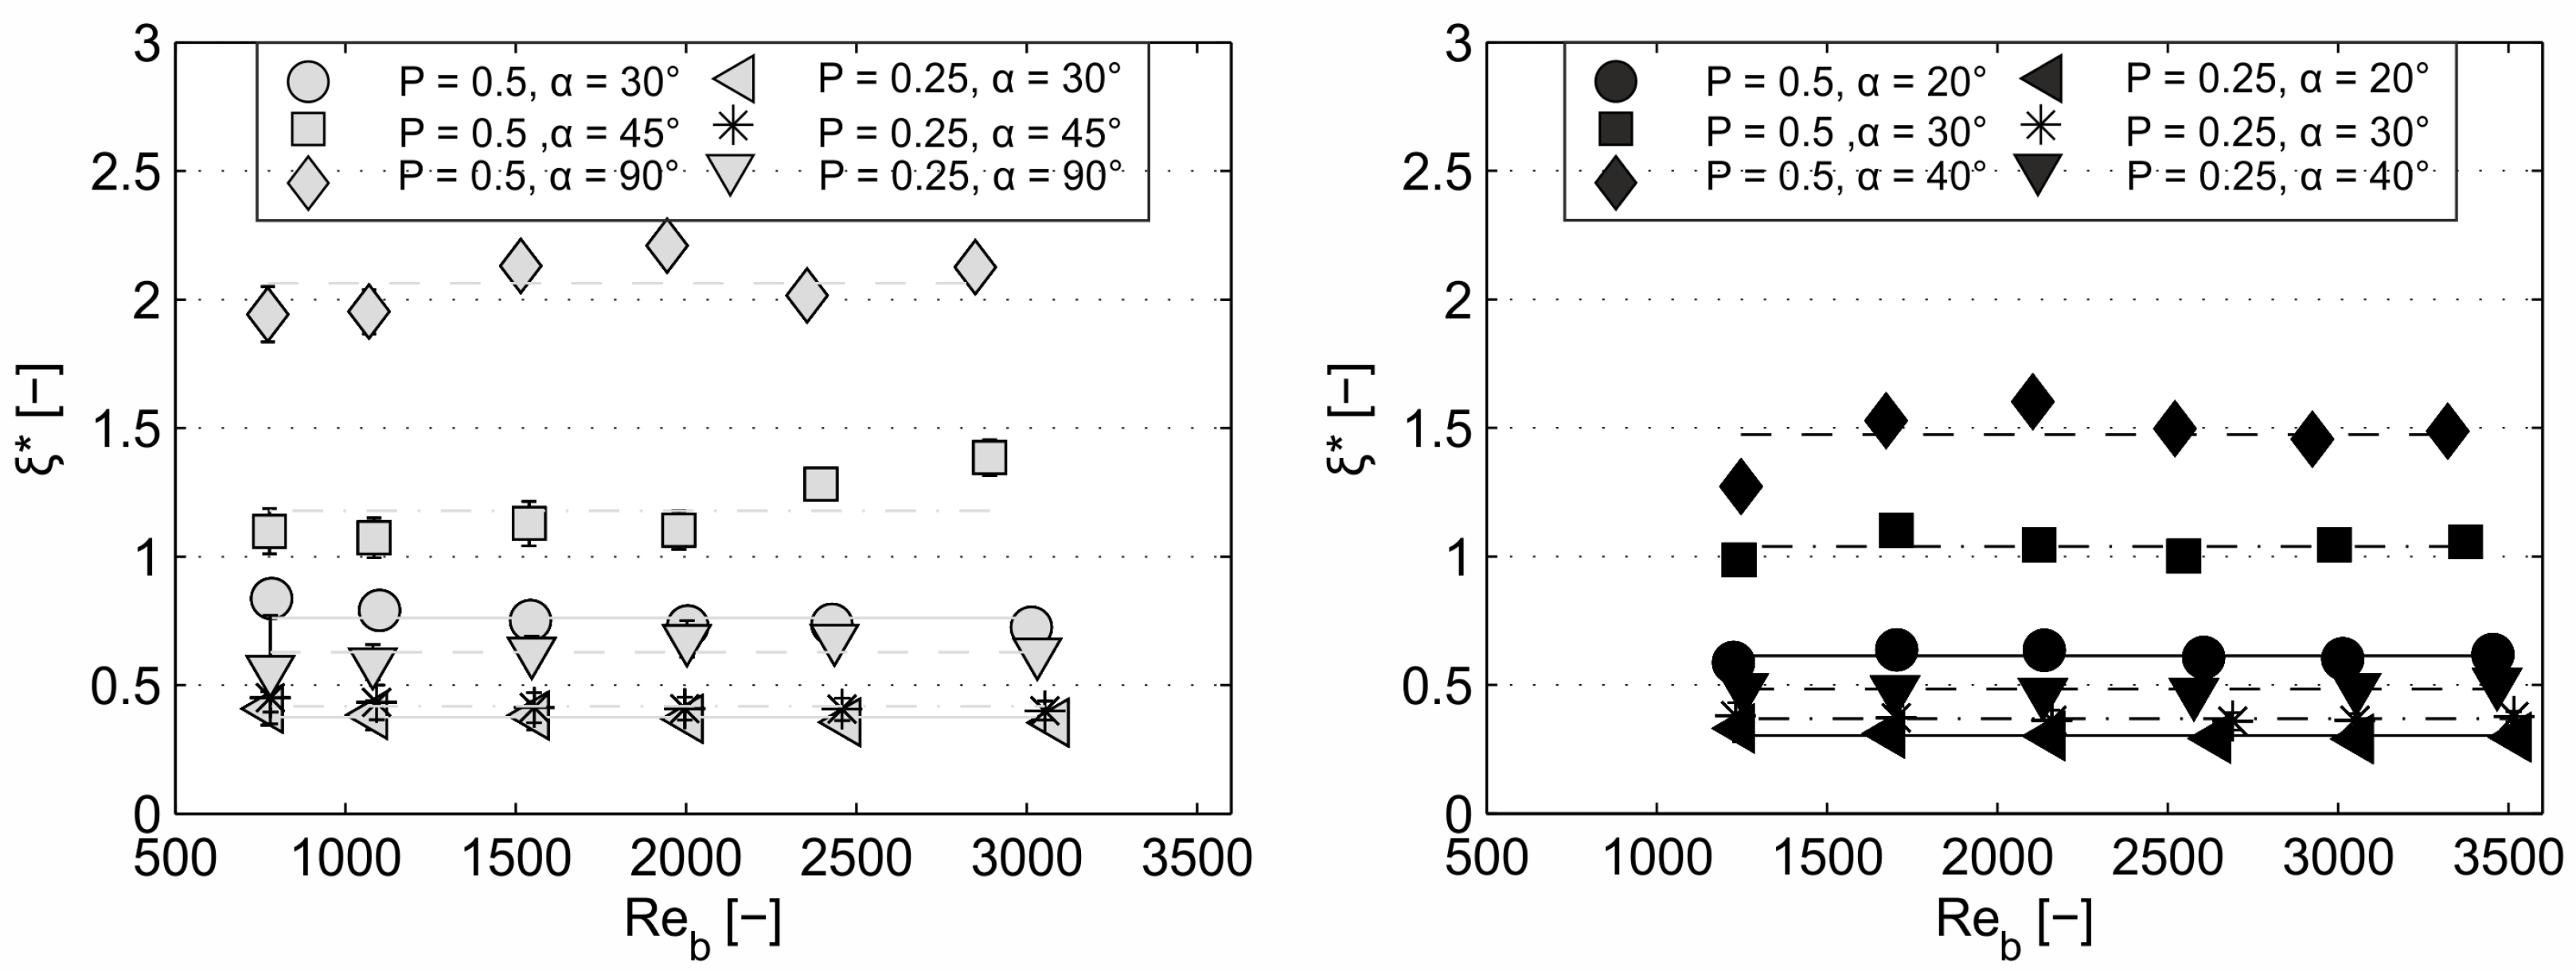
In the analysis, the assumption is made that the local head loss coefficient is independent from the discharge Q under turbulent conditions. Hence, the model scale of 1:2 is expected to have no influence on the studied Bar–Reynolds numbers. The resistance coefficient of circular bar shapes is nearly independent in the range of of 500–20,000 [31,32]. Nevertheless, recent studies on trash racks or bar racks with rectangular, rounded and hydrodynamic bar shapes recommend Bar–Reynolds numbers higher than 1500 [18,25,26,28]. Since the experiments of this study covered the range of of 750–3500, the scale effect of the physical model was checked for the studied cylindrical bar shapes in order to ensure the transferability of the results to nature conditions. Figure 6 demonstrates that is roughly independent from for both trash rack types. Thus, the results can be transferred to applications under full-scale conditions.
3.3. Head Loss Through Supporting Structures and Surface Friction
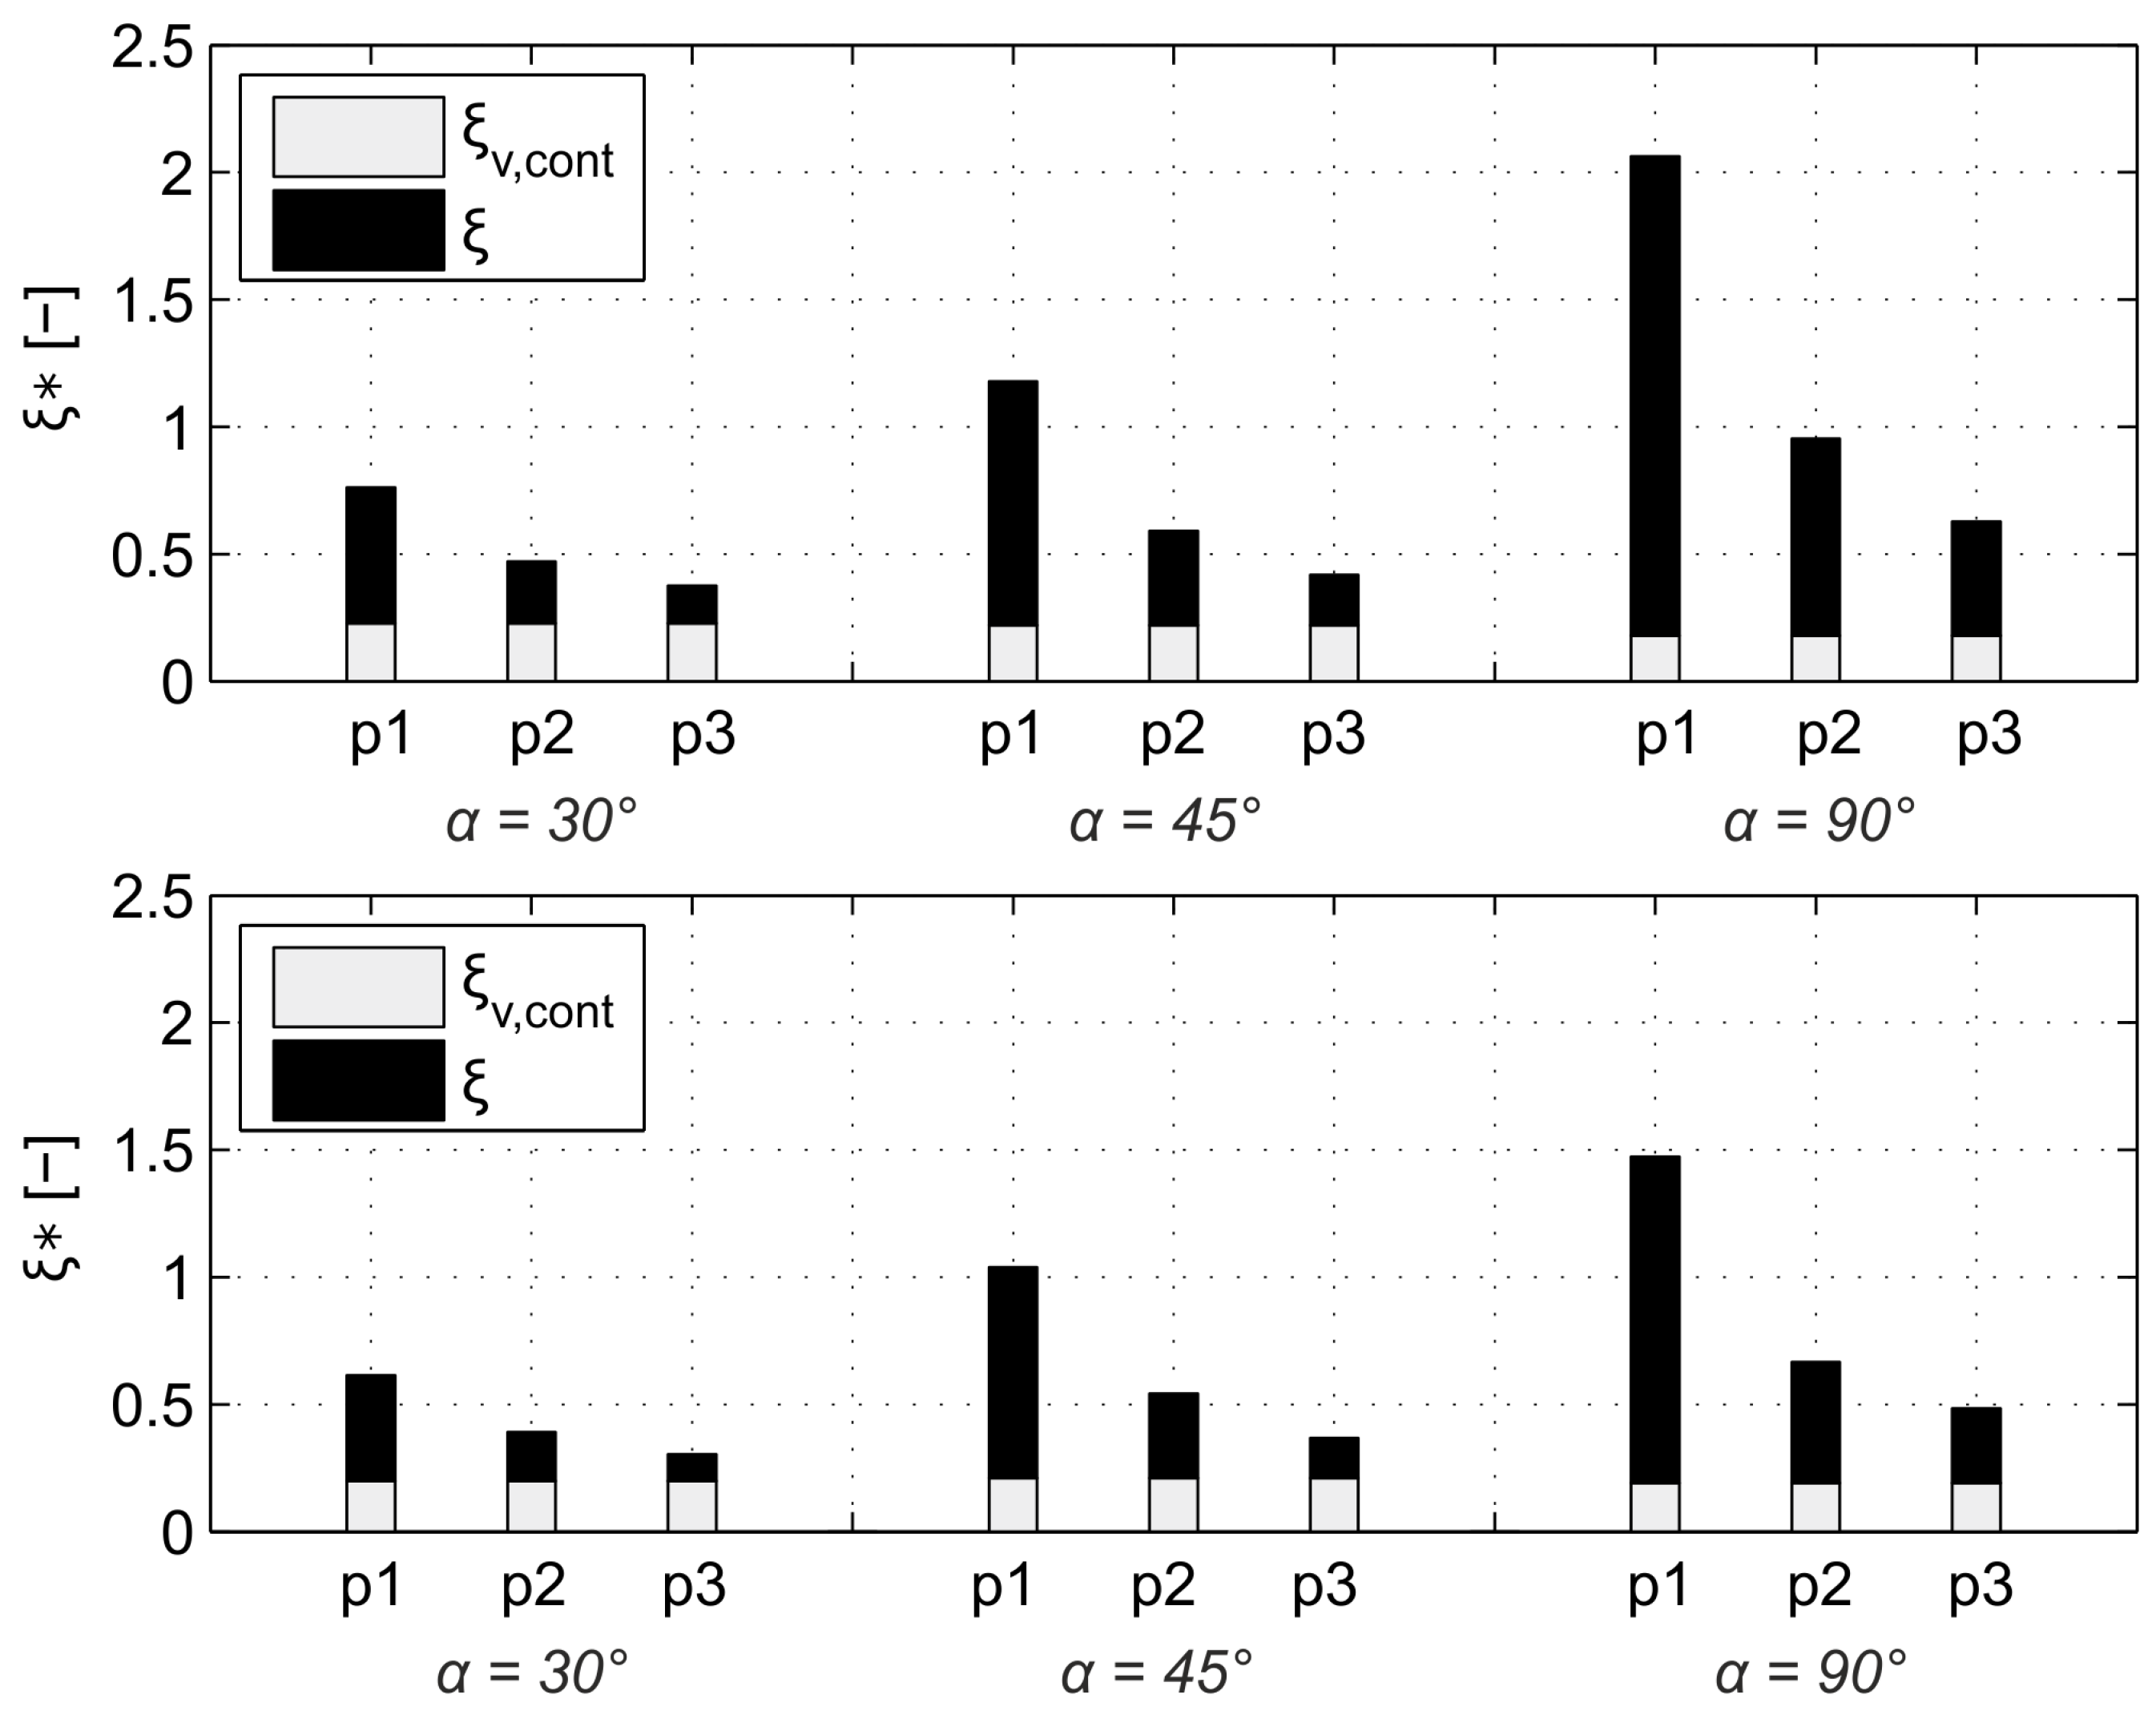
The installation of the trash rack (CBTR) and the flexible fish fence (FFF) in the experiments required supporting structures on both sides on the channel wall (Figure 1). For the FFF, this differs to real applications where these supporting structures are not exposed to the flow [9]. However, these supporting structures were optimised regarding their size and shape, but they still caused an additional form resistance to the flow. Therefore, the reference head loss hv,cont was measured without bars/cables and only remaining supporting structures. Thus, hv,cont includes the influence of the supporting structure as well as the friction of the flume boundary. The bar plots in Figure 7 demonstrate that head loss coefficients ξv,cont for both rack types and the studied rack angles are all in a similar range of ξv,cont≈ 0.2, which is a substantial part of the measured loss in comparison to those due to the investigated structure. For the perpendicular CBTR (α = 90°), ξv,cont tends to be slightly lower, which is probably due to the fact that flow separation is concentrated at one location. Obviously, the proportion of ξv,cont on ξ* is relatively high depending on the rack configurations up to 2/3 of ξ*.
3.4. Head Loss Coefficients of the Rack Configurations
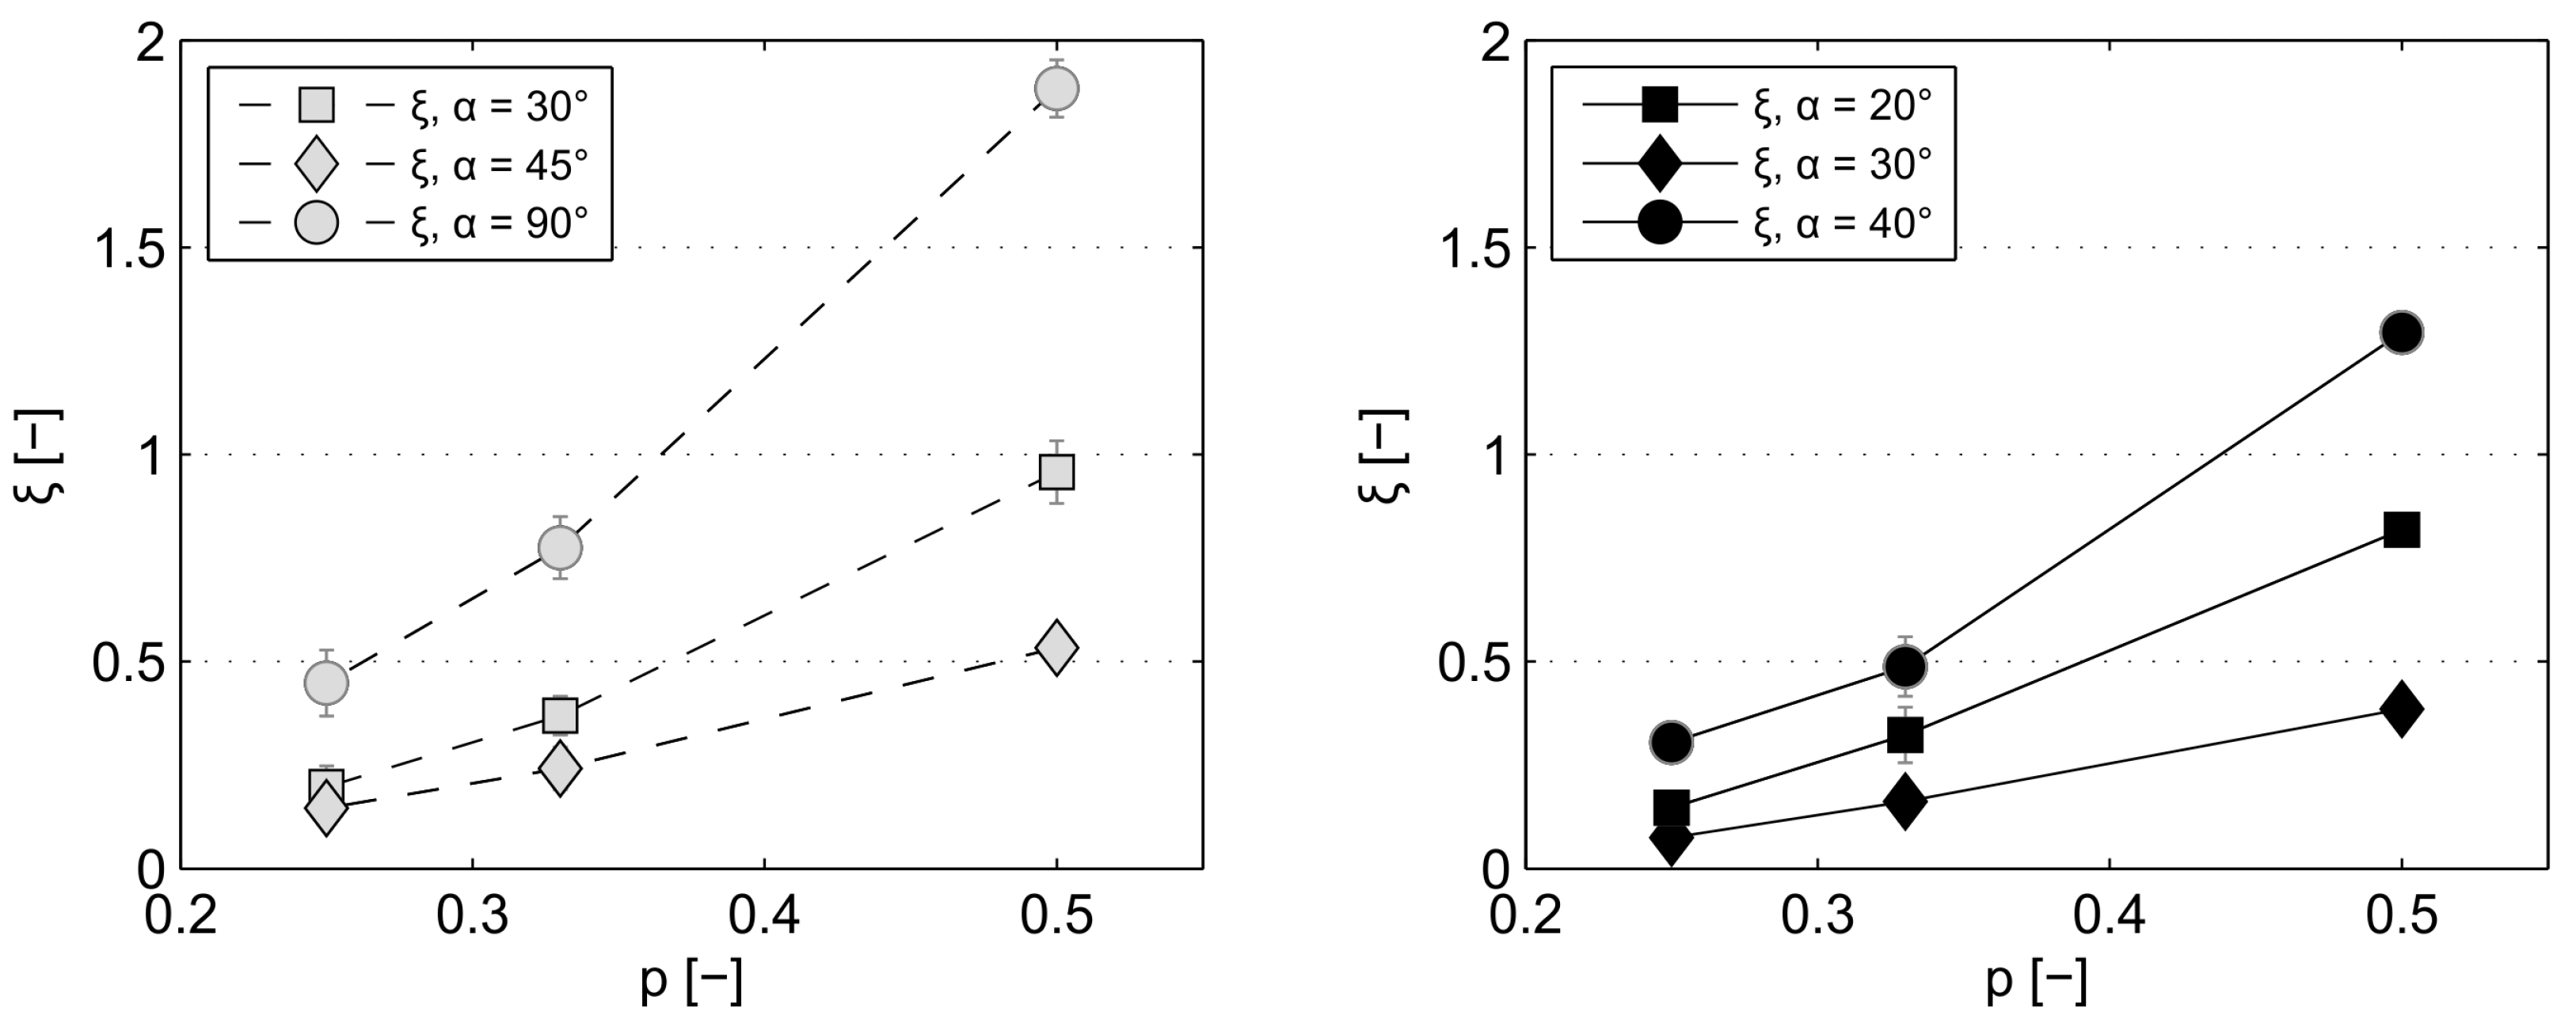
The following presented results focus on the varied parameters spacing b and angle α (Table 1). All ξ-values measured at the trash rack with circular bars (CBTR) and flexible fish fence (FFF) are summarised in Table 3, in which similar configurations of both options are highlighted. Figure 8 demonstrates the effect of blockage ratio p—introduced in Equation (7)—on the head loss coefficient ξ, calculated by subtracting ξv,cont (Section 3.3) from the total head loss coefficient ξ*. As expected, ξ increases disproportionally with increasing blockage ratios for both investigated rack options. Thereby, the increase of ξ with p positively depends on the angle (Figure 8). Furthermore, the comparison of the results with α equal 30° in Figure 8 reveal that the influence of p on ξ is more pronounced for the FFF.
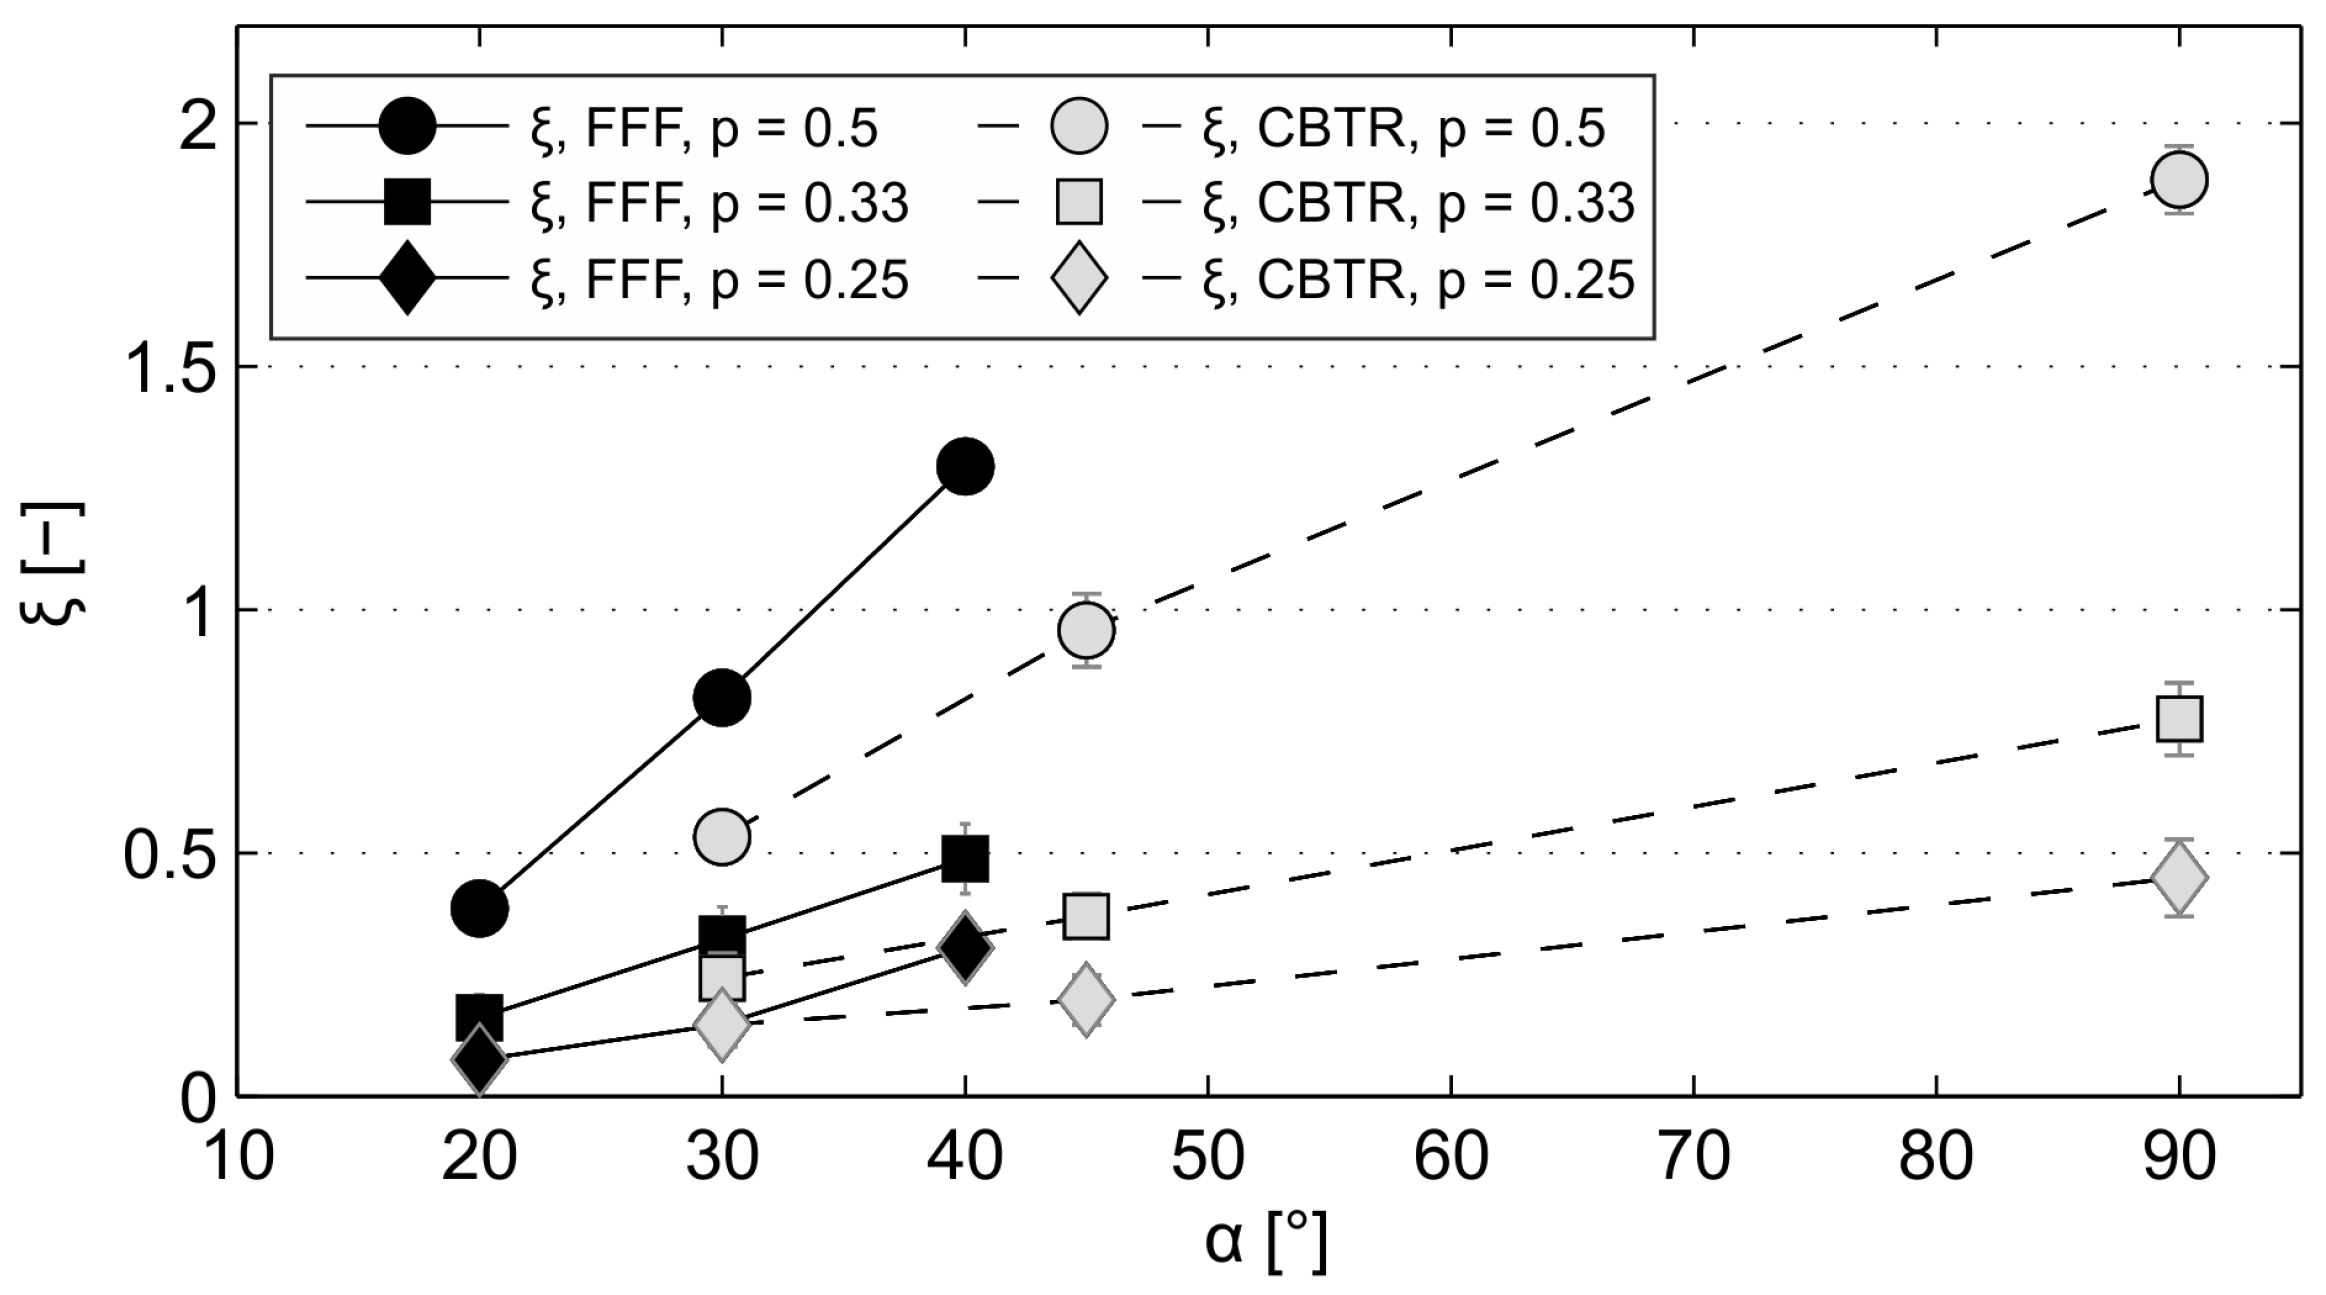
The effect of rack angle α on ξ is shown in Figure 9, where the measured data at the CBTR and FFF with all investigated p are all illustrated in one plot. Head loss coefficient ξ increases with increasing α and it is generally stronger for higher blockage ratios p. The comparison of the ξ-values revealed a stronger impact of α on ξ at the FFF than at the TR (Figure 9) in the range of α ≤ 45°.
Besides the stronger trend of ξ with α observed at the FFF, the value of ξ at all rack configurations with α = 30° is up to 53% higher (p = 0.5, Table 3) for the FFF than for the CBTR. However, the magnitude of the head loss coefficient ξ is generally low for both rack options and for certain rack configurations of similar order than ξv,cont (Figure 7). In this respect, it is worth noting that ξv,cont of the FFF is probably lower for full-scale conditions, since the supporting structures are there usually not exposed to the flow.
3.5. Empirical Relations to Predict Head Loss of Angled Racks
An attempt was made to estimate the head loss of both rack options by applying the methods according Equation (5) provided by Kirschmer [20] and Equation (6) modified by Meusburger [18]. Both methods are developed for vertical (inclined) rack types and it is known that the approaching velocity at the inclined trash rack can change significantly over the cross section with a peak at the far end of the inclined structure [25,33]. Nevertheless, it was assumed that the vertical inclination β of Equation (5) and Equation (6) can be replaced by the horizontal angle α. Thus, the modified equations used in this study are defined by:
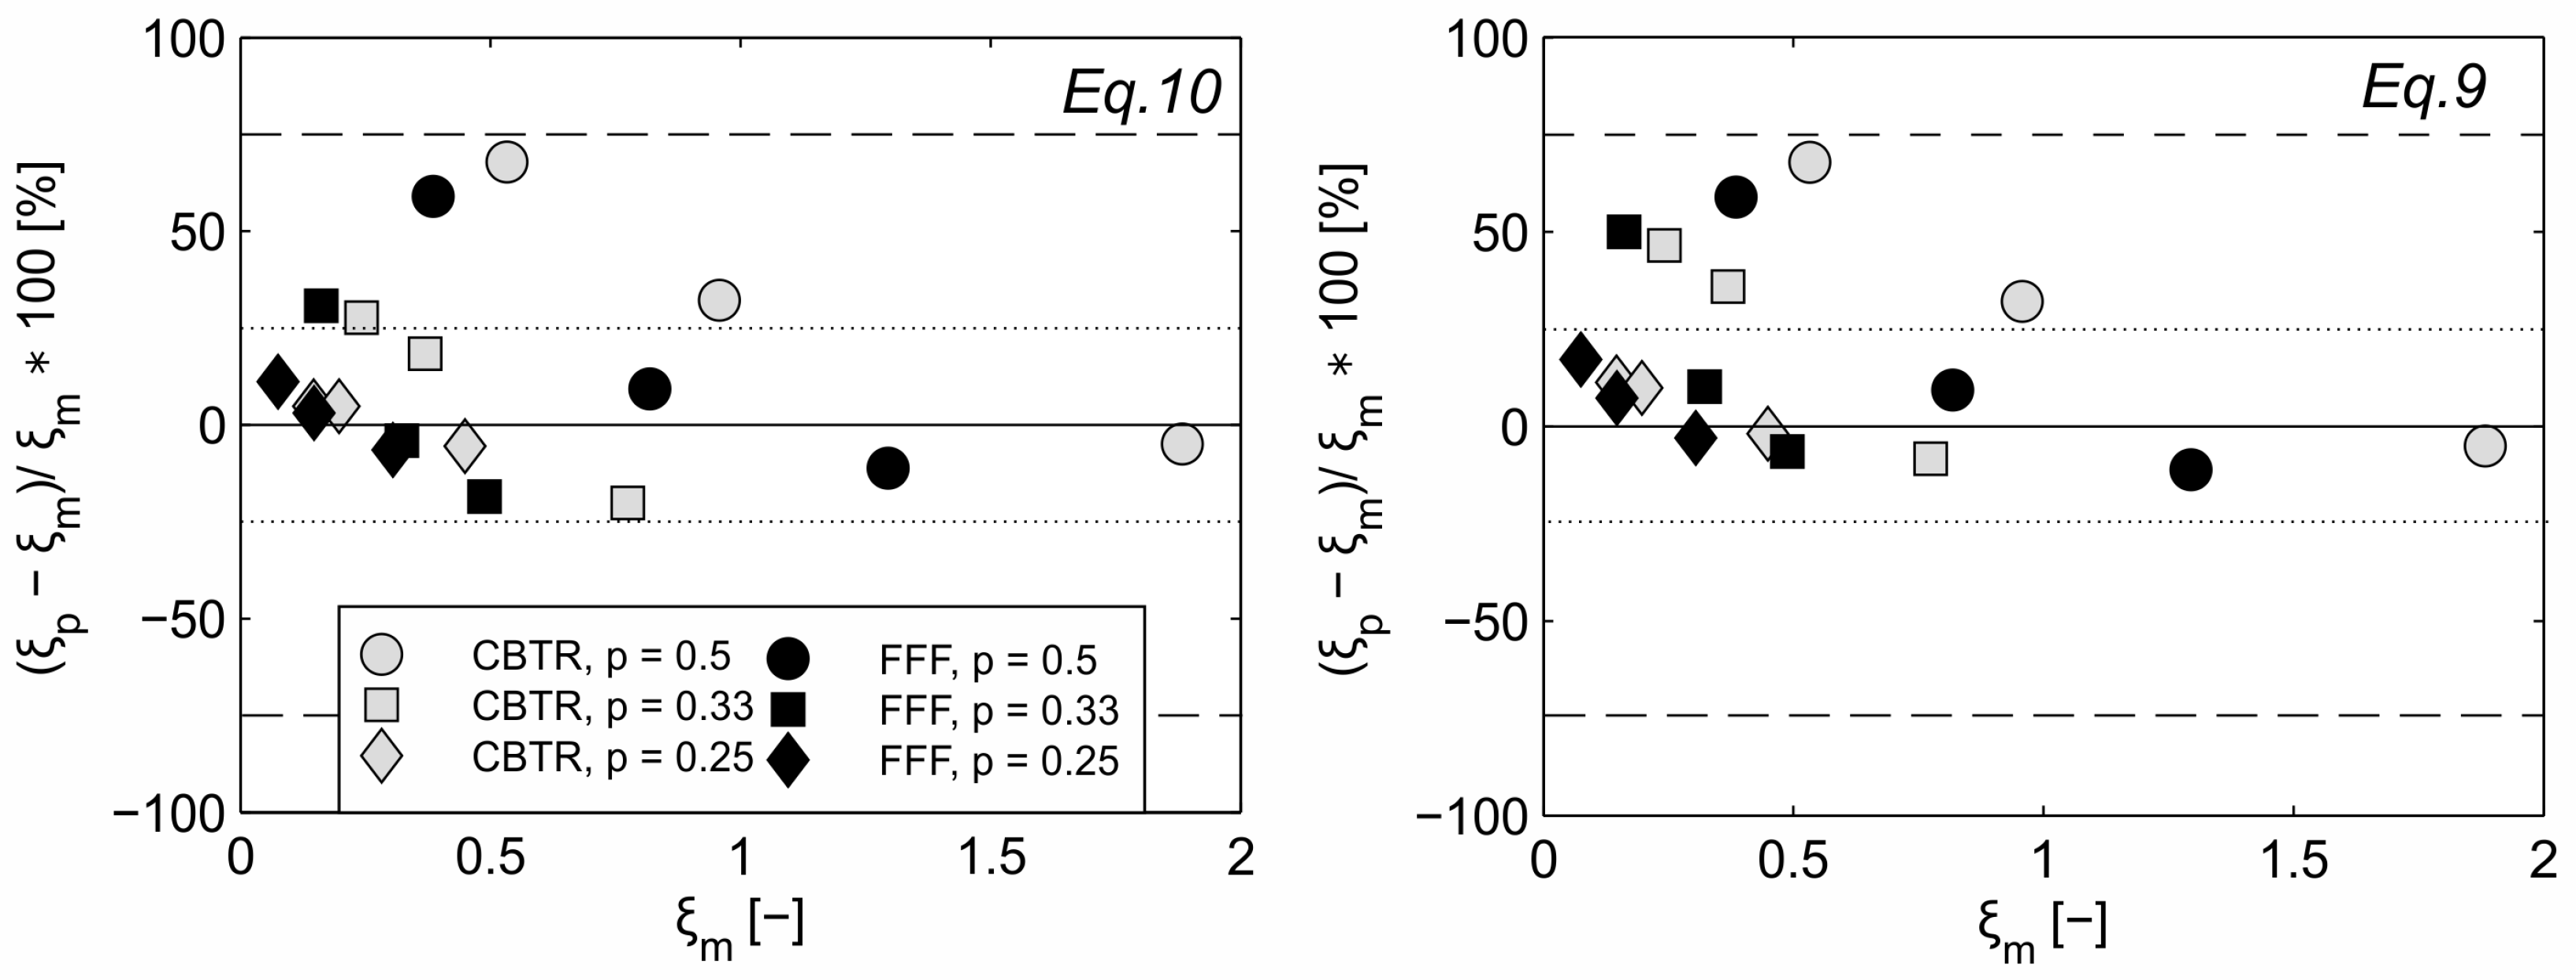
Herein, was set to a constant value of 1.79, representing the bar shape coefficient for circular bars. It is noted that the and ratios were similar for both options, since the influence of transversal elements were negligible small for CBTR and absent for FFF. Figure 10 demonstrates the percentage deviation of the predicted head loss coefficients with Equation (10) (left) and Equation (9) (right) from the measured ξ values with the ±25% and ±75% lines. Around 80% of the measured ξm values at the FFF and 70% at the CBTR deviate from the predicted ξp coefficients with Equation (10) (less than ±25%), while the proportion is slightly lower for ξp with Equation (9). The comparison of predicted and measured head loss coefficients also revealed a positive overestimation of ξm for both formulae. Again, this is slightly more pronounced for the formula of Kirschmer (Equation (9)). Additionally, the deviation of predicted and measured ξ is correlated with the angle. There is an overestimation with the smallest angles and particularly for the highest blockage ratio p = 0.5 and a slight underestimation with the highest angles (α= 90° for CBTR and α= 40° for FFF). To compensate this overestimation, ξfitted was introduced based on a modified Equation (10), in which the measured head loss coefficients ξm are used to obtain the coefficients k0 to k2:
Therefore, a multiple linear regression analysis with the log-transformed parameters and was performed. Table 4 shows the corresponding coefficients k0 to k2, R2 and RMSE (root-mean-square error) for the measured head loss coefficients at the CBTR and the FFF. The exponent of is defined by k1 and is 1.30 for the CBTR and 1.44 for the FFF, respectively, and in a similar range of both equations. In contrast, the exponent k2 of sin(α) with 1.70 for the CBTR and 1.96 for the FFF option varies widely from the proposed value of Kirschmer [20]. At least, the coefficient k0 with exp(0.59) = 1.8 for the CBTR matches well with the bar shape coefficient of 1.79 for circular bar shapes given by Equation (9). For the FFF configurations, k0 is comparably higher with exp(1.16) = 3.19 (Table 4). Further tests are needed to confirm and refine this analysis.
4. Discussion
4.1. Accuracy and Scale Effects
The measured ξ values are for all investigated rack options in a comparably small range from 0.075 to 1.884 (-) (Table 3, vref = v1). Consequently, the accuracy of the measurements and the analysis are crucial. The verification analysis, presented in Section 3.2, clearly indicated the use of the water height in front of the trash rack as well as the differential pressure transducer instead of a second ultrasonic measurement downstream of the investigated structures. The deployment of a discharge measurement with a better accuracy would be desirable but would have been required to bypass the existing fix installation of the flume. All used measurements were independently checked by a redundant system continuously or randomly manually. The long observation period for each run of 10 min allowed finding a very stable mean value of the local head loss.
Scale effects of the 1:2 model were also analysed for the studied Bar–Reynolds Numbers of 750–3500, since a recent study by Albayrak et al. [28] on louvers and angled bar racks shows that ξ values for ≤ 1500 are slightly lower for a 1:2 than for a 1:1 scale model. A similar phenomenon was observed by Raynal et al. [25], in which higher variations of ξ for lower occur, mostly pronounced for the inclined trash racks with a hydrodynamic bar profile. However, this is not confirmed for the head loss coefficients at the CBTR and FFF, where ξ is almost constant for the whole range (Figure 6). These differences are probably attributed to the different bar shapes of the studied trash racks. For rack configurations with a circular bar shape, ξ is at least nearly independent from ≥ 750, which is more consistent with the results of Blevins [31] of drag coefficients on a single circular cylinder.
4.2. Effect of Blockage and Angle
As expected by past studies [18,20,24,25], head loss coefficient is a function of the blockage ratio p and bar spacing, respectively. Thereby, ξ disproportionally increase with increasing blockage ratios for both rack options. In comparison, this increase of ξ with p is stronger for the FFF than for the CBTR (Figure 8 and Table 1). This is likely due to the different characteristics of flow induced vibrations of cables and bars. In general, both rack options are very vulnerable to flow-induced vibrations due to their circular bar shape [34]. The vertical movement of the vibrating circular bars or cables leads to a significant reduction of the free flow area, which results in a higher form resistance and head loss. For the basic experiments with the CBTR, it was intended to exclude or reduce the effect of bar vibrations, thus additional spacers were installed to increase the stiffness. However, vibrations were mitigated but could not be fully avoided at the CBTR (in dependence of ), but the vertical amplitudes of the individual bars were comparably small. Instead, the whole trash rack area was oscillating for some specific CBTR configurations (high blockage ratios and high angles) with higher Bar–Reynolds numbers. In comparison, cable vibrations at the FFF were very pronounced and occurred over the whole range of for the configurations with highest blockage ratio p = 0.5 (vibration amplitudes increase with increasing velocity and , respectively). This observation corresponds to Naudascher and Rockwell [34], who stated that smaller spacing of bars leads to a higher intensity of the buffeting due to wake turbulence and interference [34]. For lower blockage ratios, the cables oscillated at least above a certain threshold of . In summary, the phenomenon of flow-induced vibrations was significantly dominant at the FFF and, further, it was amplified by small bar spacing. For the experiments with p = 0.5 at the FFF (corresponding with the bar spacing being equal the bar diameter), the vertical movement of the vibrating cables reached the same magnitude of spacing b. According to Tanida et al. [35], the resistance coefficient can increase up to a double, if the amplitudes are high enough.
Besides the blockage, head loss coefficients are also affected by the rack angle, whereby ξ increases with increasing α. This probably results from a reduction of the total rack area with increasing α and a corresponding increase of the mean flow velocity at the rack. The same phenomenon was shown by Raynal et al. [25] at vertical inclined trash racks with β = 15–90°, in which lower angles significantly reduce velocities in front and downstream the racks and head loss coefficients [25]. Furthermore, Berger [29] measured the head loss at horizontal trash racks with rectangular bars and observed also an increase of with increasing angle α. In contrast, this effect of rack angle α was not observed at angled streamwise (vertical) bar racks [36]. Raynal et al. [36] showed that ξ as well as the velocity distribution in front of the rack is not affected by the rack angle at a trash rack with vertical bars. It is assumed that the vertical trash racks deflects the incoming flow along the full length of the rack and therewith has as a higher influence on the direction of the flow. A direct comparison between vertical and horizontal racks under identical boundary conditions including an intensive velocity measurement should be part of further research to clarify quantify the influence of the orientation of the racks.
4.3. Prediction of Head Loss Coefficients of Angled Racks with Empirical Equations
The head loss coefficients for the CBTR and the FFF estimated by Equation (10) roughly correspond with the measured head loss coefficients, but systematic deviations arise for configurations with the highest blockage ratio (p = 0.5) and low angles (particularly for CBTR and α = 30° or FFF and α = 20°). For those configurations, the estimated ξ values are too high. It is noted, that the corresponding original approach of Meusbuger [18] in Equation (6) uses the vertical inclination of the rack β rather than the horizontal angle α. However, the influence of β on ξ in Equation (6) is based on measurements of preceding studies [20] with a range of β = 60° to 90°. In contrast, Raynal et al. [25] observed a similar overestimation of Equations (9) and (10) at lower inclinations of vertical trash racks and derived the effect of β on ξ on blockage through bars with 2(β) in their newly developed formula [25].
For the current results, the regression in Equation (11) similar to Equation (6) was fitted to the measured head loss coefficients to improve the estimation and to quantify the dependency of rack angle and blockage on ξ (Table 4). As expected, the effect of rack angle α is not sufficiently described by the standard sinus function applied in Equation (6). With for CBTR and for FFF configurations (k2 in Table 4), it is obvious that rack angle α has a stronger effect on head loss for the observed rack options. Furthermore, the fitted functions correspond more to the approach of Raynal et al. [25] for vertical inclined trash racks with low values of β [25]. Moreover, the exponents of the blockage term with 1.3 and 1.44 for CBTR and FFF, respectively ( in Table 4 ), are slightly below the value of 1.5 in Equation (6). Particularly, for the CBTR configurations, it fits better to Kirschmer’s description with , where transversal elements of trash racks are unattended [20]. However, the higher exponent of the blockage term for FFF compared to CBTR seem to be a result of the cable vibrations, which are intensified particularly at higher blockage ratios. The last regression coefficient corresponds to the bar shape coefficient proposed by Kirschmer [20]. For the CBTR configuration, it is 1.8 ( in Table 4), which matches very well with the bar shape coefficient of 1.79 for circular bar shapes given by Kirschmer [20]. For the FFF configurations, is comparably higher (3.19, Table 4), which may be again due to flow-induced vibrations and a stronger interaction between the cables.
4.4. Transferability of the Results to Technical Applications and Outlook
The multiple regression model of the results should not be considered as a new developed formula, since the studied parameter range of p (spacing b, respectively) and α is limited. Moreover, other influences at real hydro power applications, e.g., blockage through debris clogging, angled approach flow or additional structures such as a bypass, are not considered. Thus, a wider parameter set should be further analysed in laboratory but also in real application in order to validate or enhance the proposed model into a formula. Meanwhile, the effect of flow-induced cable vibrations on head loss in quantitative terms is not directly transferable to full-scale applications of the FFF. The amplitudes of cable vibrations are dependent on parameters such as the preload forces and frequency, cable length and flow velocities on-site [14]. Again, further research is necessary to include the effect of vibrations in the formula. Nevertheless, the results show that the additional effect of flow-induced cable vibrations on head loss is not negligible.
The transferability of the results to conventional horizontal trash racks is difficult to assess, since only a few studies about head loss on these trash racks are published. In this respect, two investigations about head loss at horizontal trash racks can be roughly compared with the rack option CBTR of this study. Szabo-Meszaros et al. [27] investigated the head loss of two angled horizontal trash racks with α = 30° and a volume based blockage ratio (Equation (1) in [27]) of 0.35 and 0.32 with rectangular and hydrodynamic bar profiles, respectively [27]). In addition, Berger [29] investigated head loss at horizontal trash racks with a wider parameter range of p and α and rectangular bar profiles [29]. In both studies [27,29], the total head loss coefficients (either reported [27] or calculated from reported head loss and velocity [29] according to Equation (3)) are noticeably higher than the results presented herein at similar geometric configurations. However, the experimental designs in [27,29] differ considerably from this study (e.g., different bar shapes). Additionally, the reported head loss in [27,29] includes head losses through deflection into a bypass and partly through additional transversal elements. The latter refers to spacers and supporting structures, which are necessary at conventional horizontal trash racks. In this respect, the additional effect on head loss depends also on their geometry (e.g., circular spacers are independent from the rack angle [25], while other bar shapes have an adverse effect on ξ with decreasing α. In summary, it reveals the need to investigate a wider parameter set and to address each component separately.
5. Conclusions
The presented experimental study investigated the flexible fish fence (FFF), a physical barrier created by horizontally arranged steel cables, and an angled horizontal trash rack with circular bars (CBTR). Thereby, particularly the effect of bar spacing and rack angle was examined and a comparison of both rack options at an angle of 30° allowed assessing the influence of flow-induced cable vibrations (at the FFF) on the head loss coefficient ξ. The observed ξ-values were compared with the head loss (Equations (9) and (10)) of Kirschmer [20] and Meusburger [18] and a modified approach for angled horizontal trash racks is introduced. Therefore, additional coefficients to the original Equation (10) were fitted based on the observed data. This allowed quantifying the relationship between the independent variables bar spacing and rack angle to the head loss coefficient based on Equation (11). The following conclusions summarise the findings of this experimental investigating:
- Head loss coefficient ξ is independent from the Bar–Reynolds number in the studied range of of 750–3500 and scale effects can be neglected.
- The coefficient ξ is significantly affected by the blockage ratio and the rack angle (Section 3.4, Table 3). The strong increase of head loss with decreasing bar spacings, which are necessary for fish protection, can be countered by designing lower rack angles (α≤ 45°).
- With increasing blockage ratios, the head loss coefficient at the FFF is up to 53% higher compared to the CBTR. This phenomenon is likely resulting from the effect of flow-induced cable vibrations and hence a further increase of blockage. Since amplitudes and frequencies of the vibrations are depending on parameters such as preload forces, cable length or flow velocity, the transferability to full-scale applications is limited.
- Head loss at the CBTR and FFF can be roughly estimated with a modified version of Equation (10) originally published by Meusburger [18], where the horizontal angle is used instead of the vertical rack inclination. However, the comparison of measured and estimated head loss revealed a systematic bias, which is more pronounced for rack options with low angles and high blockage.
Author Contributions
H.B. and M.A. were responsible for the conceptualisation of the hydraulic investigation. H.B. designed and measured the data in the scale model test. H.B. and R.G. analysed the data and wrote the paper.
Funding
This publication was funded by Austrian Science Fund (FWF) grant number J3918. The experimental work was funded by the Austrian Research Promotion Agency (FFG) within the framework of the Energy Research Programme 2014. The overall research project Flexible Fish Fence was carried out in collaboration with the University of Innsbruck (Unit of Hydraulic Engineering, Unit of Applied Mechanics), University of Natural Resources and Life Sciences, Vienna (Institute of Hydrobiology and Aquatic Ecosystem Management) and the company Albatros Engineering GmbH.
Acknowledgments
The authors want to thank the Master-students Sebastian Ritsch and Christian Goessel for their contribution to the experimental work.
Conflicts of Interest
The authors declare no conflict of interest.
Notation
| A | = area (m2) | α | = rack angle in relation to the vertical wall (°) |
| b | = spacing between the bars (m) | β | = rack angle in relation to the ground plane (°) |
| B | = width of the flume (m) | λ | = scale factor (-) |
| F | = Froude number (-) | ρ | = mass density of water ≈ 997 (kg m−3) |
| g | = gravity acceleration (m s−2) | = kinematic viscosity (m2 s−1) | |
| h | = water depth (m) | = head loss coefficient (-) | |
| hv | = head loss (m) | ξ* | = total head loss coefficient (-) |
| = bar shape coefficient (-) | = predicted head loss coefficient | ||
| k | = constant | = measured head loss coefficient | |
| l | = bar length (in cross section) (m) | = ξ due to supports and surface friction (-) | |
| = pressure (Pa) | = differential pressure (Pa) | ||
| p | = blockage ratio (-) | CBTR | circular bar trash rack |
| Q | = discharge (m3 s−1) | DPT | differential pressure transducer |
| = Reynolds Number (-) | FFF | Flexible Fish Fence | |
| = Bar–Reynolds Number (-) | PG | point gauge | |
| s | = diameter of the bar/cable (m) | US | ultrasonic sensor |
| v1,2 | = velocity (m s−1) | ||
| z | = elevation (m) |
References
- Williams, J.G.; Armstrong, G.; Katopodis, C.; Larinier, M.; Travade, F. Thinking like a fish: A key ingredient for development of effective fish passage facilities at river obstructions. River Res. Appl. 2012, 28, 407–417. [Google Scholar] [CrossRef]
- Cada, G.F. The development of advanced hydroelectric turbines to improve fish passage survival. Fisheries 2001, 26, 14–23. [Google Scholar] [CrossRef]
- Schilt, C.R. Developing fish passage and protection at hydropower dams. Appl. Anim. Behav. Sci. 2007, 104, 295–325. [Google Scholar] [CrossRef]
- Larinier, M.; Travade, F. Downstream migration: Problems and facilities. Bulletin Français de la Pêche et de la Pisciculture 2002, 364, 181–207. [Google Scholar] [CrossRef]
- Ebel, G. Fischschutz und Fischabstieg an Wasserkraftanlagen-Handbuch Rechen-und Bypasssysteme. Ingenieurbiologische Grundlagen, Modellierung und Pronose, Bemessung und Gestaltung [Fish Protection and Downstream Passage at Hydro Power Stations-Bioengineering Principles, Modelling and Prediction, Dimensioning and Design], 4th ed.; Mitteilungen aus dem Büro für Gewässerökologie und Fischereibiologie: Halle, Germany, 2018. [Google Scholar]
- Dumont, U. Zum Stand der Technk Einer Ökologisch Angepassten Wasserkraftnutzung [State of the Art about An Ecologically Sustainable Use of Hydro Power]. In Proceedings of the Seminar Gewässer-verträglicher Wasserkraftausbau, Renexpo, Salzburg, Austria, 28 November 2013; RENEXPO INTERHYDRO: Salzburg, Austria, 2013. [Google Scholar]
- Cuchet, M. Fish Protection and Downstream Migration at Hydropower Intakes—Investigation of Fish Behavior under Laboratory Conditions. Ph.D. Thesis, Technical University of Munich (TUM), Munich, Germany, 2014. [Google Scholar]
- Kriewitz-Byun, C.R. Leitrechen an Fischabstiegsanlagen: Hydraulik und fischbiologische Effizienz [Guidance Screens at Fish Protection Facilities—Hydraulics and Fishbiological Efficiency]. Ph.D. Thesis, ETH Zürich, Zürich, Switzerland, 2015. [Google Scholar] [CrossRef]
- Boettcher, H.; Brinkmeier, B.; Aufleger, M. Flexible Fish Fences. In Proceedings of the Norwegian University of Science and Technology 10th International Symposium on Ecohydraulics, Trondheim, Norway, 23–27 June 2014. [Google Scholar]
- Gabl, R.; Innerhofer, D.; Achleitner, S.; Righetti, M.; Aufleger, M. Evaluation criteria for velocity distributions in front of bulb hydro turbines. Renew. Energy 2018, 121, 745–756. [Google Scholar] [CrossRef]
- Umweltbundesamt, Bundesministerium für Umwelt, Naturschutz, Bau und Reaktorschutz, Ecologic Institute. Forum Fischschutz und Fischabstieg—Empfehlungen und Ergebnisse des Forums “Fischschutz und Fischabstieg” [Forum Fish Protection and Downstream Migration—Recommendations and Results]; Umweltforschungsplan des Bundesministeriums für Umwelt, Natuschutz, Bau und Reaktorsicherheit: Bau, Germany, 2015. [Google Scholar]
- Böttcher, H.; Unfer, G.; Zeiringer, B.; Schmutz, S.; Aufleger, M. Fischschutz und Fischabstieg–Kenntnisstand und aktuelle Forschungsprojekte in Österreich [Fish protection and downstream migration: Current state of knowledge and research projects in Austria]. Österreichische Wasser-und Abfallwirtschaft 2015, 67, 299–306. [Google Scholar] [CrossRef]
- Böttcher, H.; Gabl, R.; Ritsch, S.; Aufleger, M. Experimental study of head loss through an angled fish protection system. In Proceedings of the 4th IAHR Europe Congress, Liege, Belgium, 27–29 July 2016; Dewals, B., Ed.; CRC Press: Liege, Belgium, 2016; pp. 637–642. [Google Scholar]
- Unit of Applied Mechanics, University of Innsbruck. Projektbericht—Berechnung der Seilschwingungen beim Seilrechen [Research Project Report—Calculation and Modelling of Cable Vibrations at the Flexible Fish Fence]; University of Innsbruck: Innsbruck, Austrian, 2017. [Google Scholar]
- Gabl, R.; Achleitner, S.; Neuner, J.; Aufleger, M. Accuracy analysis of a physical scale model using the example of an asymmetric orifice. Flow Meas. Instrum. 2014, 36, 36–46. [Google Scholar] [CrossRef]
- Adam, N.J.; De Cesare, G.; Nicolet, C.; Billeter, P.; Angermayr, A.; Valluy, B.; Schleiss, A.J. Design of a Throttled Surge Tank for Refurbishment by Increase of Installed Capacity at a High-Head Power Plant. J. Hydraul. Eng. ASCE 2018, 144, 05017004. [Google Scholar] [CrossRef] [Green Version]
- Gabl, R.; Righetti, M. Design criteria for a type of asymmetric orifice in a surge tank using CFD. Eng. Appl. Comput. Fluid Mech. 2018, 12, 397–410. [Google Scholar] [CrossRef] [Green Version]
- Meusburger, H. Energieverluste an Einlaufrechen Von Flusskraftwerken [Head losses at intakes of run-of-river hydropower plants]. Ph.D. Thesis, Mitteilungen der Versuchsanstalt fur Wasserbau, Hydrologie und Glaziologie an der Eidgenossischen Technischen Hochschule Zürich, Zürich, Switzerland, 2002. [Google Scholar]
- Gabl, R.; Gems, B.; Birkner, F.; Hofer, B.; Aufleger, M. Adaptation of an Existing Intake Structure Caused by Increased Sediment Level. Water 2018, 10, 1066. [Google Scholar] [CrossRef]
- Kirschmer, O. Untersuchungen über den Verlust an Rechen [Study on Head Loss At Trash Racks]; Mitteilungen Hydraulisches Institut München: München, Germany, 1926; Nr. 1. [Google Scholar]
- Zimmermann, J. Widerstand Schräg Angeströmter Rechengitter [Resistance of Trash Racks Caused by Oblique Inflow]; Mitteilungen der Universität Fridericana Karlsruhe, Theodor-Rhebock-Flußbaulaboratorium: Karlsruhe, Germany, 1969; Volume 157. [Google Scholar]
- Spangler, J. Untersuchung über den Verlust an Rechen bei schräger Zuströmung [Study about head Loss at Obliquely Approached Trash Racks]; Mitteilungen des Hydraulischen Instituts der TH München: München, Germany, 1929. [Google Scholar]
- Idelchik, I.E. Handbook of Hydraulic Resistance Coefficients of Local Resistance and of Friction; U.S. Department of Commerce National Technical Information Service (NTIS): Springfield, VA, USA, 1960.
- Clark, S.P.; Tsikata, J.M.; Haresign, M. Experimental study of energy loss through submerged trashracks. J. Hydraul. Res. 2010, 46, 113–118. [Google Scholar] [CrossRef]
- Raynal, S.; Courret, D.; Chatellier, L.; Larinier, M.; David, L. An experimental study on fish-friendly trashracks—Part 1. Inclined trashracks. J. Hydraul. Res. 2013, 51, 56–66. [Google Scholar] [CrossRef]
- Raynal, S.; Chatellier, L.; Courret, D.; Larinier, M.; David, L. An experimental study on fish-friendly trashracks—Part 2. Angled trashracks. J. Hydraul. Res. 2013, 51, 67–75. [Google Scholar] [CrossRef]
- Szabo-Meszaros, M.; Navaratnam, C.U.; Aberle, J.; Silva, A.T.; Forseth, T.; Calles, O.; Fjeldstad, H.-P.; Alfredsen, K. Experimental hydraulics on fish-friendly trash-racks: An ecological approach. Ecol. Eng. 2018, 113, 10–20. [Google Scholar] [CrossRef]
- Albayrak, I.; Kriewitz, C.R.; Hager, W.H.; Boes, R.M. An experimental investigation on louvres and angled bar racks. J. Hydraul. Res. 2018, 46, 59–75. [Google Scholar] [CrossRef]
- Berger, C. Rechenverluste und Auslegung von (elektrifizierten) Schrägrechen Anhand Ethohydraulischer Studien [Screen Losses and Design of Inclined (and Electrified) Screens with Horizontal Bars on the Basis of Ethohydraulic Studies]. Ph.D. Thesis, Technische Universität Darmstadt, Darmstadt, Germany, 2018. [Google Scholar]
- Heller, V. Scale effects in physical hydraulic engineering models. J. Hydraul. Res. 2011, 49, 293–306. [Google Scholar] [CrossRef]
- Blevins, R.D. Applied Fluid Dynamics Handbook; Van Nostrand Reinhold Company, Inc.: New York, NY, USA, 1984; ISBN 978-1575241821. [Google Scholar]
- Naudascher, E. Hydraulik der Gerinnebauwerke [Hydraulics of Open Channel Flow Structures]; Springer: Berlin/Heidelberg, Germany, 1992; ISBN 978-3211823668. [Google Scholar]
- Krzyzagorski, S.; Gabl, R.; Seibl, J.; Böttcher, H.; Aufleger, M. Implementierung eines schräg angeströmten Rechens in die 3D-numerische Berechnung mit FLOW-3D [Implementation of an angled trash rack in the 3D-numerical simulation with FLOW-3D]. Österreichische Wasser-und Abfallwirtschaft 2016, 68, 146–153. [Google Scholar] [CrossRef]
- Naudascher, E.; Rockwell, D. Flow-Induced Vibrations: An Engineering Guide; CRC Press: Boca Raton, FL, USA, 1993; ISBN 978-0486442822. [Google Scholar]
- Tanida, Y.; Okajima, A.; Watanabe, Y. Stability of a circular cylinder oscillating in uniform flow or in a wake. J. Fluid Mech. 1973, 61, 769–784. [Google Scholar] [CrossRef]
- Raynal, S.; Chatellier, L.; Courret, D.; Larinier, M.; David, L. Streamwise bars in fish-friendly angled trashracks. J. Hydraul. Res. 2013, 52, 426–431. [Google Scholar] [CrossRef]
Figure 1.
Angled trash rack with circular bars (CBTR) with: α = 30° and b = 5 m (upstream view) (a); detailed side view of bar option from the side of the flume (b); Flexible Fish Fence (FFF) with α = 30° and b = 5 mm (c); and detailed side view of the flow pattern at the tail water of the FFF (d).
Figure 1.
Angled trash rack with circular bars (CBTR) with: α = 30° and b = 5 m (upstream view) (a); detailed side view of bar option from the side of the flume (b); Flexible Fish Fence (FFF) with α = 30° and b = 5 mm (c); and detailed side view of the flow pattern at the tail water of the FFF (d).

Figure 2.
Schematic side view of the experimental flume including the local coordinate system—the locations of the points are given in Table 2.
Figure 2.
Schematic side view of the experimental flume including the local coordinate system—the locations of the points are given in Table 2.

Figure 3.
Analysis of the individual measured value standardised by the mean value of each geometry set-up: water depth at measurement points US1–US8 with ultrasonic sensors (left); and differential pressure transmitter (DPT) and difference between US7 and US2 (right).
Figure 3.
Analysis of the individual measured value standardised by the mean value of each geometry set-up: water depth at measurement points US1–US8 with ultrasonic sensors (left); and differential pressure transmitter (DPT) and difference between US7 and US2 (right).

Figure 4.
Comparison of pressure head loss and including all measuring points (left); and as a mean value for each geometrical set-up (right).
Figure 4.
Comparison of pressure head loss and including all measuring points (left); and as a mean value for each geometrical set-up (right).

Figure 5.
Head loss coefficients calculated for each data point (j = 1–2700) subtracted by the mean value of of each measurement for three ranges of Bar–Reynolds number .
Figure 5.
Head loss coefficients calculated for each data point (j = 1–2700) subtracted by the mean value of of each measurement for three ranges of Bar–Reynolds number .

Figure 6.
Head loss coefficient versus Bar–Reynolds number for selected CBTR (left) and FFF configurations (right).
Figure 6.
Head loss coefficient versus Bar–Reynolds number for selected CBTR (left) and FFF configurations (right).

Figure 7.
Proportion of head loss coefficient through the supporting structure and friction and for rack option CBTR (above) and FFF (below) on the total head loss coefficient .
Figure 7.
Proportion of head loss coefficient through the supporting structure and friction and for rack option CBTR (above) and FFF (below) on the total head loss coefficient .

Figure 8.
Head loss coefficient ξ versus blockage ratio p for the CBTR (left) and FFF option (right).
Figure 8.
Head loss coefficient ξ versus blockage ratio p for the CBTR (left) and FFF option (right).

Figure 9.
Head loss coefficient ξ versus rack angle α for both rack options (CBTR and FFF).

Figure 10.
Percentage deviation of the predicted head loss coefficients by Equation (10) (left) and Equation (9) (right) from the measured head loss coefficients . The two rack options are highlighted in grey (CBTR) and black (FFF) and differentiated by the related blockage ratios of the rack configurations. The dashed and dotted lines represent the ±75% and ±25% deviation of from .


Table 1.
Overview of the parameter—varied ones are marked with a *.
| Parameter | Rods | Cables |
|---|---|---|
| Bar diameter s (mm) | 5 | 5 |
| * Spacing b (mm) | 5, 10, 15 | 5, 10, 15 |
| * Angle α (°) | 90, 45, 30 | 40, 30, 20 |
| * Discharge Q (l s−1) | 50–200 | 80–230 |
| Bar shape coefficient (-) | 1.79 | 1.79 |
| (-) | 0.33, 0.5, 1,0 | 0.33, 0.5, 1.0 |
| Blockage ratio p (-) | 0.25, 0.33, 0.5 | 0.25, 0.33, 0.5 |
| Bar length l (m) | 0.80, 1.24, 1.60 | 1.25, 1.60, 2.34 |
| Approach velocity v (m s−1) | 0.16–0.63 | 0.25–0.72 |
| Bar–Reynolds-No. (-) | 750–3000 | 1250–3500 |
| Reynolds-No. (-) | 31,000–125,000 | 50,000–144,000 |
| Froude F (-) | 0.08–0.3 | 0.13–0.36 |
Table 2.
Location of the measurement points of the ultrasonic sensors (US) and the point gauge (PG) shown in Figure 2.
Table 2.
Location of the measurement points of the ultrasonic sensors (US) and the point gauge (PG) shown in Figure 2.
| US1 | US2 | US3 | US4 | US5 | US6 | US7 | PG | US8 | |
|---|---|---|---|---|---|---|---|---|---|
| x (m) | 5.3 | 6.5 | 7.5 | 8.3 | 11.3 | 13.7 | 16.1 | 17 | 17.3 |
Table 3.
Local head loss ξ measured for the trash rack with circular bars (CBTR) and the flexible fish fence (FFF) depending on the blockage ratio p and rack angle α—differences between the two rack options for α = 30°.
Table 3.
Local head loss ξ measured for the trash rack with circular bars (CBTR) and the flexible fish fence (FFF) depending on the blockage ratio p and rack angle α—differences between the two rack options for α = 30°.
| CBTR | FFF | Difference | |||||
|---|---|---|---|---|---|---|---|
| p (-) | α (°) | (-) | p (-) | α (°) | (-) | (-) | (%) |
| 0.25 | 45 | 0.198 | 0.25 | 20 | 0.075 | - | - |
| 0.33 | 45 | 0.37 | 0.33 | 20 | 0.162 | - | - |
| 0.50 | 45 | 0.957 | 0.50 | 20 | 0.385 | - | - |
| 0.25 | 30 | 0.146 | 0.25 | 30 | 0.148 | 0.002 | 1.4% |
| 0.33 | 30 | 0.242 | 0.33 | 30 | 0.322 | 0.08 | 33.1% |
| 0.50 | 30 | 0.533 | 0.50 | 30 | 0.818 | 0.285 | 53.5% |
| 0.25 | 90 | 0.449 | 0.25 | 40 | 0.305 | - | - |
| 0.33 | 90 | 0.775 | 0.33 | 40 | 0.488 | - | - |
| 0.50 | 90 | 1.884 | 0.50 | 40 | 1.295 | - | - |
Table 4.
Results of the multiple linear regression analysis for Equation (11).
Table 4.
Results of the multiple linear regression analysis for Equation (11).
| CBTR | 1.80 | 1.3 | 1.7 | 0.9904 | 0.0414 |
| FFF | 3.19 | 1.44 | 1.96 | 0.9861 | 0.0006 |
© 2019 by the authors. Licensee MDPI, Basel, Switzerland. This article is an open access article distributed under the terms and conditions of the Creative Commons Attribution (CC BY) license (http://creativecommons.org/licenses/by/4.0/).
Share and Cite
MDPI and ACS Style
Böttcher, H.; Gabl, R.; Aufleger, M. Experimental Hydraulic Investigation of Angled Fish Protection Systems—Comparison of Circular Bars and Cables. Water 2019, 11, 1056. https://doi.org/10.3390/w11051056
AMA Style
Böttcher H, Gabl R, Aufleger M. Experimental Hydraulic Investigation of Angled Fish Protection Systems—Comparison of Circular Bars and Cables. Water. 2019; 11(5):1056. https://doi.org/10.3390/w11051056
Chicago/Turabian StyleBöttcher, Heidi, Roman Gabl, and Markus Aufleger. 2019. "Experimental Hydraulic Investigation of Angled Fish Protection Systems—Comparison of Circular Bars and Cables" Water 11, no. 5: 1056. https://doi.org/10.3390/w11051056
Note that from the first issue of 2016, this journal uses article numbers instead of page numbers. See further details here.