Identification of the Space-Time Variability of Hydrological Drought in the Arid Region of Northwestern China


1
School of Urban and Environment Science, Huaiyin Normal University, Huaian 223300, China
2
Research Center for Climate change, Ministry of water resources, Nanjing Hydraulic Research Institute, Nanjing 210029, China
3
Department of Land and Resources, China West Normal University, Nanchong 637002, China
4
State Key Laboratory of Desert and Oasis Ecology, Xinjiang Institute of Ecology and Geography, Chinese Academy of Sciences (CAS), Urumqi 830011, China
5
Faculty of Geographical Science, Beijing Normal University, Beijing 100875, China
*
Author to whom correspondence should be addressed.
Water 2019, 11(5), 1051; https://doi.org/10.3390/w11051051
Submission received: 11 April 2019
/
Revised: 15 May 2019
/
Accepted: 16 May 2019
/
Published: 20 May 2019
(This article belongs to the Section Hydrology)
Abstract
:Drought monitoring is crucial to water resource management and strategic planning. Thus, the objective of this study is to identify the space-time variability of hydrological drought across the broad arid region of northwestern China. Seven distributions were applied to fitting monthly streamflow records of 16 gauging stations from 10 rivers. Finally, the general logistic distribution was selected as the most appropriate one to compute the Standardized Streamflow Index (SSI). The severity and duration of hydrological droughts were also captured from the SSI series. Moreover, we investigate the relationship between hydrological drought (SSI) and meteorological drought (Standardized Precipitation-Evapotranspiration Index (SPEI)) at different time scales. The results show that drought duration and severity decreased over time in the Aibihu, Irtysh, Kaidu, Aksu, Yarkand, Hoton, Shule, Heihe (upstream), and Shiyang Rivers. However, the Tarim (upstream) and Heihe (middle stream) Rivers showed increasing drought duration and severity and this can be attributed to recent decades human activities. Furthermore, two correlation coefficient patterns between SSI and SPEI were found for the rivers of interest, an “increasing-decreasing” pattern for the Irtysh, Heihe, and Shiyang Rivers, where the precipitation is the main runoff supply, and an “increasing-stable” pattern for Aibihu and the Kaidu, Aksu, Yarkand, Hotan, and Shule Rivers, where glacier melt water provided a relatively high supply of runoff. Our findings are a contribution towards implementing effective water resources evaluation and planning in this arid region.
1. Introduction
Drought, a type of natural phenomenon of great concern, occurs when water availability falls below normal records [1,2,3], and the human influence may have exacerbated drought’s effect [4]. Compared with other disasters, it is difficult to determine the onset and termination of a drought event, and the spatial extent spreads across larger areas [5]. Previous studies have commonly categorized drought as meteorological, agricultural, hydrological, and socioeconomic. These four types of droughts concern different hydrometeorological variables including precipitation, streamflow, groundwater, or soil moisture [6]. To investigate severity, duration and frequency, many drought indices have been developed. Examples are the Standardized Precipitation Index (SPI) [7], Palmer Drought Severity Index (PDSI) [8], Standardized Precipitation-Evapotranspiration Index (SPEI) [9], Standardized Groundwater level Index (SGI) [10], Standardized Streamflow Index (SSI) [11], and so on. All these different drought indices have their advantages and weaknesses; SPI depends only on precipitation for its calculation and can be applied to different time scales, whereas the length of data and distribution fitting the time series will influence the SPI values, especially in arid regions, where zero records are commonly observed [5]. PDSI has been improved over several versions, is applied in identifying drought properties and in drought forecasting, as well as in reconstructing past droughts using tree-ring data [12]. Nevertheless, some recent studies have demonstrated that the PDSI is unable to describe drought over short time scales and to identify different drought types [9].
Hydrological drought is of great importance among the four types of drought and is closely associated with deficiencies in streams, river discharge, groundwater storage, lakes, and reservoir levels in the hydrological cycle [13]. A prolonged period of low precipitation accompanied by high pressure and greater sunshine influences the soil water availability, resulting in reduced recharge [14]. In cold climates, low temperatures and low snow accumulation can also trigger hydrological drought [15]. Many sectors, for example, agricultural irrigation and industrial consumption, depend on surface or subsurface water directly; consequently, many studies have attempted to capture better knowledge of the following aspects of hydrological drought: identifying features and evolution in the context of climate change using different drought indexes and distinguishing hydrological drought types and revealing the possible factors causing them in terms of atmospheric circulation patterns [2,14,15,16]. Streamflow shows larger spatial variability and is an integrated result of many factors [17]. Several indices based on streamflow have been applied to investigate hydrological drought in basins in Spain, Iran, the USA, Greece, etc. [18,19,20].
The arid region of northwestern China frequently suffers from natural disasters, particularly drought. In this arid and vulnerable region, climate change combined with anthropogenic effects (e.g., over-exploitation of groundwater and reservoir operation) highly influences the water supply. According to the Ministry of Agriculture of China, during 2014, 5.8 and 6.6 billion square meters of crops were affected by drought in Xinjiang and Gansu, respectively. In this context, there is a growing interest in studying drought in this region. For example, Tao et al. (2014) [21] assessed the variability of drought and wetness in the Tarim River basin using SPEI. They stated that the frequency of extreme drought events had increased slightly. Wang et al. (2015) [22] applied PDSI to describe drought patterns and found that drought evolution was linked with large-scale atmospheric circulation patterns such as the area of northern hemisphere polar vortex, the Arctic Oscillation, and the North Atlantic Oscillation. Wang et al. (2017) [23] recently compared three drought indices to investigate the relationships between them. In this arid region, precipitation is rare and streamflow is the only external source of water in some areas, so studying hydrological drought is more critical than meteorological drought. Most of the current papers analyzed meteorological drought, what is still unclear is how hydrological drought evolves in this arid region. Thus, a detailed analysis of hydrological drought is required.
In this study, we used the standardized streamflow index (SSI) proposed by Vicente-Serrano et al. (2012) [11] as a hydrological drought index. Drought characteristics (e.g., duration, severity) at annual to decadal time scales were then derived and described from SSI time series. Moreover, we compute the meteorological drought by SPEI at different time scales and verify its correlation with SSI. Some possible explanatory factors for the variation of drought duration and severity are explored. The results presented in this paper are a contribution towards implementing effective water resources evaluation and planning in this arid region.
2. Data and Methodology
2.1. Study Area and Data
Northwestern China (34°54′–49°19′ N, 73°44′–108°46′ E) is a major part of the arid region of Central Asia, covering approximately 2,500,000 km2, and accounts for approximately a quarter of China’s total territory. This vast region mainly includes the whole area of Xinjiang, the Hexi corridor in Gansu province, the Ala Shan Plateau in Inner Mongolia (Figure 1). This region has very contrasting relief, with huge basins and high west-to-east mountain ranges being the main landscape units. The Tarim and Juggar basins are surrounded by the Pamir Plateau, Tianshan Mountains, Kunlun Mountains, and Altay Mountains. The Qilian Mountains enclose the Hexi corridor to the south (Figure 1). This topography has influenced the river network, forming a centripetal drainage pattern. The rivers can be divided into five inland river systems (Tarim River drainage, Yili River drainage, Juggar drainage, Turpan-Hami basin drainage, and Hexi drainage) and one outflow river system (Irtysh River drainage) flowing towards the Arctic Ocean. The location and topography generate a typical temperate-continental climate; the average annual rainfall is less than 200 mm year−1, ranging approximately from 20 (in the center of the Taklamakan desert) to 500 mm year−1 (in the Tianshan Mountain). The mean annual temperature is about 8 °C, the average temperature in winter ranging from −5.8 °C and −11 °C. The principal ecosystem types are forests, grasslands, deserts, and oases.
Daily observed streamflow records, provided by the Water Bureau of Xinjiang and Gansu province, are obtained from 16 hydrological stations. Details about the gauging stations can be found in Figure 1 and Table 1. The missing data existed in Xiehl (1973–1974), Wulwt (1968–1970, 1972–1976), and Tongzlk (1960–1961) and were filled using the regression relations between neighboring stations in the same river. The determination coefficient R2 > 0.6 (0.01 significant level) were deemed efficient for this extend. If some data could not satisfy the R2 > 0.6, the missing data was replaced by mean daily streamflow in one day for all years. The Aksu, Yarkand, Hotan, and Kaidu Rivers are the headstreams of the Tarim River. Daily meteorological data (precipitation, air temperature, wind speed, pressure, relative humidity, and sunshine duration data) were collected from the China Meteorological Administration (CMA). The data covered the time period 1960–2010. The meteorological data homogeneity was checked by the Penalized Maximal F test (PMF) through the RHtestsV3 software package (http://etccdi.pacificclimate.org/software.shtml).
2.2. Methods
2.2.1. Calculation of the SSI and SPEI
Vicente-Serrano et al. (2010) [9] provided a detailed process to calculate SPEI. Here we only give the major computation steps: (i) determining the balance between precipitation (Pre) and potential evapotranspiration (PET) (Pre-PET) at different time scales (here from 1- to 48-month), the PET was computed by the FAO-56 Penman-Monteith equation. (ii) fitting Pre-PET series into log-logistic probability distribution to obtain the SPEI index series.
The SSI was calculated based on the monthly streamflow series. The calculation process is briefly described as follows: fit the monthly streamflow series and compute the cumulative distribution function F(x). In this study, seven distributions (Gamma, general extreme value (GEV), general logistic, log-logistic, log-Pearson 3, lognormal, and Weibull) were used to fit monthly streamflow series in the 10 rivers, and the most suitable distribution was selected by the Shapiro-Wilks (S-W) and Kolmogorov-Smirnov (K-S) test with the smallest D statistic. Then, the standardized SSI can be calculated as
where , P denotes probability of exceeding a determined x value, and P = 1 − F(x). If P > 0.5, P is replaced by 1 − P and the sign of the resultant SSI is reversed. The C0, C1, C2, d1, d2, and d3 are constant to them in calculating SPEI. A detailed description of the SSI can be found in Vicente-Serrano et al. (2012) [11].
As the two normally standardized indexes SSI and SPEI have the same units, we could employ Pearson correlation analysis to investigate the relationship between SSI and SPEI at the 1- to 48-month scale.
2.2.2. Definition of Drought Severity and Duration
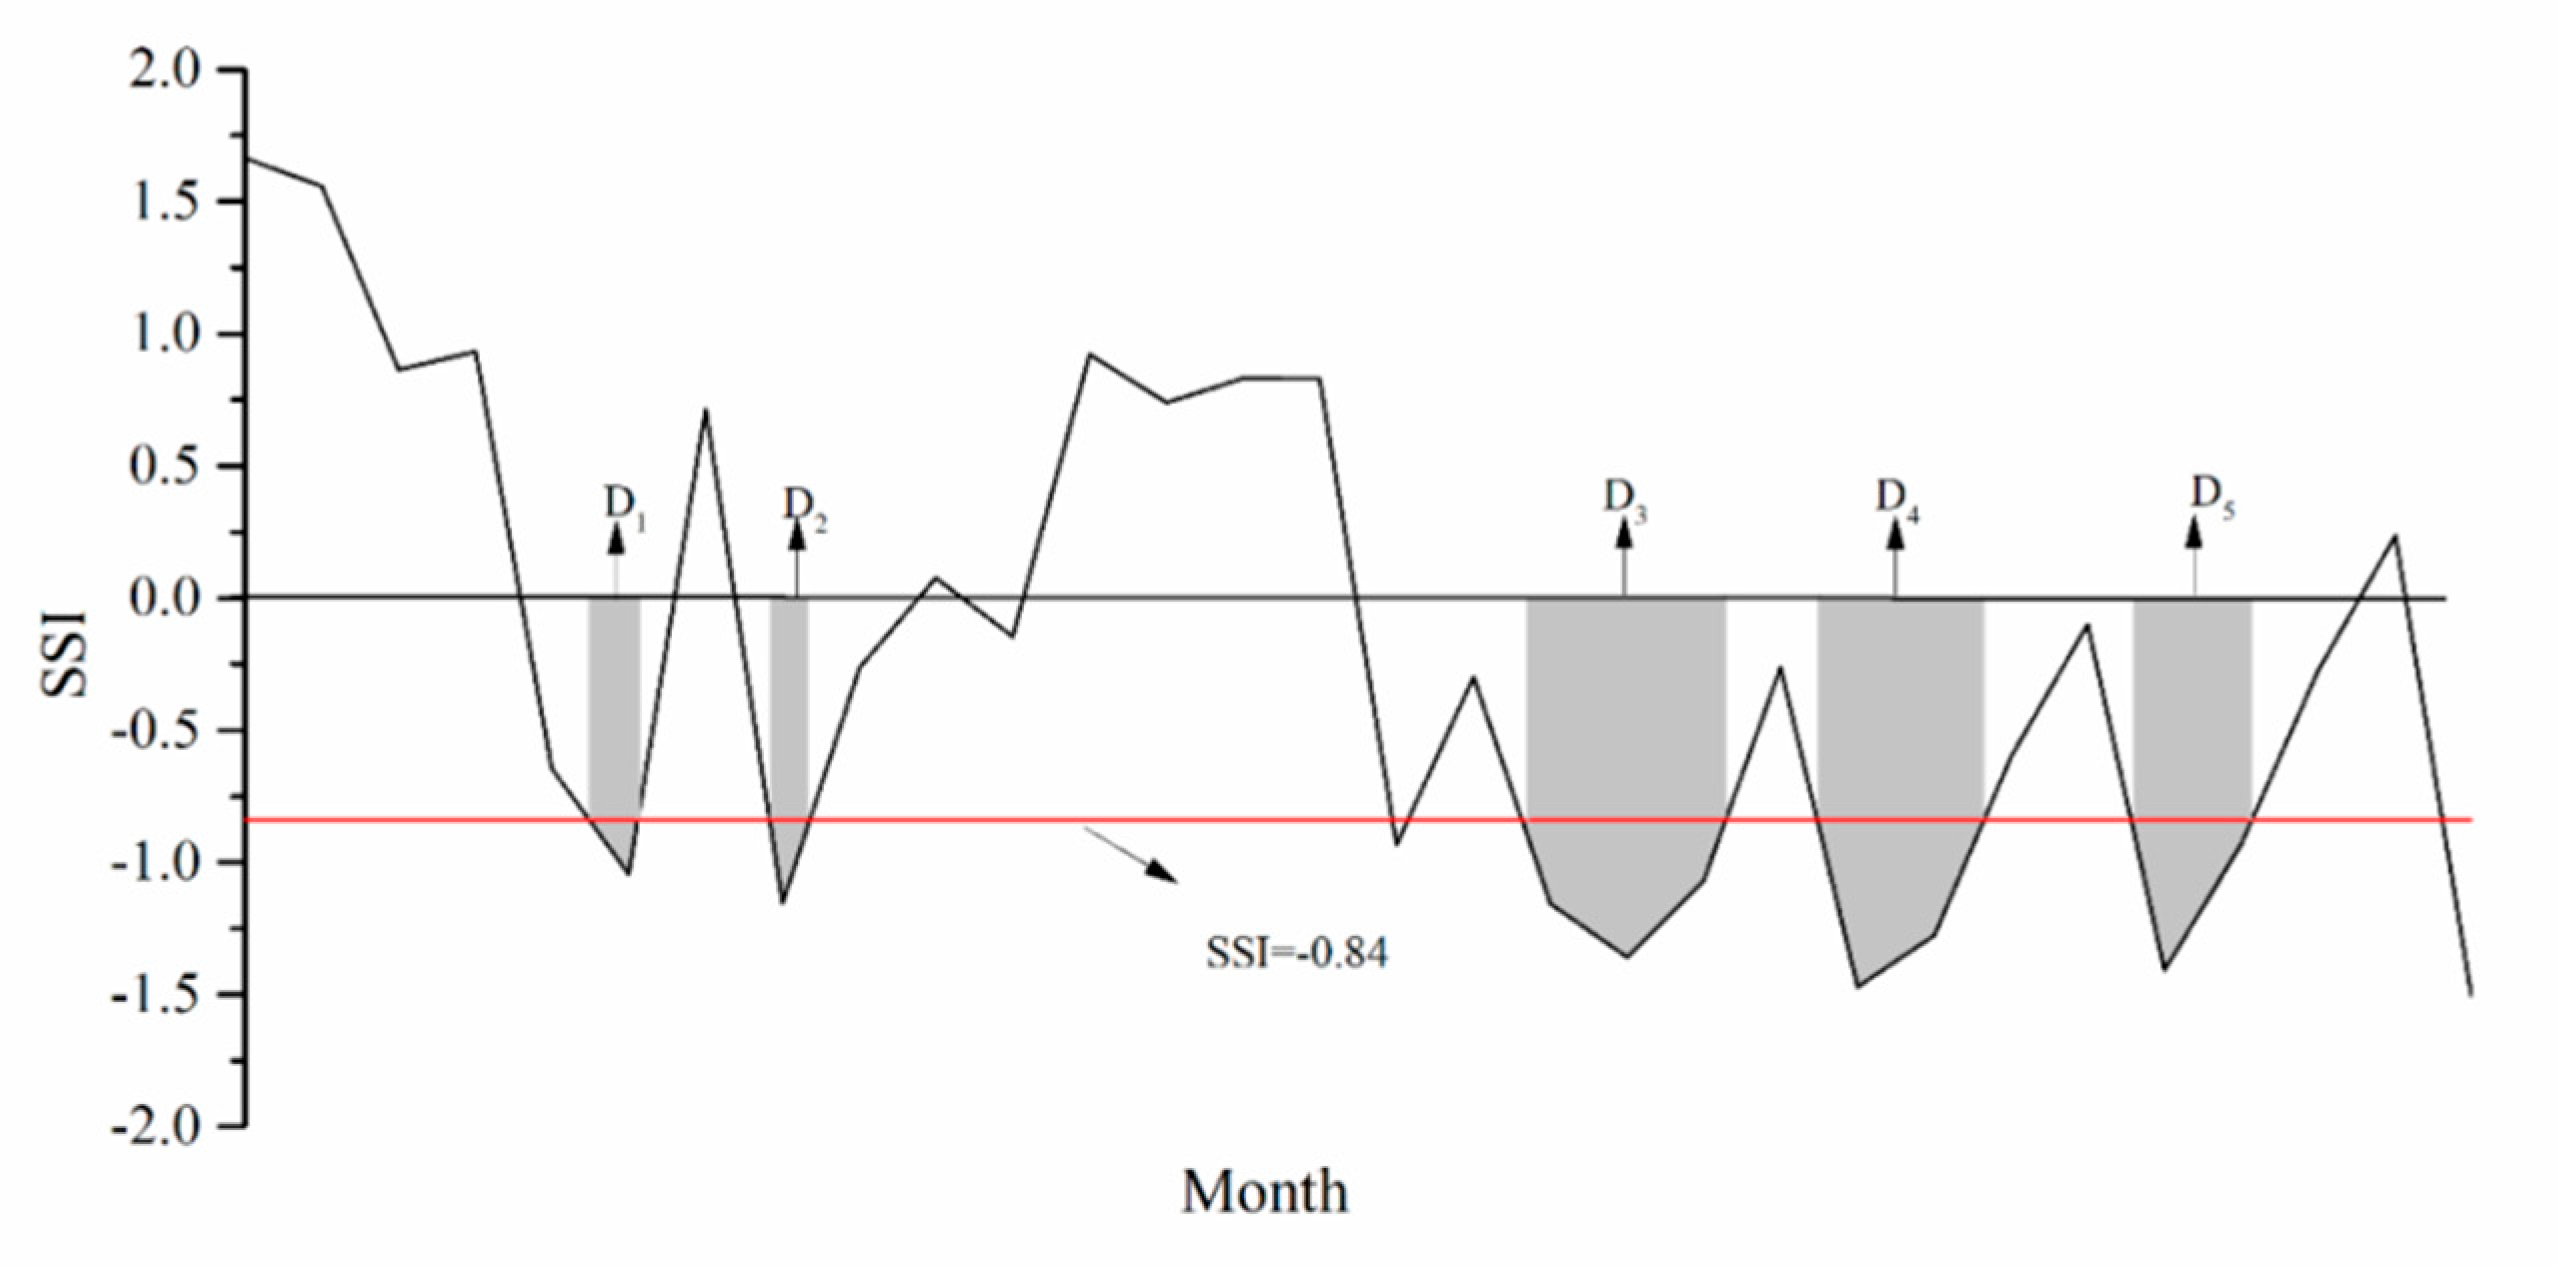
A drought event is usually determined by the threshold level approach. In this study, a drought event is considered to have occurred when SSI < −0.84 (derived at the 20% of cumulative probability) [17]. We calculated the drought severity and duration from the SSI series. The duration of a certain drought is the consecutive time when the SSI is less than −0.84, and the drought severity is defined as the sum of the SSI during drought, Figure 2 depicts the definition of drought duration and severity. The Mann-Kendall test was used to detect the trends within the drought severity and duration series [22]. The magnitude of the trend is estimated by Sen’s slope [24].
2.2.3. Separating Effects of Climate Change from Human Activities on Streamflow
In the analysis of global water and energy balance, Budyko (1974) [25] found that the average annual evaporation depends on the balance between potential evapotranspiration and precipitation. The Budyko hypothesis can be expressed as below
where E0 is the potential evapotranspiration. E, Pre is mean annual evapotranspiration and precipitation, respectively. denotes aridity and equals to E0/Pre. The f(·) means a functional relationship between E/Pre and E0/Pre.
Scientists have tried to determine the f(·) [26,27,28]. Here the water-energy balance equation developed by Choudhury (1999) [26] and Yang et al. (2008) [27] and then named as Choudhury-Yang equation is used,
where n represents the catchment landscape characteristics (e.g., properties of soil, vegetation); E, Pre, E0 are constant to them in Equation (2).
Assuming Pre and E0 in Equation (3) are independent variables, Equation (3) can be written as E = f(Pre, E0). The total differential of E can be expressed as
In which
In northwestern China, the measured streamflow over the study period contains meltwater from the glacier that brooded before the study period. Thus, the water balance equation throughout the study period in the study area can be expressed by Equation (6)
where Q is streamflow, rg is contribution percent of glacier water among Q [29], ΔS is the change in the basin water storage. Over a long period of time (i.e., equal to or greater than 10 years), ΔS can be assumed as zero.
Now changes of streamflow due to precipitation and evaporation are calculated as Equation (7)
Take Equation (4) into Equation (7), and then
Climate change and human activity are two key driving factors affecting the change of watershed hydrology. Although they are inter-related, this study attempts to evaluate their individual impact on streamflow. For a given basin, the total change in mean annual streamflow can be simplified as
where ΔQC, ΔQH represents change in streamflow attributed to the impacts of climate change and human activity, respectively.
ΔQ can also be formulated by Equation (10)
where Qobs1 refers to streamflow in the reference period during which time the effects of human activity on streamflow are less recognized, Qobs2 refers to streamflow in the impacted period that is assumed to have measurable effects of climate change and human activities on streamflow. Here, the precipitation-streamflow double cumulative curve analysis was used to identify the abrupt change point dividing the streamflow series into the reference and impacted period. This method can provide a visual representation of the consistency of the precipitation and streamflow data. If precipitation and streamflow are proportional, the double cumulative curve should be a straight line, the slope of which will present the ratio between the precipitation and streamflow. Once changes in the gradient of the double cumulative curve occur at some point (i.e., abrupt change point), which may infer that the characteristics of precipitation or streamflow have changed [30]. This method can effectively confirm the abrupt change point when human activity begins to impose the influences on the streamflow.
Now the relative human activities and climate change impact expressed as
where , is the contributions of climate change and human activities on streamflow variation, respectively.
3. Results
3.1. Selection of Best Probability Distribution Functions for Monthly Streamflow
According to Vicente-Serrano et al. (2012) [11], it is inappropriate to fit the streamflow to a certain distribution over a broad area, since streamflow is complexly influenced by various topographic and vegetation conditions and human activities. Therefore, in this study, seven distributions (Gamma, GEV, general logistic, log-logistic, log-Pearson 3, lognormal, and Weibull) were selected to fit the streamflow at monthly scales for the 10 rivers. We applied the K-S test to test the goodness of fit for different candidate distributions. The K-S D at the 0.05 significance level is 0.19, results showed that streamflow time series fitting by general logistic and GEV passed the K-S test in all months (Table 2). The best-fitting distribution function was determined by the minimum K-S D, it can be showed that the best distribution is different for each river and different months (Table S1). As an example, the best fit for the Aksu River in January is the general logistic distribution, while in July, the best fit changed to log-Pearson 3 (Table S1). For the Heihe River, the general logistic and Weibull distribution provided the best fit for January and July, respectively, also different from that of the Aksu River (not shown). The number of months that showed the best fit with each distribution is presented in Table S2. The general logistic provided the best fit for 55 months, and GEV showed 27 months. This indicated that these two distributions are the best choice to fit the streamflow. The probability density f(x) and cumulative probability F(x) of the observed streamflow for Aksu River were fitted by the GEV and general logistic distribution (Figures S1 and S2), the results showed these two distributions can fit the streamflow well at monthly scale. This was also observed for other rivers (not shown).
To further assess the seven distributions, we use them to compute the SSI series and then the Shapiro-Wilks (S-W) test was applied to test normality for SSI series of each month, the results showed that the general logistic and GEV pass the normality for most months (Table S3), suggested the general logistic and GEV being again the recommended distribution. Therefore, we calculated the mean value of K-S D of 12 months for these two distributions of the ten rivers (Table 3), and the distribution with the lowest mean K-S D was selected as the best fit one. We can see that the general logistic is the most appropriate distribution to describe the changes of the streamflow. As a result, we selected the general logistic as the best fit distribution for all rivers.
3.2. Changes of Hydrological Drought Severity and Duration
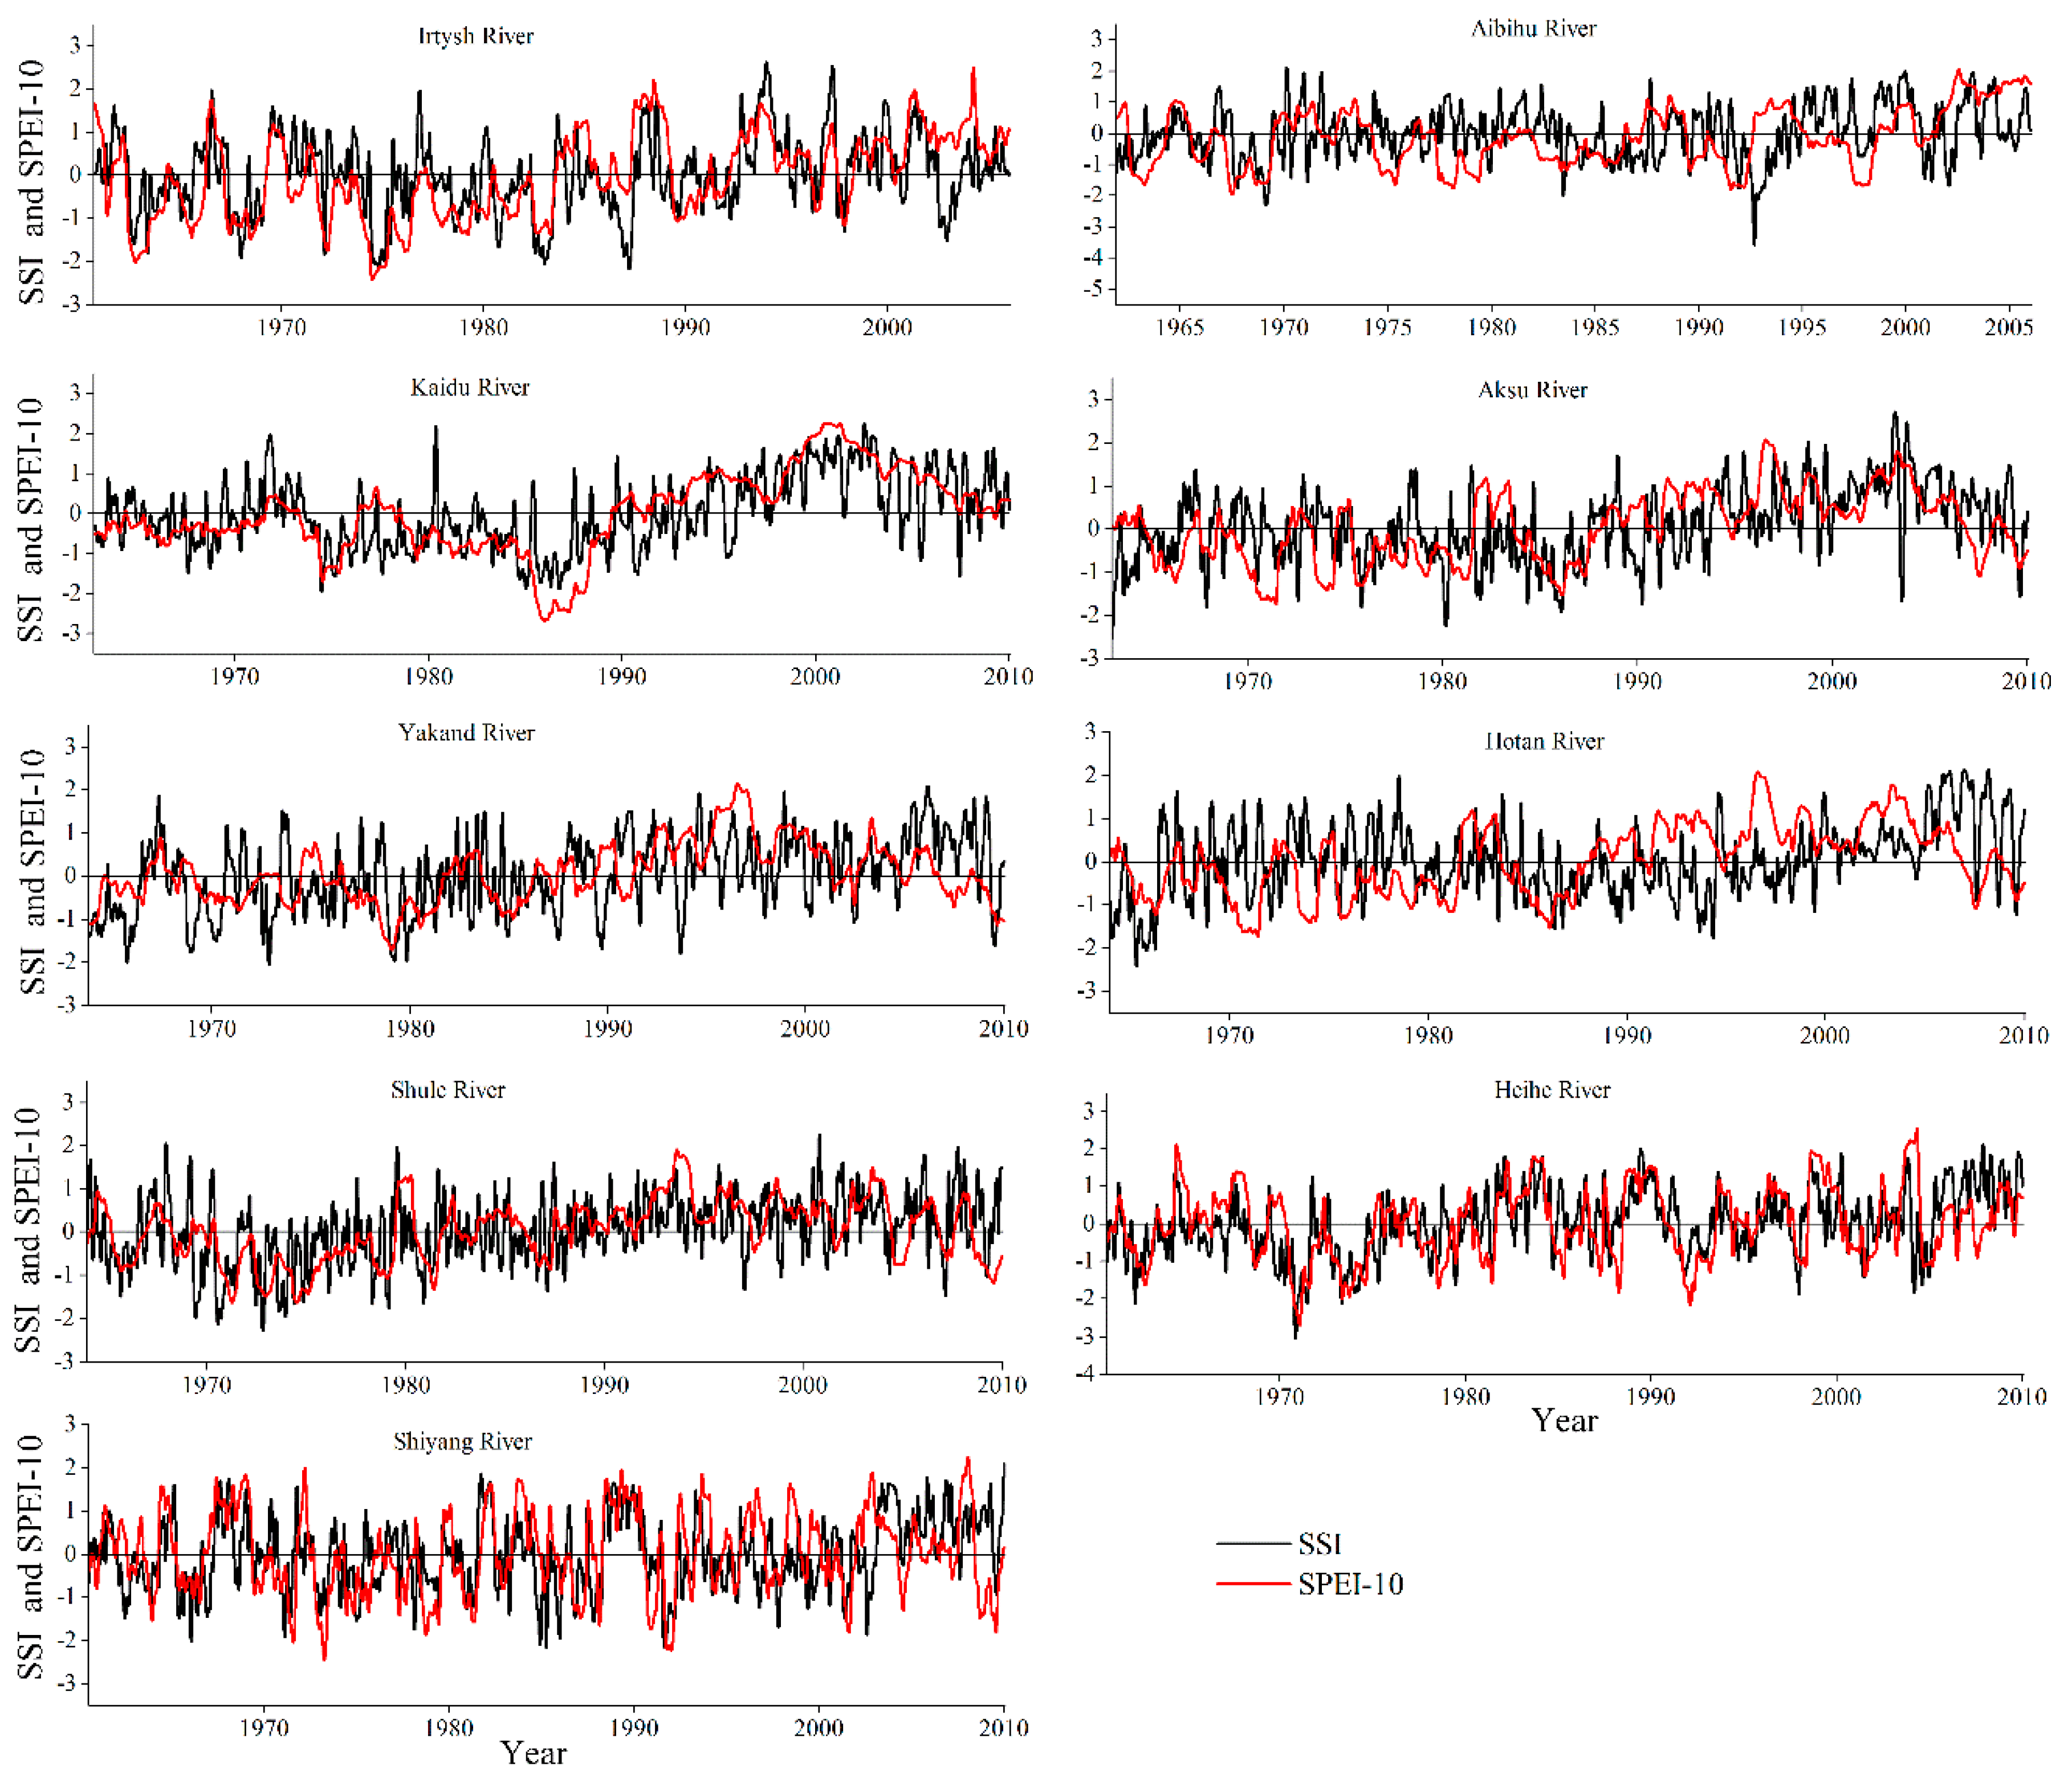
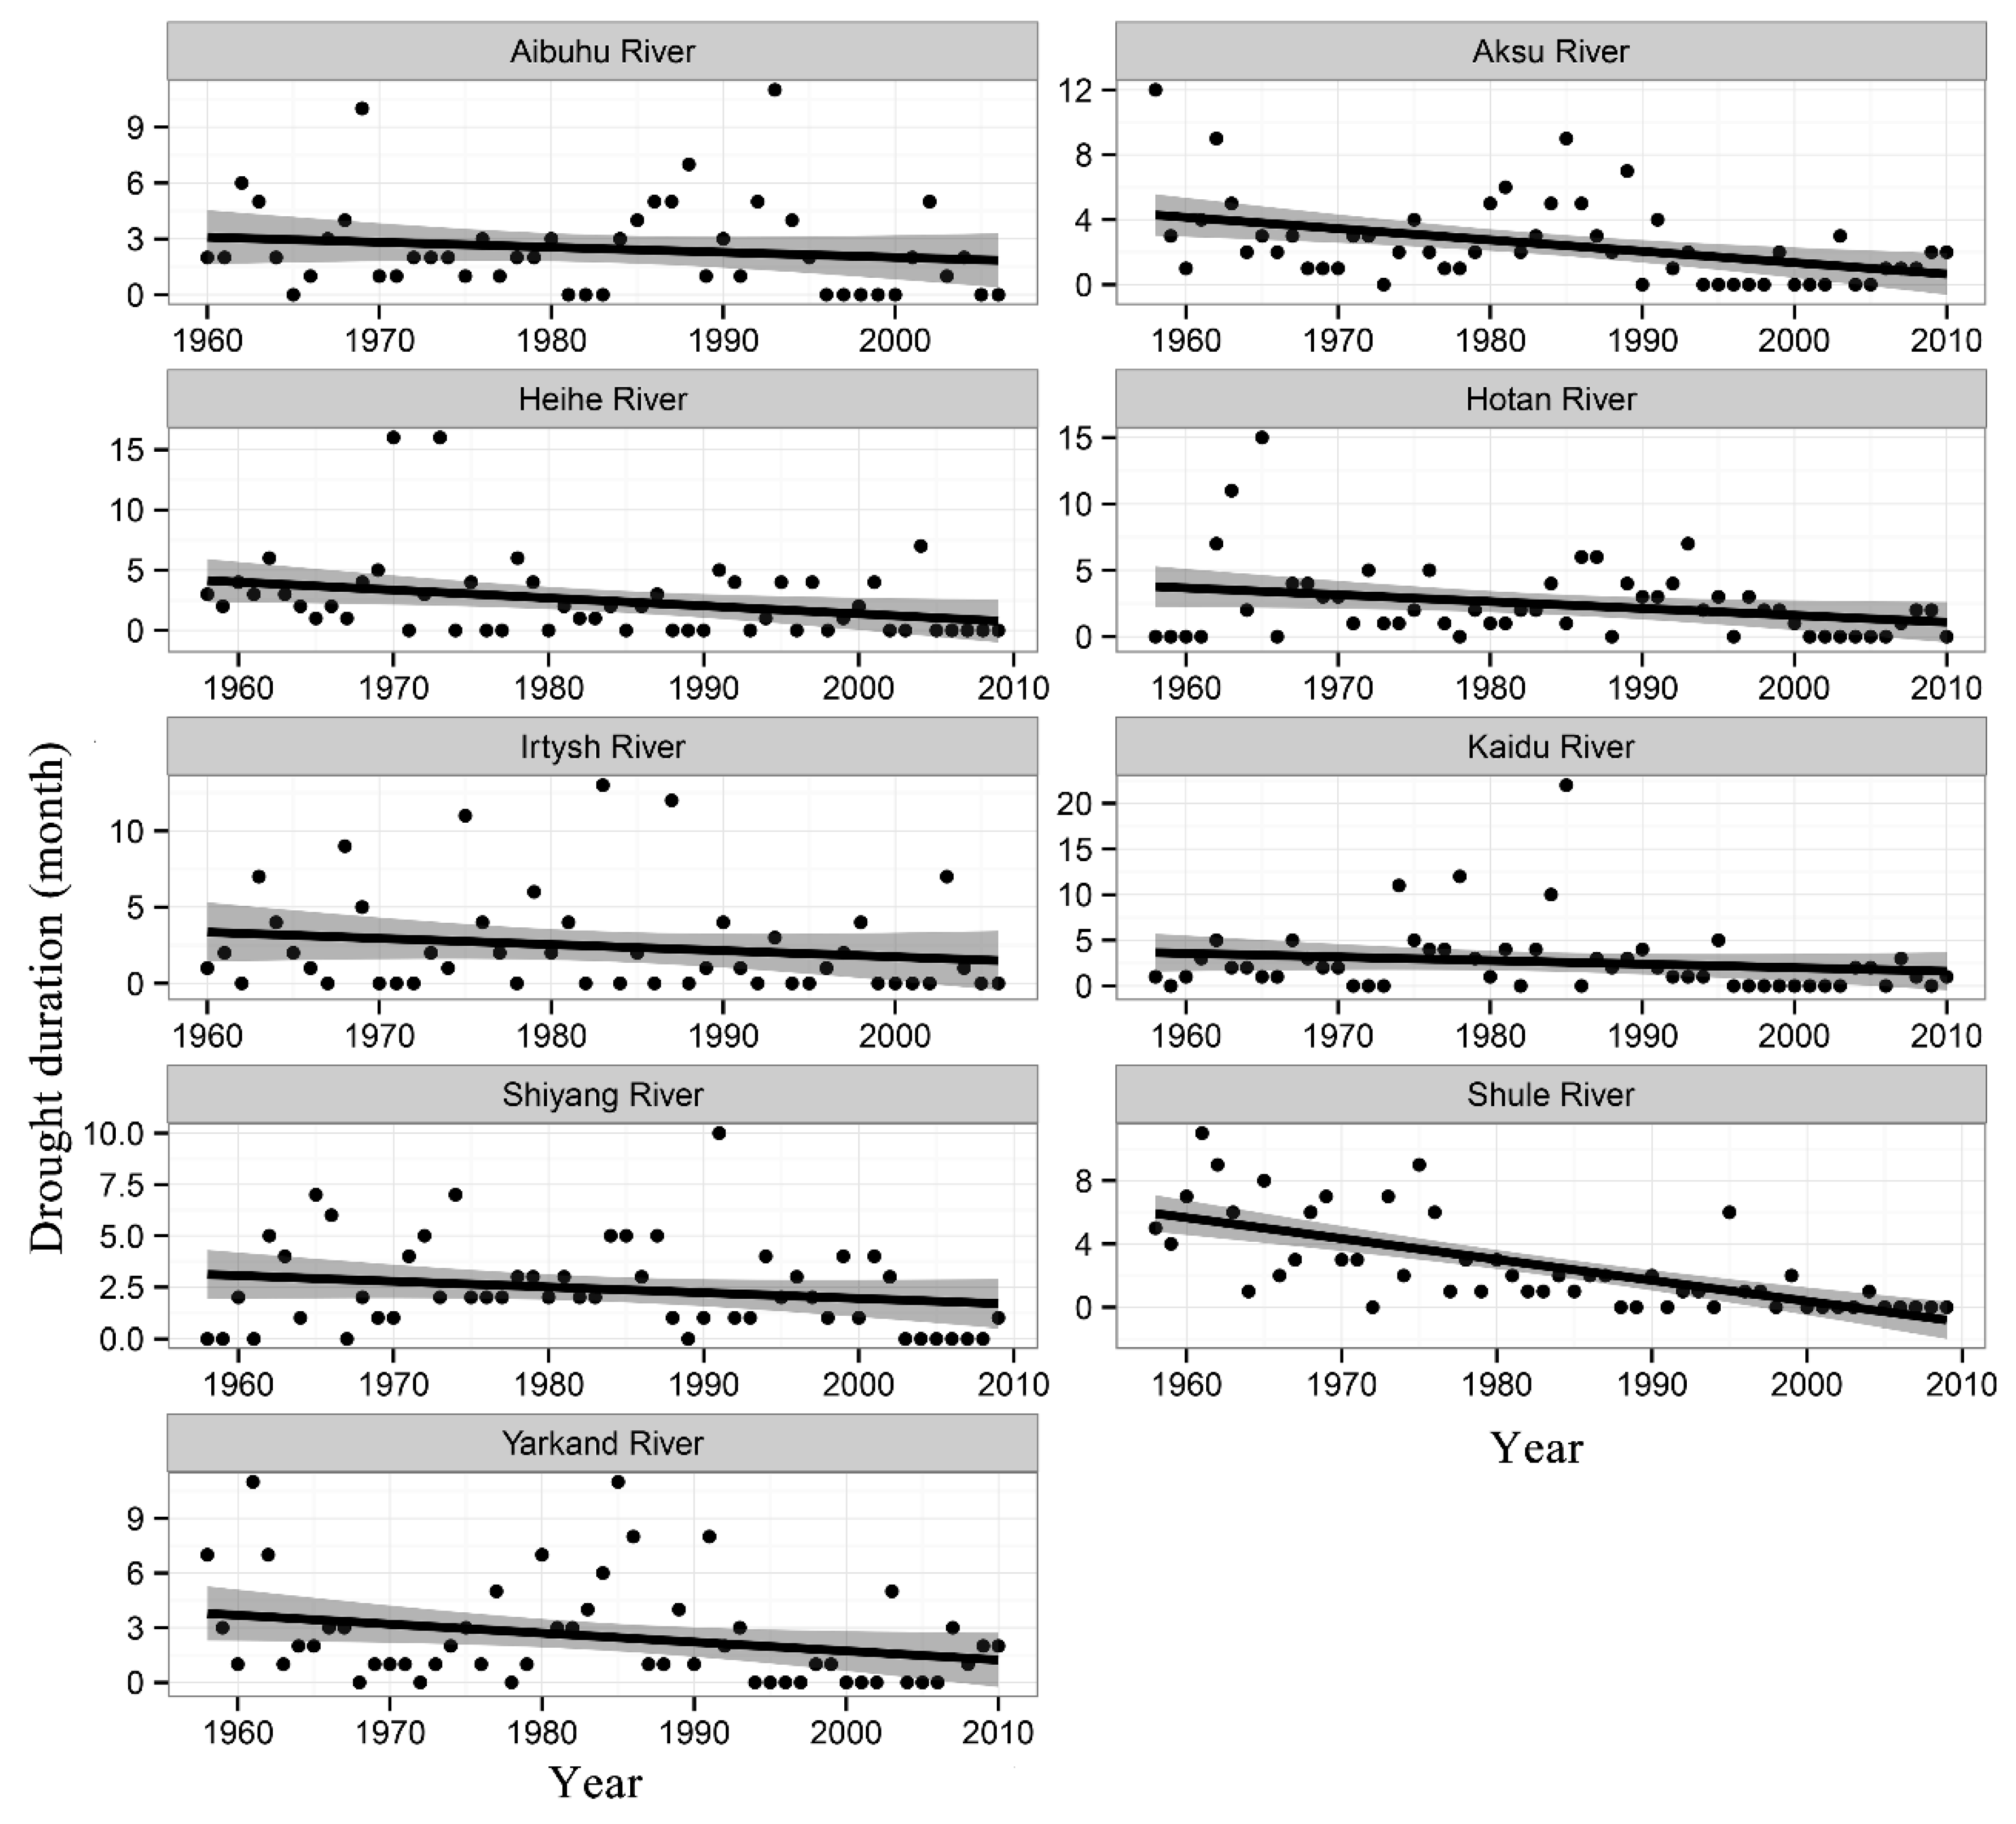
The time series of SSI for each river is displayed in Figure 3. To provide a clear explanation of changes of hydrological drought, the drought severity (Figure 4) and drought duration (Figure 5) were calculated. Additionally, the linear trend and inter-decadal changes of drought duration and severity are also given in Table 4 and Table 5. The results indicate that drought severity and duration for the Irtysh River show a significant decreasing trend, with trend magnitudes of −0.0108 year−1 and −0.04 year−1, respectively. For Aibibu, drought severity and duration also exhibited a decreasing trend, but these trends were insignificant (Table 4). The inter-decadal change showed the same pattern; the severity changed from 3.93 and 4.65 in the 1960s to 1.65 and 2.32 in the 2010s for the Irtysh River and Aibibu, respectively. In south Xinjiang, both drought severity and duration of the Aksu River showed significant decreasing trends, while the Tarim River has an increasing trend. The other rivers (except for the severity of the Yarkand River) displayed insignificant changes. We noted that both the inter-decadal changes in drought severity and duration for Yarkand River and Hotan River decreased from the 1960s to 2010s, while the Kaidu River and Aksu River had the maximum value in the 1980s and then decreased significantly in the 2000s (Table 5). In the Hexi Corridor, most of the rivers showed decreasing trends both for drought duration and severity, especially for the Heihe River (Yinglx) and Shule River (Table 4). At the inter-decadal scale, the three rivers exhibited different patterns. The Shule River, which is near Xinjiang, showed a decreasing trend from the 1960s to the 2000s, and the change pattern is synchronous with that for rivers in Xinjiang. The Shiyang River showed stable severity and duration before the 1990s and then decreased in the 2000s (Table 5). The Heihe River (Yinglx) can be divided into two patterns, before the 1980s, when both drought severity and duration showed high values, and thereafter, when they showed low values. The Heihe River Basin is located at the confluence of the westerly belt, the plateau monsoon and the East Asian monsoon [31]; therefore, the runoff formation process is affected by the above climatic conditions, making the streamflow complicated. From the above analysis, hydrological drought duration and severity for all headwaters of rivers (gauge stations located in the mountain pass) in the arid region of northwestern China have decreased, especially for the Irtysh River, Aksu River, Shule River, and Heihe River (Yinglx). Shi et al. (2007) [32] reported that the arid region of Northwest China is experiencing a transition process from “warm-dry” to “warm-humid” based on large observations. The regional hydrological process has changed by the “warm-humid” climate to some extent. Runoff is an important part of water resources in the arid region of northwest China, with mountain runoff accounting for 80% of surface runoff. The proportion of glaciers and snow melt water account for 45% or more for some rivers, which is sensitive to climate change, making the hydrological processes change significantly [33]. The increasing rainfall and melting glaciers arising from climate change lead to more runoff in rivers, causing decreased drought severity and duration for the headwaters of the studied rivers.
3.3. Correlation between Hydrological (SSI) and Meteorological Drought (SPEI)
To assess the best SPEI timescale explaining the streamflow series (SSI), the correlation between SSI and SPEI at the 1–48-month time scale for each river is illustrated in Figure 6. In North Xinjiang, the Irtysh River showed greater correlation coefficients compared with Aibihu (Figure 6a,b). The greatest correlation coefficient for the Irtysh River was found between SSI and SPEI-10, while for Aibihu, it occurs at the 22-month scale. For the Irtysh River, precipitation (rainfall and snow) and groundwater are the dominant resources, accounting for 71.0% and 28% of the runoff supply, respectively (Table 6). That is to say, the streamflow was less affected by glacier melt water in Irtysh River, while in Aibihu, glacier melt water contributed to 24.4% of the runoff (Table 6). The transformation time for precipitation to streamflow is relatively shorter than that of glaciers, and this may be the possible reason for the larger time scale (22 months) for Aibihu, compared with the observed greatest correlation coefficient of the Irtysh River (10 months). Additionally, the changes in precipitation can be directly reflected by streamflow, and the precipitation is abundant in Irtysh River, which also results in a higher observed correlation coefficient in the Irtysh River.
In South Xinjiang, the correlation coefficients increased from the 1- to 10-month time scale, while after the 10-month scale, the correlation coefficients remained stable at a relatively high level (Figure 6c–f). This means that hydrological drought can be represented by SPEI at a high time scale. The correlation coefficient is relatively larger for the Aksu and Kaidu Rivers compared with that of the Yarkand River and Hotan River (Figure 6c–f), which might be related to the different runoff fraction of these rivers. For the Yarkand River and Hotan River, the glacier melt water mainly contributed to the streamflow, while for the Aksu River and Kaidu River, precipitation contributes a greater proportion to the runoff (Table 6).
For the Hexi Corridor, the Heihe River and Shiyang River showed higher correlation coefficients around the 10-month time scale (Figure 6h,i). The correlation coefficients for Shule River increased from the 1- to 10-month time scale and then remained relatively stable (Figure 6g). The proportion of glacier melt water among the streamflow is quite different owing to the different glacier coverage. The glacier melt water accounted for more than 30% of the water supply in the Shule River (509.87 km2), while in the Heihe River and Shiyang River, the glacier coverage is much smaller (78.33 and 39.94 km2 respectively), making the proportion of the water supply lower than 6% (Table 6). The dominant runoff discharge for the Heihe River and Shiyang River is precipitation (rain and snow), which also makes the largest correlation coefficients occur at 10-month time scales (Table 6, Figure 6h,i).
Meteorological drought develops quicker than hydrological drought, that is to say, a delay often appears between meteorological and hydrological drought, so a close relationship may be found between them [34,35]. From the above analysis, the correlation coefficient pattern between SSI series and SPEI (1–48) series can be grouped into two types: an increasing-decreasing pattern: with the highest correlation coefficient between SSI and SPEI around the 10-month scale, typical for the Irtysh River, Heihe River, and Shiyang River with precipitation as the main runoff supply. An increasing-stable pattern: correlation coefficient between SSI and SPEI kept high value after 10-month scale, typical for Aibihu, Kaidu River, Aksu River, Yarkand River, Hotan River, and Shule River where the glacier melt water showed a relatively high value. Our results showed that the response time between hydrological drought and meteorological drought are longer compared with that in Aragon River basin in the central Pyrenees, Gan River Basin in China (2–3 months) [36,37]. The rapid response is associated with the generation of intense precipitation runoff [34,36]. One of the important factors for a hydrological drought development is the storage capacity of a catchment. The storage capacity of catchments studied is determined by snow, glaciers, and groundwater system, which create a long memory in the hydrological system and then result in long time for hydrological drought response to meteorological drought.
Figure 3 shows the SSI and SPEI-10 series. Those two-time series in the Irtysh River, Aksu River, Heihe River, and Shiyang River showed almost the same evolution. Based on these, we concluded that SPEI and SSI matched well with each other in regions with relatively abundant precipitation (see Table 6).
3.4. Effect of Human Activities on Drought Evolutions
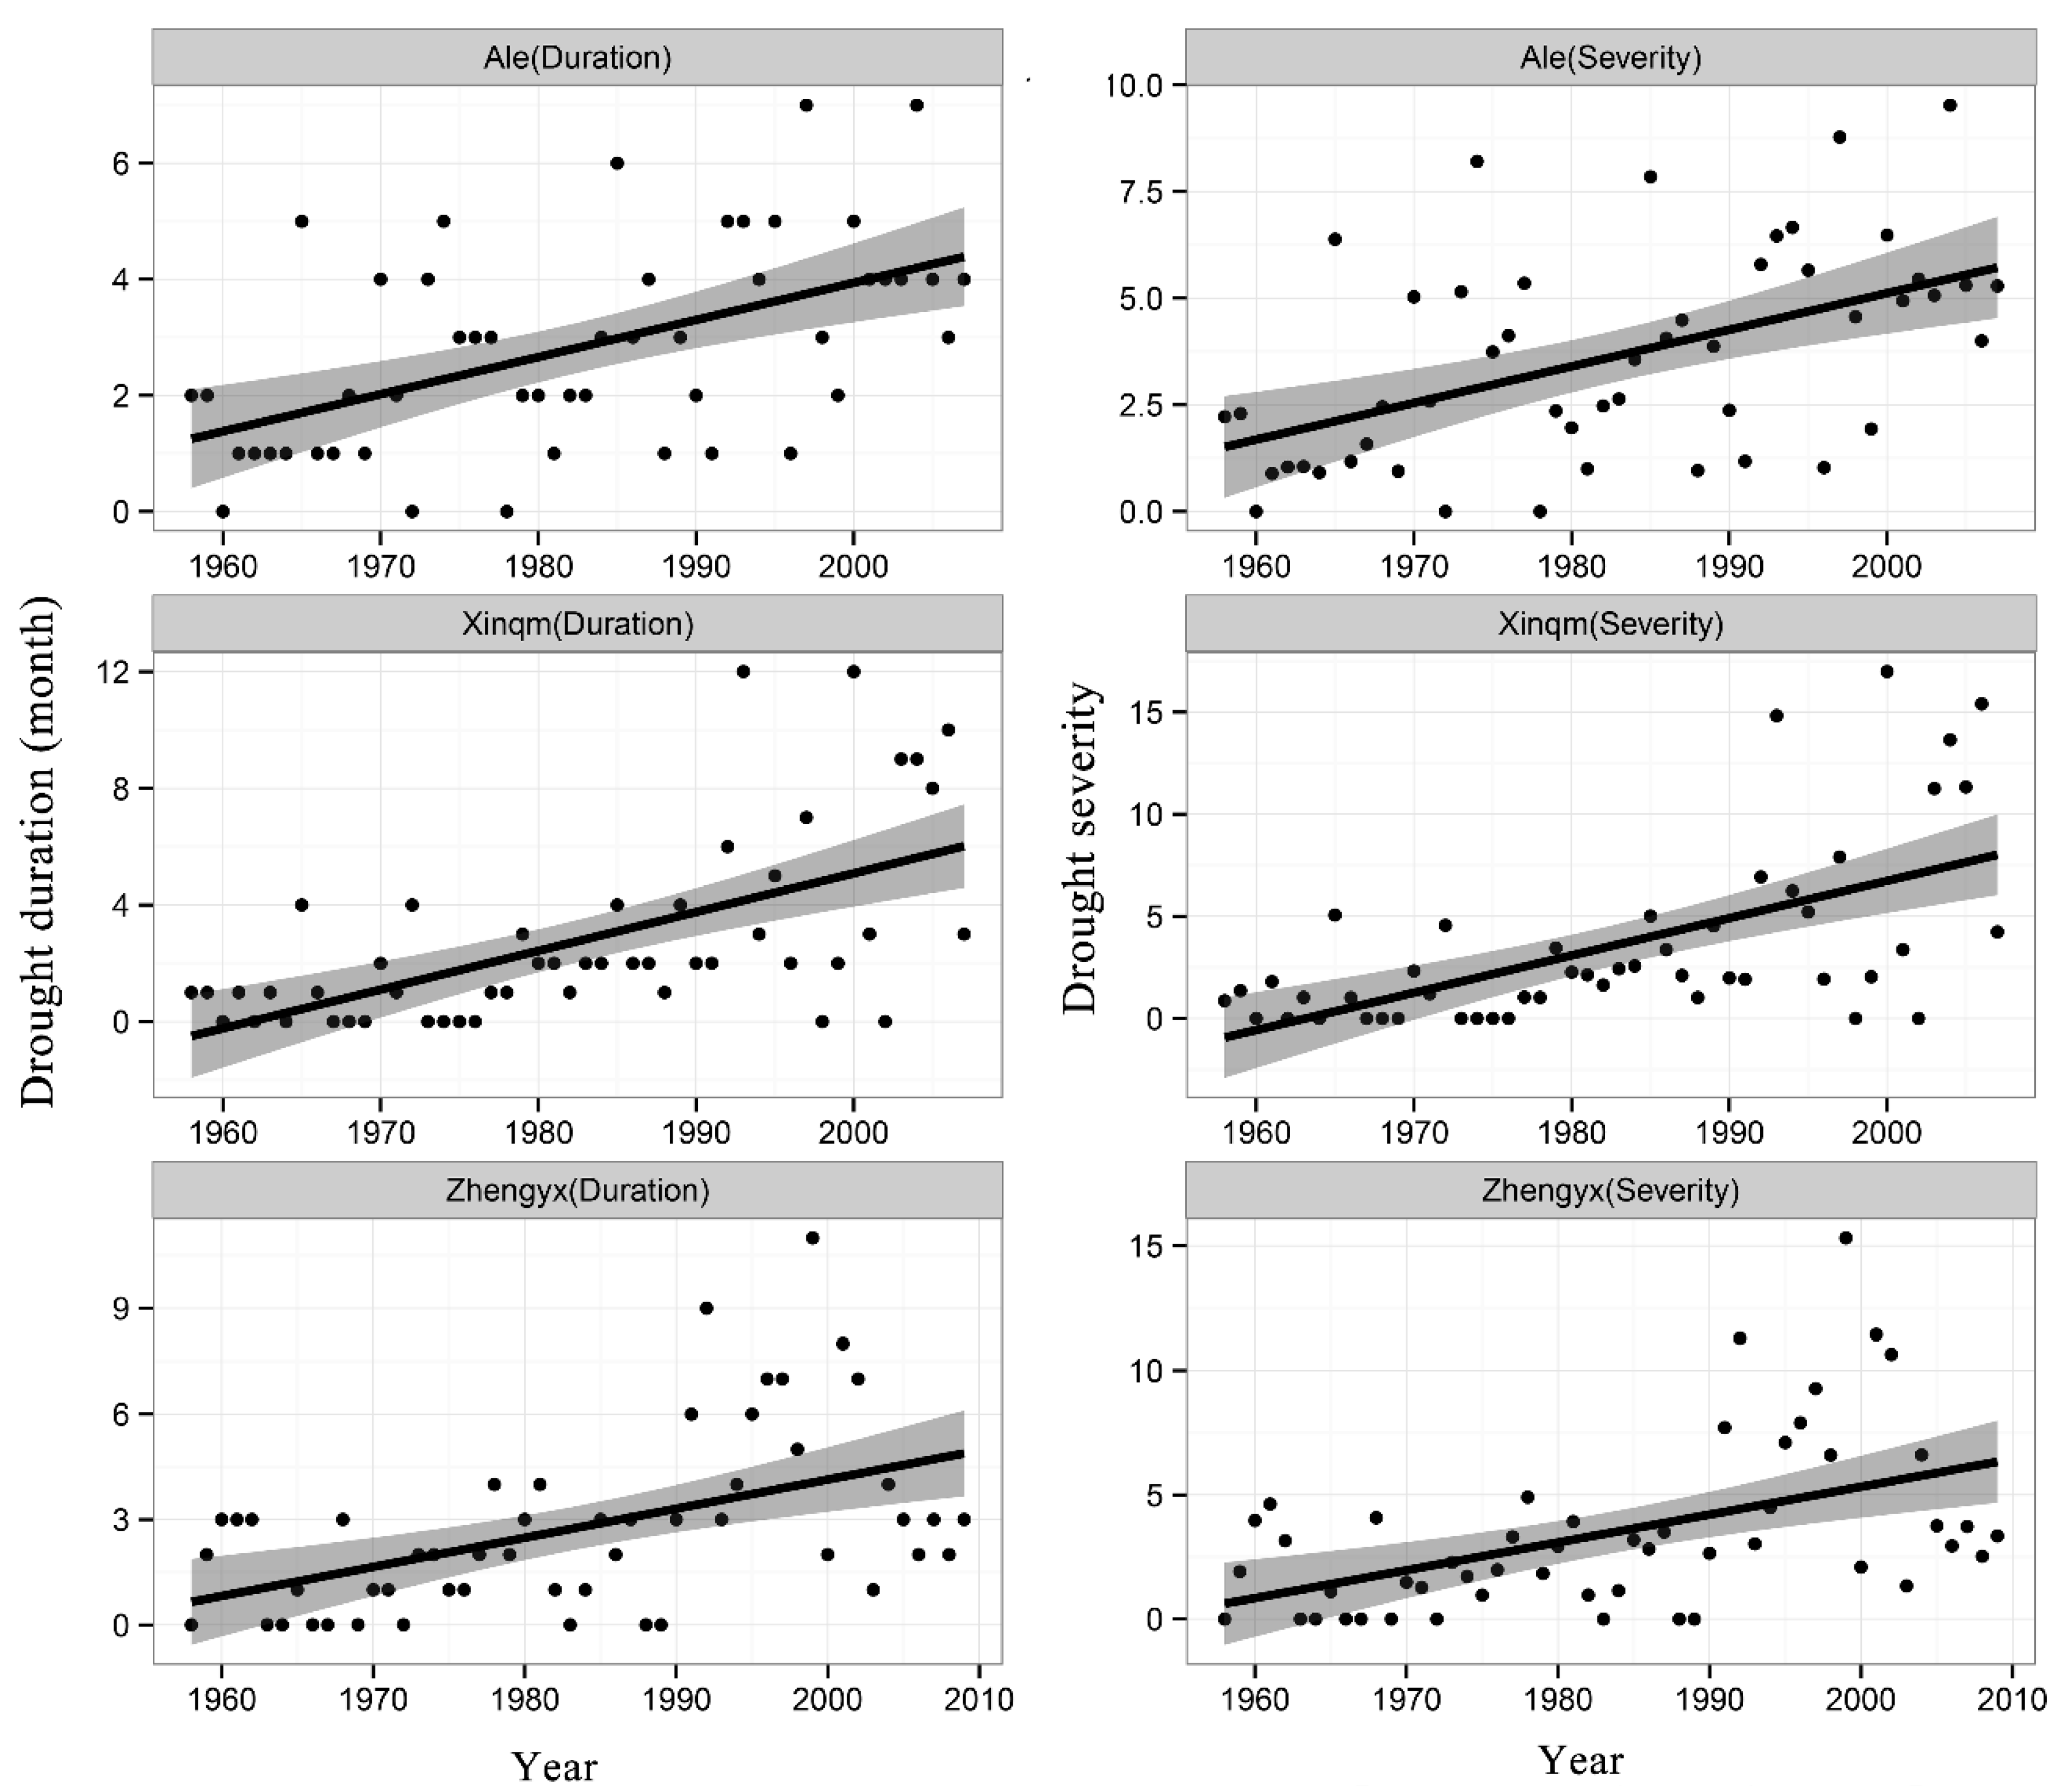
The duration and severity of hydrological drought for the main streams of the Tarim River (Ale and Xinqm) and Heihe River (Zhengyx) were analyzed (Figure 7, Table 4). Both drought duration and severity showed a significant increasing trend, indicating that the mainstream of the Tarim River and middle stream of Heihe River had become dry. The inter-decadal change also displayed the same pattern, with drought severity and duration having increased significantly from the 1960s to 2000s (Table 5), which also indicated that the drought had become more severe. Xu et al. (2010) [38] found that the air temperature and precipitation both tend to increase during the past several decades in the arid region of northwestern China. The annual streamflow showed an increasing trend in the mountainous region and a decreasing trend in the downstream part of the Tarim River Basin [39]. The hydrological regime of the headwaters is mainly dominated by natural climate change, while human activities strongly affected the mainstream (Tarim River) and middle stream (Heihe River) as streamflow is the only water supply for oases in the arid region.
To further analyze the human impact on hydrological drought, the Budyko methods were used to assess the respective contribution of human activity and climate change to streamflow. For Heihe River, we found that human activities play a positive role in reducing streamflow, which means the intensified human activity increased water consumption and then resulted in reduced runoff (Table 7). Climate change characterized by increasing precipitation and decreasing potential evaporation showed a negative effect on reducing streamflow (−29.49% and −192.36% for 1990–1999 and 2000–2009, respectively). As the contribution of human activity to streamflow is greater than that of climate change, so the increasing streamflow induced by climate change could not offset decreasing streamflow caused by increasing human activity. Human activities are the dominant force affecting the runoff changes in the upper and middle reaches of the Heihe River [40]. Oasis water demand increased sharply from 10.8 × 10⁸ m3 in 1986 to 19.0 × 10⁸ m3 in 2013. Climate change and human agricultural activities, such as the expansion of oasis and changes in land-growing structures, have led to a 6.9% and 84% increase in water requirements, respectively [41,42]. Human activities in the upper reaches of the Heihe River play a leading role in water consumption, with a contribution rate greater than 89% [43].
In Tarim River, climate change (45.22%) and human activity (54.78%) showed a positive effect on the decrease runoff during 1970–1979 (Table 7), which means strong evaporation and increased water consumption caused the decreased runoff, and the relative influence of human activity on runoff reduction is slightly higher than that of climate change. During 1980–1989, 1990–1999, and 2000–2009, climate change increased the streamflow, while the human activities was the dominant factor affecting the decreasing streamflow and this effect was much stronger than that of 1970–1979 (Table 7). In Tarim Basin, irrigated areas have expanded form approximately 3480 km2 in the 1950s to 12,570 km2 in the 2000s, and the consumption of water has consequently increased from 5 billion m3 to 15.5 billion m3 in the same period [44]. Other results also showed that, compared with 1960–1972, which was relatively less affected by human activities, the contribution rate of human activities increased to 120.68–144.6% in 1973–1986, and the contribution rate increased to 140.38–228.68% in 1987–2015 in the Tarim River [45]. In the mainstream, human activities play a leading role in reducing traffic, with a contribution rate of 54.8–355.6% [46].
4. Conclusions
In this study, the best fit to monthly streamflow distribution for ten rivers in northwestern China were selected by the Kolmogorov-Smirnov and Shapiro-Wilks test from seven distributions, and finally the general logistic was chosen for the 10 rivers. Trend and inter-decadal analysis showed that drought severity and duration of the headwaters for all the rivers have decreased, especially for the Irtysh, Aksu, Shule, and Heihe Rivers. We conclude that the increased rainfall in the context of climate warming has resulted in reduced hydrological drought for rivers with precipitation as the main recharge source in this region. The increased temperatures also lead to increasing glacial melt water [47], which can also decrease the drought severity and duration in rivers with glacier melt water as the main recharge source. Nevertheless, glacial melt water could not continue be the recharge source, especially for the small glaciers (area less than 10 km2), as the increasing precipitation cannot offset the impact of warming on glaciers [48]. In the context of increasing precipitation and temperature, runoff at mountain pass stations increased at most of the hydrological stations due to few human activities [49]. Unlike the headwaters of rivers, both drought duration and severity of Tarim River (main stream) and Heihe (middle stream) increased. The Budyko analysis also revealed that the impact of human activity is the dominate factor reducing the streamflow. This indicates that hydrological drought has become more serious due to human activities despite the increased runoff in headwaters. The alluvial–proluvial plain in the arid region of northwestern China is dominated by irrigation agriculture. When runoff flows from mountains into the irrigated area of the plains, the hydrological processes are significantly affected by the cultivated land area of oases and irrigation water diversion, which consumes large quantities of water. Therefore, we conclude that human activities have affected the main stream of Tarim River and middle and lower reaches of Heihe River heavily and resulted in increasing hydrological drought duration and severity.
The correlation analysis between SSI series and SPEI series at the 1–48-month scale in different rivers was conducted, and correlation coefficient series between them showed two patterns, namely, the “increasing-decreasing” pattern and the “increasing-stable” pattern. The “increasing-decreasing” pattern was typically observed in the Irtysh, Heihe, and Shiyang Rivers, where precipitation is the main streamflow supply (>50%). The “increasing-stable” pattern was typical for Aibihu, Kaidu, Aksu, Yarkand, Hotan, and Shule Rivers, where glacier melt water occupied a relatively high percentage of streamflow. In general, the greater correlation coefficients were observed in rivers with less glacier melt water discharge, while lower correlation coefficients were found in rivers with mixed supply from precipitation, glacier melt water and groundwater. Studies have shown that the glacier melt water will regulate and control the stability of runoff when it occupies more than 25% of the runoff supply [33,50]. The glacier melt water is mainly affected by changes of temperature. Compared with precipitation, glaciers need more time to transform into runoff, which might lead to the “increasing-stable” pattern, with the maximum correlation coefficient being observed in SPEI at a long time scale. Additionally, as an example, low correlation coefficients were observed for the Hotan River, probably because glaciers in this area are distributed in the high mountains (the snow line is above 5000 m), and the inter-annual variability of precipitation and temperature is much smaller in high versus low mountains.
Although the climate in the arid region of northwestern China showed a warming-wetting trend, the arid climatic environment, especially for endorheic drainage basins, cannot be qualitatively changed by short-term increased precipitation due to the peculiar geographical location and climatic conditions. The climate change trend also needs to be further validated using longer temporal series. The meteorological and hydrological stations used in our study are quite irregularly distributed, with sparse spatial coverage in the arid region, and most of them are located at lower altitude or near an artificial oasis. Therefore, they might poorly represent the high mountain area. Further study should include more stations and longer time series of data.
Supplementary Materials
The following are available online at https://www.mdpi.com/2073-4441/11/5/1051/s1, Figure S1: Empirical and modeled f(x) values using the general logistic and general extreme value distributions of the streamflow series at each month at Aksu River, Figure S2: Empirical and modeled F(x) values from general logistic and general extreme value distributions of the streamflow series at each month at Aksu River, Table S1: K-S D statistic for the seven probability distributions of monthly streamflow for the Aksu River (the bold value is the selected best fit distribution for each month), Table S2: Number of best fit using each distribution for ten rivers in the arid region of northwestern China, Table S3: Number of months pass the Shapiro-Wilks test by seven distributions for ten rivers in the arid region of northwestern China.
Author Contributions
H.W. and Y.C. contributed to the conception of the study. Z.C. and H.W. performed the data analyses. R.F. and Y.P. wrote the manuscript.
Funding
This research was supported by the National Natural Science Foundation of China (41701034), National Key Research and Development Program of China (2018YFC1508101), and technology project of Jiangsu collaborative innovation center of regional modern Agriculture & Environment protection (HSXT2-324).
Acknowledgments
The authors thank the National Climate Center, China Meteorological Administration, for providing the meteorological data for this study.
Conflicts of Interest
The authors declare no conflict of interest.
References
- Wilhite, D.A. Drought as a natural hazard: Concepts and definitions. In Drought A Global Assessment; Routledge: London, UK, 2000; pp. 3–18. [Google Scholar]
- Van Lanen, H.A.J.V.; Wanders, N.; Tallaksen, L.M.; Loon, A.F.V. Hydrological drought across the world: Impact of climate and physical catchment structure. Hydrol. Earth Syst. Sci. 2013, 17, 1715–1732. [Google Scholar] [CrossRef]
- Van Loon, A.F.; Laaha, G. Hydrological drought severity explained by climate and catchment characteristics. J. Hydrol. 2015, 526, 3–14. [Google Scholar] [CrossRef]
- Van Loon, A.F.; Gleeson, T.; Clark, J.; Dijk, A.I.J.M.V.; Stahl, K.; Hannaford, J.; Baldassarre, G.D.; Teuling, A.J.; Tallaksen, L.M.; Uijlenhoet, R. Drought in the Anthropocene. Nat. Geosci. 2016, 9, 89–91. [Google Scholar] [CrossRef]
- Mishra, A.K.; Singh, V.P. A review of drought concepts. J. Hydrol. 2010, 391, 202–216. [Google Scholar] [CrossRef]
- Mendicino, G.; Senatore, A.; Versace, P. A groundwater resource index (gri) for drought monitoring and forecasting in a mediterranean climate. J. Hydrol. 2008, 357, 282–302. [Google Scholar] [CrossRef]
- McKee, T.B.; Doesken, N.J.; Kleist, J. The relationship of drought frequency and duration to time scales. In Proceedings of the Eighth Conference on Applied Climatology, Anaheim, CA, USA, 17–22 January 1993; pp. 179–184. [Google Scholar]
- Palmer, W.C. Meteorological Drought, Research Paper No. 45; Office of Climatology, Weather Bureau: Washington, DC, USA, 1965; Volume 58. [Google Scholar]
- Vicente-Serrano, S.M.; Begueria, S.; Lopez-Moreno, J.I. A multiscalar drought index sensitive to global warming: The standardized precipitation evapotranspiration index. J. Clim. 2010, 23, 1696–1718. [Google Scholar] [CrossRef]
- Haas, J.C.; Birk, S. Characterizing the spatiotemporal variability of groundwater levels of alluvial aquifers in different settings using drought indices. Hydrol. Earth Syst. Sci. 2017, 21, 2421–2448. [Google Scholar] [CrossRef]
- Vicente-Serrano, S.M.; Lopez-Moreno, J.I.; Begueria, S.; Lorenzo-Lacruz, J.; Azorin-Molina, C.; Moran-Tejeda, E. Accurate computation of a streamflow drought index. J. Hydrol. Eng. 2012, 17, 318–332. [Google Scholar] [CrossRef]
- Dai, A.G. Characteristics and trends in various forms of the palmer drought severity index during 1900–2008. J. Geophys. Res.-Atmos. 2011, 116. [Google Scholar] [CrossRef]
- Choi, M.; Jacobs, J.M.; Anderson, M.C.; Bosch, D.D. Evaluation of drought indices via remotely sensed data with hydrological variables. J. Hydrol. 2013, 476, 265–273. [Google Scholar] [CrossRef]
- Van Loon, A.F.; Van Lanen, H.A.J. A process-based typology of hydrological drought. Hydrol. Earth Syst. Sci. 2012, 16, 1915–1946. [Google Scholar] [CrossRef]
- Van Loon, A.F.; Ploum, S.W.; Parajka, J.; Fleig, A.K.; Garnier, E.; Laaha, G.; Van Lanen, H.A.J. Hydrological drought types in cold climates: Quantitative analysis of causing factors and qualitative survey of impacts. Hydrol. Earth Syst. Sci. 2015, 19, 1993–2016. [Google Scholar] [CrossRef]
- Talaee, P.H.; Tabari, H.; Ardakani, S.S. Hydrological drought in the west of Iran and possible association with large-scale atmospheric circulation patterns. Hydrol. Process. 2014, 28, 764–773. [Google Scholar] [CrossRef]
- Lorenzo-Lacruz, J.; Moran-Tejeda, E.; Vicente-Serrano, S.M.; Lopez-Moreno, J.I. Streamflow droughts in the Iberian Peninsula between 1945 and 2005: Spatial and temporal patterns. Hydrol. Earth Syst. Sci. 2013, 17, 119–134. [Google Scholar] [CrossRef]
- Modarres, R. Streamflow drought time series forecasting. Stoch. Environ. Res. Risk Assess. 2007, 21, 223–233. [Google Scholar] [CrossRef]
- Telesca, L.; Lovallo, M.; Lopez-Moreno, I.; Vicente-Serrano, S. Investigation of scaling properties in monthly streamflow and Standardized Streamflow Index (SSI) time series in the Ebro Basin (Spain). Phys. A Stat. Mech. Appl. 2012, 391, 1662–1678. [Google Scholar] [CrossRef]
- Thomas, T.; Jaiswal, R.K.; Nayak, P.C.; Ghosh, N.C. Comprehensive evaluation of the changing drought characteristics in Bundelkhand region of central India. Meteorol. Atmos. Phys. 2015, 127, 163–182. [Google Scholar] [CrossRef]
- Tao, H.; Borth, H.; Fraedrich, K.; Su, B.; Zhu, X. Drought and wetness variability in the Tarim River Basin and connection to large-scale atmospheric circulation. Int. J. Climatol. 2014, 34, 2678–2684. [Google Scholar] [CrossRef]
- Wang, H.J.; Chen, Y.N.; Pan, Y.P.; Li, W.H. Spatial and temporal variability of drought in the arid region of China and its relationships to teleconnection indices. J. Hydrol. 2015, 523, 283–296. [Google Scholar] [CrossRef]
- Wang, H.J.; Pan, Y.P.; Chen, Y.N. Comparison of three drought indices and their evolutionary characteristics in the arid region of northwestern China. Atmos. Sci. Lett. 2017, 18, 132–139. [Google Scholar] [CrossRef]
- Sen, P.K. Estimates of the regression coefficient based on Kendall’s Tau. J. Am. Stat. Assoc. 1968, 63, 1379–1389. [Google Scholar] [CrossRef]
- Budyko, M.I. Climate and Life; Academic Press: San Diego, CA, USA, 1974; p. 508. [Google Scholar]
- Choudhury, B.J. Evaluation of an empirical equation for annual evaporation using field observations and results from a biophysical model. J. Hydrol. 1999, 216, 99–110. [Google Scholar] [CrossRef]
- Yang, H.B.; Yang, D.W.; Lei, Z.D.; Sun, F.B. New analytical derivation of the mean annual water-energy balance equation. Water Resour. Res. 2008, 44. [Google Scholar] [CrossRef]
- Zhang, L.; Potter, N.; Hickel, K.; Zhang, Y.; Shao, Q. Water balance modeling over variable time scales based on the Budyko framework-model development and testing. J. Hydrol. 2008, 360, 117–131. [Google Scholar] [CrossRef]
- Yang, Z. Glacier Water Resources in China; Gansu Science and Technology Press: Lanzhou, China, 1991. [Google Scholar]
- Li, F.P.; Zhang, G.X.; Xu, Y.J. Separating the impacts of climate variation and human activities on runoff in the Songhua River Basin, northeast China. Water 2014, 6, 3320–3338. [Google Scholar] [CrossRef]
- Zhang, Q.; Zhang, J.; Sun, G.W.; Di, X.H. Research on water-vapor distribution in the air over Qilian Mountains. J. Meteorol. Res. 2008, 22, 107–118. [Google Scholar]
- Shi, Y.; Shen, Y.; Kang, E.; Li, D.; Ding, Y.; Zhang, G.; Hu, R. Recent and future climate change in northwest China. Clim. Chang. 2007, 80, 379–393. [Google Scholar] [CrossRef]
- Shen, Y.P.; Su, H.C.; Wang, G.Y.; Mao, W.Y.; Wang, S.D.; Han, P.; Wang, N.L.; Li, Z.Q. The responses of glaciers and snow cover to climate change in Xinjiang (i): Hydrological process. J. Glaciol. Geocryol. 2013, 35, 513–527. [Google Scholar]
- López-Moreno, J.I.; Vicente-Serrano, S.M.; Zabalza, J.; Beguería, S.; Lorenzo-Lacruz, J.; Azorin- Molina, C. Hydrological response to climate variability at different time scales: A study in the Ebro Basin. J. Hydrol. 2013, 477, 175–188. [Google Scholar] [CrossRef]
- Lorenzo-Lacruz, J.; Vicente-Serrano, S.M.; Gonzalez-Hidalgo, J.C.; Lopez-Moreno, J.I.; Cortesi, N. Hydrological drought response to meteorological drought in the Iberian Peninsula. Clim. Res. 2013, 58, 117–131. [Google Scholar] [CrossRef]
- Vicente-serrano, S.M.; López-Moreno, J.I. Hydrological response to different time scales of climatological drought: An evaluation of the standardized precipitation index in a mountainous Mediterranean Basin. Hydrol. Earth Syst. Sci. 2005, 9, 523–533. [Google Scholar] [CrossRef]
- Zhang, Y.; You, Q.; Lin, H.; Chen, C. Analysis of dry/wet conditions in the Gan River Basin, China, and their association with large-scale atmospheric circulation. Glob. Planet. Chang. 2015, 133, 309–317. [Google Scholar] [CrossRef]
- Xu, C.; Chen, Y.; Yang, Y.; Hao, X.; Shen, Y. Hydrology and water resources variation and its response to regional climate change in Xinjiang. J. Geogr. Sci. 2010, 20, 599–612. [Google Scholar] [CrossRef]
- Xu, Z.; Liu, Z.; Fu, G.; Chen, Y. Trends of major hydroclimatic variables in the Tarim River Basin during the past 50 years. J. Arid Environ. 2010, 74, 256–267. [Google Scholar] [CrossRef]
- Qiu, L.; Peng, D.; Xu, Z.; Liu, W. Identification of the impacts of climate changes and human activities on runoff in the upper and middle reaches of the Heihe River Basin, China. J. Water Clim. Chang. 2016, 7, 251–262. [Google Scholar] [CrossRef]
- Li, X.; Cheng, G.; Ge, Y.; Li, H.; Han, F.; Hu, X.; Tian, W.; Tian, Y.; Pan, X.; Nian, Y.; et al. Hydrological cycle in the Heihe River Basin and its implication for water resource management in endorheic basins. J. Geophys. Res.-Atmos. 2018, 123, 890–914. [Google Scholar] [CrossRef]
- Liu, X.; Shen, Y. Quantification of the impacts of climate change and human agricultural activities on oasis water requirements in an arid region: A case study of the Heihe River Basin, China. Earth Syst. Dyn. 2018, 9, 211–225. [Google Scholar] [CrossRef]
- Ma, F.; Luo, L.; Ye, A.; Duan, Q. Drought characteristics and propagation in the semiarid Heihe River Basin in northwestern China. J. Hydrometeorol. 2019, 20, 59–77. [Google Scholar] [CrossRef]
- Ye, M.; Xu, H.L.; Song, Y.D. The utilization of water resources and its variation tendency in Tarim River Basin. Chin. Sci. Bull. 2006, 51, 16–24. [Google Scholar] [CrossRef]
- Xue, L.; Yang, F.; Yang, C.; Chen, X.; Zhang, L.; Chi, Y.; Yang, G. Identification of potential impacts of climate change and anthropogenic activities on streamflow alterations in the Tarim River Basin, China. Sci. Rep. 2017, 7, 8254. [Google Scholar] [CrossRef]
- Yang, F.; Xue, L.; Wei, G.; Chi, Y.; Yang, G. Study on the dominant causes of streamflow alteration and effects of the current water diversion in the Tarim River Basin, China. Hydrol. Process. 2018, 32, 3391–3401. [Google Scholar] [CrossRef]
- Sun, M.; Li, Z.; Yao, X.; Jin, S. Rapid shrinkage and hydrological response of a typical continental glacier in the arid region of northwest China &Ndash; taking Urumqi Glacier No.1 as an example. Ecohydrology 2013, 6, 909–916. [Google Scholar]
- Duan, K. In Simulation and prediction of equilibrium line altitude of glaciers in the eastern Tibetan Plateau. In Proceedings of the EGU General Assembly Conference, Vienna, Austria, 23–28 April 2017. [Google Scholar]
- Chen, Z.; Chen, Y.; Li, B. Quantifying the effects of climate variability and human activities on;runoff for Kaidu River Basin in arid region of northwest China. Theor. Appl. Climatol. 2013, 111, 537–545. [Google Scholar] [CrossRef]
- Ye, B.S.; Ding, Y.J.; Jiao, K.Q.; Shen, Y.P.; Zhang, J. The response of river discharge to climate warming in cold region over China. Quat. Sci. 2012, 32, 103–110. [Google Scholar]
Figure 1.
Topography of the arid region of northwestern China and location of the gauge stations (streamflow stations are numbered according to Table 1).
Figure 1.
Topography of the arid region of northwestern China and location of the gauge stations (streamflow stations are numbered according to Table 1).

Figure 2.
Schematic drawing of drought duration and severity. D—drought duration; the area of the grey part is drought severity.
Figure 2.
Schematic drawing of drought duration and severity. D—drought duration; the area of the grey part is drought severity.

Figure 3.
Time series of Standardized Streamflow Index (SSI) and Standardized Precipitation-Evapotranspiration Index (SPEI) at 10-month scale for different rivers.
Figure 3.
Time series of Standardized Streamflow Index (SSI) and Standardized Precipitation-Evapotranspiration Index (SPEI) at 10-month scale for different rivers.

Figure 4.
Evolutions of hydrological drought severity for nine rivers in the arid region of northwestern China. The gray shadow is the 95% confidence interval corresponding to linear regression.
Figure 4.
Evolutions of hydrological drought severity for nine rivers in the arid region of northwestern China. The gray shadow is the 95% confidence interval corresponding to linear regression.

Figure 5.
Evolutions of hydrological drought duration for nine rivers in the arid region of northwestern China. The gray shadow is the 95% confidence interval corresponding to linear regression.
Figure 5.
Evolutions of hydrological drought duration for nine rivers in the arid region of northwestern China. The gray shadow is the 95% confidence interval corresponding to linear regression.

Figure 6.
Correlation coefficients between SSI and various time scales of the SPEI for different rivers (a: Irtysh River; b: Aibihu River; c: Kaidu River; d: Aksu River; e: Yarkand River; f: Hotan River; g: Shule River; h: Heihe River; i: Shiyang River). The time scale in which the maximum correlation is indicated in the red circle. The blue dotted line denotes the correlation coefficient at the 0.05 significance level.

Figure 7.
Evolutions of drought severity and duration for the Tarim River (Ale and Xinqm) and Heihe River (Zhengyx). The scatter is the drought severity and duration; the solid line is the linear regression; the gray shadow is the 95% confidence interval corresponding to linear regression.
Figure 7.
Evolutions of drought severity and duration for the Tarim River (Ale and Xinqm) and Heihe River (Zhengyx). The scatter is the drought severity and duration; the solid line is the linear regression; the gray shadow is the 95% confidence interval corresponding to linear regression.


Table 1.
Streamflow stations used in the study.
| No. | Station | River | Drainage Basin | Relative Position | Catchment Area (km2) | Lat. (°E) | Lon. (°N) | Gauging Elevation (m a.s.l.) | Time Period |
|---|---|---|---|---|---|---|---|---|---|
| 1 | Altai | Irtysh | Irtysh River drainage | Mountain pass | 5.70 × 10⁴ | 88.1 | 47.82 | 988 | 1960–2007 |
| 2 | Jiangjm | Aibihu | Juggar drainage | Mountain pass | 5.06 × 10⁴ | 84.72 | 44.08 | 1402 | 1960–2007 |
| 3 | Kaq | Yarkand | Tarim River drainage | Mountain pass | 9.89 × 10⁴ | 76.9 | 37.98 | 1370 | 1960–2010 |
| 4 | Xiehl | Aksu | Tarim River drainage | Mountain pass | 5.20 × 10⁴ | 79.62 | 41.57 | 1427 | 1960–2010 |
| 5 | Shaliglk | Aksu | Tarim River drainage | Mountain pass | 5.20 × 10⁴ | 78.6 | 40.95 | 1909 | 1960–2010 |
| 6 | Tongzlk | Hotan | Tarim River drainage | Mountain pass | 4.89 × 10⁴ | 79.92 | 36.82 | 1650 | 1960–2010 |
| 7 | Wulwt | Hotan | Tarim River drainage | Mountain pass | 4.89 × 10⁴ | 79.43 | 36.87 | 1800 | 1960–2010 |
| 8 | Ale | Tarim | Tarim River drainage | Upstream | 102 × 104 | 81.32 | 40.53 | 1098 | 1960–2007 |
| 9 | Xinqm | Tarim | Tarim River drainage | Upstream | 102 × 104 | 82.72 | 41.03 | 970 | 1960–2007 |
| 10 | Dask | Kaidu | Tarim River drainage | Mountain pass | 2.20 × 10⁴ | 85.73 | 42.22 | 1340 | 1960–2010 |
| 11 | Dangcw | Shule | Hexi drainage | Mountain pass | 4.13 × 10⁴ | 94.88 | 39.5 | 2192 | 1960–2009 |
| 12 | Changmb | Shule | Hexi drainage | Mountain pass | 4.13 × 10⁴ | 96.85 | 39.82 | 2096 | 1960–2009 |
| 13 | Yinglx | Heihe | Hexi drainage | Mountain pass | 14.3 × 10⁴ | 100.18 | 38.8 | 1674 | 1960–2009 |
| 14 | Zhengyx | Heihe | Hexi drainage | Midstream | 14.3 × 10⁴ | 99.47 | 39.8 | 1358 | 1960–2009 |
| 15 | Zams | Shiyang | Hexi drainage | Mountain pass | 4.16 × 10⁴ | 102.57 | 37.7 | 2042 | 1960–2009 |
| 16 | Shags | Shiyang | Hexi drainage | Mountain pass | 4.16 × 10⁴ | 101.95 | 38.02 | 2335 | 1960–2009 |
Table 2.
Number of months passing the Kolmogorov-Smirnov test by seven distributions for 10 rivers in the arid region of northwestern China.
Table 2.
Number of months passing the Kolmogorov-Smirnov test by seven distributions for 10 rivers in the arid region of northwestern China.
| River | Gamma | Gen. Log. | GEV | Log-Log. | Log-Norm. | LP3 | Weib. |
|---|---|---|---|---|---|---|---|
| Irtysh | 12 | 12 | 12 | 12 | 12 | 12 | 11 |
| Aibihu | 12 | 12 | 12 | 12 | 12 | 12 | 11 |
| Kaidu | 10 | 12 | 12 | 12 | 12 | 12 | 9 |
| Aksu | 8 | 12 | 12 | 12 | 9 | 11 | 6 |
| Yarkand | 12 | 12 | 12 | 12 | 12 | 12 | 11 |
| Hotan | 9 | 12 | 12 | 12 | 11 | 12 | 11 |
| Tarim (Ale) | 12 | 12 | 12 | 12 | 12 | 12 | 11 |
| Tarim (Xinqm) | 11 | 12 | 12 | 12 | 10 | 12 | 11 |
| Shiyang | 12 | 12 | 12 | 12 | 12 | 12 | 11 |
| Shule | 12 | 12 | 12 | 12 | 12 | 12 | 11 |
| Heihe (Yinglx) | 12 | 12 | 12 | 12 | 12 | 12 | 11 |
| Heihe (Zhengyx) | 11 | 12 | 12 | 11 | 9 | 11 | 11 |
Table 3.
K-S D mean of 12 months of each distribution for rivers in the arid region of northwestern China (the bold value is the best selected distribution to calculate SSI, with the minimum K-S D mean).
Table 3.
K-S D mean of 12 months of each distribution for rivers in the arid region of northwestern China (the bold value is the best selected distribution to calculate SSI, with the minimum K-S D mean).
| River | Gamma | Gen.Log. | GEV | Log-Log. | Log-Norm. | LP3 | Weib. |
|---|---|---|---|---|---|---|---|
| Irtysh | 0.1026 | 0.0784 | 0.0875 | 0.0795 | 0.0905 | 0.0945 | 0.1354 |
| Aibihu | 0.1032 | 0.0759 | 0.0800 | 0.0845 | 0.0955 | 0.0843 | 0.1403 |
| Kaidu | 0.1452 | 0.0861 | 0.0887 | 0.1043 | 0.1237 | 0.0959 | 0.1598 |
| Aksu | 0.1597 | 0.0832 | 0.0866 | 0.0969 | 0.1388 | 0.1223 | 0.1997 |
| Yarkand | 0.0967 | 0.0782 | 0.0789 | 0.0817 | 0.0919 | 0.0807 | 0.1165 |
| Hotan | 0.1566 | 0.0884 | 0.0930 | 0.1048 | 0.1430 | 0.1161 | 0.1779 |
| Tarim (Ale) | 0.1128 | 0.0943 | 0.0991 | 0.0976 | 0.1171 | 0.1020 | 0.1141 |
| Tarim (Xinqm) | 0.1280 | 0.0990 | 0.0994 | 0.1091 | 0.1315 | 0.1072 | 0.1276 |
| Shiyang | 0.0970 | 0.0801 | 0.0882 | 0.0825 | 0.0920 | 0.0949 | 0.1269 |
| Shule | 0.1081 | 0.0749 | 0.0769 | 0.0831 | 0.0980 | 0.0800 | 0.1426 |
| Heihe (Yinglx) | 0.1037 | 0.0748 | 0.0813 | 0.0805 | 0.0950 | 0.0882 | 0.1382 |
| Heihe (Zhengyx) | 0.1234 | 0.0947 | 0.0905 | 0.1072 | 0.1410 | 0.1143 | 0.1084 |
Table 4.
Trend magnitude and significance of hydrological drought severity and duration in different rivers. The bold trend indicates significant at 0.05 level.
Table 4.
Trend magnitude and significance of hydrological drought severity and duration in different rivers. The bold trend indicates significant at 0.05 level.
| Region | River | Severity | Duration | ||
|---|---|---|---|---|---|
| Trend | p | Trend | p | ||
| North Xinjiang | Irtysh | −0.0108 | 0.0222 | −0.0400 | 0.0472 |
| Aibuhu | −0.0313 | 0.2210 | −0.0270 | 0.2790 | |
| South Xinjiang | Kaidu | −0.0267 | 0.1032 | −0.0244 | 0.0855 |
| Aksu | −0.0686 | 0.0428 | −0.0476 | 0.0322 | |
| Yarkand | −0.0798 | 0.0002 | −0.0294 | 0.2577 | |
| Hotan | −0.0249 | 0.1001 | 0.0490 | 0.1954 | |
| Tarim (Ale) | 0.0719 | 0.0177 | 0.0476 | 0.0270 | |
| Tarim (Xinqm) | 0.0916 | 0.0100 | 0.0714 | 0.0017 | |
| Hexi Corridor | Shule | −0.1262 | 0.0000 | −0.1000 | 0.0000 |
| Heihe (Yinglx) | −0.0465 | 0.0017 | −0.0400 | 0.0008 | |
| Heihe (Zhengyx) | 0.0836 | 0.0126 | 0.0800 | 0.0002 | |
| Shiyang | −0.0315 | 0.1326 | −0.0102 | 0.0648 | |
Table 5.
Inter-decadal changes in hydrological drought severity and duration in different rivers.
| River | Severity | Duration | ||||||||
|---|---|---|---|---|---|---|---|---|---|---|
| 1960s | 1970s | 1980s | 1990s | 2000s | 1960s | 1970s | 1980s | 1990s | 2000s | |
| Irtysh | 3.93 | 4.15 | 5.19 | 1.18 | 1.65 | 3.00 | 2.80 | 3.60 | 1.10 | 1.33 |
| Aibuhu | 4.65 | 2.37 | 3.39 | 3.70 | 2.32 | 3.40 | 1.90 | 2.80 | 2.30 | 1.67 |
| Kaidu | 2.98 | 4.79 | 7.15 | 1.10 | 1.27 | 2.60 | 4.00 | 5.20 | 1.00 | 1.00 |
| Aksu | 4.36 | 3.08 | 5.51 | 1.12 | 0.89 | 3.10 | 2.30 | 4.20 | 0.90 | 0.75 |
| Yarkand | 6.08 | 5.20 | 3.61 | 1.33 | 0.65 | 3.10 | 2.10 | 4.20 | 1.50 | 1.13 |
| Hotan | 7.33 | 2.18 | 3.58 | 3.10 | 0.44 | 4.90 | 1.90 | 2.90 | 2.70 | 0.38 |
| Tarim (Ale) | 2.15 | 3.35 | 3.33 | 4.85 | 4.95 | 1.80 | 2.40 | 2.70 | 3.80 | 3.75 |
| Tarim (Xinqm) | 1.12 | 1.35 | 2.68 | 6.40 | 7.40 | 0.90 | 1.20 | 2.20 | 5.10 | 5.25 |
| Shule | 7.10 | 4.68 | 1.61 | 1.63 | 0.15 | 5.60 | 3.50 | 1.30 | 1.20 | 0.13 |
| Heihe (Yinglx) | 6.38 | 4.60 | 1.27 | 2.49 | 2.04 | 4.30 | 3.30 | 1.10 | 2.10 | 1.38 |
| Heihe (Zhengyx) | 1.44 | 2.12 | 1.82 | 7.48 | 5.37 | 1.10 | 1.80 | 1.70 | 6.00 | 3.75 |
| Shiyang | 3.51 | 4.30 | 3.90 | 3.91 | 1.33 | 2.70 | 3.20 | 2.70 | 2.90 | 0.88 |
Table 6.
Fraction of river runoff supply of nine rivers in the arid region of China.
| Region | River | Precipitation (%) | Glacier Melt Water (%) | Groundwater (%) |
|---|---|---|---|---|
| North Xinjiang | Irtysh River | 71 | 1.0 | 28 |
| Aibuhu | 65.6 | 24.4 | 10 | |
| South Xinjiang | Kaidu River | 44 | 15.2 | 40.8 |
| Aksu River | 45.1 | 24.7 | 30.2 | |
| Yarkand River | 26.4 | 53 | 20.6 | |
| Hotan River | 35.75 | 52.5 | 11.75 | |
| Hexi Corridor | Shule River | 34.8 | 32.8 | 32.4 |
| Heihe River | 73 | 5.2 | 21.8 | |
| Shiyang River | 53.5 | 5.65 | 30.85 |
Table 7.
Relative impacts of climate change and human activity on streamflow, period 1960–1989 and 1960–1969 are the natural period for Heihe and Tarim River, respectively. = the total streamflow change; = the streamflow change attribute to climate change; = the streamflow change attribute to human activity; = relative climate change impact; = relative human activity impact.
| River | Time Period | Runoff Depth (mm) | (mm) | (mm) | (%) | (mm) | (%) |
|---|---|---|---|---|---|---|---|
| Heihe | 1960–1989 | 30.10 | - | - | - | - | - |
| 1990–1999 | 21.72 | −8.38 | 2.47 | −29.49 | −10.85 | 129.49 | |
| 2000–2009 | 27.91 | −2.19 | 4.21 | −192.36 | −6.40 | 292.36 | |
| Tarim | 1960–1969 | 34.94 | - | - | - | - | - |
| 1970–1979 | 30.23 | −4.71 | −2.13 | 45.22 | −2.58 | 54.78 | |
| 1980–1989 | 30.44 | −4.50 | 2.49 | −55.33 | −6.99 | 155.33 | |
| 1990–1999 | 28.94 | −6.00 | 11.95 | −199.17 | −17.95 | 299.17 | |
| 2000–2009 | 27.16 | −7.78 | 9.22 | −118.51 | −17.00 | 218.51 |
© 2019 by the authors. Licensee MDPI, Basel, Switzerland. This article is an open access article distributed under the terms and conditions of the Creative Commons Attribution (CC BY) license (http://creativecommons.org/licenses/by/4.0/).
Share and Cite
MDPI and ACS Style
Wang, H.; Chen, Z.; Chen, Y.; Pan, Y.; Feng, R. Identification of the Space-Time Variability of Hydrological Drought in the Arid Region of Northwestern China. Water 2019, 11, 1051. https://doi.org/10.3390/w11051051
AMA Style
Wang H, Chen Z, Chen Y, Pan Y, Feng R. Identification of the Space-Time Variability of Hydrological Drought in the Arid Region of Northwestern China. Water. 2019; 11(5):1051. https://doi.org/10.3390/w11051051
Chicago/Turabian StyleWang, Huaijun, Zhongsheng Chen, Yaning Chen, Yingping Pan, and Ru Feng. 2019. "Identification of the Space-Time Variability of Hydrological Drought in the Arid Region of Northwestern China" Water 11, no. 5: 1051. https://doi.org/10.3390/w11051051
Note that from the first issue of 2016, this journal uses article numbers instead of page numbers. See further details here.