Analysis of Water Losses and Assessment of Initiatives Aimed at Their Reduction in Selected Water Supply Systems

Institute of Environmental Engineering, Faculty of Infrastructure and Environment, Czestochowa University of Technology, Brzeźnicka 60a, 42-201 Częstochowa, Poland
*
Author to whom correspondence should be addressed.
Water 2019, 11(5), 1037; https://doi.org/10.3390/w11051037
Submission received: 10 April 2019
/
Revised: 10 May 2019
/
Accepted: 14 May 2019
/
Published: 17 May 2019
(This article belongs to the Section Water Resources Management, Policy and Governance)
Abstract
:This paper presents the analysis and assessment of water losses in water distribution systems of three water supply companies operating water supply networks in the area of effect of underground mining. The analysis of water losses was conducted based on numerous indices allowing for obtaining objective information on the condition of the water supply system. The method of the analysis of percentage water loss index was extended by the methods of determination of losses according to the International Water Association. The results of the analysis lead to the conclusion that with regular actions, the companies have reduced water losses in recent years to a level considered to be good compared to national data and average compared to international standards. The value of the failure intensity index for all companies in 2011 was over 1.0 while currently it is about 0.5. The decrease in Non-Revenue Water basic loss index (NRWB) from more than 20% for all analysed companies in 2008 to a few percent in 2017 and the decrease in Infrastructure Leakage Index (ILI) for companies A and C to less than 2.0 are evidence of the good condition of the network. This is also confirmed by the unit water loss index per capita, with its value in 2017 being 9.1 dm3/(inhabitant day) for company A, 11 dm3/(inhabitant·day) for B and 7.4 dm3/(inhabitant·day) for C. The several years of analysis and evaluation of numerous indices of water loss presented in the paper reveals the effectiveness of the adopted strategies of reducing leakages in the distribution system. It should be emphasized that the analysed companies have been involved in comprehensive initiatives aimed at reducing water leakages, resulting in a substantial reduction in water losses. GIS monitoring systems and databases are particularly helpful in reducing water losses. The basis of the activities is monitoring of flow and pressure in water supply networks and active leakage control. Network zoning with simultaneous observation of minimum night-time flows allows for preliminary location of the failure. Equipping companies with special leakage detection devices such as geophones, stethophones or correlators enables quick detection of leakages. The next step is to replace water meters with more and more accurate ones and to implement radio reading of water meters. All analysed companies perform systematic replacement of old steel and cast iron pipes which cause a large number of leakages that are often difficult to identify, thus leading to water losses.
1. Introduction
Water losses and the associated financial losses represent a serious problem for water supply companies all over the world. The amount of water lost from distribution systems is huge in the world and is estimated at 48 billion m3 per year [1]. High levels of water losses result from poor management and poor condition of distribution systems [2]. The increase in water losses forces water supply companies to implement systems for control and evaluation of water losses, make organizational changes and to develop and implement modernization programmes in order to improve the technical condition of water supply networks. In every company, a reliable analysis of water losses should precede decisions concerning the repair or modernization of the water supply system [3,4,5,6,7]. Due to the optimization of water production costs, rational reduction of water losses must be a priority task for water supply companies. By reducing the losses, plants can reduce the costs of the current network exploitation and save on the investment costs. Plants operating water distribution systems in Poland and in other countries must implement and apply modern standards for water loss management.
This is why numerous countries, including Austria, Germany, Switzerland, Great Britain, Denmark and Spain, have been developing and implemented special programmes to thoroughly analyse the technical, economical and reliability indices of water supply systems [4,7,8,9,10].
Studies have shown that the amount of water losses is influenced by factors dependent on water supply companies and independent of them. An analysis of the operation of water supply systems, including numerous systems located in 68 countries, shows that many factors are beyond the influence of water supply companies. Density of connections, age of the network, length and layout of the water supply network are important factors affecting the level of losses, although they are independent of the companies. They mainly result from urbanisation and settlement patterns. The type of distribution network (pumping or gravity) and the associated leakages and energy costs are mainly due to the geographical location [11,12]. On the other hand, the factor influencing the level of losses and depending on the companies is the time of detection and removal of the leakage. Since the problem of quick detection and removal of leakages is very important, it has been emphasized in numerous studies [10,13,14,15,16]. For water supply companies, the immediate removal of leakages is cost-effective and provides measurable economic and ecological benefits. The reduction of leakages helps protect the limited water resources, minimize production of water treatment products and energy consumption and other costs resulting from leakages, such as subsidence of buildings or road collapses, and even costs incurred due to traffic jams caused by the elimination of the effects of water supply failures [17].
The water supply systems are substantial energy consumers. Energy is used at each stage of water production and supply chain, i.e., at the stage of pumping the water to the water treatment plant, in the process of water treatment, and during the distribution using the water supply network [18]. Hotloś estimated that removal of the leakage of each cubic metre of water translates into saving of ca. 1.0–1.5 kWh of energy needed to produce and transport water in the distribution system [9].
It is estimated that the energy used for water distribution purposes accounts for about 7% of global energy consumption [19]. There is a close relationship of the pressure level in the network with water losses and energy consumption. Numerous studies have presented the research addressing this problem and proposals for methods of improving energy efficiency of water supply systems. In their study, Perrone et al. [20] found that water and energy resources are correlated but their effect on each other has been rarely studied. These researchers demonstrated that reducing water demand by 20% leads to a reduction of the required energy consumption by the same percentage.
In a study by Feldman [18], the author argued that reduction of water losses in the water supply system by 30% can lead to a similar increase in energy efficiency. In his paper, Sarbu presented in detail four strategies aimed to improve energy efficiency of water pumping i.e., control systems to adjust pump speed drive to water demand, partition of the town into several distinct pressure zones with pumped water storage tanks located in each zone, elevated storage tanks floating on the system, and direct water pumping through intermediary pump stations integrated in the network [21].
The results of the investigations conducted by Feldman indicate that the energy efficiency may be achieved by improving the system and pump station design, installation of Variable Speed Drives (VSD) to pumps, and operating pumps efficiently. The leakage reduction may lead to the achievement of the significant savings in power consumption. Feldman argues that the most effective tool in loss reduction is pressure modulation, especially by adjusting night pressure levels to the lower demand, resulting in both reduced night pressure and fewer leakages [18].
Nazif et al. asserted that pressure management is an effective technique for leakage reduction. These authors emphasized the relationship between leakage and pressure. They described the procedure for controlling the hydraulic pressure in the water distribution system by maintaining the water levels in the storage tanks to adjust to the variations in the water demand. To minimize the leakage level, the authors used an optimization model to evaluate the optimal hourly water level variations in the storage tank to reduce the pressure in water supply system with regards to the required water amount, water level in reservoir, and the elevation of observed points in the water supply network [22].
Research on water supply systems in two cities in the Upper Silesia region of Poland presented in the paper [23] indicated that stabilization of the pressure in the network reduced water losses and generated economic profits due to the lower energy consumption in the pumping station. The research found that the index of consumption of the energy needed for pumping of 1 m3 of water into the distribution system was reduced by 12% over the period of one year. In the study of Duda and Human [24], the authors indicated that water pumps were the main element responsible for the electricity consumption in the water treatment plant “Karolin” in Olsztyn. The conducted energy consumption analysis revealed the opportunities for saving electricity by optimization of the schedule of water intake operation. The simulation of the water intake operation also showed the possibility to reduce electricity consumption by about 12%. The study of Andraka and Cherednik [25] presented the technical solutions applied as part of the modernization of the water supply network of the city of Żodino. The systems of automatic management of water intake and supply facilities introduced by the Water and Sewage Company allowed for a significant reduction in the energy consumption of water pumping. Other studies have also demonstrated the effect of improving the pumping system, automation of the control system and the network monitoring system supported by IT systems on the reduction of water losses and energy savings [19,26,27].
In the case of the companies analysed in the study, the failure rate and the associated water losses were substantially affected by underground mining. Maintaining the reliability of water distribution systems in these areas is often much more difficult compared to systems outside the effect of mining industry. With the impact of mining activity on water supply pipes, the values of pipe reliability indices are generally much higher than the values of these indices outside mining areas. It is estimated that about 30% or even 50% of failures of water supply networks may result from mining activity. The causes of failures and the associated increase in water losses in mining areas include tectonic movements causing mining subsidence, formation of ditches, crevices, bumps, stray currents that occur in the areas of cities and industrial plants, excessive traffic load on heavy vehicles, etc. They cause unsealing of connections, cracks and crushing of wires, damage to utilities, etc. [28,29,30].
Taking into account Polish conditions, mining damages are noticeable in the areas of Upper Silesia, where hard coal mines are located. The analysis of data on distribution system failures indicates a direct relationship between the operation and the failure rate in water distribution systems, but the scale of the problem has not been sufficiently evaluated so far. It is difficult to clearly identify the causes and origin of some failures, e.g., in the case of corroded steel pipelines.
The aim of the study is to analyse and evaluate the amount of water losses in three water supply systems exposed to the effect of mining activities in Upper Silesia, compare water loss indices in these systems to Polish and international standards, indicate and evaluate companies’ activities for the rapid detection and removal of failures and other activities leading to the reduction of water losses.
The percentage loss index and unit indices related to the length of the network and a number of inhabitants were computed to determine water loss. A unified international methodology recommended by the International Water Association (IWA) was also used [31].
According to IWA’s balance sheet, the amount of water pumped into the distribution system is divided into authorised consumption and water losses. Furthermore, authorised consumption consists of invoiced authorised consumption, i.e., the amount of water sold by the company and non-invoiced authorised consumption, i.e., the amount of water used by the company for its own consumption. The amount of water used for internal purposes is generally difficult to quantify and is therefore often roughly estimated. This is the water used mainly for the technological needs of the water supply system and often also for the sewage system (flushing of tanks, water pipes or channels). The values of water consumed for internal purposes are frequently overestimated in order to underestimate the actual water losses [31].
Water losses are divided into real and apparent losses. Real losses are caused by leakages of water from the networks and systems, fittings, overflow from compensation tanks and theft of water. The causes for apparent losses include inaccuracy and inconsistency of measurement of water supply and consumption. Contrary to real losses, apparent losses do not constitute actual losses, but only affect the numerical result of the balance of the volume of water supplied to the network and that sold to consumers. Since they do not represent real water losses, they are difficult to identify and determine accurately. In practice, a specific amount of water is supplied to consumers, but is not measured due to the metrological properties of the water meters (flows below the starting flow rate) [9,31]. According to Siwoń et al. [32] apparent losses may amount to ca. 5% depending on the installation and measurement conditions. It is also important to ensure the simultaneous measurement of water supply and intake. Simultaneous measurement affects the accuracy of water balance and thus the reliable determination of apparent losses.
The water balance and water loss indices recommended by IWA represent an efficient tool for water loss analysis and evaluation. The analysis of losses should be the basis for taking modernization and repair measures, thus reducing the costs connected with production and distribution of water. The International Water Association (IWA) proposes four methods of performing such activities [33]: active leakage control, speed and quality of repairs, pressure management, and pipe materials management in order to limit the extent of water losses.
Methods recommended by IWA are becoming more and more popular in many countries, including Poland. Many authors of scientific papers have emphasized their usefulness [31,34,35,36]. The organization has a great deal of merit in terms of development and implementation of water loss reduction.
In addition to their geographical location, all the companies share common characteristics which may influence the value of water losses and allow for their comparison. All water supply companies purchase water from the Upper Silesian Water Supply Company at the same price and distribute it to customers using their own distribution networks. The analysed companies only distribute the purchased water but do not operate water intakes and treatment plants. The area on which all the companies operated is exposed to substantial effect of mining activities. Numerous hard coal mines operate within the area of their networks. The companies use old networks made of conventional materials such as cast iron or steel and a fairly large percentage of networks built in the last 30 years, mainly from PE. In all companies, until 2008, the percentage of water losses was within the range of 25 to 30% and the failure rate of the distribution network was over 1.00.
The results and assessment presented in this paper are based on data obtained from the companies and literature analysis. To protect the data of the water supply companies analysed in the study, the names of the companies were replaced with company A, company B and company C.
2. Materials and Methods
The analysis covered the data from the period of 2013–2017, obtained from the Water Supply and Sewerage Companies, which include: water supplied to the network, used for social welfare purposes, non-production and production purposes, network length, quantity and length of water supply connections, material and age structure of the network, the number of recipients, average pressure in the tested network, and number of failures in individual years.
These data were used to calculate failure intensity index (λ), percentage ratio of water loss (WS) and unit water loss per capita (Qlos), index hydraulic load of the network qo, and indices recommended by the International Water Association (IWA) [31]:
- Real Leakage Balance (RLB)
- Non-Revenue Water Basic (NRWB)
- Unavoidable Annual Real Losses (UARL)
- Infrastructure Leakage Index (ILI)
The failure intensity indices λ in total for distribution pipes and water mains in the companies studied were calculated from Equation (1),
where λ is the failure intensity index (failure/(km·year)), N is several failures per year, L is a total length of distribution pipes and water mains (km), and t is a time in which a given number of failures occurring was equal to 1 year.
Water loss indices, widely described in the literature [9,31,36] and characterized in detail in the further part of the study, were calculated from Equations (2)–(10).
CARL (Current Annual Real Losses—water loss in the distribution system (m3/year)
where SIV (System Input Volume) is the water supplied to the network (m3/year), UAC (Unbilled Authorised Consumption) is the water used for own needs of the company (m3/year), and BAC (Billed Authorised Consumption) is the water sold (m3/year).
WS—Percentage water loss index (%)
where CARL is the water loss in the distribution system (m3/year), and SIV is the water supplied to the network (m3/year).
RLB2—Unique real leakage balance index (dm³/(connection·day)) (where the connection density is greater than 20 per km of the grid)
where Nc is the number of service connections (pcs).
NRWB—Non-Revenue Water basic index (%)
where BAC is the water sold (m3/year).
UARL—Unavoidable Annual Real Losses (m³/year)
where Lm is the length of mains (km), Lp is length of private service pipes from property boundary to the meter (km), p is average pressure in the tested network (m H2O), 0.365 is conversion factor per year and m3.
ILI—Infrastructure Leakage Index (-)
Qlos—unit loss per capita (dm3/(inhabitant·day))
where IN is the number of inhabitants using the water supply system.
qs—unit coefficient of water loss per km of the network (m3/(km·h))
where CARL is the water loss in the distribution system (m3/h).
qo—hydraulic load index for the network (m³/(km·day))
where SIV is the water supplied to the network (m3/year).
3. Results and Discussion
3.1. General Characterization of Water Supply Networks in the Analysed Companies
Table 1 presents the length of the water supply network and the number of water supply connections operated by the analysed companies in 2013–2017. These data and pressure values are necessary for calculation of water loss indices recommended by IWA and presented in the further part of this study.
Analysis of the data contained in Table 1 leads to the conclusion that Company B operates the longest water supply network with the length (including water supply connections) of 463.8 km. Company C uses the shortest length of water pipes of the three companies analysed, i.e., 359.1 km. The largest number of water supply connections is used by company B, but the number of connections per kilometre of the distribution network in all companies is similar and amounts to approx. 30.
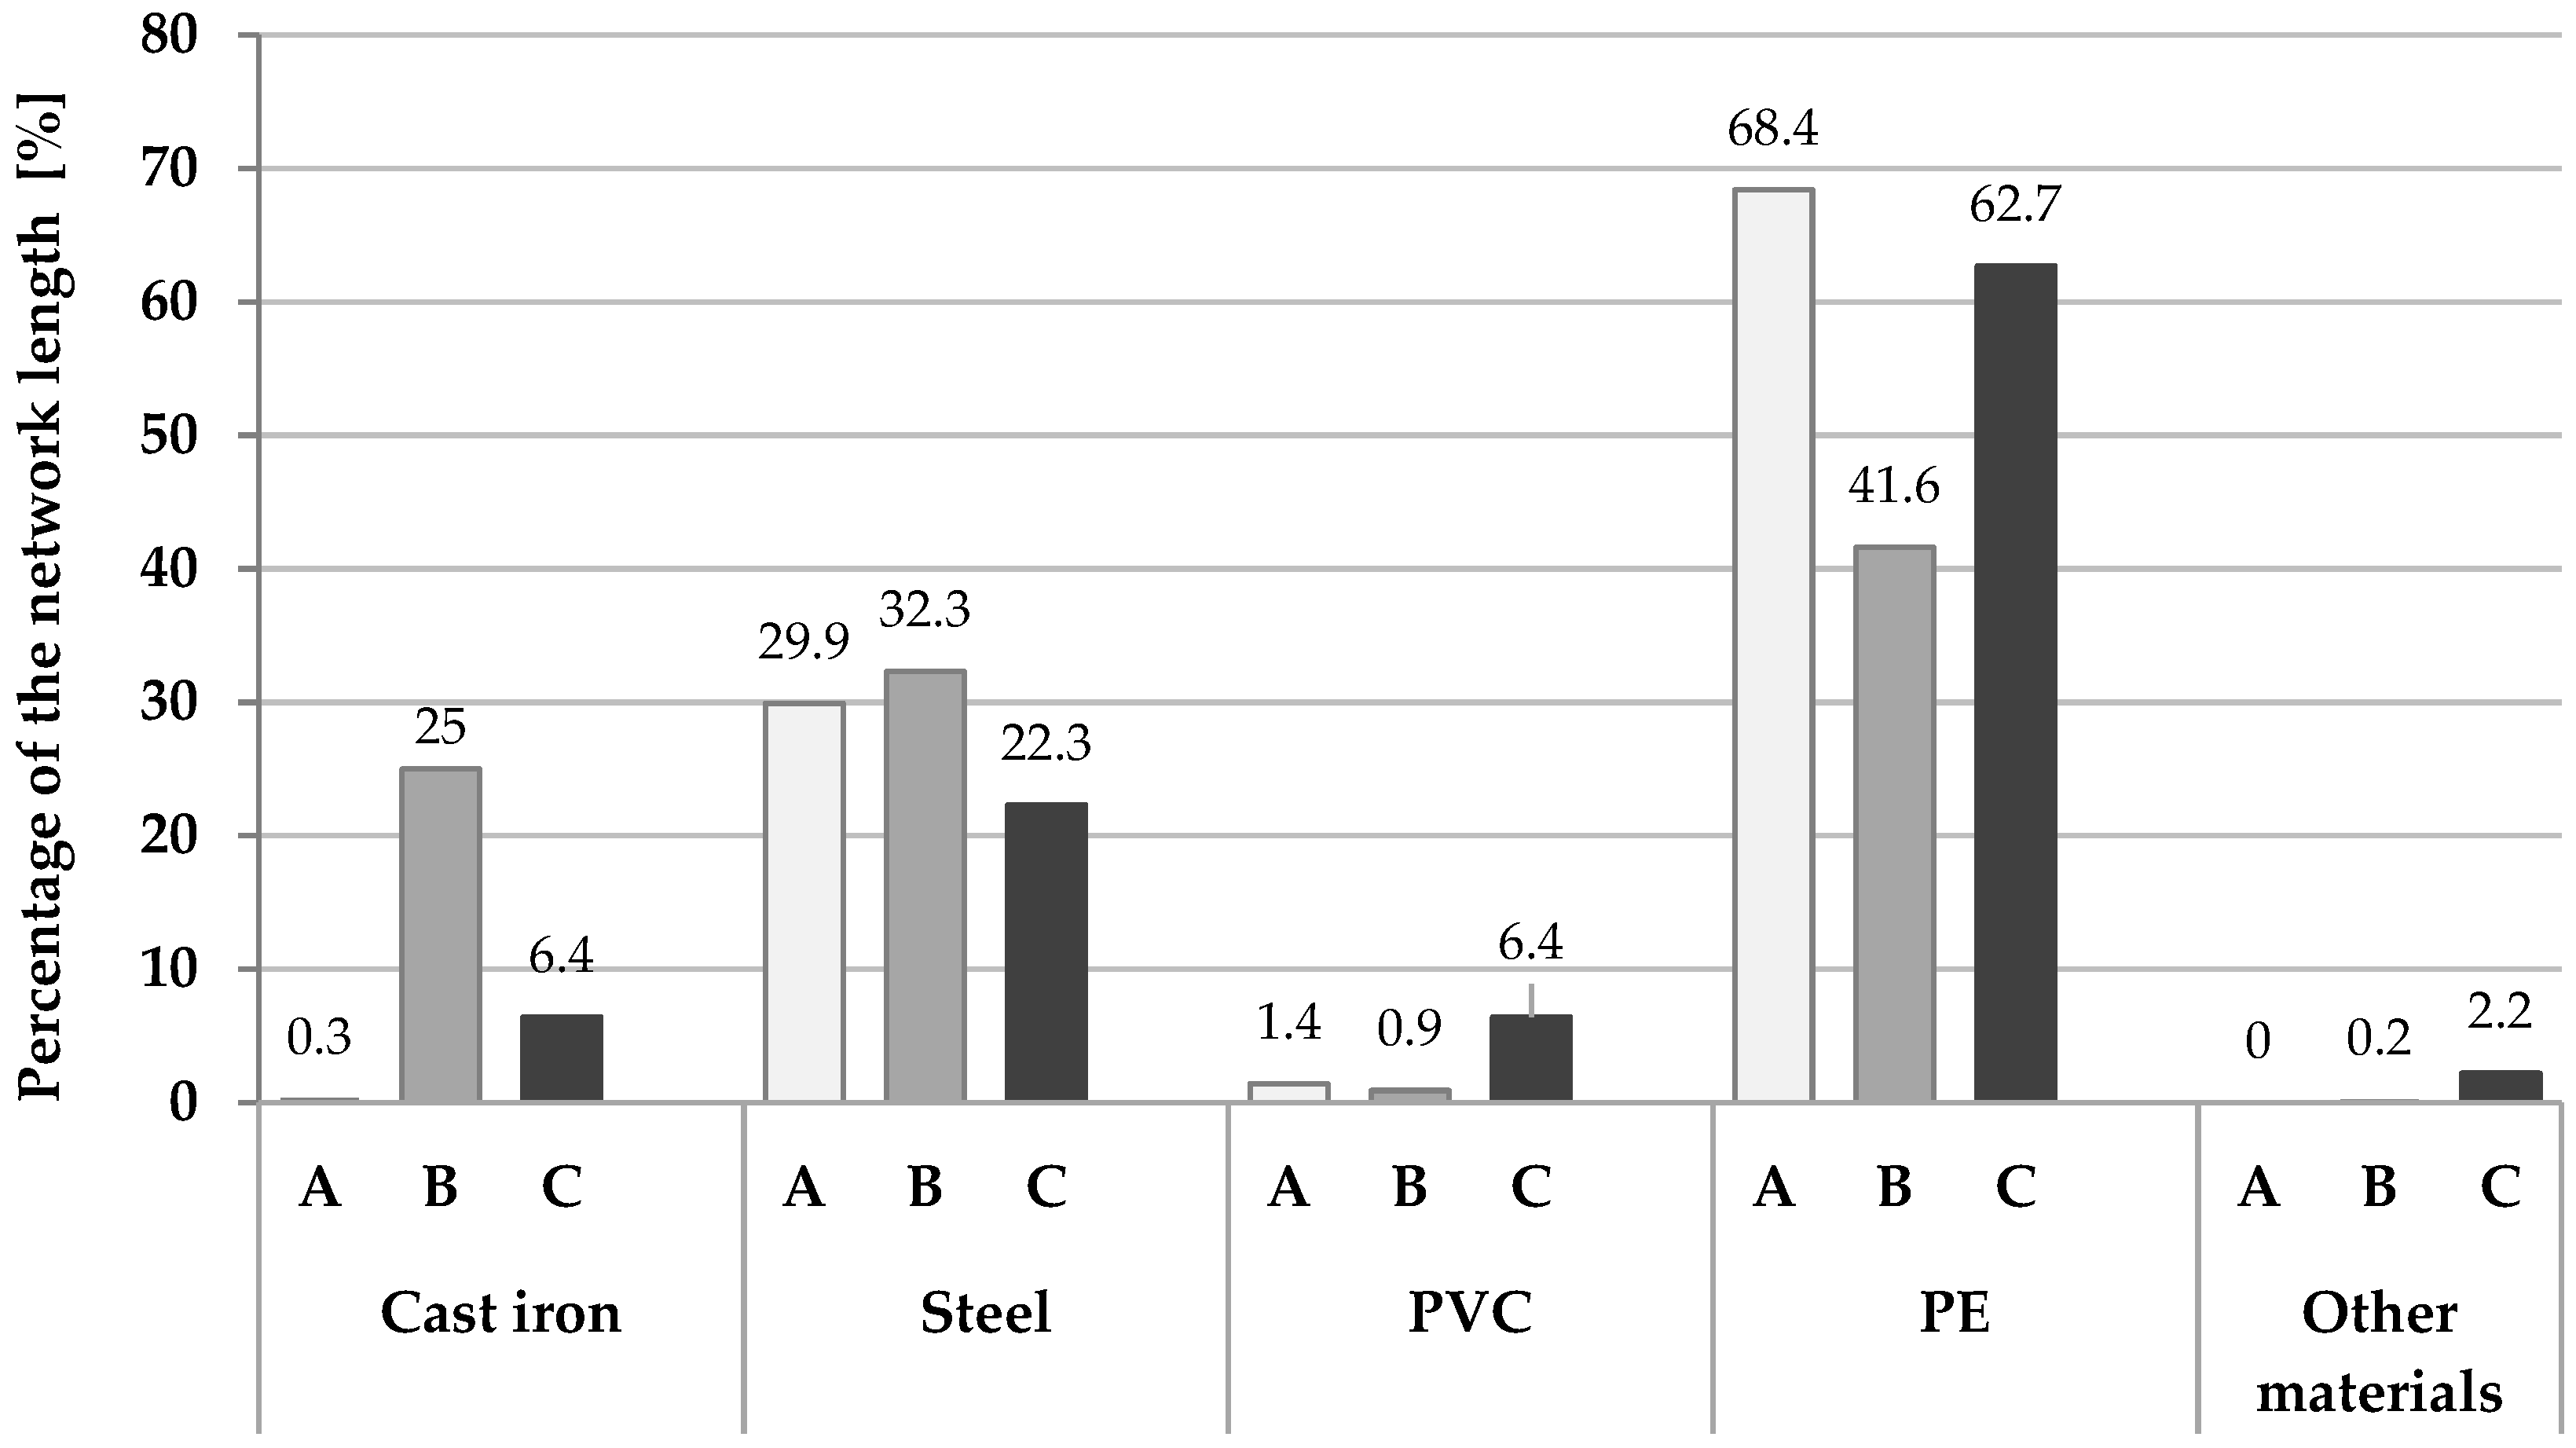
Analysis of the material structure of the networks of individual companies (Figure 1) shows that the main material of the water supply networks of companies A and C is PE, accounting for over 62%. Company B uses a high percentage of networks made of cast iron (25%) and steel (32.3%).
The material structure is closely related to the age of the water supply systems used. The variety of materials used for the construction of water supply networks in Poland resulted primarily from their availability in the market, which was related to the period of construction of water supply systems. Company A uses very few old networks built before 1980. Half of them (50%) are pipes aged from 20 to 30 years, ca. 45%—from 10 to 20 years, and the percentage of those older than 30 years is 5% of the length of the network. In company B; however, ca. 50% of the total network is over 50 years old, while 15% of the network is between 30 and 50 years old. The company operates around 35% of the networks built in the last 30 years. Furthermore, company C uses approximately 20% of the networks over 50 years old, approximately 20% of the networks built 30 to 50 years ago and approximately 60% of the networks built in the last 30 years. It should be emphasized that the attempts are made in the analysed companies to minimize the percentage of cast iron and steel pipes in favour of plastics, especially PE.
3.2. Water Balance in the Companies Studied in 2013–2017
The following measurements are the basis for determination of water losses:
- the volume of water pumped into the system—System Input Volume (SIV)
- volume of water used for the own needs of the water supply company—Unbilled Authorised Consumption (UAC)
- volume of water sold to all consumers—Billed Authorised Consumption (BAC).
3.3. Pipe Failure Rate
One of the most important indices for assessing the technical condition of a water supply system is failure intensity index for the pipelines (λ). The frequency of failures is primarily related to the age of the pipes, the material and, in the case of the companies studied, also to numerous factors related to mining activity. The mean failure rate for distribution pipes and water mains in the companies studied was computed according to Equation (1) and is presented in Table 3.
When analysing the level of the failure intensity index in subsequent years, a noticeable downward trend for this index was found for company C, from 1.95 in 2013 to 0.55 failures/(km·year) in 2017, which should be considered a satisfactory state. Furthermore, for companies A and B, this index is currently at 0.52 for company A and 0.50 failures/(km·year) for company B. It should be emphasized that according to the recommendations of PN-EN 60300-3-4:2008 standard, the failure intensity for water mains should not exceed 0.3 failure/(km·year), whereas for distribution lines it amounts to 0.5 failure/(km·year).
However, in view of the fact that the networks analysed are located in the area of mining damages, companies A and C use ca. 30% of cast iron and steel pipes and company B uses more than 50% of pipes made of these materials and taking into account the age of water pipes, the value of the failure intensity index should be considered acceptable. According to the literature analysis, failure rates for different water supply networks may differ significantly, because, as already mentioned, they depend on many factors [36]. The investigations of 72 water supply systems indicate that the failures of these systems depend on the location and the kind of material used to build the specified water supply network [37]:
- cast iron pipes: mean: 0.76 failures/(km·year); in the Upper Silesia: 0.82 failures/(km·year),
- steel pipes: mean: 0.71 failures/(km·year); in the Upper Silesia: 2.58 failures/(km·year),
- PE pipes: mean: 0.39 failures/(km·year); in the Upper Silesia: 0.77 failures/(km·year),
- PVC pipes: mean: 0.14 failures/(km·year); in the Upper Silesia: 0.43 failures/(km·year).
The study demonstrated that the mean failure intensity in the water supply system located in areas of mining activity is even twice as high compared to networks outside these areas [38,39]. However, it should be emphasized that failures of water supply networks do not always have a significant impact on the amounts of water losses. This is indicated by research of Rak and Sypień [40] and research of Rak and Misztal [41] for the water supply networks of Polish cities: Jasło and Jarosław.
3.4. Water Loss Indices
Table 4 presents water loss indices for the analysed companies in 2013–2017 calculated from the Equations (2)–(10).
Analysis of the percentage water loss indices (Table 4) reveals that all companies in the analysed 5 years achieved a good and fairly stable result of several percent. Companies A and C had reduced their losses by around 3.0% in 2013–2017, while losses in company B in this period were at a similar level. The analysis of the percentage water loss indices shows the lowest levels of leakages in the Netherlands (3–7%), while in most developed countries, these figures are higher: 15% in the USA, 13.8% in Canada, 42% in Italy, and 34.9% in Greece [2]. However, it should be emphasized that the comparison and evaluation of loss levels by means of percentage water loss index alone is insufficient or even erroneous due to differences in terms of length, material, age, number and length of connections as well as pressure and hydraulic load in water supply networks. Furthermore, the value of the index is affected by the volume of water used for own needs of the water supply plant, which is provided by the plants as an estimate. For these reasons, it is not recommended to use it to compare water losses in different distribution systems. It can only be used to assess the variability of water losses over many years in the same distribution system [42]. For a more reliable assessment of water losses, several other loss indices were computed as recommended by IWA. One of them is the Non-Revenue Water basic index (NRWB) calculated from Equation (5). This index for the system is higher than the percentage water loss index because its value does not take into account the volume of water consumed for the own needs of a water supply system (UAC). The use of this index in comparative analyses allows for avoiding errors resulting from the deliberate overstating of the volume of water used for own needs by certain plants. Analysis of the values of the NRWB index presented in Table 4 and the data obtained from the companies studied from previous years reveals that this index decreased significantly in the last 10 years in all companies. For company A, the NRWB index was 21% between 2008 and 2009 and decreased steadily in the following years, reaching a level of 8.0% in 2017. In company B, the NRWB index was 28% in 2008, 22% in 2010, and 11.6% in 2017. A significant decrease in the NRWB index was also found for company C. In 2008, it accounted for 24%, in 2009 it was 17% and in 2017, this level was 6.7%. The next index recommended by IWA to compare the condition of water distribution systems is the unique real leakage balance index RLB2, which measures water losses per day per water supply connection. In companies A and C, it has declined significantly in recent years, reaching 130 and 148 dm³/(connection·day), respectively, in 2017. Compared to Polish systems, this confirms that the losses remain at an average level. The RLB2 index in Poland in 2015 was approximately ca. 150–200 dm³/(connection·day). For company B, this ratio was much higher compared to A and B and in 2017, it accounted for ca. 206 dm³/(connection·day). This index is often very varied, and extensive research presented in Water Use and Loss Report indicates its value in New Zealand ranging from 100 to 290 dm³/(connection·day) [43].
In Western European countries, the permissible daily water losses per water supply connection are assumed to be 100 m³/(connection·day). In view of the above, the comparison of the RLB2 indices of all the companies studied to Western standards is unfavourable [36,40,44]. It should be stressed that if the water loss index per connection was lowered and reached the recommended 100 dm³/(connection·day) the annual water purchased by company A could be reduced by ca. 105,000 m3, by company B—by ca. 387,000 m3 and by company C by approximately 127,000 m3. Furthermore, the good condition of the network of all analysed companies is demonstrated by unit water loss index per capita, with its value reaching 9.1 dm3/(inhabitant·day) in 2017 for company A, 11 dm3/(inhabitant·day) for company B and 7.4 dm3/(inhabitant·day) for company C. In the 334 Polish group water supply systems analysed by Bergel, this index ranged from 24.0 to 39.9 dm3/(inhabitant·day) on average, while the analysis of Hotloś for 10 municipal waterworks indicates an average range of this index from 16 to 35 dm3/(inhabitant·day) [9,36].
Another analysed index was unit water loss index per kilometre of water supply system qs. For companies A and B it ranged from 0.14 and 0.21 m3/(h·km) in the analysed years. This means that according to German data, this index was within the standard range. In company C in 2013–2015, its range was 0.29–0.22 m3/(h·km), while in the last two years, it has decreased significantly to 0.17–0.15 m3/(h·km).
Comparison of different water distribution systems can be made based on the Infrastructure Leakage Index (ILI), calculated from Equation (7). The ILI index represents the multiplication factor for actual water losses in relation to the minimum level that can be achieved in a properly operated water supply system. To calculate ILI, the Unavoidable Annual Real Losses (UARL) has to be determined in advance. The ILI index makes it possible to classify the water supply system in terms of its technical condition. It allows for an individual assessment of whether in certain operating conditions and at a given cost of lost water, the losses are at an acceptable or excessive level.
The index is currently the most effective parameter used for the evaluation of water distribution efficiency, but it has some limitations. It is recommended to use it when the number of connections is greater than 5000 and their density exceeds 20 per km of water supply network and when the pressure in the network is at least 0.25 MPa [45].
Table 5 shows the criteria for evaluation the ILI according to IWA, WBI Banding System and AWWA (American Water Association).
The ILI index for the networks in companies A and C in the analysed years decreased significantly and reached 1.8 and 1.9, respectively, in 2017. According to the rigorous IWA criteria, this means the good condition of the network (Figure 2). The values of this index in 2013 for companies A and C pointed to a weak condition of the network (according to IWA criteria). In company B, there was no significant decrease in the value of ILI over the analysed 5 years, and the value of the index ranged from 2.7 in 2014 to 2.0 in 2016, but in 2017, it increased to 2.4, which reflects the average condition of the network on a national and international scale.
The data on ILI presented by Lambert and McKenzie for 44 water supply systems, including 5 systems from New Zealand, 17 from Australia and 22 from Europe, indicated a very wide range of values of this index from values below 1.0 for two systems to above 5.0 for eleven of the analysed systems [44]. Studies presented in [43] for 16 distribution systems from different European countries (Austria, Belgium, Bulgaria, Denmark, England, France, Germany, Italy, Malta, Portugal, Scotland, Serbia and Croatia) also demonstrated a very wide range of ILI, from 0.7 to 5.8 [43,46]. Studies of 67 Polish systems supplying water to 10,000 ÷ 20,000 inhabitants presented by Bergel showed that the average ILI for these systems is 1.9 [36].
It should be noted that evaluation of the ILI index takes into account real and apparent water losses, e.g., inaccuracies in water meter readings. ILI values in the range from 2 to 4 indicate the purposefulness of improvements to increase profitability through improved network pressure management, active leakage control, and network maintenance [42,47].
The analysis of water loss took into account the hydraulic load index for the network qo, m³/(km·day). This index shows the mean quantity of water supplied per day in reference to unit length of a water supply network. The values of indices for individual companies are presented in Table 6.
Water losses in a distribution system are related to the hydraulic load of the network. In general, a reduction in the load to the network results in a decrease in water losses. In 2013–2017, the load on the analysed water supply networks showed a slight downward tendency. It should be noted that the hydraulic load index for the network used by company C is significantly higher compared to those used by companies A and B.
4. Description and Assessment of the Strategies of Loss Reduction Adopted by the Companies Studied
In practice, water supply companies adopt different strategies to reduce water losses, depending primarily on their financial standing. In general, two basic strategies can be distinguished: passive and active water loss management. The passive method is limited to the removal of reported failures, and the company does not pursue an active policy of systematic identification and analysis of losses and detection of leakages. In practice, such an approach means that the company does not take measures to limit losses. Failures and related leakages are only removed when they appear on the surface and are reported or they cause limitations in the water supply. These activities generally result in high water losses and a reduced level of services provided by the company due to unplanned interruptions of water supply. Such initiatives are mostly started by companies where the cost of water production is relatively low and the cost of leakage detection is high. Given modern conditions of providing services of water supply, passive loss management seems to be inefficient. If a company adopts such an approach, it should be supported by a thorough economic and technical analysis.
The other approach focuses on regular measures taken by the company aimed to reduce water losses. The company actively manages water losses and is involved in detecting and eliminating leakages. The basis for active management is the continuous monitoring of network flows, consequently reducing water losses and ensuring continuity of supply. The introduction of monitoring often allows for a substantial reduction in water losses.
The companies studied, analysed for several years in terms of water losses, actively manage water losses and regularly expand activities aimed at reduction of losses.
In company A, due to consistently implemented plan to limit water losses, water losses were minimized from about 20% in 2008 to 8.0% in 2017, and the failure rate decreased in this period from 3 failures/(km·year) to less than 1 failure/(km·year). This status was primarily caused by the implementation and regular extension of the monitoring of the water supply system. Monitoring made it possible to control the flow and pressure levels. Due to the varied elevation of the terrain (elevation differences are almost 100 m), the height of the buildings and the distance from the points of purchase, observation and pressure regulation became a priority. At present, 6 maintenance-free water pumping stations and 20 automatic pressure regulators are installed in the water supply system. The zoning water distribution monitoring system implemented by the company allowed for the observation and analysis of minimum night-time flows for the entire system and individual zones. Night-time flow monitoring allows for quick detection of malfunctions or uncontrolled water consumption, and indication of zones and sections in which the network operation parameters differ from the correct levels and require taking measures, e.g., restoration. A very significant effect of the level of water losses was the consistent replacement of old damaged pipes for new ones, as well as the renovation of many kilometres of water pipes. Currently, the company uses ca. 70% of pipes made of PEHD, compared to 46% in 2002.
Company B has been pursuing a programme to reduce water losses for several years. Network operation is monitored and data on network operation are analysed. The distribution system is divided into supply zones, where flow and pressure measurements are conducted. A zoning system of monitoring of night-time flow and pressure allows for detection of leakages. The company regularly develops and improves network monitoring through the construction or modernization of control and measurement wells, which are aimed at separating additional balance zones. This leads to further improvement in pressure stabilization of water for consumers and the effectiveness of water loss reduction. Furthermore, diagnostic measures are intensified in order to locate water leakages. The company has developed and implemented a stepwise leakage detection program. In the first stage, based on the analysis of the water loss balance and the analysis of night-time water flow charts in a given area, the approximate location of the leakage is determined. The section of pipe where leakage occurred is then determined. The area along the section is inspected for visible leakages and the noise is detected. In the final stage, the leakage is precisely located by means of a correlator.
The company has developed an investment plan to modernize water supply networks and conducted reconstruction of emergency water supply sections, which leads to a reduction in the number of failures. Since 2011, more than 60 km of waterworks have been rebuilt. Old, leaking, corroded and easily cracking nets were replaced with new ones. Investments are conducted using materials resistant to mining damage. The numerous activities aimed at minimization of water losses result in a significant reduction in the number of failures. In 2009, there were about 900 water supply failures. In the following years, the number of the failures decreased, reaching ca. 300 failures in 2017.
In company C, the most important measure to reduce water losses was the implementation of a monitoring system and active leakage control in 2006. Currently, the monitoring system covers almost the entire distribution system. Through the GPRS (General Packet Radio Service) network, the monitoring system allows for almost real-time examinations of the quantitative parameters of network operation. The monitoring system is used for detailed analyses of night flows. The analysis of water consumption helps identify the areas where leakages are likely to occur. The company also performs acoustic leakage detection using sensors within the framework of active leakage control. The sensors are programmed to record and filter noise from water supply networks from 1.00 to 3.00. There are four pressure control points on the premises of the plant. The pressure in the network is controlled by setting the output pressure. Its disadvantage, however, is the lack of the option to regulate the pressure at night (when it is the highest) and the possibility of its fluctuations caused by water consumption during the day. For several years, the company has been replacing and repairing water supply lines. The project, co-financed by the Cohesion Fund, allowed for replacing 32 km of water supply lines in 2009. In addition to the above investment, the company conducts the replacement of water supply lines each year as part of its repair management strategy. Pipes are qualified for replacement based on the value of failure intensity index. The company uses the geographical information system (GIS) to manage the operation of the water supply system. All places of repaired failures are marked on a GIS map, which allows for identification of the pipe in the worst technical condition. Furthermore, GIS has an option to create a map of the managed area, and collect, store, process and analyse data, which is very useful for efficient troubleshooting.
5. Summary and Conclusions
For economic and environmental reasons, water supply and sewage companies have to strive to increase the reliability of water distribution systems. Research has shown that water intake, treatment and pumping systems are highly energy-intensive. The level of energy costs varies from one distribution system to another because it depends on the characteristics of the technological systems, the type of pumps, their efficiency, choice of fees, etc. Therefore, companies should adopt an individual approach to reducing water losses and the related minimization of energy consumption. The proposals for energy efficiency improvement methods presented in the literature indicate first and foremost the necessity to improve pumping systems, control pumping station parameters, automate control system and extend monitoring systems of flows and pressures. Only an in depth analysis of the system operation based on the monitoring data allows for the development of algorithms, which, after programming and implementation, help improve energy efficiency, e.g., the operation of a pumping station or a network. Pressure regulation and reduction is the basis for reducing water losses and reducing the energy consumption of systems. Furthermore, pressure control extends the failure-free life of pipes and reduces the failure rates for the network, which significantly reduces the operating costs.
The analysis of the amount of water losses, variability of losses over the years in the analysed distribution systems and the initiatives taken to reduce them revealed that all water supply companies are substantially involved in the implementation of efficient strategies of loss management. Identification of leakages in the water supply system is often a time-consuming and labour-intensive process and does not always bring the expected results. However, an active, intensified and consistent location and removal of leakages usually contributes to a significant reduction in water losses. Undoubtedly, in the last few years, all the companies reduced water losses through comprehensive and regular actions. The analysis of the results of water loss examinations indicated that the failure rate and water loss indices in the companies studied were comparable to the systems operating in areas not exposed to mining activities [10,48,49,50]. The value of the failure intensity index for all networks of the analysed companies was above 1.0 in 2011, whereas currently it amounts to ca. 0.5. Decreases in percentage loss index, Infrastructure Leakage Index and unit water loss index testify the effectiveness of the strategies adopted to reduce leakage in the distribution system. Currently, most indices are at a good to medium level.
Due to the specific nature of operation of individual distribution systems, companies have developed their own leakage detection and removal programs. These solutions are adapted to local conditions, taking into account the differences in the causes of water loss or the capabilities of the companies. However, some actions should be considered universal, bringing results in all the companies analysed. GIS monitoring systems and databases are particularly helpful in reducing water losses. Monitoring information is very useful in the evaluation of network operation parameters, its technical condition, and allows for the analysis and evaluation of water losses in the examined area and for the control of pressure in the network. It is particularly important to monitor night flows, which allows for detecting excessive flows and water consumption resulting from failures or theft. Correct separation of metered zones allows for identification of the areas with high flows. Consequently, the area of searching for failure or uncontrolled water consumption is narrowed down, which accelerates location of leakages and reduces the amount of water lost. Companies regularly extend their networks with new measurement chambers, located in selected places in the network, equipped with modern control and measurement devices. Data from measuring devices are continuously transferred and analysed by the operating services. A good and very effective practice used in the companies studied is to control the pressure in individual areas and reduce it to optimal levels. This reduces the amount of leakages in pipes, thus limiting water losses. The necessity of monitoring and reduction of pressure in the network to optimal values has been emphasized by numerous authors [51,52,53].
All analysed companies perform systematic replacement of old steel and cast iron pipes which cause a large number of leakages that are often difficult to identify, thus leading to water losses. The next step used in all companies studied is to replace water meters with more and more accurate devices and to implement radio reading of water meters. Furthermore, the use of advanced leakage detection equipment is essential to reduce water losses. Companies were equipped with special leakage detection devices such as geophones, stethophones or correlators, which enable immediate detection of leakages.
However, there is no legislation on the maximum allowable losses in the water supply systems. According to many companies, they range from 8 to 10% since the cost of removing leakages below this value is many times higher than the benefits of searching for and removing failures. It is believed that the target level of water losses can be reduced to even 6–8%, but this requires implementation of effective systems and consequently incurring significant costs. Therefore, companies should ensure that the best and most effective loss reduction strategies are developed. It is advisable that water supply companies minimize water losses to the economic level of leakage specified for a given distribution system [54,55,56].
The examinations and the literature review lead to the following conclusions:
- Reducing water losses and the related energy intensity of water production and supply represents a precondition for the implementation of the concept of sustainable water supply. Monitoring of the operation of water supply systems, and accurate flow and pressure measurements with the option of transmitting these data represent the basis for correct assessment of water losses and energy efficiency of the system.
- Due to the specific nature of design solutions and operation of water supply systems, water supply companies should develop their own programmes to reduce water losses and energy consumption of systems. These solutions must be adjusted to local conditions and the company’s potential.
- The results of the examinations of water losses in the systems of the companies studied confirm the effectiveness of the measures taken. Limitation of water losses was achieved first and foremost through the improvement of work organization, active control of leakages, developing monitoring, pressure regulation and reduction, overhauls and replacement of the pipes which are most prone to failure.
- It is recommended that the companies should strive to reduce water losses to the economic leakage rate specified for the water supply system. Determination of the economic level of leakage requires preparation of an economic analysis that takes into consideration the costs of water intake, treatment and distribution, the costs of active control and disposal of leakages.
Author Contributions
All authors have contributed substantially to this work, as specified below: E.O. and M.M. conceived and designed the analysis; E.O. and I.D. performed the analysis; all authors analyzed and discussed the data; E.O. contributed materials; E.O. and I.D. wrote the paper.
Funding
The study was supported by BS/PB-401-301/17.
Conflicts of Interest
The authors declare no conflict of interest.
References
- Kingdom, B.; Liemberger, R.; Marin, P. The Challenge of Reducing Non-Revenue Water (NRW) in Developing Countries—How the Private Sector Can Help: A Look at Performance-Based Service Contracting; Water Supply and Sanitation Board Discussion Paper Series; Paper no. 8; The World Bank: Washington, DC, USA, 2006; Available online: https://siteresources.worldbank.org/INTWSS/Resources/WSS8fin4.pdf (accessed on 8 January 2019).
- Mutikanga, H.E. Water Loss Management: Tools and Methods for Developing Countries. Ph.D. Thesis, Delft University of Technology, Delft, The Netherlands, 4 June 2012. Available online: http://resolver.tudelft.nl/uuid:d78a06e4-7535-4a74-bdc9-d8942cc7556c (accessed on 8 January 2019).
- Lee, C.; Lam, J.S.L. Managing reverse logistics to enhance sustainability of industrial marketing. Ind. Mark. Manag. 2012, 41, 589–598. [Google Scholar] [CrossRef]
- Clarke, M.; Boden, P.; McDonald, A.T. DEBTOR: Debt evaluation, bench-marking and tracking—A water debt management tool to address UK water debt. Water Environ. J. 2012, 26, 292–300. [Google Scholar] [CrossRef]
- Nasirian, A.; Maghrebi, M.F.; Yazdani, S. Leakage Detection in Water Distribution Network Based on a New Heuristic Genetic Algorithm Model. J. Water Resour. Prot. 2013, 5, 294–303. [Google Scholar] [CrossRef]
- Fujimura, K. Pipeline management in Tokyo—Measures for leakage prevention. J. Water Supply Res. Technol.-Aqua 2007, 56, 453–462. [Google Scholar] [CrossRef]
- European Environment Agency. Towards Efficient Use of Water Resources in Europe; EEA Report; EU publications: Luxembourg, 2012. [Google Scholar] [CrossRef]
- Vairavamoorthy, K.; Mutikanga, H.E.; Sharma, S.K. Methods and Tools for Managing Losses in Water Distribution Systems. J. Water Resour. Plan. Manag. 2013, 139, 166–174. [Google Scholar] [CrossRef]
- Hotloś, H. Quantitative Assessment of the Effect of Some Factors on the Parameters and Operating Costs of Water-Pipe Networks; Scientific Papers of the Institute of Environment Protection Engineering of the Wrocław University of Technology. Monographs. Monograph no. 49; Wrocław University of Technology Publishing House: Wrocław, Poland, 2007; Volume 84, pp. 3–206. (In Polish) [Google Scholar]
- Jin, H.; Piratla, K.R. A resilience-based prioritization scheme for water main rehabilitation. J. Water Supply Res. Technol. 2016, 65, 307–321. [Google Scholar] [CrossRef]
- Van den Berg, C. The Drivers of Non-Revenue Water: How Effective are Non-Revenue Water Reduction Programs? Policy Research Working Paper No. 6997; World Bank Group: Washington, DC, USA, 2014; Available online: https://openknowledge.worldbank.org/handle/10986/19396 (accessed on 7 March 2019).
- Richards, G.L.; Johnson, M.C.; Barfuss, S.L. Apparent losses caused by water meter inaccuracies at ultralow flows. J. Am. Water Work. Assoc. 2010, 102, 123–132. [Google Scholar] [CrossRef]
- Jung, D.; Kang, D.; Liu, J.; Lansey, K. Improving the rapidity of responses to pipe burst in water distribution systems: A comparison of statistical process control methods. J. Hydroinform. 2015, 17, 307–328. [Google Scholar] [CrossRef]
- Pérez, R.; Puig, V.; Pascual, J.; Quevedo, J.; Landeros, E.; Peralta, A. Methodology for leakage isolation using pressure sensitivity analysis in water distribution networks. Control Eng. Pract. 2011, 19, 1157–1167. [Google Scholar] [CrossRef] [Green Version]
- Turnquist, M.; Vugrin, E. Design for resilience in infrastructure distribution networks. Environ. Syst. Decis. 2013, 33, 104–120. [Google Scholar] [CrossRef] [Green Version]
- Meseguer, J.; Mirats-Tur, J.M.; Cembrano, G.; Puig, V.; Quevedo, J.; Pérez, R.; Sanz, G.; Ibarra, D. A decision support system for on-line leakage localization. Environ. Model. Softw. 2014, 60, 331–345. [Google Scholar] [CrossRef] [Green Version]
- Ashton, C.H.; Hope, V.S. Environmental valuation and the economic level of leakage. Urban Water 2001, 3, 261–270. [Google Scholar] [CrossRef]
- Feldman, M. Aspects of energy efficiency in water supply systems. In Proceedings of the 5th IWA Water Loss Reduction Specialist Conference, Cape Town, South Africa, 26–30 April 2009; pp. 85–89. Available online: https://pdfs.semanticscholar.org/1c7f/cee3eee8bf510c8846ec5c7bfeb03079a544.pdf (accessed on 26 April 2019).
- Coelho, B.; Andrade-Campos, A. Efficiency achievement in water supply systems—A review. Renew. Sustain. Energy Rev. 2014, 30, 59–84. [Google Scholar] [CrossRef]
- Perrone, D.; Murphy, J.; Hornberger, G.M. Gaining Perspective on the Water-Energy Nexus at the Community Scale. Environ. Sci. Technol. 2011, 45, 4228–4234. [Google Scholar] [CrossRef]
- Sarbu, I. A Study of Energy Optimisation of Urban Water Distribution Systems Using Potential Elements. Water 2016, 8, 593. [Google Scholar] [CrossRef]
- Nazif, S.; Karamouz, M.; Tabesh, M.; Moridi, A. Pressure Management Model for Urban Water Distribution Networks. Water Resour. Manag. 2010, 24, 437–458. [Google Scholar] [CrossRef]
- Zimoch, I. Pressure Control as Part of Risk Management for a Water-pipe Network in Service. Environ. Prot. 2012, 34, 57–62. Available online: http://www.os.not.pl/docs/czasopismo/2012/4-2012/Zimoch_4-2012.pdf (accessed on 29 April 2019). (In Polish).
- Duda, M.; Chludziński, D. Analysis to reduce electricity consumption in water supply system, case study: Water treatment station “Karolin” in Olsztyn. J. Civ. Eng. Environ. Archit. JCEEA 2016, 63, 97–104. [Google Scholar] [CrossRef]
- Andraka, D.; Cherednik, G. Automatic system of water supply management as the element of sustainable maintenance system on the example of Żodino waterworks (Belarus). Econ. Environ. 2013, 2, 193–202. Available online: http://www.fe.org.pl/uploads/ngrey/eis45.pdf (accessed on 26 April 2019). (In Polish).
- Carravetta, A.; Conte, M.C.; Antipodi, L. Energy efficiency index for water supply systems. In Proceedings of the 2015 AEIT International Annual Conference (AEIT 2105), Naples, Italy, 14–16 October 2015; pp. 1–4. [Google Scholar] [CrossRef]
- Ramos, H.M.; Mello, M.; De, P.K. Clean power in water supply systems as a sustainable solution: From planning to practical implementation. Water Sci. Technol. Water Supply 2010, 10, 39–49. [Google Scholar] [CrossRef]
- Hotloś, H.; Mielcarzewicz, E. Reliability Conditions and Assessment of a Proper Functioning of Water-Pipe Networks and Sewer Systems in Areas Affected by Mining Operations; Scientific Papers of the Institute of Environment Protection Engineering of the Wrocław University of Technology. Monographs. Monograph no. 56; Wrocław University of Technology Publishing House: Wrocław, Poland, 2011; Volume 91, p. 84. (In Polish) [Google Scholar]
- Kliszczewicz, H. Underground infrastructure systems on mining areas. Modern Build. Eng. 2009, 5, 94–97. Available online: http://www.nbi.com.pl/assets/NBI-pdf/2009/5_26_2009/pdf/23_sieci_uzbrojenia.pdf (accessed on 18 December 2018). (In Polish).
- Kowalski, A.; Kalisz, P.; Zięba, M. Impact of mining extraction of utility networks. Pol. Min. Rev. 2015, 71, 9–16. Available online: http://www.sitg.pl/przegladgorniczy/spis-numeru/mag-1115-pazdziernik-2015.html (accessed on 15 January 2019). (In Polish).
- Lambert, A.; Hirner, W. Losses from Water Supply Systems: Standard terminology and recommended performance measures. Blue Pages 2000, 10, 320–338. [Google Scholar]
- Siwoń, Z.; Cieżak, J.; Cieżak, W. Practical aspects of analyzing water losses in water supply systems. Environ. Prot. 2004, 26, 25–30. (In Polish). Available online: https://www.infona.pl/resource/bwmeta1.element.baztech-article-BPOB-0004-0028 (accessed on 29 April 2019). (In Polish).
- Farley, M.; Trow, S. Losses in Water Distribution Networks. A Practitioner’s Guide to Assessment, Monitoring and Control; IWA Publishing: London, UK, 2003; pp. 146–149. [Google Scholar]
- Michalik, P.; Rak, J. Analysis of the water losses in the Biecz city. J. Civ. Eng. Environ. Archit. JCEEA 2017, 64, 211–222. [Google Scholar] [CrossRef]
- Hug, O.; Rödiger, A.; Schaffert, R.; Tippmann, S. Prozess-Benchmarking „Rohrnetz betreiben“ und Kundenorientierung: Modernisierungspotenziale aufdecken und erschließen. Energie Wasser Praxis 2002, 7, 2–7. (In German) [Google Scholar]
- Bergel, T. Ratio analysis of tap water losses in rural and urban-rural communes in Poland (part 2). Gas Water Sanit. Eng. 2012, 10, 413–415. Available online: http://sigma-not.pl/publikacja-71554-analiza-wska%C5%BAnikowa-strat-wody-wodociagowej-w-gminach-wiejskich-i-miejsko-wiejskich-w-polsce-(cz.-2)-gaz-woda-i-technika-sanitarna-2012-10.html. (accessed on 15 January 2019). (In Polish).
- Królikowska, J.; Królikowski, A. The Comparatory Analysis of Reliability Parameters of Town and Village Water-Supply Systems. Water Supply and Water Quality. 2010. Available online: http://water.put.poznan.pl/images/fullpapers/2010/OSADY/383_WODA2010_T2_WODA_2010_T2.pdf (accessed on 16 January 2019). (In Polish).
- Kusak, J.; Kwietniewski, M.; Sudoł, M. Influence of different factors on damage sensitivity of water supply system conduits in the light of exploitative reliability research. Gas Water Sanit. Eng. 2002, 10, 366–371. Available online: http://www.gazwoda.pl/index.php?option=content&task=view&id=5141. (accessed on 15 January 2019). (In Polish).
- Pietrucha-Urbanik, K.; Studziński, A. Selected Issues of Costs and Failure of Pipes in an Exemplary Water Supply System. Annu. Set Environ. Prot. 2016, 18, 616–627. Available online: http://www.ros.edu.pl/images/roczniki/2016/No2/47_ROS_N2_V18_R2016.pdf (accessed on 12 December 2018). (In Polish).
- Rak, J.R.; Sypień, Ł. Analysis of the water losses in the Jasło city. J. Civ. Eng. Environ. Archit. JCEEA 2013, 60, 5–18. (In Polish) [Google Scholar] [CrossRef]
- Rak, J.; Misztal, A. Analysis of the water losses in the Jarosław city. J. Civ. Eng. Environ. Archit. JCEEA 2017, 64, 123–136. (In Polish) [Google Scholar] [CrossRef]
- Kwietniewski, M. Application of Water Loss Indicators as a Measure of its Distribution Effectiveness in Water Supply Systems. Environ. Prot. 2013, 35, 9–16. Available online: http://www.os.not.pl/docs/czasopismo/2013/4-2013/Kwietniewski_4-2013.pdf (accessed on 14 January 2019). (In Polish).
- Water Use and Loss Report. Water Take Resource Consent. Nelson City Council; Document Number: 14000-278-02. Date: 4/11/2014. Available online: http://www.nelson.govt.nz/assets/Building-Planning/Downloads/Resource-Consents/publicly notified/2016/maitai-pipeline/165122-App-G-Water-Use-and-Loss-Report-Cameron-Gibson-Wells.pdf (accessed on 13 March 2019).
- Dohnalik, P.; Jędrzejewski, Z. Efficient Water Supply System Operation. Reduction of Water Losses; LEMTECH Konsulting: Kraków, Poland, 2004; 285p. (In Polish) [Google Scholar]
- McKenzie, R.; Lambert, A. Water Loss Group: IWA Task Force. Best Practice Performance Indicators for NonRevenue Water and Water Loss Components: A Practical Approach; Water 21; IWA: London, UK, 2003. [Google Scholar]
- Merks, C.; Lambert, A.; Trow, S.; Advances in Leakage Management in Europe—The EU Reference Documents at a Glance. IWA Regional Conference Water Loss Management 2015—Session 4, Bucharest, Romania, 15–17 June 2015, Organized by ARA. Available online: http://www.leakssuite.com/wp-content/uploads/2015/03/At-a-Glance-Leaflet-15-mar.pdf (accessed on 13 February 2019).
- Ferrari, G.; Savic, D. Economic performance of DMAs in water distribution systems. Procedia Eng. 2015, 119, 189–195. [Google Scholar] [CrossRef]
- Ociepa, E.; Molik, R.; Lach, J. Assessment of Water Loss Level on the Example of Selected Distribution Systems. E3S Web Conf. 2018, 44, 00131. [Google Scholar] [CrossRef]
- Kępa, U.; Stępniak, L.; Stańczyk-Mazanek, E.; Przybylski, J. The sustainable management of water supply system. AIP Conf. Proc. 2018, 2022, 020020. [Google Scholar] [CrossRef]
- Ociepa-Kubicka, A.; Wilczak, K. Water Loss Reduction as the Basis of Good Water Supply Companies’ Management. E3S Web Conf. 2017, 19, 02015. [Google Scholar] [CrossRef] [Green Version]
- Fantozzi, M.; Lambert, A.O.; Liemberger, R. Some Examples of European Water Loss Targets, and the Law of Unintended Consequences. In Proceedings of the International Water Association’s Water Loss Task Conference, Sao Paulo, Brazil, 6–9 June 2010; Available online: http://www.leakssuite.com/wp-content/uploads/2012/11/2010_FantozziLambertLiembergerSanPaolo7AprIWA-2010K.pdf (accessed on 12 March 2019).
- Babić, B.; Đukić, A.; Stanić, M. Managing water pressure for water savings in developing countries. Water SA 2014, 40, 221–232. [Google Scholar] [CrossRef]
- Hotloś, H. Exploitation testing of the influence of pressure level and pipes’ material on the damage sensitivity of a water supply system. Gas Water Sanit. Eng. 2002, 11, 402–407. Available online: http://www.gazwoda.pl/index.php?option=content&task=view&&id=5154. (accessed on 15 January 2019). (In Polish).
- Garcia, S.; Thomas, A.; Stanić, M. The Structure of Municipal Water Supply Costs: Application to a Panel of French Local Communities. J. Product. Anal. 2001, 16, 5–29. [Google Scholar] [CrossRef]
- Saez-Fernandez, F.J.; González-Gómez, F.; Picazo-Tadeo, A.J. Opportunity Costs of Ensuring Sustainability in Urban Water Services. Int. J. Water Resour. Dev. 2011, 27, 693–708. [Google Scholar] [CrossRef]
- Arregui, F.J.; Cobacho, R.; Soriano, J.; Jimenez-Redal, R. Calculation Proposal for the Economic Level of Apparent Losses (ELAL) in a Water Supply System. Water 2018, 10, 1809. [Google Scholar] [CrossRef]
Figure 1.
Material structure of water supply networks of companies A, B and C.

Figure 2.
Infrastructure Leakage Index—ILI.


Table 1.
Characteristics of the water supply network.
| Year | Length of the Water Supply Network (km) | Number of Service Connections, (Nc) | Average Pressure in the Tested Network, p (m H2O) | ||
|---|---|---|---|---|---|
| Length of the Water Supply Network, (Lm) | Length of Private Service Pipes, (Lp) | Total length (Lm + Lp) | |||
| Company A | |||||
| 2013 | 319.6 | 110.4 | 430.0 | 8538 | 40 |
| 2014 | 326.7 | 110.9 | 437.6 | 8836 | 40 |
| 2015 | 328.6 | 111.3 | 439.9 | 9106 | 38 |
| 2016 | 331.3 | 111.9 | 443.2 | 9328 | 38 |
| 2017 | 332.3 | 112.1 | 444.4 | 9565 | 38 |
| Company B | |||||
| 2013 | 340.5 | 107.7 | 448.2 | 9694 | 40 |
| 2014 | 345.1 | 109.5 | 454.6 | 9805 | 40 |
| 2015 | 347.3 | 111.2 | 458.5 | 9973 | 40 |
| 2016 | 347.8 | 112.2 | 460.0 | 10030 | 40 |
| 2017 | 250.3 | 113.5 | 463.8 | 10067 | 40 |
| Company C | |||||
| 2013 | 254.5 | 93.8 | 348.3 | 7712 | 45 |
| 2014 | 254.6 | 94.1 | 348.7 | 7751 | 46 |
| 2015 | 255.4 | 88.0 | 343.4 | 7104 | 45 |
| 2016 | 256.9 | 95.3 | 352.2 | 7171 | 43 |
| 2017 | 262.7 | 96.4 | 359.1 | 7273 | 43 |
Table 2.
Summary in water balance in 2013–2017.
| Year | Water Supplied to the Network, SIV (thousand m3/year) | Water Used for Own Needs of the Company, UAC (thousand m3/year) | Water Sold, Vsol thousand m3/year | Water Loss in the Distribution System, CARL (thousand m3/year) |
|---|---|---|---|---|
| Company A | ||||
| 2013 | 5997.2 | 55.2 | 5375.1 | 566.9 |
| 2014 | 6081.6 | 54.8 | 5410.4 | 616.4 |
| 2015 | 5953.1 | 57.5 | 5418.7 | 476.9 |
| 2016 | 5826.2 | 46.4 | 5364.4 | 415.4 |
| 2017 | 5825.9 | 37.4 | 5362.4 | 426.1 |
| Company B | ||||
| 2013 | 6980.5 | 291.2 | 9142.5 | 546.8 |
| 2014 | 6822.4 | 153.5 | 6019.7 | 649.2 |
| 2015 | 6571.4 | 125.0 | 5931.7 | 514.7 |
| 2016 | 6476.8 | 139.3 | 5845.2 | 492.3 |
| 2017 | 6488.1 | 150.9 | 5729.0 | 608.2 |
| Company C | ||||
| 2013 | 7686.8 | 115.3 | 6930.4 | 641.1 |
| 2014 | 7697.5 | 115.5 | 7064.0 | 518.0 |
| 2015 | 7662.6 | 114.9 | 7051.5 | 496.2 |
| 2016 | 7632.4 | 114.5 | 7182.1 | 335.8 |
| 2017 | 7619.1 | 114.3 | 7110.3 | 394.5 |
Table 3.
Mean values of unit intensity of water pipeline failures λ (failure/(km·year)).
| Water Supply Companies | 2011 | 2012 | 2013 | 2014 | 2015 | 2016 | 2017 |
|---|---|---|---|---|---|---|---|
| A | 1.08 | 0.81 | 0.61 | 0.62 | 0.64 | 0.50 | 0.52 |
| B | 1.30 | 1.48 | 0.52 | 0.50 | 0.51 | 0.50 | 0.50 |
| C | 1.20 | 1.80 | 1.95 | 1.30 | 0.89 | 0.56 | 0.55 |
Table 4.
Water loss indices for the analysed companies.
| Year | WS % | Qlos dm3/(inhabitant·day) | RLB2 dm3/(connection·day) | NRWB % | qs m3/(km·h) | ILI (-) |
|---|---|---|---|---|---|---|
| Company A | ||||||
| 2013 | 9.5 | 11.4 | 199.6 | 10.4 | 0.20 | 2.5 |
| 2014 | 10.1 | 12.4 | 208.1 | 11.0 | 0.21 | 2.7 |
| 2015 | 8.0 | 9.7 | 160.0 | 9.1 | 0.17 | 2.1 |
| 2016 | 7.1 | 8.6 | 135.5 | 8.0 | 0.14 | 1.8 |
| 2017 | 7.3 | 9.1 | 130.0 | 8.0 | 0.15 | 1.8 |
| Company B | ||||||
| 2013 | 7.9 | 9.4 | 236.0 | 12.0 | 0.18 | 2.3 |
| 2014 | 9.5 | 9.0 | 224.2 | 11.8 | 0.21 | 2.7 |
| 2015 | 7.8 | 9.1 | 157.7 | 9.7 | 0.17 | 2.2 |
| 2016 | 7.6 | 8.9 | 172.5 | 9.8 | 0.16 | 2.0 |
| 2017 | 9.3 | 11.0 | 206.2 | 11.6 | 0.19 | 2.4 |
| Company C | ||||||
| 2013 | 8.3 | 11.2 | 225.2 | 9.7 | 0.29 | 2.9 |
| 2014 | 6.7 | 9.3 | 183.0 | 8.2 | 0.23 | 2.3 |
| 2015 | 6.5 | 9.0 | 191.0 | 8.0 | 0.22 | 2.4 |
| 2016 | 4.4 | 6.2 | 128.2 | 5.9 | 0.15 | 1.7 |
| 2017 | 5.2 | 7.4 | 148.0 | 6.7 | 0.17 | 1.9 |
Table 5.
Categories of assessment of water supply systems according to ILI [31].
Table 5.
Categories of assessment of water supply systems according to ILI [31].
| ILI Scope and Categories According to IWA (Condition) | ILI Categories | ILI Scope According to WBI Banding System | ILI Scope According to AWWA | |
|---|---|---|---|---|
| Developing Countries | Developed Countries | |||
| ILI ≤ 1.5 (very good) | very good | ILI ≤ 4.0 | ILI ≤ 2.0 | ILI ≤ 3.0 |
| 1.5 < ILI ≤ 2.0 (good) | ||||
| 2.0 < ILI ≤ 2.5 (satisfactory) | good | 4.0 < ILI ≤ 8.0 | 2.0 < ILI ≤ 4.0 | 2.0 < ILI ≤ 2.5 |
| 2.5 < ILI ≤ 3.0 (poor) | poor | 8.0 < ILI ≤ 16.0 | 4.0 < ILI ≤ 8.0 | 5.0 < ILI ≤ 8.0 |
| 3.0 < ILI ≤ 3.5 (very poor) | ||||
| ILI ≥ 3.5 (inadmissible) | inadmissible | ILI > 16.0 | ILI > 8.0 | ILI > 8.0 |
Table 6.
Summary of indices of hydraulic load of a water supply system (q0) (m3/(km·day)).
| Company | 2013 | 2014 | 2015 | 2016 | 2017 |
|---|---|---|---|---|---|
| A | 51.4 | 51.0 | 49.6 | 48.2 | 48.0 |
| B | 56.2 | 54.2 | 51.8 | 51.0 | 50.7 |
| C | 82.7 | 82.8 | 82.2 | 81.4 | 79.5 |
© 2019 by the authors. Licensee MDPI, Basel, Switzerland. This article is an open access article distributed under the terms and conditions of the Creative Commons Attribution (CC BY) license (http://creativecommons.org/licenses/by/4.0/).
Share and Cite
MDPI and ACS Style
Ociepa, E.; Mrowiec, M.; Deska, I. Analysis of Water Losses and Assessment of Initiatives Aimed at Their Reduction in Selected Water Supply Systems. Water 2019, 11, 1037. https://doi.org/10.3390/w11051037
AMA Style
Ociepa E, Mrowiec M, Deska I. Analysis of Water Losses and Assessment of Initiatives Aimed at Their Reduction in Selected Water Supply Systems. Water. 2019; 11(5):1037. https://doi.org/10.3390/w11051037
Chicago/Turabian StyleOciepa, Ewa, Maciej Mrowiec, and Iwona Deska. 2019. "Analysis of Water Losses and Assessment of Initiatives Aimed at Their Reduction in Selected Water Supply Systems" Water 11, no. 5: 1037. https://doi.org/10.3390/w11051037
Note that from the first issue of 2016, this journal uses article numbers instead of page numbers. See further details here.