Effect of Cascading Reservoirs on the Flow Variation and Thermal Regime in the Lower Reaches of the Jinsha River

1
Institute for Environmental Sciences, University of Koblenz-Landau, Fortstrasse 7, 76829 Landau, Germany
2
College of Hydraulic and Environmental Engineering, China Three Gorges University, Yichang 443002, Hubei, China
3
Hubei Key Laboratory of River-lake Ecological Restoration and Algal Utilization, Hubei University of Technology, Wuhan 430068, Hubei, China
*
Authors to whom correspondence should be addressed.
Water 2019, 11(5), 1008; https://doi.org/10.3390/w11051008
Submission received: 9 April 2019
/
Revised: 9 May 2019
/
Accepted: 10 May 2019
/
Published: 14 May 2019
(This article belongs to the Section Water Quality and Contamination)
Abstract
:We analyzed the alteration of discharge and water temperature caused by two newly established reservoirs in the lower reaches of the Jinsha River. In comparison to longer-term observations from the pre-impoundment period, the seasonal flow variability was significantly affected by the larger, upstream-located Xiluodu reservoir, with higher discharge in spring and reduced discharge in summer. The smaller, downstream located Xiangjiaba reservoir did not contribute significantly to the total hydrological alteration caused by the reservoir cascade. Thermal stratification occurred in spring and summer in the Xiluodu reservoir, but was not observed in the Xiangjiaba reservoir. The vertical structure and seasonal dynamics of thermal stratification were mainly governed by the water temperature of the inflow and the depth of the water outlet. Despite the different thermal structure, both reservoirs reduced the amplitude of annual temperature variations and delayed the seasonal temperature cycle in the downstream river water. In contrast to discharge variation, thermal effects were cumulative along the cascading reservoirs. Homogenization and delay effects can be expected to increase further with the completion of ongoing reservoir construction upstream of the two studied reservoirs. Based on our findings, we discuss the larger-scale impacts of cascading hydropower developments and emphasize the need for taking water temperature and its variation into account when developing optimized operation or mitigation strategies for these systems.
1. Introduction
Reservoirs provide comprehensive ecosystem services to human society, such as flood control, electricity generation, navigation, irrigation, and drinking water storage, and promote economic and social development [1,2]. However, dam construction and reservoir operation are associated with drastic changes in the physical environment of the impounded water body (reservoir), as well as in downstream river reaches, with globally significant impacts on biodiversity [3,4], biogeochemical cycling [5,6], and greenhouse gas emissions [7,8].
Flow velocity and its temporal dynamics are among the primarily affected physical characteristics of the impounded river. Enlarged cross-sectional area causes a general reduction in flow velocity, an increase in water residence time [9], and often changes the characteristics of the water body from lotic to lentic [10,11]. In consequence, reservoirs can develop seasonal or diurnal thermal stratification, depending mainly on residence time and water depth [12,13]. Vertical density stratification acts as a barrier, restraining mixing of the water column [14], and affects the vertical distribution of suspended and dissolved material, including nutrients, algae, and oxygen [15,16]. Downstream of reservoirs, river discharge is strongly altered, with higher dry season flows and reduced flood peaks [17,18]. Furthermore, downstream water temperature and its seasonal dynamics can differ strongly from the pre-impoundment conditions [19]. Common alterations include a reduction in the annual and daily fluctuations of water temperature, lower summer maximum temperature, and a delay in the annual cycle of temperature variations [20].
With the number of dams increasing globally [21], cascading reservoir configurations—where the inflowing water into impoundments is already affected by upstream dam operation—are becoming more frequent. Although the few existing observations revealed an increase in the overall degree of hydrological alteration for the combined operation of cascading reservoirs [22,23], the mechanisms by which alterations propagate and potentially accumulate along cascading reservoirs are poorly understood. The impact of reservoir operations on hydrology depends largely on the operation rules applied and, naturally, on the actual number and location of the dams [24]. The hydrodynamics in reservoirs, which receive inflowing water from upstream impoundments, are not only affected by flow regulation, but also by discharge temperature. Inflowing water often forms a density current along the channel bottom, due to the lower release temperature of the upstream reservoir. The resulting thermal regime can therefore differ from that of a solitary reservoir [25,26]. Most studies on the impact of cascading reservoirs on river systems have mainly focused on discharge and sediment transport, whereas the impact of reservoir operation on the thermal regime in downstream reservoirs and river reaches has rarely been studied.
The Jinsha River, which is the upper stretch of the Yangtze River in China, is an example of ongoing development of cascading reservoir construction. The upper Yangtze River is extensively used for hydropower production, with seven large-scale hydropower projects planned—two under construction, and two recently completed dams [27]. The Xiluodu and Xiangjiaba hydroelectric power stations are located in the lower reaches of the Jinsha River. Xiangjiaba is the most downstream located reservoir in the Jinsha River and started operation in 2012. Xiluodu reservoir is located upstream of Xiangjiaba and started operation in 2013. Two additional reservoirs are currently under construction upstream of Xiluodu. The environmental impacts of cascading reservoirs in the Jinsha River have been studied with respect to the hydrologic regime [28,29], the thermal regime [30], fish diversity [31], dissolved gas pressure [32], sediment accumulation or siltation [33,34], and water quality [35]. Studies on alterations of downstream flow and thermal regime, however, are sparse, and were mostly based on design data, without validation by field measurements. Recently, Xie et al, (2017) [30] analyzed the water temperature characteristics and the formation of thermal stratification in Xiluodu reservoir. The potential hydrological and thermal cummulative impacts of the combined operation of Xiluodu and Xiangjiaba reservoir, however, was not considered.
This study aims at improving the current understanding of the cumulative effects of cascading reservoirs, by analyzing the thermal regime and flow alteration in two newly constructed reservoirs in the lower reaches of the Jinsha River (Xiluodu and Xiangjiaba). We used field measurements of water temperature in both reservoirs and combined these with longer-term observations of discharge and temperature in the Jinsha River during pre-impoundment conditions. A set of indices were used to evaluate the accumulation effect of water temperature after the impoundment of both reservoirs and to analyze flow alteration from 1980 to 2015. We used the measured data to calibrate a two-dimensional hydrodynamic model (CE-QUAL-W2), which we applied to analyze the spatial and temporal distribution of water temperature and the formation of thermal stratification in both reservoirs.
2. Materials and Method
2.1. Study Site
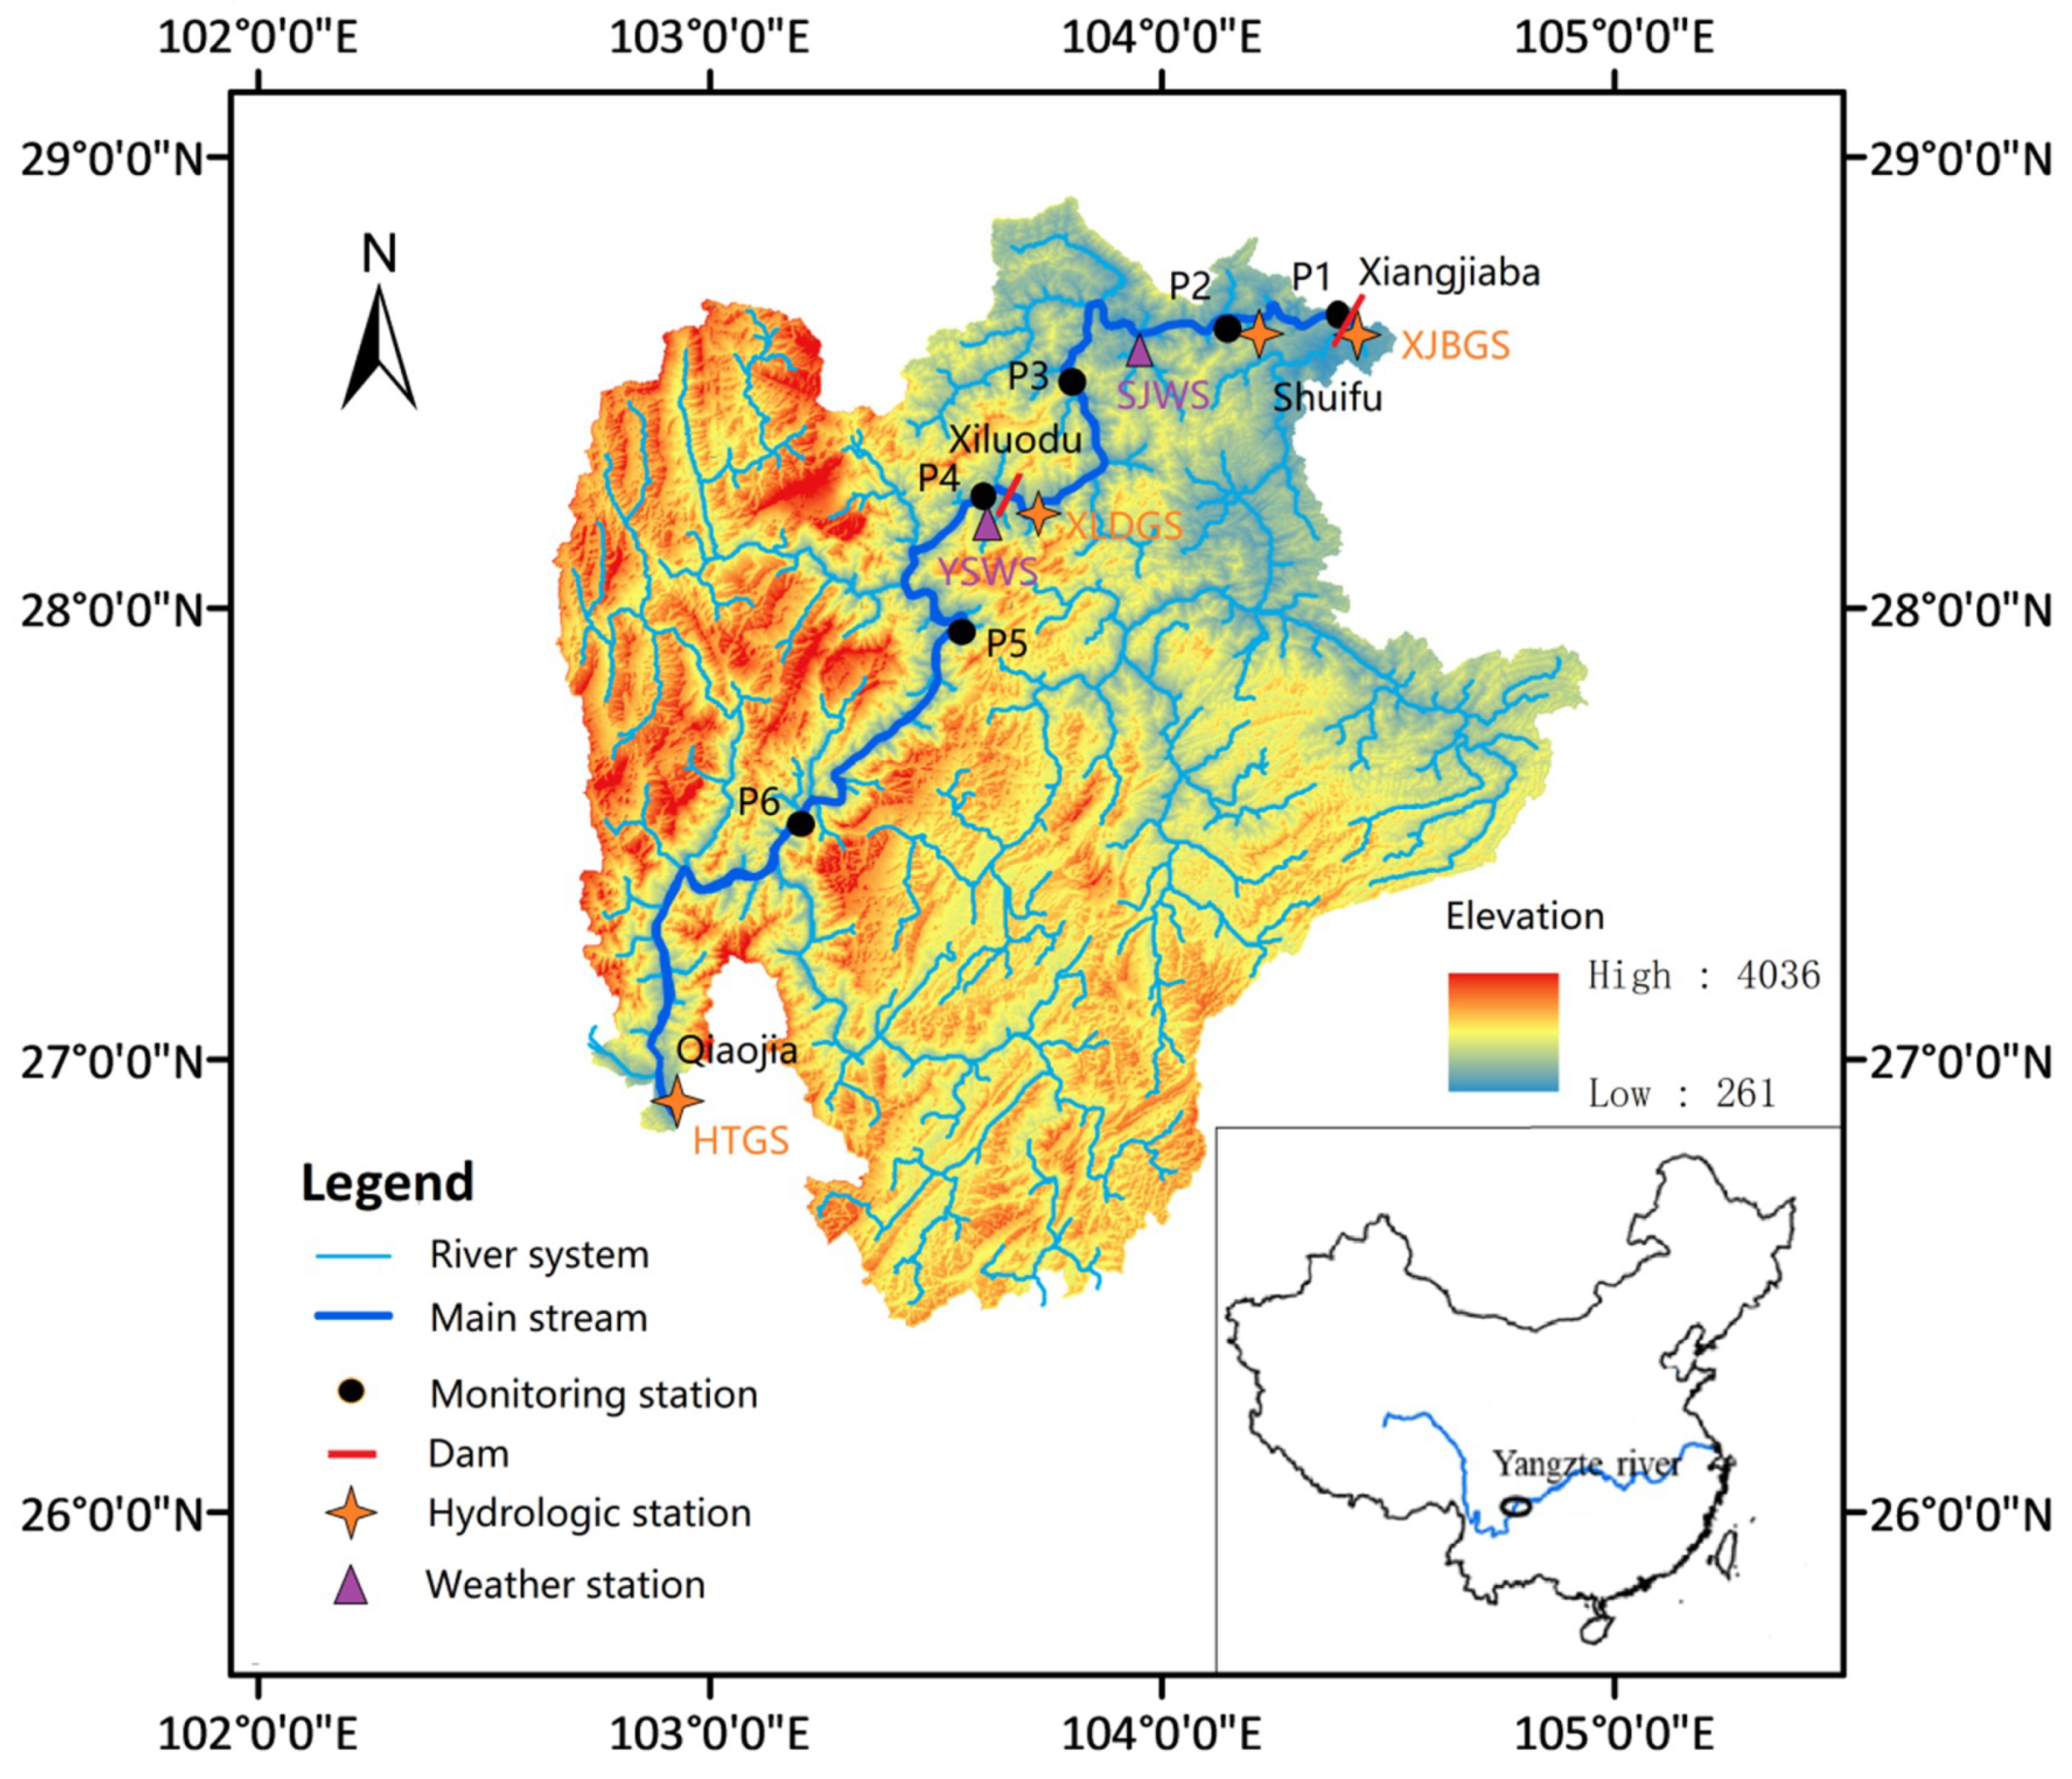
The Xiluodu and Xiangjiaba reservoirs are the most downstream reservoirs in the Jinsha River (Figure 1). Their main functions include hydropower generation, flood control, and increasing shipping and commerce in the region. Two additional reservoirs (Baihetan (BHT) and Wudongde (WDD)) are currently under construction upstream of Xiluodu and are planned to be put into operation in 2020–2022. The basins of Xiluodu and Xiangjiaba are typical canyon-shape, and the slopes of the riverbeds are around 1.12‰ and 0.77‰, respectively. The length of the Xiluodu reservoir is about 200 km and its width varies between 150 and 1000 m. The impoundment of the Xiluodu reservoir was initiated on 4 May 2013 and the water level varied widely between 540 and 600 m (above sea level) throughout the following years. The length of the Xiangjiaba reservoir is about 156 km and its width varies between 130 and 1500 m. The impoundment of the Xiangjiaba reservoir was initiated on 10 October 2012 and its water level varies between 370 and 380 m throughout the year. The two reservoirs are located in a subtropical valley, where the perennial mean temperature is about 11.6 °C and the average annual rainfall is about 893 mm. The rainfall displays an uneven characteristic, with seasonal averages of 136, 513, 212, and 32 mm from spring to winter. The main features of the four cascading hydroelectric reservoirs are summarized in Table 1. In this paper, period I (1980–2011) will be considered the pre-impoundment situation and period II (after 2012) the current hydrologic situation.
2.2. Data
Daily mean values of the river discharge from 1980 to 2015 and daily mean water temperatures from 2000 to 2015 were available from four different hydrological stations: Huatan gauge station (HTGS, 235 km upstream of Xiluodu Dam); Xiluodu gauge station (XLDGS, 2.9 km downstream of Xiluodu Dam, measured from 2013); Pingshan gauge station (PSGS, 29 km upstream of Xiangjiaba Dam, abandoned after 2012) and Xiangjiaba guage station (XJBGS, 2.4 km downstream of Xiangjiaba Dam). Basic parameters of reservoir operation, including water level, inflow, outflow, and outlet locations, were provided by the hydropower company. All the hydrological and meteorological data used in this study are summarized in Table S1.
Meteorological data for the hydrodynamic model were available from Suijiang and Yongshan meteorological stations (Figure 1). The data from 1 January 2014 to 31 December 2015 included daily average values of air temperature, wind speed and direction, number of sunshine hours, and relative humidity, as well as annual average air temperature and precipitation.
Vertical profiles of water temperature for model calibration were measured in 2014 at six sampling sites (P1–P6), which were nearly evenly spaced along both reservoirs (sites P1–P3 in Xiangjiaba reservoir, sites P4–P6 in Xiluodu reservoir, Figure 1). Measurements were conducted in both reservoirs on 24–27 April, 15–17 August, and 17–19 December 2014. Vertical profiles of water temperature were recorded at 2 m depth increments using a multi-parameter water quality probe (YSI EXO2, Yellow Springs, OH, USA).
Annual mean precipitation in the Jinsha River basin was estimated from data provided by the China Meteorological Science data sharing Service network (http://www.data.cma.cn/) for 30 meteorological stations. Air temperature at the two reservoirs was estimated from data recorded by three weather stations, located on the upper, middle, and lower reaches of the reservoir, respectively (see Table S2 in Supplementary Information). Parts of the data analysis were conducted for seasonal time scales, which we defined as spring (March–May), summer (June–August), autumn (September–November), and winter (December–February).
2.3. Assessment Method
In a riverine system, seasonal water temperature variations can be described by an annual periodic function [19] and alterations of water temperature dynamics after reservoir construction in terms of changes in its amplitude and phase [20]. We used the baseline deviation index, phase offset index, and the extreme value amplitude index to evaluate the water temperature change after the impoundment of Xiangjiaba and Xiluodu reservoir [36,37].
The baseline deviation index is the annual sum of squared differences in monthly mean water temperature before impoundment (, the index i (1 ≤ i ≤ 12) refers to month) and after impoundment (), normalized by the squared mean deviation of monthly mean temperature from the annual mean temperature before impoundment ():
The phase offset time index () is defined as the phase difference between the river water temperature and the natural river reference water temperature before the construction of the reservoir. The calculation formula is as follows:
where and are vector angles of water temperature in month number i after impoundment and before impoundment. With 365 days corresponding to a phase shift of 360°, one month corresponds to a phase shift of 30°.
The extreme fluctuation index () is the ratio of signed differences of the annual extreme values of monthly mean water temperature after ( ) and before ( and ) impoundment:
The theoretical mean hydraulic residence time of the reservoirs (HRT) was estimated following [38]:
HRT = Volume/Qoutflow,
Where Volume is the storage capacity of reservoir, and Qoutflow is the perennial average discharge in the lower reaches of the Jinsha River.
2.4. Numerical Simulation
CE-QUAL-W2 is a two-dimensional (longitudinal and vertical), laterally averaged, hydrodynamic and water quality model [39]. The model has been used to simulate flow velocity, temperature and various water quality parameters in lakes and reservoirs [40,41]. We used the observed temperature profiles measured in 2014 in both reservoirs to calibrate and to validate the model. The initial and boundary conditions, model parameters, and results of the model calibration are presented as supplementary information (see Figure S1–S5). The model’s performance in simulating the water temperature stratification was comparable to that achieved in other studies [42,43,44], indicating that the model parameters were set reasonably and the simulations of thermal regimes were accurate and credible. Using the calibrated model, we simulated the spatial and temporal distribution of water temperature in both reservoirs in 2015.
The effect of the Xiluodu reservoir on the temperature stratification in the Xiangjiaba reservoir in 2015 was additionally analyzed in a hypothetical scenario, without the upstream Xiluodu reservoir. We simulated the water temperature dynamics in the Xiangjiaba reservoir with the inflow rate and inflow temperature data measured at HTGS, i.e., upstream of the Xiluodu reservoir. The inflow conditions were corrected according to the longitudinal water temperature and flow gradient between the HTGS station and Xiangjiaba reservoir observed in the long-term hydrological observations during the pre-impoundment period. The daily outflow from the Xiangjiaba reservoir was estimated by the storage–capacity curve and known pre-dam daily water levels. Direct measurements were used for the withdrawal height at Xiangjiaba and meteorological conditions during the simulated scenario.
3. Results
3.1. Long-Term Flow Variability and Hydrological Alteration
3.1.1. Annual Mean Discharge
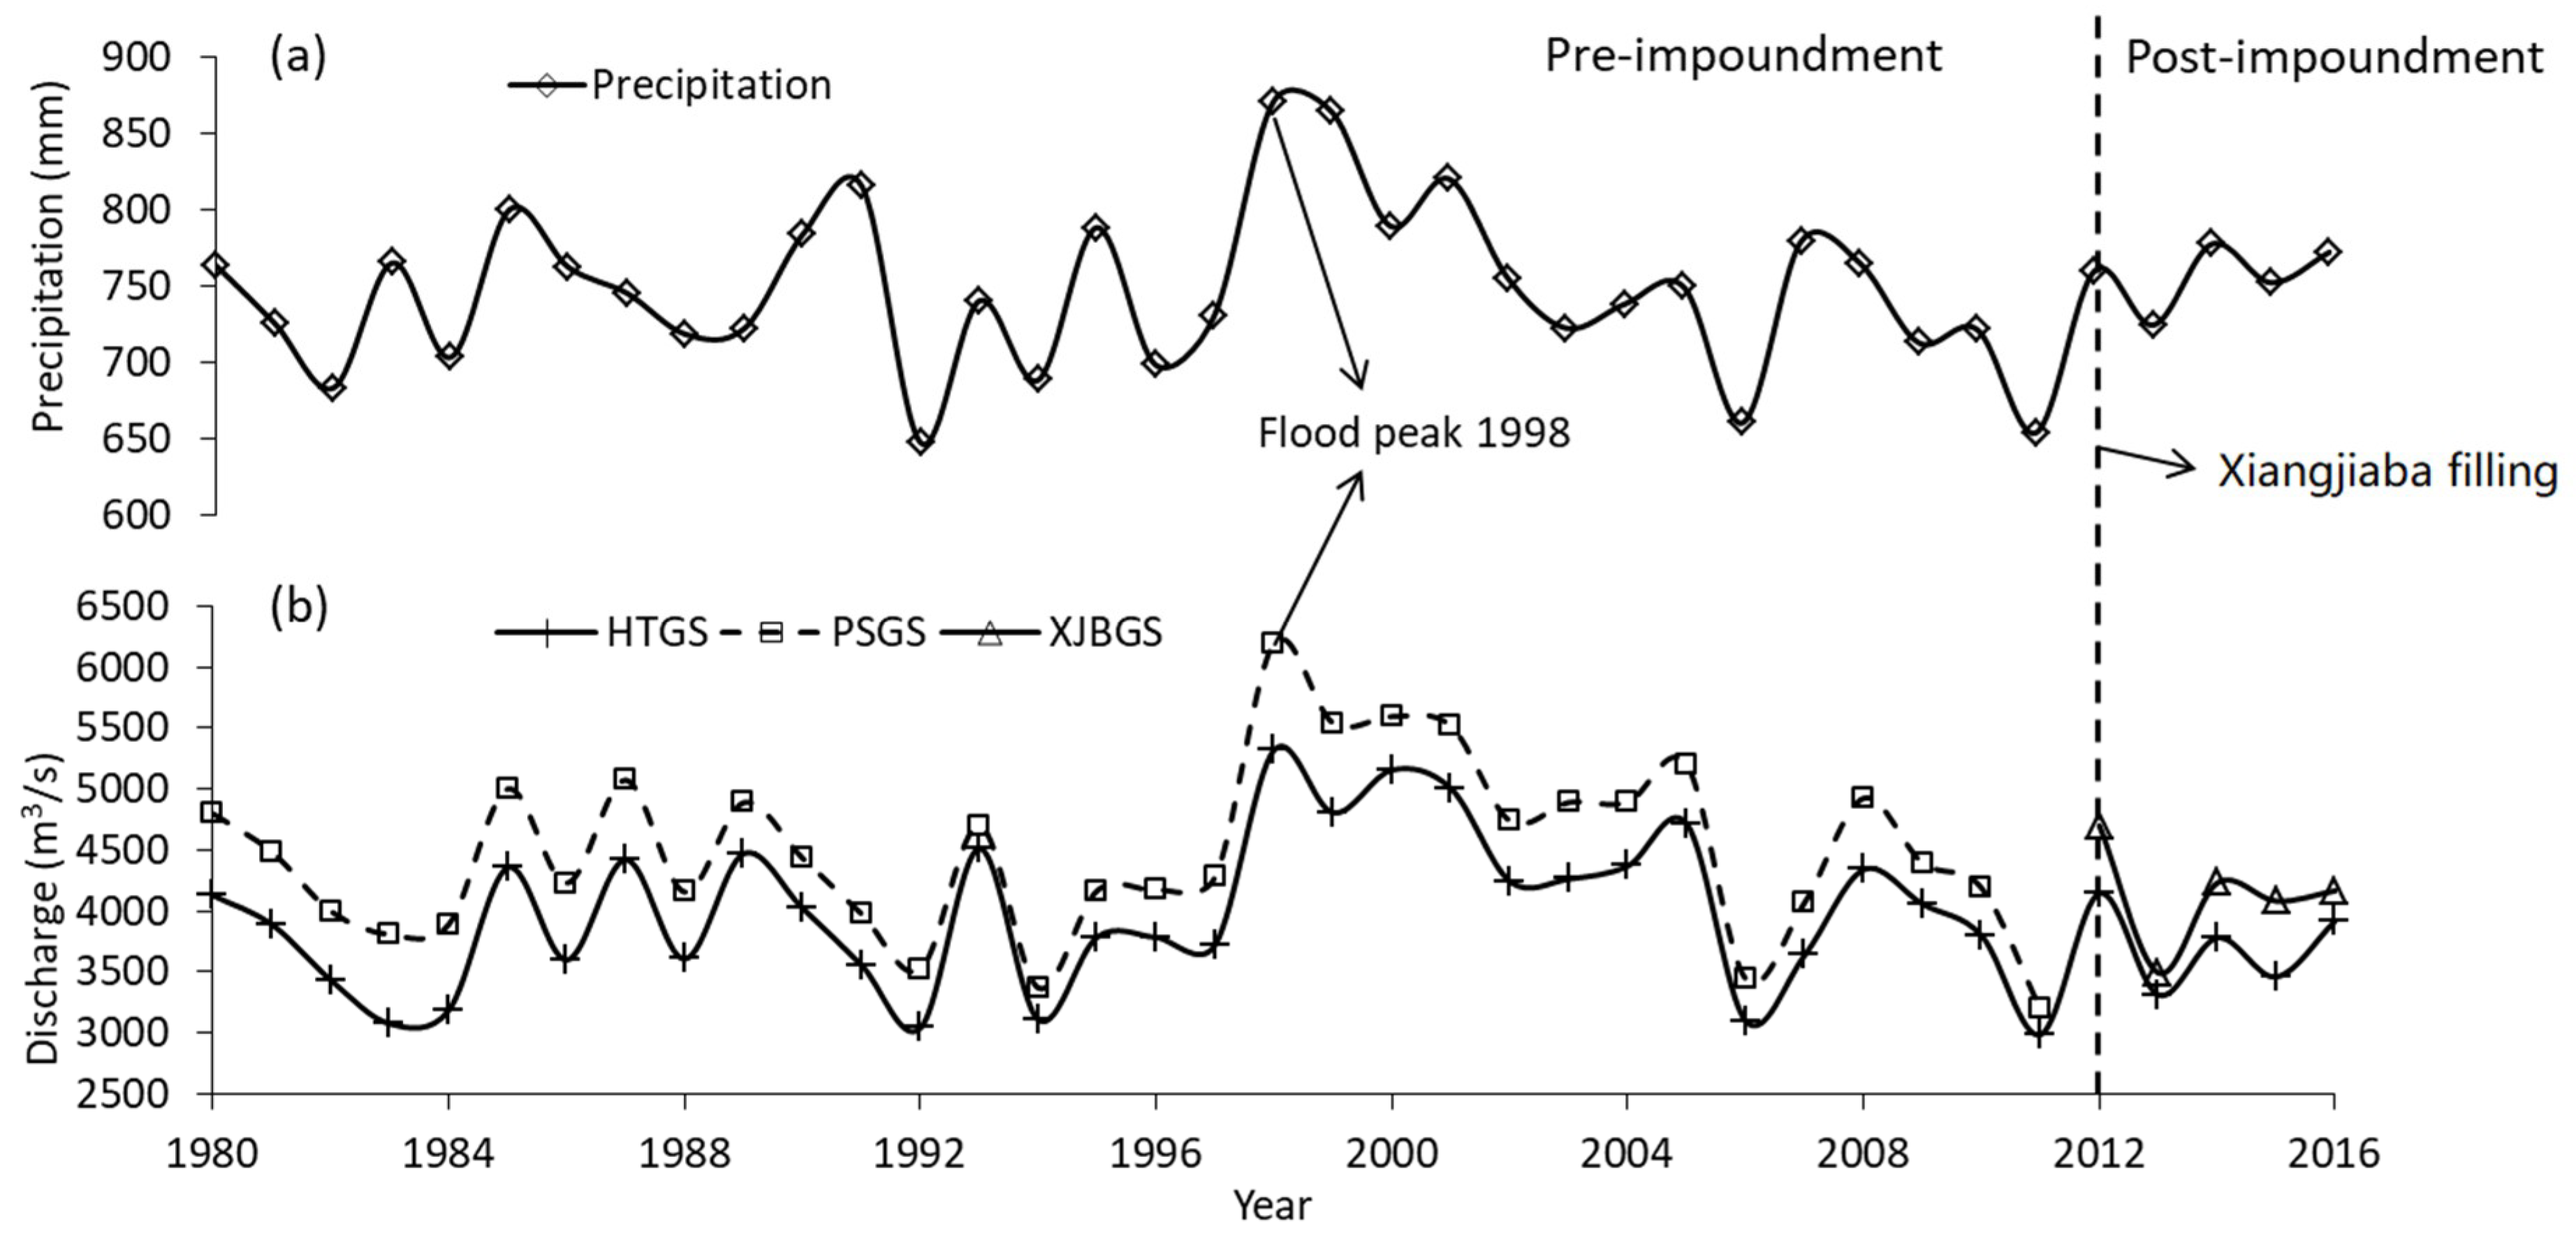
Discharge in the Jinsha River showed pronounced inter-annual variations, which were consistent at both gauging stations (HTGS and PSGS, Figure 2). More than three decades of pre-impoundment observations showed distinct hydro-meteorological dynamics. Between 1980 and 1997, annual mean precipitation and discharge fluctuated from year to year (mean value ± standard deviation: 623 ± 31 mm/year and 4274 ± 487 m3/s, respectively), but had no significant trend. In 1998, precipitation and discharge were maximal and then decreased gradually with significant linear trends until the impoundment of the Xiangjiaba reservoir in 2012. However, no significant abrupt change was detected for precipitation and discharge in the former time series analysis of data from PSGS [45,46]. The increase in precipitation and river discharge conditions in 1998 has been documented as an extreme event (the biggest flood of the Yangtze River in nearly 50 years) in former studies [45]. We consider 1980–2011 to be the pre-impoundment period in our analysis and 2012–2016 to be the post-impoundment period. The annual mean discharge at the upstream and downstream gauging stations was highly correlated during the pre-impoundment period (r2 = 0.95, Pearson’s r = 0.98, p < 0.05). The few data points from the post-impoundment period did not deviate from the regression curve, indicating that the dam’s operation had no significant influence on annual mean discharge. The annual average discharge was correlated with precipitation during the pre-impoundment period (r2 = 0.53, Pearson correlation coefficient r = 0.73, p < 0.05), but discrete points were biased to one side of the regression curve after impoundment (see Figure S6 in Supplementary Information).
3.1.2. Seasonal Discharge Distribution
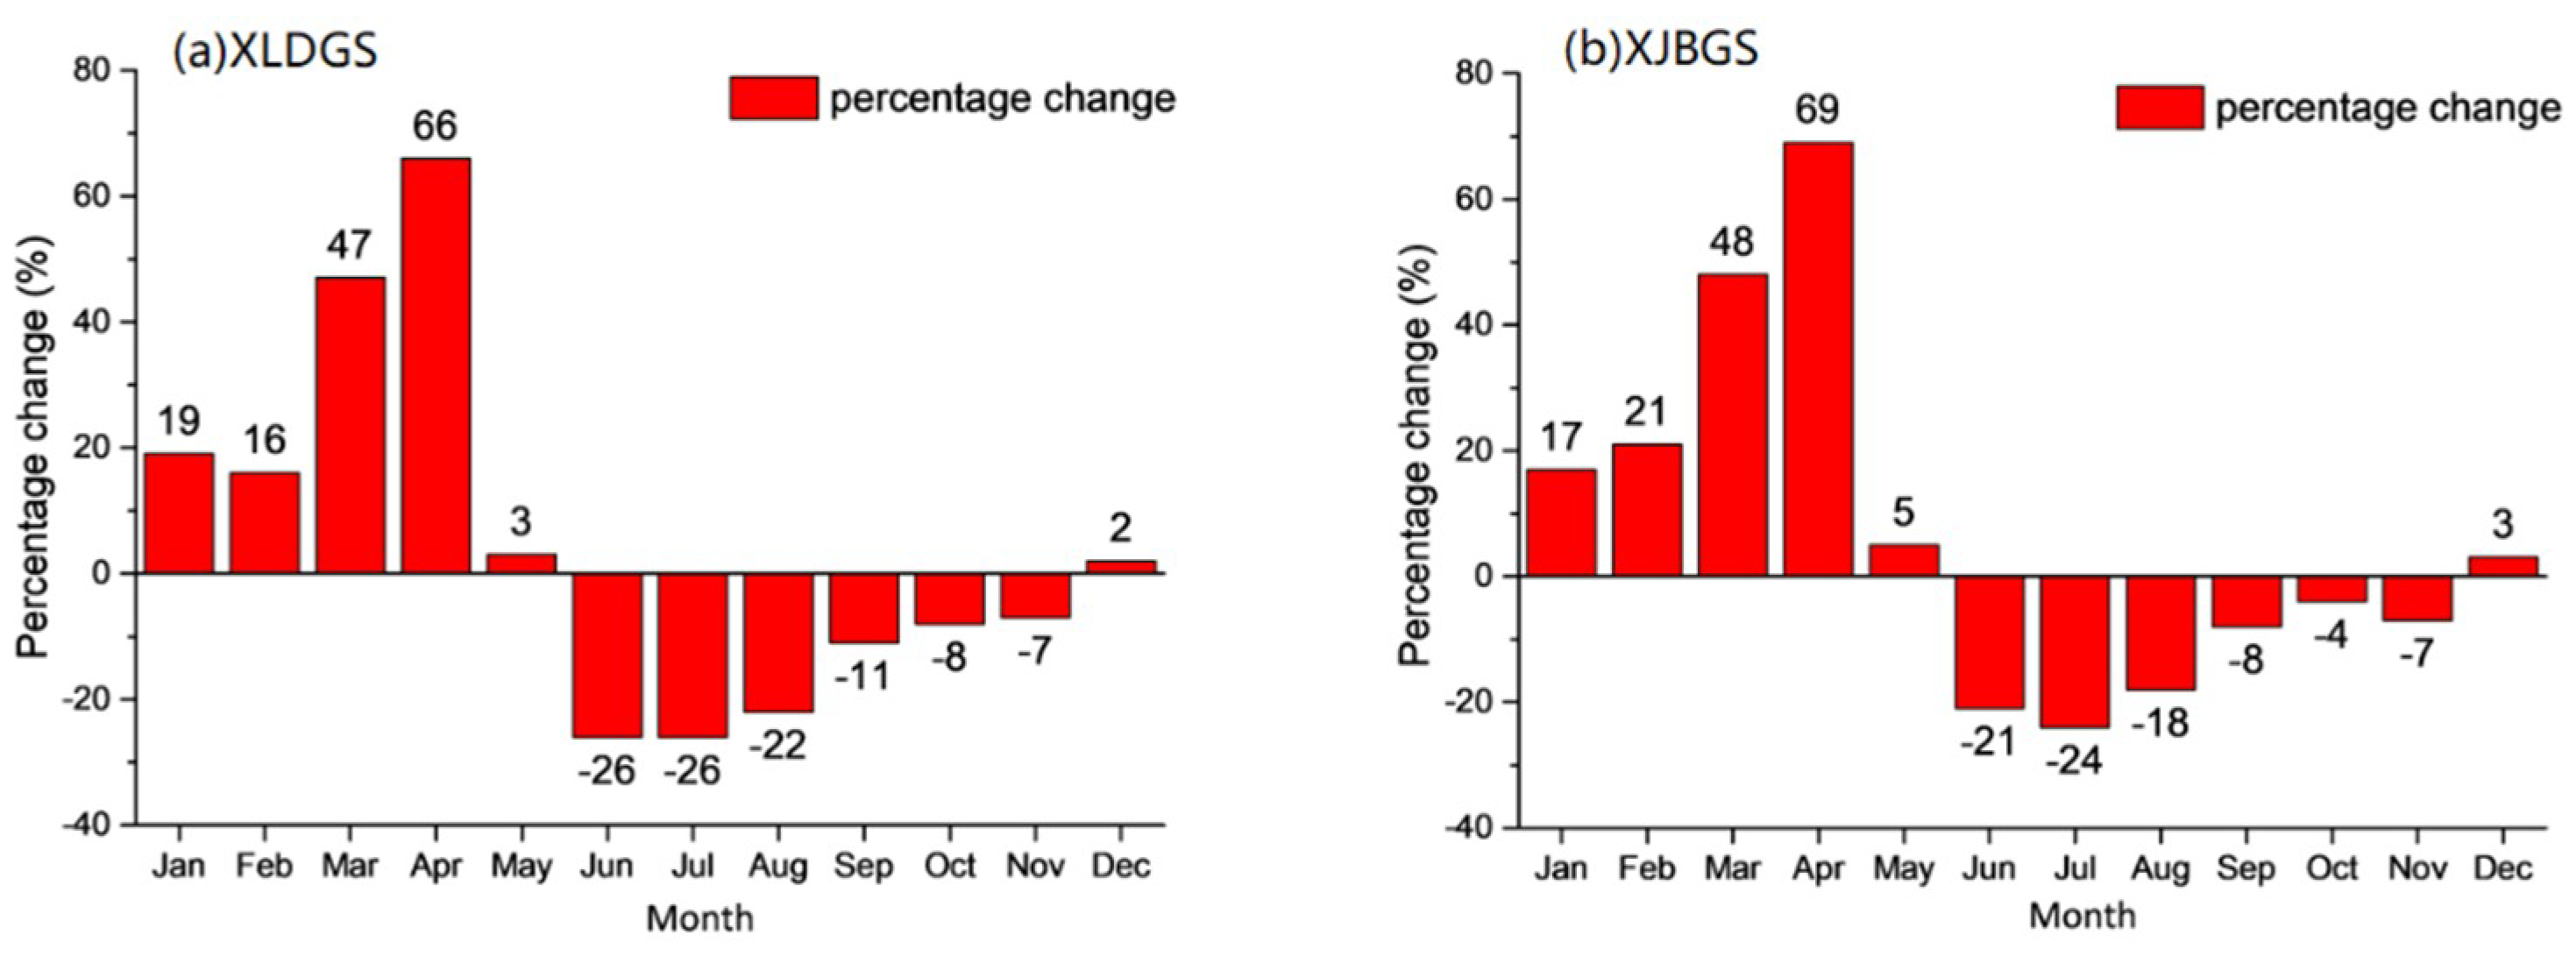
The monthly mean discharge showed pronounced seasonal variations at both gauging stations. During 1980–2011, discharge was typically low, with only small inter-annual variations (1601 ± 294 m3/s) in the dry season (January to April). The highest monthly mean discharge and largest inter-annual discharge variability occurred in July–August (9530 ± 2860 m3/s). Although the number of observations from the post-impoundment period is rather limited and show large inter-annual variability, they indicate a clear modification of the seasonal discharge distribution (Figure 3). While the monthly averaged discharge during the dry season (January to April) were up to 69% higher than that in the pre-impoundment period, the summer discharge (June to September) was exceptionally low and up to 26% lower than the pre-impoundment average. Monthly discharge during May and December did not show pronounced deviations from the longer-term average discharge. The seasonal pattern and magnitude of the post-impoundment discharge anomalies were nearly identical in both reservoirs (Figure 3). This was expected, as the inflow of the Xiangjiaba reservoir is the release of the Xiluodu reservoir, and there are no larger tributaries along this section. Discharge alteration was mainly caused by the larger Xiluodu reservoir, which has a storage volume almost 2.5-fold higher than that of Xiangjiaba reservoir.
3.2. Long-Term Temperature Alterations
3.2.1. Water Temperature Variation
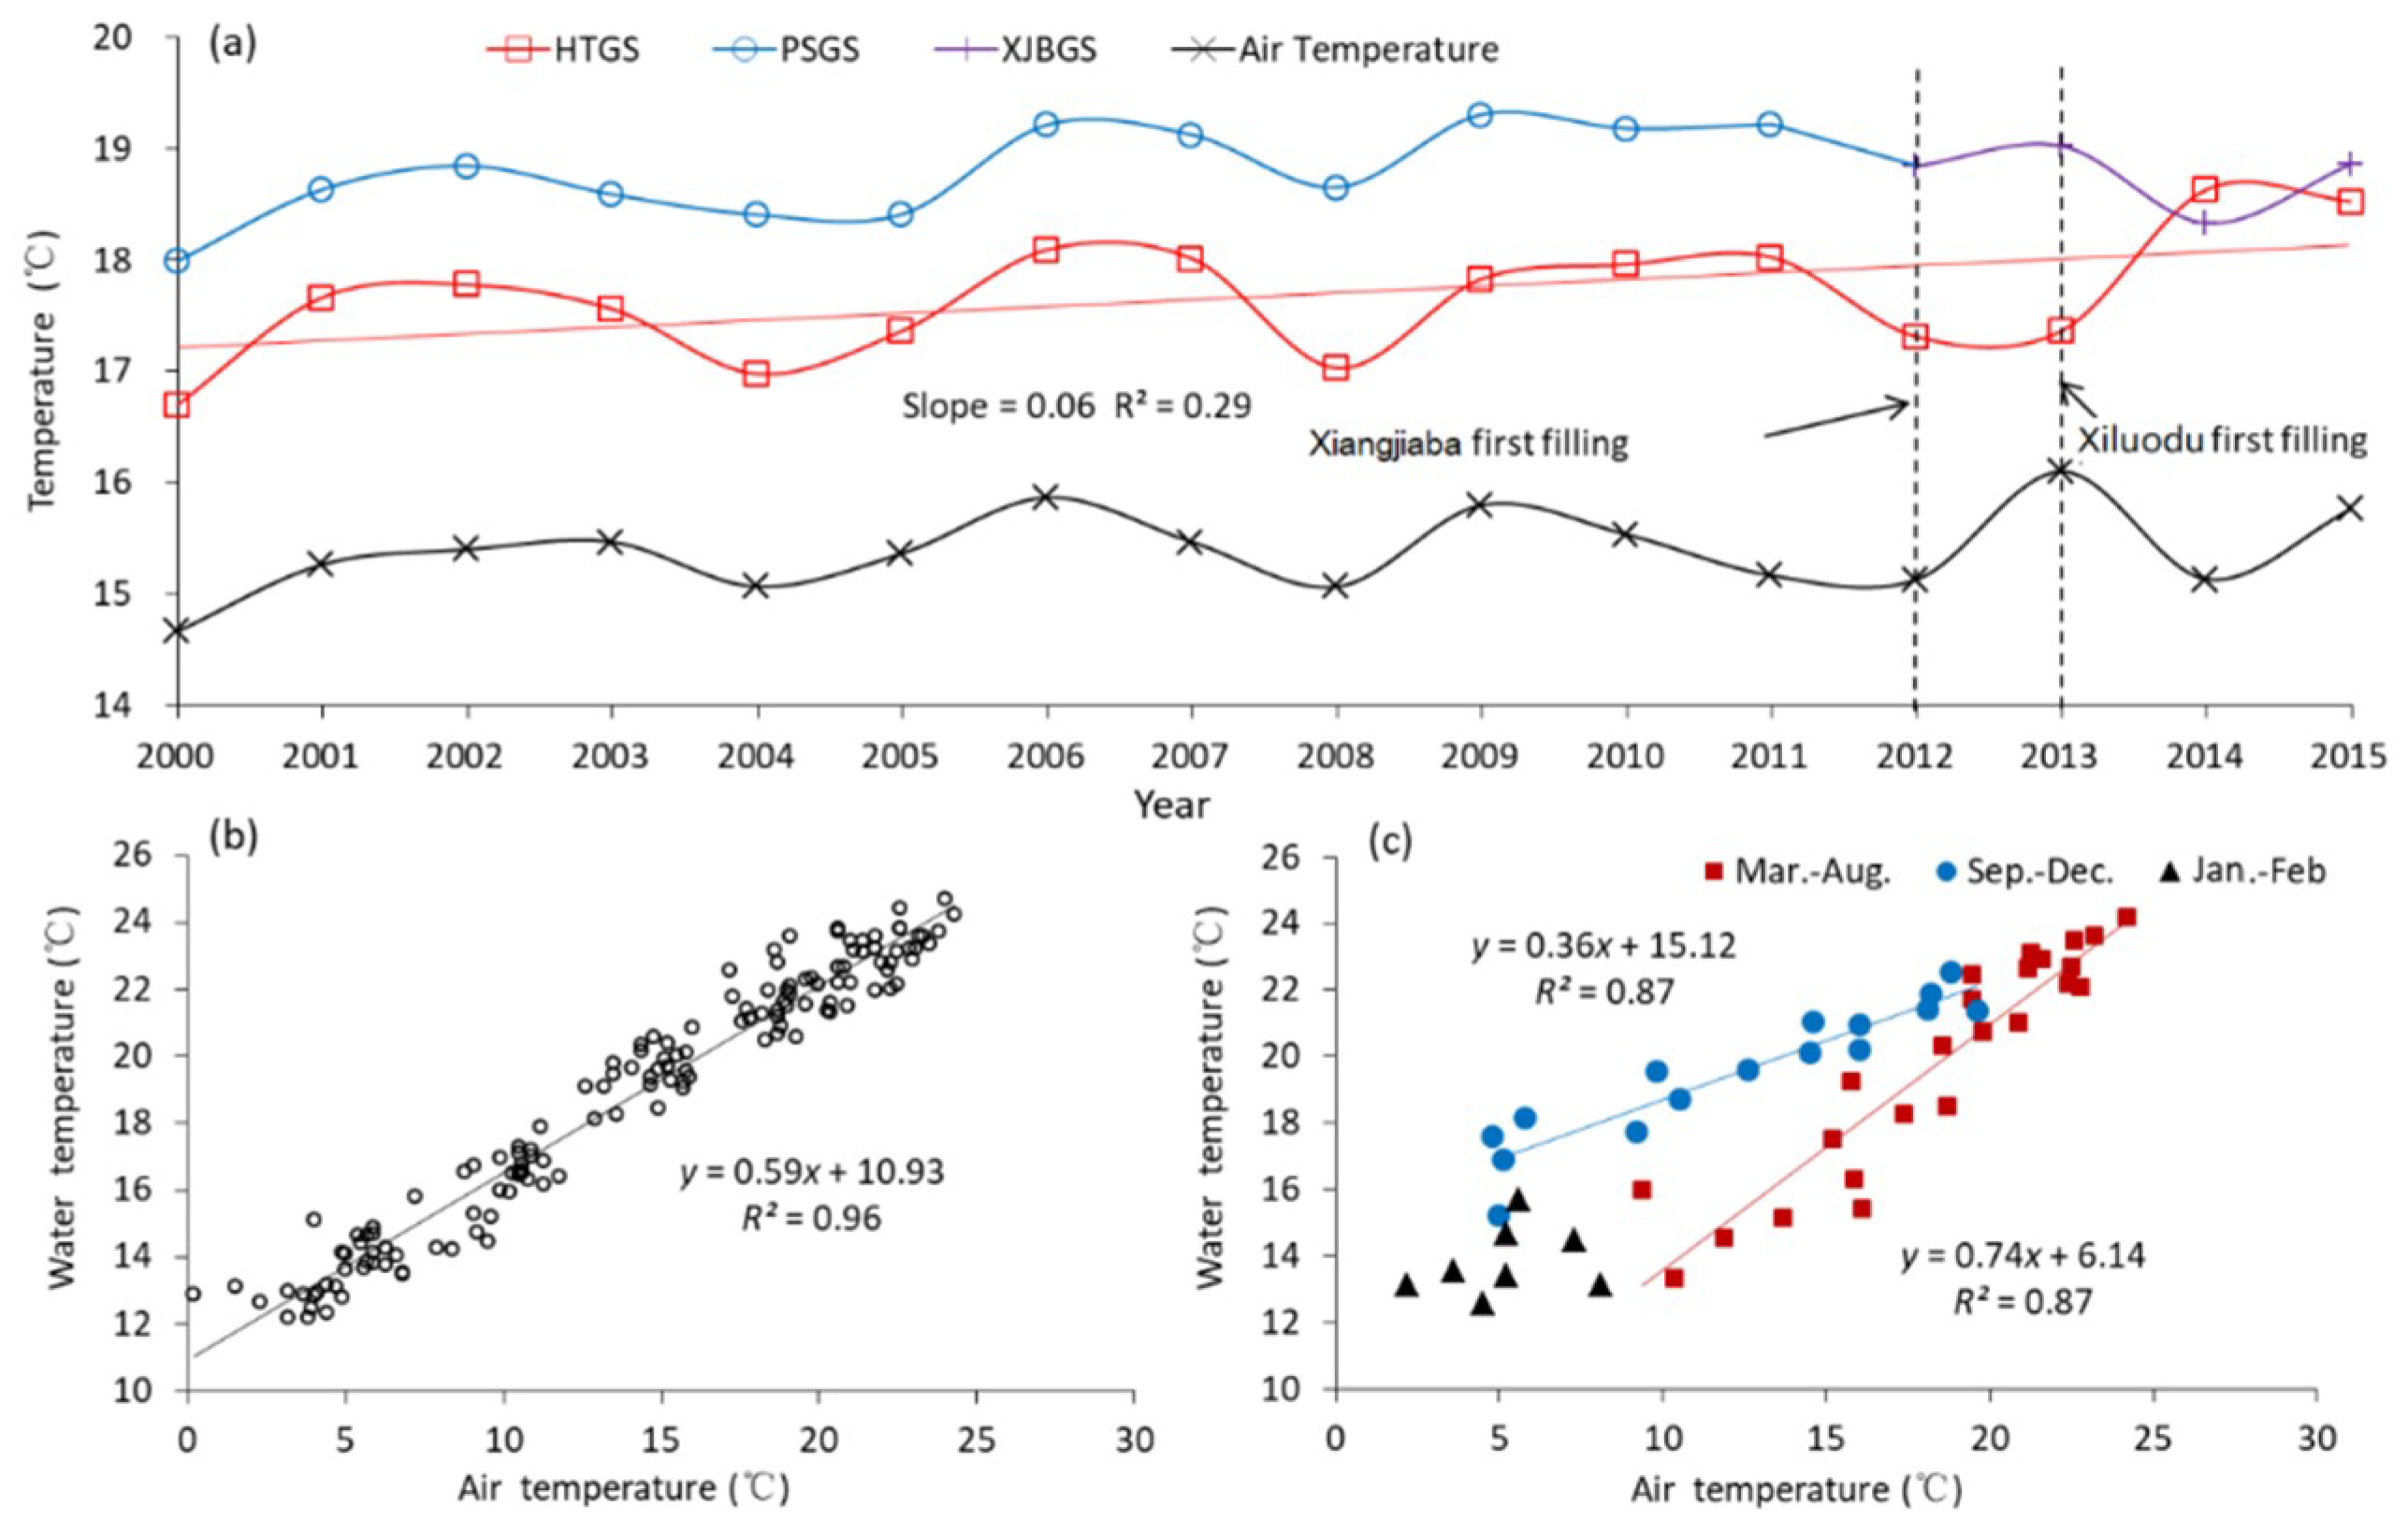
The water temperature in the Jinsha River showed consistent inter-annual variations at both gauging stations, with mean water temperatures of 17.7 ± 0.5 °C and 18.8 ± 0.4 °C at HTGS and PSGS, respectively (Figure 4a). Temperature was increasing at a rate of 0.06 °C/year at HTGS (Person’s r = 0.54, p < 0.05). At the 0.05 level, the temperature trend at PSGS from 1980 to 2015 was not significant, probably because of a slight decrease in mean water temperature after dam construction. Monthly mean water temperature was closely related to air temperature at PSGS (Pearson’s r = 0.98, p < 0.05) during the pre-impoundment period (Figure 4b), but this consistent relationship broke up into two seasonally different linear relationships during the post-impoundment period (Figure 4b,c).
The filling of the Xiluodu reservoir was associated with a rapid drop in water temperature in February and March 2014 (Figure 5), causing the lowest annual minimum temperature within the observation period in 2014 (Figure 4a). The consistent increase in water temperature between the locations of both dams which was evident in the mean water temperature before 2012 was not observed after the filling of both reservoirs (Figure 4).
3.2.2. Seasonal Temperature Variation and Alteration Indices
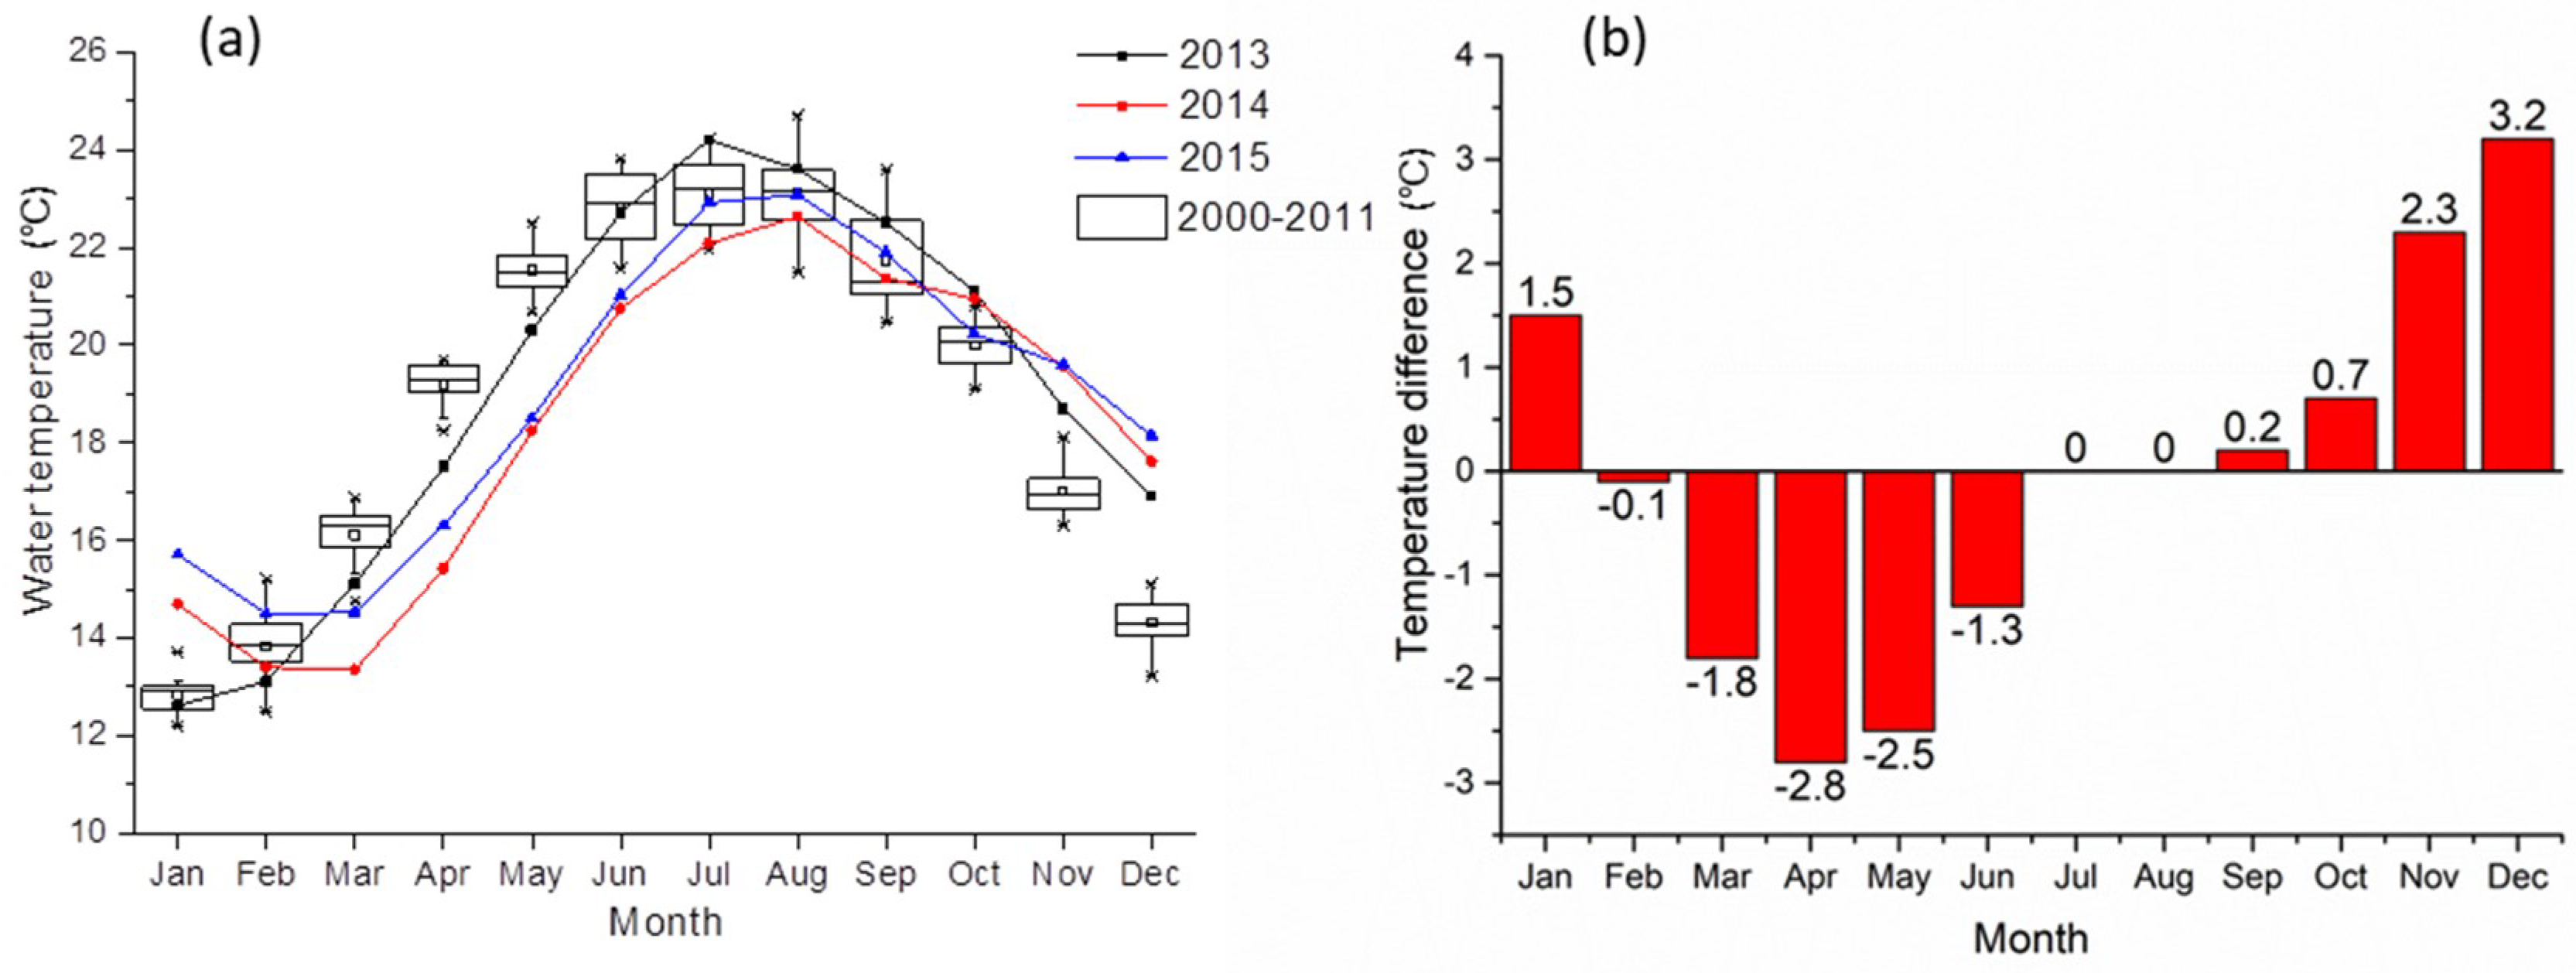
The water temperature followed the seasonal cycle, with the lowest monthly mean temperature in January and highest values in June–August. Before impoundment (2000–2011), the inter-annual variations of monthly mean temperatures were relatively small, mostly within ±1.0 °C (Figure 5a). After impoundment, the observations showed a decrease in the amplitude of seasonal temperature variations (IEC = 0.83–0.92), as well as a delay in the seasonal cycle of the discharge temperature at both dams (Offset-time > 20 d at Xiluodu; Offset-time > 30 d at Xiangjiaba, Table 2). The monthly mean water temperature was reduced (maximum: 2.8 °C) between March and June, and consistently higher (maximum: 3.2 °C) than the long-term monthly average temperature between October and January (Figure 5b). In February and July–September, no great change in water temperature was observed.
In 2013, when only the Xiangjiaba reservoir was in operation, a low baseline deviation index (IBD = 0.12) indicated little alteration in water temperature (Table 2). The extreme fluctuation index was slightly higher than unity (IEC = 1.13), indicating an above average seasonal variation amplitude. Furthermore, the offset-time was about 16 days, which corresponds to the hydraulic residence time of Xiangjiaba reservoir (Table 1). However, after the Xiluodu impoundment (2014 and 2015), the IBD at XLDGS was almost two-fold higher (average 0.21), than during the Xiangjiaba single operation in 2013. The offset time was exceeding 20 days already at the outlet of the Xiluodu reservoir. In the downstream reservoir (XJBGS), both the baseline deviation and the phase shift index increased further from the values at the upstream reservoir (Table 2). Also, the extreme fluctuation index decreased, indicating homogenization of the seasonal temperature cycle. The offset-time at the outlet of the Xiangjiaba reservoir eventually exceeded one month. All indices indicate the cumulative effects of the Xiluodu and Xiangjiaba reservoirs on river water temperature.
3.3. Stratification in the Reservoirs
3.3.1. Stratification Features in the Xiluodu and Xiangjiaba Reservoirs
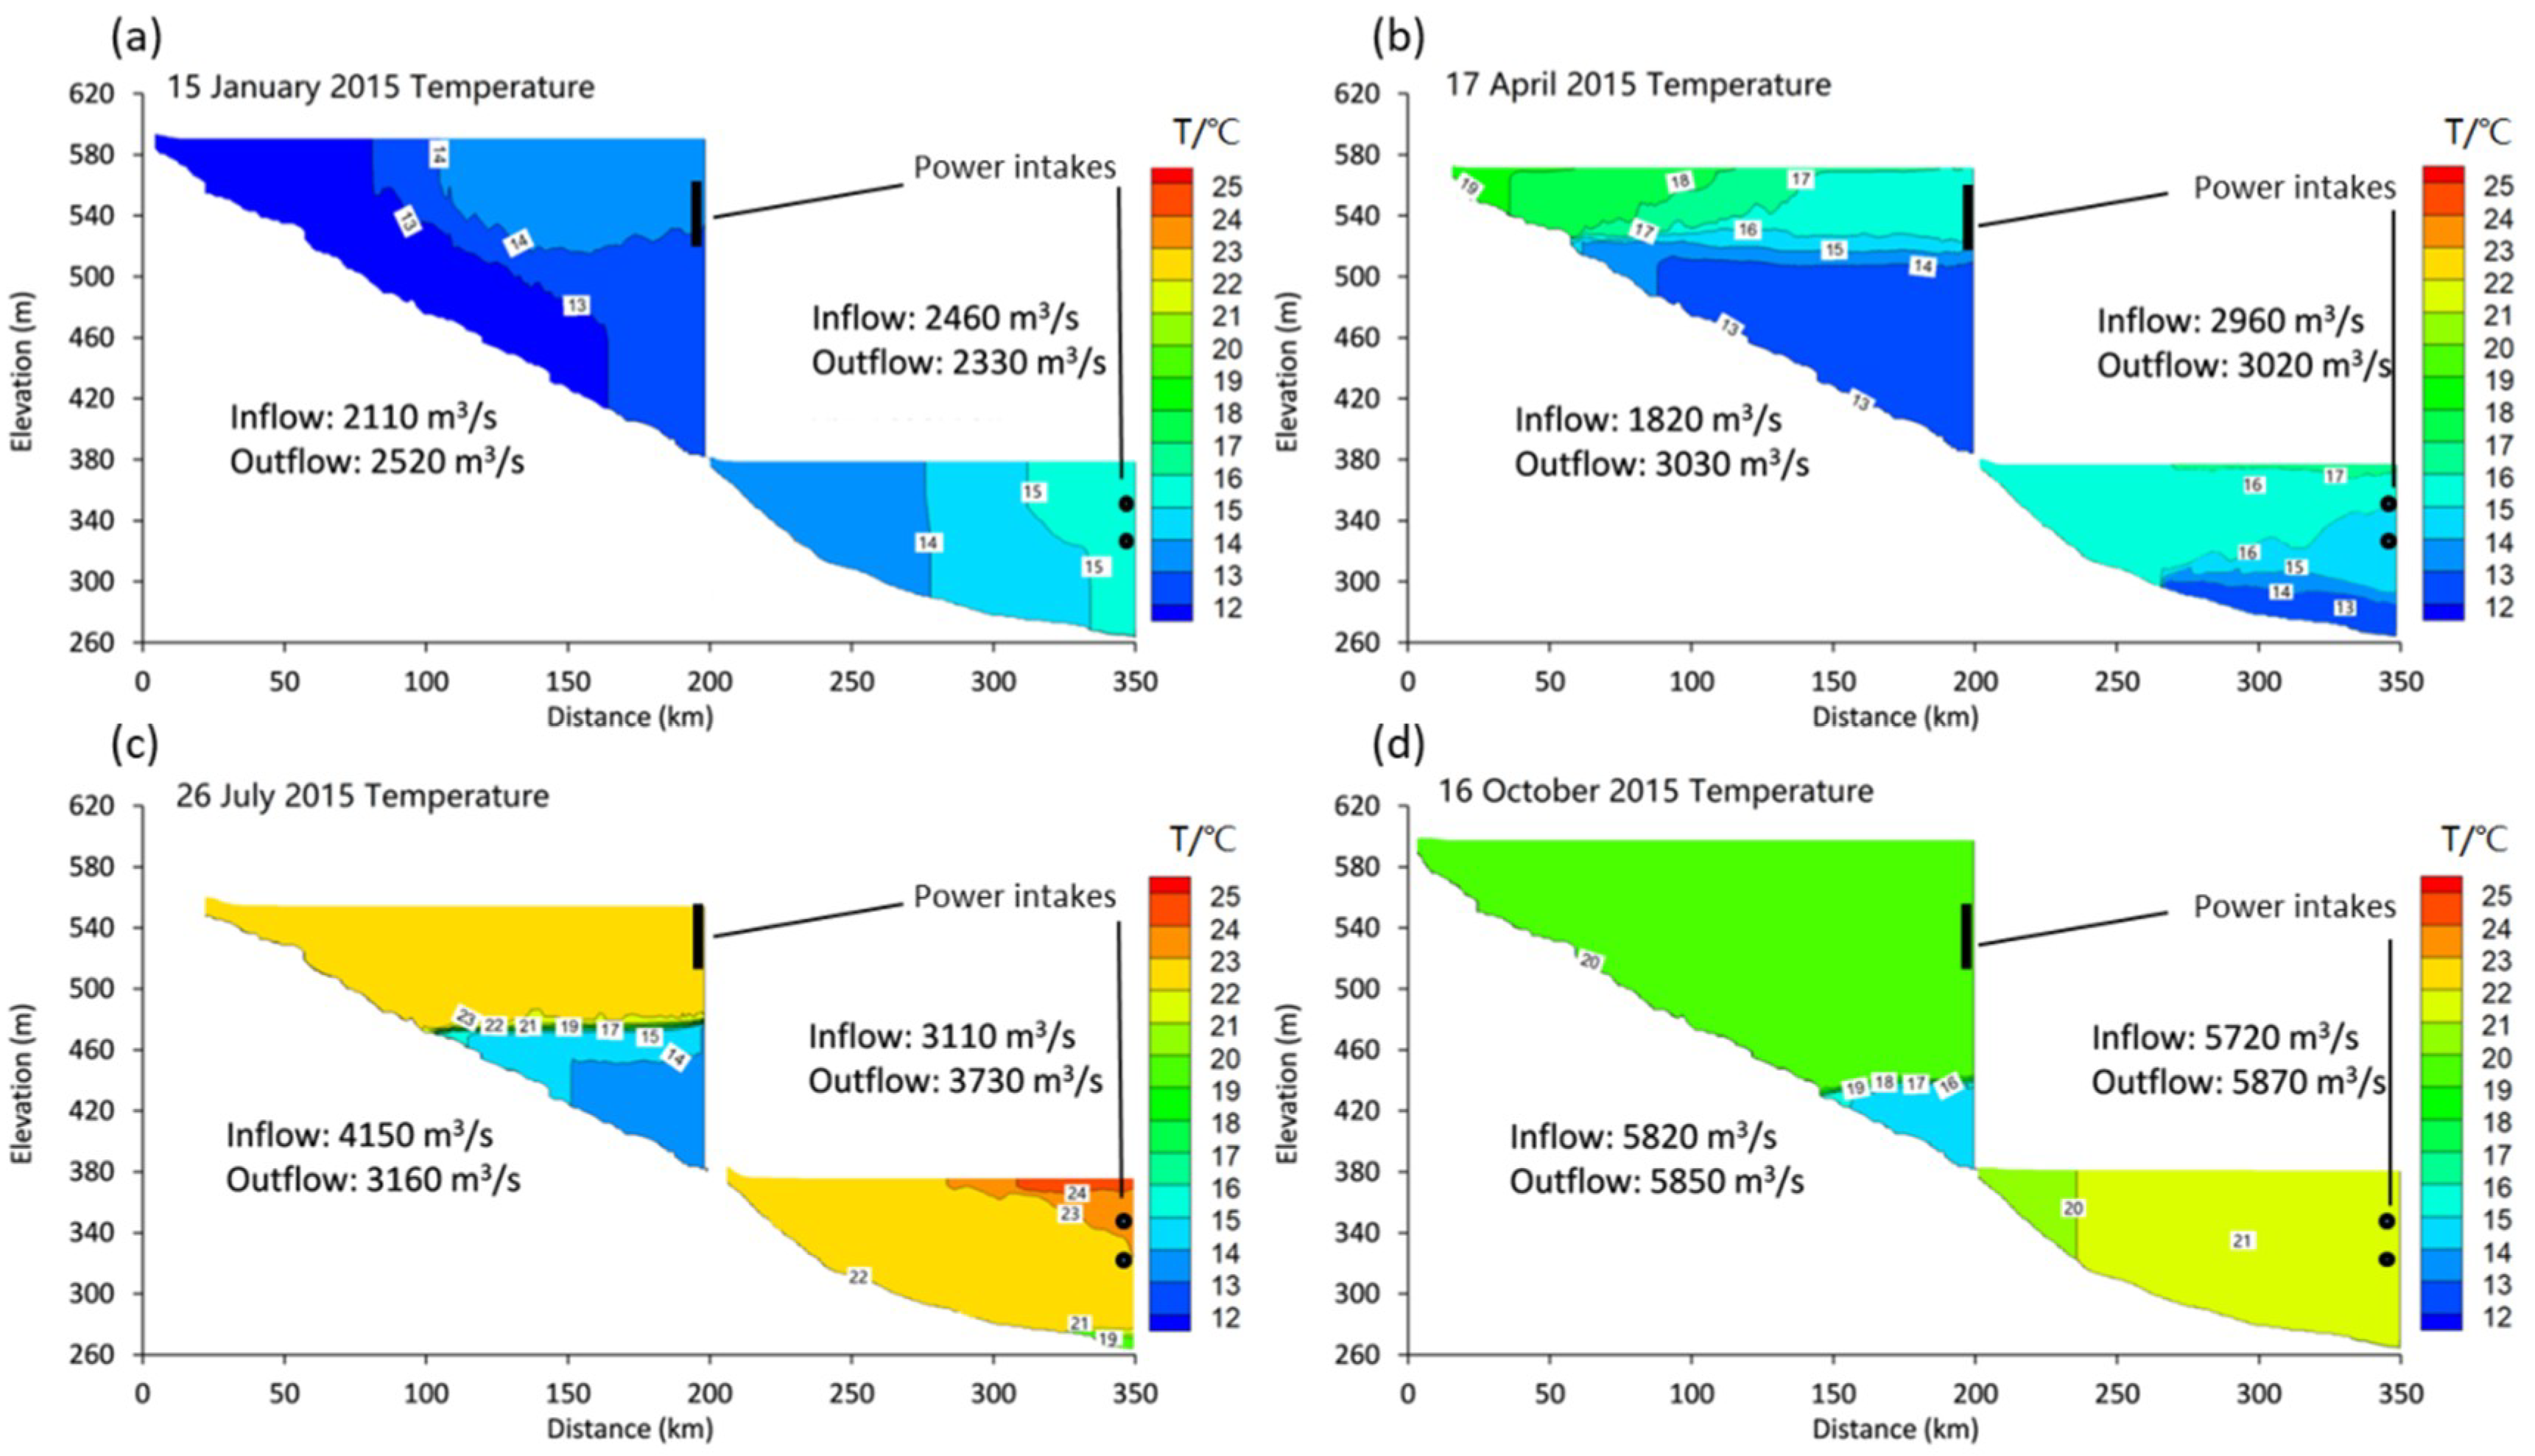
The simulated longitudinal and vertical distribution of water temperature in both reservoirs is shown for four different seasons in Figure 6. The water temperature in the Xiluodu reservoir stratified gradually during the low discharge period in spring, when a thermocline occurred below the elevation of the reservoir outlet (power tunnels, see Figure S1). The surface water warmed up from 13.0 °C in January to 19.5 °C in April. Between April and July, the temperature differences between the epilimnion and hypolimnion slowly increased from 3.6 °C on 17 April to 8.1 °C on 25 July because of further warming of the epilimnion. The epilimnion temperature was highest (23 °C) in June–August, when the reservoir was operated at low water level. After the flood discharge at the beginning of September, when inflow and outflow rates sharply increased to more than 1 × 10⁴ m3/s and water was mainly released through the bottom hole (see Figure S3), the thermocline moved down quickly at a rate of 1.7 m/d, and the hypolimnion shrunk gradually. After October, the inflowing water became colder and formed an underflow, while the surface water temperature decreased more slowly. Ultimately, the water temperature in the entire reservoir became increasingly homogenous in winter.
In the Xiangjiaba reservoir, the vertical temperature stratification was less pronounced. The warmer water released from the epilimnion of the Xiluodu reservoir in winter delayed the seasonal cooling of the water at the Xiangjiaba outflow, and temperature gradients were mainly in the longitudinal direction. During spring, in contrast, the inflow of the Xiangjiaba reservoir was cooler than the river water, causing a delayed warming of the surface water in the Xiangjiaba reservoir and weak vertical temperature stratification. The bottom water heated up quickly by vertical mixing, and the temperature differences between the surface and bottom decreased from 6.1 °C in May to 2.0 °C in July, when the hypolimnion had almost disappeared. The near-surface temperature close to the dam was relatively high due to warming by surface heat fluxes. The vertical temperature gradients disappeared after July and then water temperature gradually decreased from 21 °C to 15 °C during winter.
3.3.2. Influence of the Upstream Reservoir on the Stratification Structure of the Downstream Reservoir
The results presented above suggest that the discharge flow and temperature of the upstream reservoir (Xiluodu) affected the vertical stratification and thermal regimes of the downstream reservoir (Xiangjiaba), by weakening or inhibiting thermal stratification. Without the Xiluodu reservoir, the inflow water temperature of Xiangjiaba would have been warmer in spring and summer and lower in autumn and winter, possibly promoting stronger thermal stratification by forming an overflow and an underflow, respectively. In a hypothetical model scenario, we simulated the variation in the thermal structure of the Xiangjiaba reservoir in 2015 for modified inflow conditions, reflecting the absence of the Xiluodu reservoir. Inflow temperatures were estimated from measurements at HTGS, using the regression equation (TPSGS = 1.0 × THTGS + 1.1 °C). The inflow rate Q was estimated using the formula (QHTGS = 1.1 × QPSGS + 112.1 m3/s), which we derived from the linear trend of the long-term observations (r2 = 0.99).
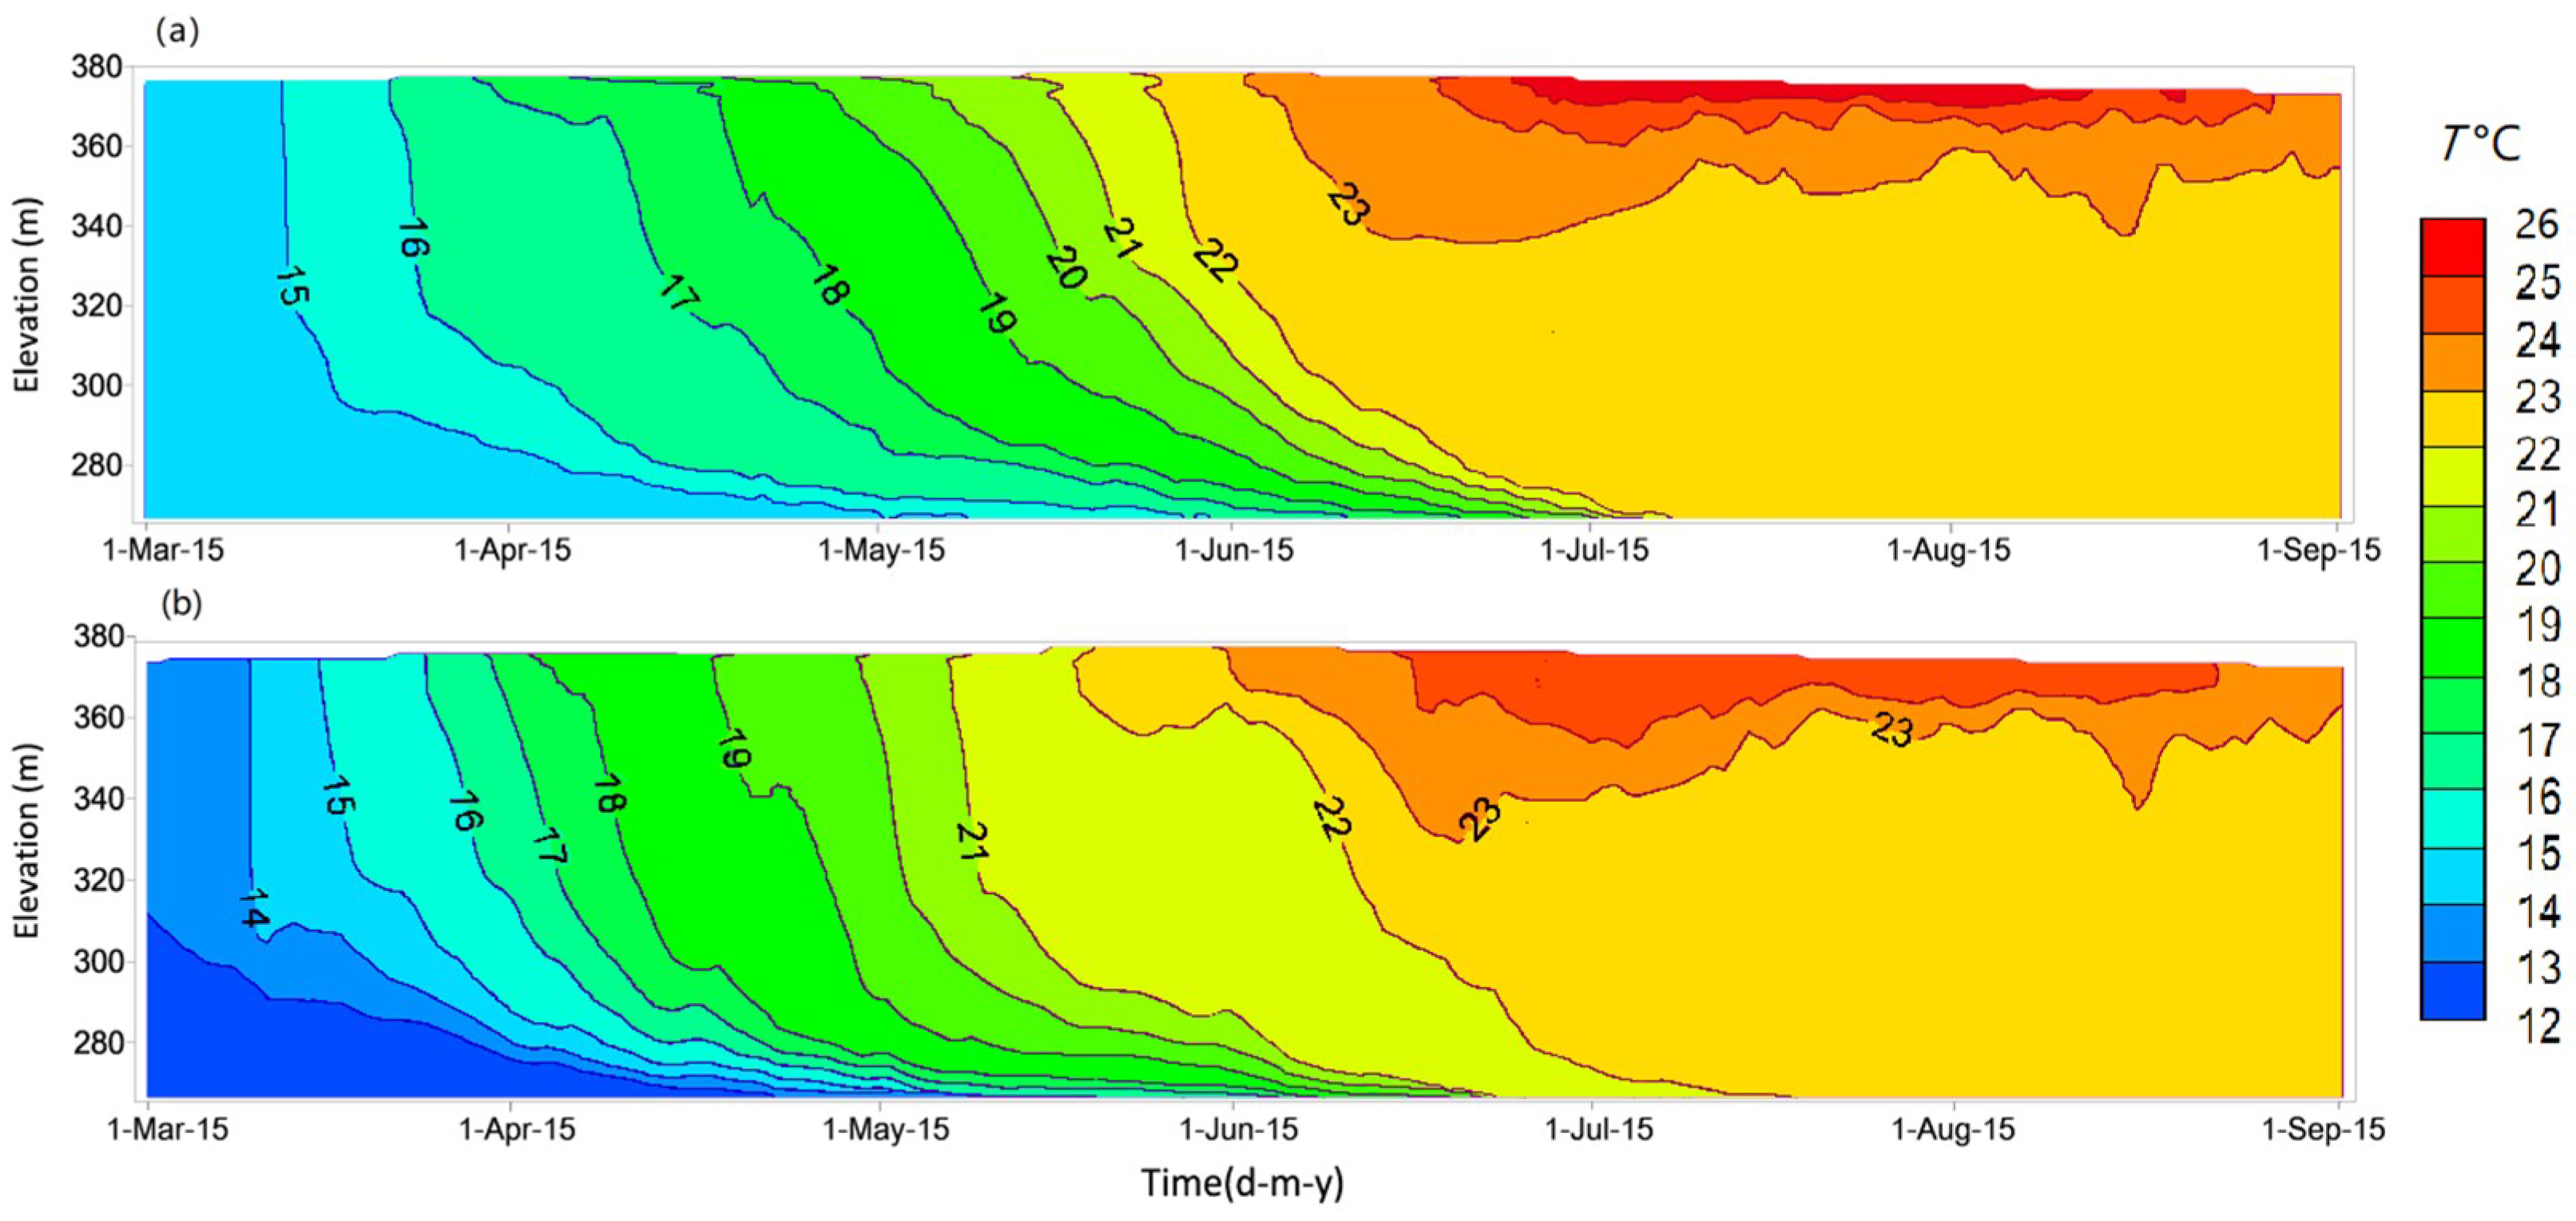
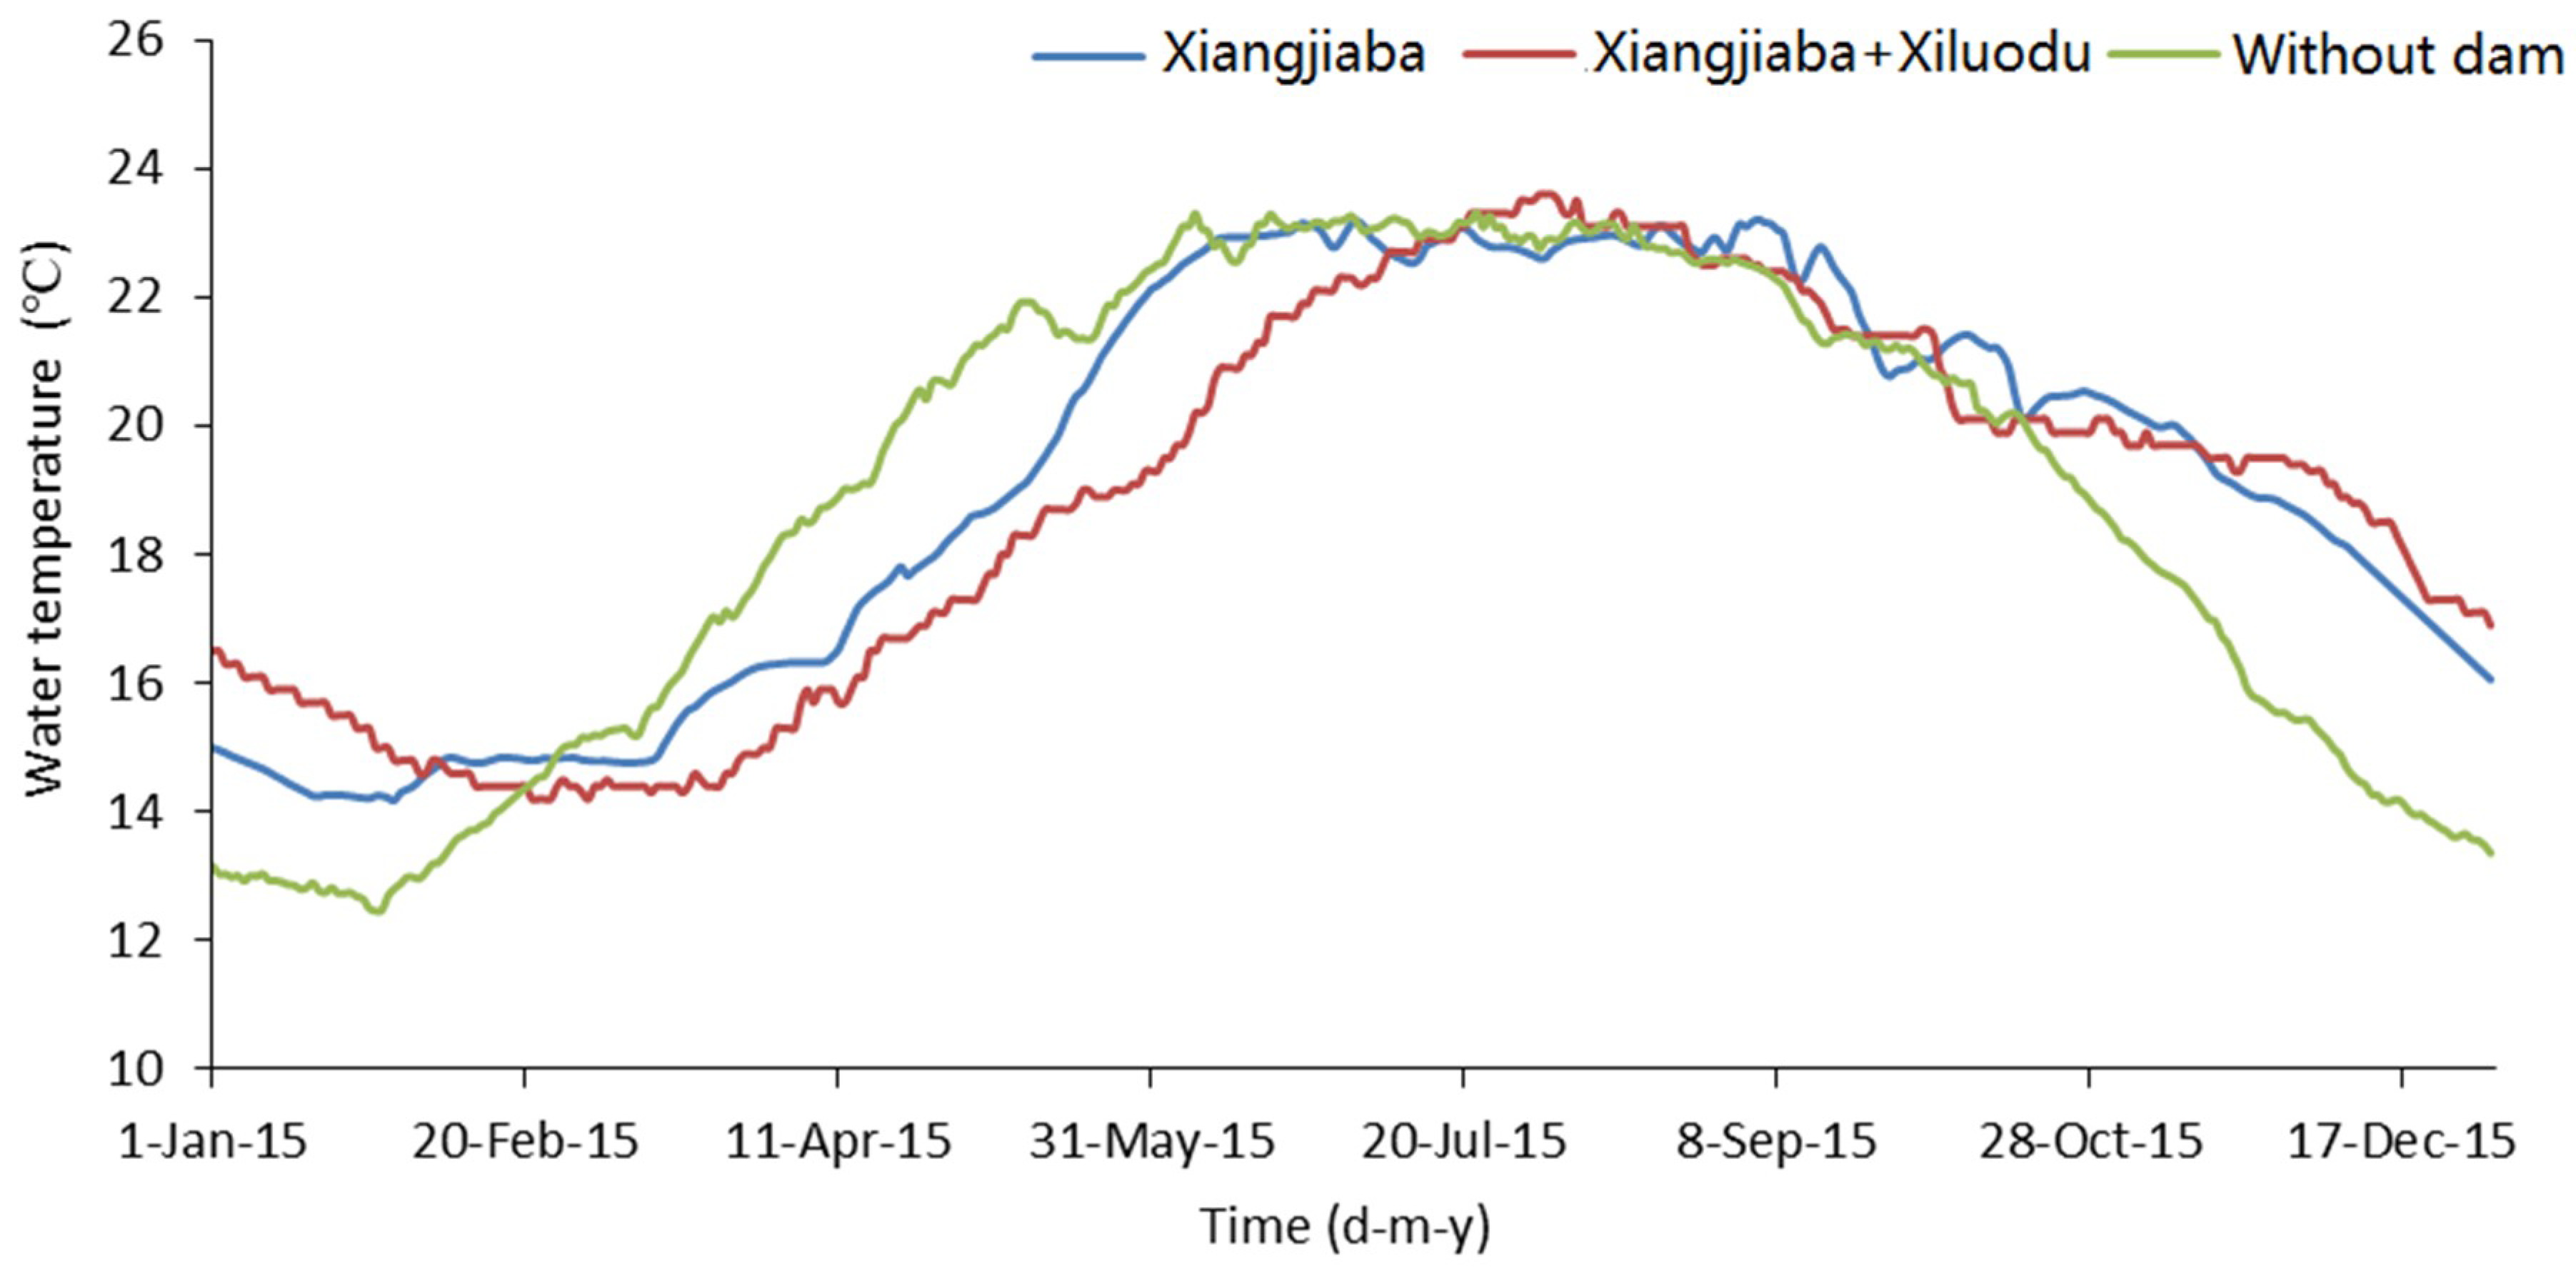
The simulations revealed no obvious differences in the vertical thermal stratification of the Xiangjiaba reservoir, depending on whether the inflowing water was coming from the Jinsha River or from the upstream-located Xiluodu reservoir (Figure 7). One obvious impact of the upstream reservoir, however, is the delay in the seasonal cycle of water temperature, which was verified by field measurement (Table 2). Nevertheless, the simulation confirms the additive effect of both reservoirs for the discharge temperature at the Xiangjiaba reservoir (Figure 8). Without the Xiluodu reservoir, water temperature in April and May is warmer, indicating that spring warming was delayed with Xiluodu operation. In July–September, in contrast, there was no obvious difference in water temperature between the three different situations. The amplitude of the annual temperature fluctuations without the dam (12.5–23.3 °C) were larger than those with Xiangjiaba operation (14.2–23.2 °C) and the joint operation of both reservoirs (14.2–23.6 °C). With only the Xiangjiaba reservoir in operation, the delay in the annual temperature cycle (offset-time) was about 16 days. In the joint operation of both reservoirs, the delay increased to 31–34 days, which is in good agreement with the offset time estimated from time series analysis (Table 2).
4. Discussion
4.1. Effect of Reservoir Construction on River Discharge Dynamics
Construction and operation of the Xiluodu and Xiangjiaba reservoirs caused changes in the seasonal flow variability, with higher discharge during the dry season (up to 50% increase in January–April) and reduced high discharge during the wet season. Although the decrease was only about 25% of the mean summer discharge, the flow decreased by more than 2000 m3/s. Comparable homogenization of the seasonal discharge regime has been observed in other reservoirs [4]. The two reservoirs studied here, however, were only four (Xiangjiaba) and three (Xiluodu) years in operation, and the limited period of observations is certainly too short to derive common quantitative indices describing the degree of alteration in comparison to the complex natural discharge dynamics [47]. An analysis of longer-term flow variability in the Jinsha River revealed pronounced inter-annual variability in discharge, which prior to dam construction was closely correlated with precipitation. In the few years after impoundment, this correlation appeared to be broken, indicating additional effects of the impoundments on longer-term flow variability related to multi-year weather phenomena. In contrast to the annual mean discharge, we found large inter-annual variability in the seasonal discharge distributions after impoundment. For example, exceptionally low discharge in June and August in 2015, as well as in August and September in 2016. It remains unclear whether this variability was related to the initial filling and dam implementation, or if the strong inter-annual discharge variability persists also during regular reservoir operation.
Interestingly, the comparison of the percentage change in the average seasonal discharge distributions at both reservoirs showed that discharge alteration can mainly be attributed to the larger upstream reservoir (Xiluodu), and remained nearly unchanged during the passage through the Xiangjiaba reservoir (weaker water-level fluctuation, Figure S2). Hence, the discharge in the downstream river will mainly be controlled by the Xiluodu reservoir, and the cascading operation of the Xiangjiaba and Xiluodu dams was not cumulative in terms of downstream discharge variations.
4.2. Effect of Reservoir Stratification on River Water Temperature
Most longer-term studies on the thermal impact of reservoirs on river water temperature showed that the main thermal effects of impoundment and regulation are a rise in mean water temperature, reduction in summer maximum temperature, delay in the annual cycle, and reduction in diurnal fluctuation [20,48]. Surprisingly, the effects of the Xiluodu and Xiangjiaba dams on annual mean and maximum temperatures in the downstream river were small and within their inter-annual variability before impoundment. The annual minimum temperature, however, has been increasing during the three years after the initial filling of the Xiluodu reservoir. More pronounced effects have been found for the seasonal temperature cycle. The offset-time of the water temperature was in close agreement with the hydraulic residence time in the Xiangjiaba reservoir. Conversely, in the partially stratified Xiluodu reservoir, the delay of the annual cycle (22 days) was only approximately half of its residence time, due to limited mixing of the inflowing water with the hypolimnion in the reservoir.
Monthly mean water temperature was found to be smaller (average = −2.4 °C) in March–May, and warmer (average = +2.3 °C) in November–January, while during summer the alterations were small (mostly <1 °C). This observation is contrary to many other reservoirs, where cooler water is released during summer [49,50]. For example, summer water temperature decreased by 3 °C after the construction of the Hills Creek Dam [51], and even by 5–6 °C in the regulated Lyon River [50]. The reason for the lower discharge temperature during these studies was thermal stratification of the reservoir and water withdrawal from the hypolimnion. Contrasting patterns, i.e., an increase in the summer discharge temperature, have been observed in reservoirs where the release depth was located in the epilimnion [52].
Discharge temperature can be strongly affected by thermal stratification in reservoirs [20], with larger alterations in the natural temperature regime caused by thermally stratified reservoirs. In accordance with previous numerical simulations of the thermal structure in the Xiluodu reservoir [30], we found seasonal vertical temperature stratification. As analyzed by Xie in greater detail [30], the formation of vertical temperature stratification in Xiluodu is mainly controlled by the temperature of the inflowing water, which supports vertical stratification by forming density currents, i.e., by forming an underflow during winter and a near-surface flow during spring and summer. The strength of the vertical stratification is strongly controlled by the water residence time, as well as by the epilimnetic release depth. In the Xiangjiaba reservoir, in contrast, a strong thermocline did not develop. In addition to a shorter residence time and shallower water depth, the homogenization of the seasonal temperature cycle by the upstream-located Xiluodu reservoir was expected to contribute to the absence of stratification in the Xiangjiaba reservoir. Similarly, a reduction in the thermal stratification along cascading reservoirs, due to the homogenization of inflow temperature, has been found for two reservoirs at the Yalong River [53]. Our scenario simulation for the Xiangjiaba reservoir, however, suggests that thermal stratification was also absent when its inflow temperature was not affected by the Xiluodu reservoir, most likely on account of its short residence time and strong vertical mixing.
4.3. Importance of Cumulative Impacts in Cascading Reservoirs
In contrast to the cumulative effects of cascading dams on downstream water temperature, the discharge in the Jinsha River was mainly affected by the larger, upstream reservoir, with only small additional changes during the passage of the downstream reservoir. Two additional reservoirs, located further upstream of the Xiluodu reservoir, are currently under construction and planned to be put into operation in 2020 and 2022. With discharge being primarily controlled by reservoir operation and management, it remains unclear to what extent the seasonal discharge variations will be affected in the future after completion of the two additional dams.
For the two existing dams, we found cumulative effects for the delay in seasonal water temperature variations. The two additional reservoirs will more than double the existing storage capacity (Table 1) and probably add to the existing alteration of the temperature regime. With dam heights comparable to that of the Xiluodu reservoir and larger storage capacities, the new reservoirs can potentially develop thermal stratification. On the other hand, the changing inflow temperature will probably further weaken the stratification in the Xiluodu reservoir, which is currently strongly affected by density currents formed by the inflowing water.
Comparable observations of alterations in seasonal temperature variations from other cascading reservoirs at large Asian rivers [54,55,56] demonstrate the increasing importance of cascading reservoirs on water temperature dynamics. Besides water temperature, current research aims to understand sediment transport and trapping, greenhouse gas emissions, and pollutant transport along these systems [22,57]. Despite these efforts, existing strategies for the optimization of reservoir operation in terms of minimizing the alterations in natural variations and maintaining the good ecological state of downstream river reaches mostly focus on flow regulation [58,59] and do not include temperature. The measurements and simulations presented here emphasize the two-dimensional nature of temperature dynamics in reservoirs. Thus, at least two-dimensional hydrodynamic models are required to resolve density-driven flows and the longitudinal variations in temperature and vertical stratification along individual and cascading reservoirs. Future research should aim at overcoming the case and site-specific assessments, which are typically associated with such complex simulations, by providing a physical-based framework for assessing and predicting the thermal impacts of reservoirs and reservoir cascades based on bulk parameters. In a simplified approach, the two-dimensional nature of temperature stratification could be described in terms of longitudinal and vertical temperature gradients, which develop as a function of the rate of change of inflow temperature, residence time, surface heat fluxes, and vertical mixing along the reservoirs. In a system-analytical approach, the interactions of individual reservoirs with up- and downstream-located reservoirs and with the atmosphere can be prescribed as annually periodic boundary conditions with amplitude and phase. This approach could potentially be linked to existing frameworks describing the ecological impacts of cascading reservoirs, such as the cascade reservoir continuum concept [60].
Our analysis further revealed the existence of pronounced inter-annual variability in the natural flow and temperature regime in the Jinsha River during the pre-impoundment period. Before impoundment, river discharge was correlated with annual mean precipitation, which varied strongly during the more than 30 years of observation. River water temperature without reservoir operation showed an increasing trend. The observed rate of increase in the mean water temperature during the last ten years before impoundment was 0.06 °C/year, among the highest rates observed globally in aquatic systems [61,62]. These rather rapid climatic changes proceeded in addition to reservoir construction and underlined the importance of also incorporating longer-term variability and trends into assessments and process-based analysis of the hydrological, thermal, and also biogeochemical and ecological impacts of cascading reservoirs.
5. Conclusions
Before dam construction, the annual mean discharge in the lower reaches of the Jinsha River was mainly controlled by precipitation. After 2012, the flow regulation by the newly established cascading reservoirs caused significant changes in the seasonal flow distribution, with higher discharge during the dry season (especially in March and April) and reduced high discharge during the wet season. The discharge in the downstream river was mainly controlled by the upstream Xiluodu reservoir.
Inflow temperature and outflow depth were dominant factors in controlling the thermal structure in both reservoirs, as well as the downstream river water temperature. The Xiluodu reservoir stratified gradually in spring, partially caused by the inflow and longitudinal spreading of warmer water in the upper mixed layer. Vertical temperature stratification disappeared in autumn after continuous deepening of the thermocline during summer. The homogenization of the seasonal temperature cycle by the upstream Xiluodu reservoir had no effect on the temporary development of thermal stratification in the downstream Xiangjiaba reservoir.
Water temperature effects (homogenization and delay in the seasonal cycle) were additive along the two cascading reservoirs, and will probably be exacerbated in upcoming years, with additional reservoirs currently under construction upstream of the two study sites.
Supplementary Materials
The following are available online at https://www.mdpi.com/2073-4441/11/5/1008/s1, Figure S1: Grid geometry of the representation of Xiluodu and Xiangjiaba reservoir in the CE-QUAL-W2 model; Figure S2: (a) Daily mean air temperature and (b) wind speed at SJWS and YSWS meteorological station; Figure S3: Measured inflow, outflow, and water level in Xiluodu reservoir (a) and Xiangjiaba reservoir (b) in 2014–2015; Figure S4: Observed and simulated water level in front of Xiluodu (a) and Xiangjiaba (b) dam; Figure S5: Simulated and observed vertical temperature profiles in Xiangjiaba reservoir (left) and Xiluodu reservoir (right); Figure S6: (a) Discharge measures at PSGS in 1980–2011 and XJBGS in 2012–2016 (x-axis) and HTGS in 1980–2016 (y-axis); (b) Correlation between annual mean precipitation in Jinsha Basin and discharge at the downstream gauging station; Table S1: Summary of hydrological and meteorological data used in this study; Table S2: List of the meteorological stations used in the Jinsha Basin; Table S3: Main hydraulic coefficients in different reservoirs.
Author Contributions
Conceptualization: L.L. and D.L., Investigation: L.L., D.J. and Z.Y., Methodology: L.L. and D.J., Formal analysis: L.L. and A.L., Writing: L.L. All the authors have approved of the submission of this manuscript.
Funding
This study was jointly supported by the Natural Science Foundation of China (grant numbers 91647207 and 51779128), and by the Natural Science and Technology Major Special Program of China (2016YFC05022208).
Acknowledgments
Special thanks to Andreas Lorke for providing instructions and suggestions on this work.
Conflicts of Interest
The authors declare no conflict of interest.
References
- Altinbilek, D. The role of dams in development. Water Sci. Technol. 2002, 45, 169–180. [Google Scholar] [CrossRef]
- Suen, J.P.; Eheart, J.W. Reservoir management to balance ecosystem and human needs: Incorporating the paradigm of the ecological flow regime. Water Resour. Res. 2006, 42, 1–9. [Google Scholar] [CrossRef]
- Bunn, S.E.; Arthington, A.H. Basic principles and ecological consequences of altered flow regimes for aquatic biodiversity. Environ. Manag. 2002, 30, 492–507. [Google Scholar] [CrossRef]
- Poff, N.L.; Olden, J.D.; Merritt, D.M.; Pepin, D.M. Homogenization of regional river dynamics by dams and global biodiversity implications. Proc. Natl. Acad. Sci. USA 2007, 104, 5732–5737. [Google Scholar] [CrossRef] [PubMed] [Green Version]
- Maavara, T.; Parsons, C.T.; Ridenour, C.; Stojanovic, S.; Dürr, H.H.; Powley, H.R.; Van Cappellen, P. Global phosphorus retention by river damming. Proc. Natl. Acad. Sci. USA 2015, 112, 15603–15608. [Google Scholar] [CrossRef] [PubMed] [Green Version]
- Maavara, T.; Lauerwald, R.; Regnier, P.; Van Cappellen, P. Global perturbation of organic carbon cycling by river damming. Nat. Commun. 2017, 8, 15347. [Google Scholar] [CrossRef] [Green Version]
- Barros, N.; Cole, J.J.; Tranvik, L.J.; Prairie, Y.T.; Bastviken, D.; Huszar, V.L.; Del Giorgio, P.; Roland, F. Carbon emission from hydroelectric reservoirs linked to reservoir age and latitude. Nat. Geosci. 2011, 4, 593–596. [Google Scholar] [CrossRef]
- Deemer, B.R.; Harrison, J.A.; Li, S.; Beaulieu, J.J.; DelSontro, T.; Barros, N.; Bezerra-Neto, J.F.; Powers, S.M.; Dos Santos, M.A.; Vonk, J.A. Greenhouse gas emissions from reservoir water surfaces: A new global synthesis. BioScience 2016, 66, 949–964. [Google Scholar] [CrossRef]
- Vörösmarty, C.J.; Meybeck, M.; Fekete, B.; Sharma, K.; Green, P.; Syvitski, J.P. Anthropogenic sediment retention: Major global impact from registered river impoundments. Glob. Planet. Chang. 2003, 39, 169–190. [Google Scholar] [CrossRef]
- Thornton, K.W.; Kimmel, B.L.; Payne, F.E. Reservoir Limnology: Ecological Perspectives; John Wiley & Sons: Hoboken, NJ, USA, 1990. [Google Scholar]
- Agostinho, A.A.; Pelicice, F.M.; Gomes, L.C. Dams and the fish fauna of the Neotropical region: Impacts and management related to diversity and fisheries. Braz. J. Biol. 2008, 68, 1119–1132. [Google Scholar] [CrossRef] [PubMed]
- Casamitjana, X.; Serra, T.; Colomer, J.; Baserba, C.; Pérez-Losada, J. Effects of the water withdrawal in the stratification patterns of a reservoir. Hydrobiologia 2003, 504, 21–28. [Google Scholar] [CrossRef]
- Huang, T.; Li, X.; Rijnaarts, H.; Grotenhuis, T.; Ma, W.; Sun, X.; Xu, J. Effects of storm runoff on the thermal regime and water quality of a deep, stratified reservoir in a temperate monsoon zone, in Northwest China. Sci. Total Environ. 2014, 485, 820–827. [Google Scholar] [CrossRef]
- Moreno-Ostos, E.; Marcé, R.; Ordóñez, J.; Dolz, J.; Armengol, J. Hydraulic management drives heat budgets and temperature trends in a Mediterranean reservoir. Int. Rev. Hydrobiol. 2008, 93, 131–147. [Google Scholar] [CrossRef]
- Elçi, Ş. Effects of thermal stratification and mixing on reservoir water quality. Limnology 2008, 9, 135–142. [Google Scholar] [CrossRef] [Green Version]
- Sharip, Z. Stratification and water quality variations in three large tropical reservoirs. Int. J. Ecol. Environ. Sci. 2017, 43, 175–184. [Google Scholar]
- Maingi, J.K.; Marsh, S.E. Quantifying hydrologic impacts following dam construction along the Tana River, Kenya. J. Arid Environ. 2002, 50, 53–79. [Google Scholar] [CrossRef]
- Jiang, L.; Ban, X.; Wang, X.; Cai, X. Assessment of hydrologic alterations caused by the Three Gorges Dam in the middle and lower reaches of Yangtze River, China. Water 2014, 6, 1419–1434. [Google Scholar] [CrossRef]
- Caissie, D. The thermal regime of rivers: A review. Freshw. Biol. 2006, 51, 1389–1406. [Google Scholar] [CrossRef]
- Olden, J.D.; Naiman, R.J. Incorporating thermal regimes into environmental flows assessments: Modifying dam operations to restore freshwater ecosystem integrity. Freshw. Biol. 2010, 55, 86–107. [Google Scholar] [CrossRef]
- Zarfl, C.; Lumsdon, A.E.; Berlekamp, J.; Tydecks, L.; Tockner, K. A global boom in hydropower dam construction. Aquat. Sci. 2015, 77, 161–170. [Google Scholar] [CrossRef]
- Ouyang, W.; Hao, F.; Song, K.; Zhang, X. Cascade dam-induced hydrological disturbance and environmental impact in the upper stream of the Yellow River. Water Resour. Manag. 2011, 25, 913–927. [Google Scholar] [CrossRef]
- Song, X.; Zhuang, Y.; Wang, X.; Li, E. Combined Effect of Danjiangkou Reservoir and Cascade Reservoirs on Hydrologic Regime Downstream. J. Hydrol. Eng. 2018, 23, 05018008. [Google Scholar] [CrossRef]
- Lauri, H.; Moel, H.D.; Ward, P.; Räsänen, T.; Keskinen, M.; Kummu, M. Future changes in Mekong River hydrology: Impact of climate change and reservoir operation on discharge. Hydrol. Earth Syst. Sci. 2012, 16, 4603–4619. [Google Scholar] [CrossRef]
- Hocking, G.; Straškraba, M. An analysis of the effect of an upstream reservoir by means of a mathematical model of reservoir hydrodynamics. Water Sci. Technol. 1994, 30, 91–98. [Google Scholar] [CrossRef]
- Chen, G.; Fang, X.; Devkota, J. Understanding flow dynamics and density currents in a river-reservoir system under upstream reservoir releases. Hydrol. Sci. J. 2016, 61, 2411–2426. [Google Scholar] [CrossRef]
- Yonghui, Y.; Baiping, Z.; Xiaoding, M.; Peng, M. Large-scale hydroelectric projects and mountain development on the upper Yangtze river. Mt. Res. Dev. 2006, 26, 109–115. [Google Scholar] [CrossRef]
- Yin, Z.J.; Chen, J.; Xu, J.J. Application of multiple environmental flow methods to optimize cascade dams operation in the Lower Jinsha River. In Advanced Materials Research; Trans Tech Publications Ltd.: Cham, Switzerland, 2014; pp. 3057–3064. [Google Scholar]
- Duan, W.; Guo, S.; Wang, J.; Liu, D. Impact of cascaded reservoirs group on flow regime in the middle and lower reaches of the Yangtze River. Water 2016, 8, 218. [Google Scholar] [CrossRef]
- Xie, Q.; Liu, Z.; Fang, X.; Chen, Y.; Li, C.; MacIntyre, S. Understanding the temperature variations and thermal structure of a subtropical deep river-run reservoir before and after impoundment. Water 2017, 9, 603. [Google Scholar] [CrossRef]
- Cheng, F.; Li, W.; Castello, L.; Murphy, B.R.; Xie, S. Potential effects of dam cascade on fish: Lessons from the Yangtze River. Rev. Fish Biol. Fish. 2015, 25, 569–585. [Google Scholar] [CrossRef]
- Ma, Q.; Li, R.; Feng, J.; Lu, J.; Zhou, Q. Cumulative effects of cascade hydropower stations on total dissolved gas supersaturation. Environ. Sci. Pollut. Res. 2018, 25, 13536–13547. [Google Scholar] [CrossRef]
- Dai, S.; Lu, X. Sediment load change in the Yangtze River (Changjiang): A review. Geomorphology 2014, 215, 60–73. [Google Scholar] [CrossRef]
- Huang, X.-R.; Gao, L.-Y.; Yang, P.-P.; Xi, Y.-Y. Cumulative impact of dam constructions on streamflow and sediment regime in lower reaches of the Jinsha River, China. J. Mt. Sci. 2018, 15, 2752–2765. [Google Scholar] [CrossRef]
- Huang, Y.; Zhang, P.; Liu, D.; Yang, Z.; Ji, D. Nutrient spatial pattern of the upstream, mainstream and tributaries of the Three Gorges Reservoir in China. Environ. Monit. Assess. 2014, 186, 6833–6847. [Google Scholar] [CrossRef]
- Song, C.; Zhou, X.; Tang, W. Evaluation indicators for assessing the influence of reservoirs on downstream water temperature. Adv. Water Sci. 2012, 23, 419–426. (In Chinese) [Google Scholar]
- Long, L.; Xu, H.; Ji, D.; Cui, Y.; Liu, D.; Song, L. Characteristic of the water temperature lag in Three Gorges Reservoir and its effect on the water temperature structure of tributaries. Environ. Earth Sci. 2016, 75, 1459. [Google Scholar] [CrossRef]
- Quinn, F.H. Hydraulic residence times for the Laurentian Great Lakes. J. Great Lakes Res. 1992, 18, 22–28. [Google Scholar] [CrossRef]
- Cole, T.M.; Wells, S.A. CE-QUAL-W2: A Two-Dimensional, Laterally Averaged, Hydrodynamic and Water Quality Model, Version 3.5; Army Engineer Waterways Experiment Station Vicksburg Ms Environmental Lab: Vicksburg, MS, USA, 2006. [Google Scholar]
- Kim, D.-K.; Zhang, W.; Watson, S.; Arhonditsis, G.B. A commentary on the modelling of the causal linkages among nutrient loading, harmful algal blooms, and hypoxia patterns in Lake Erie. J. Great Lakes Res. 2014, 40, 117–129. [Google Scholar] [CrossRef]
- Kumar, S.; Godrej, A.; Grizzard, T. Extending Occoquan Reservoir Water Quality Model for Stakeholder Involvement. In Proceedings of the 11th International Conference on Hydroinformatics, New York, NY, USA, 16–21 August 2014. [Google Scholar]
- Gelda, R.K.; Owens, E.M.; Effler, S.W. Calibration, verification, and an application of a two-dimensional hydrothermal model [CE-QUAL-W2 (t)] for Cannonsville Reservoir. Lake Reserv. Manag. 1998, 14, 186–196. [Google Scholar] [CrossRef]
- Kim, Y.; Kim, B. Application of a 2-dimensional water quality model (CE-QUAL-W2) to the turbidity interflow in a deep reservoir (Lake Soyang, Korea). Lake Reserv. Manag. 2006, 22, 213–222. [Google Scholar] [CrossRef]
- Rangel-Peraza, J.; Obregon, O.; Nelson, J.; Williams, G.; De Anda, J.; González-Farías, F.; Miller, J. Modelling approach for characterizing thermal stratification and assessing water quality for a large tropical reservoir. Lakes Reserv. Res. Manag. 2012, 17, 119–129. [Google Scholar] [CrossRef]
- Wang, S.; Zhang, X.; Liu, Z.; Wang, D. Trend analysis of precipitation in the Jinsha River Basin in China. J. Hydrometeorol. 2013, 14, 290–303. [Google Scholar] [CrossRef]
- Li, D.; Lu, X.; Yang, X.; Chen, L.; Lin, L. Sediment load responses to climate variation and cascade reservoirs in the Yangtze River: A case study of the Jinsha River. Geomorphology 2018, 322, 41–52. [Google Scholar] [CrossRef]
- Olden, J.D.; Poff, N. Redundancy and the choice of hydrologic indices for characterizing streamflow regimes. River Res. Appl. 2003, 19, 101–121. [Google Scholar] [CrossRef]
- Webb, B.; Walling, D. Long-term variability in the thermal impact of river impoundment and regulation. Appl. Geogr. 1996, 16, 211–223. [Google Scholar] [CrossRef]
- Preece, R.M.; Jones, H.A. The effect of Keepit Dam on the temperature regime of the Namoi River, Australia. River Res. Appl. 2002, 18, 397–414. [Google Scholar] [CrossRef]
- Jackson, H.; Gibbins, C.; Soulsby, C. Role of discharge and temperature variation in determining invertebrate community structure in a regulated river. River Res. Appl. 2007, 23, 651–669. [Google Scholar] [CrossRef]
- Angilletta, M.J., Jr.; Ashley Steel, E.; Bartz, K.K.; Kingsolver, J.G.; Scheuerell, M.D.; Beckman, B.R.; Crozier, L.G. Big dams and salmon evolution: Changes in thermal regimes and their potential evolutionary consequences. Evol. Appl. 2008, 1, 286–299. [Google Scholar] [CrossRef] [PubMed]
- Lessard, J.L.; Hayes, D.B. Effects of elevated water temperature on fish and macroinvertebrate communities below small dams. River Res. Appl. 2003, 19, 721–732. [Google Scholar] [CrossRef]
- Deng, Y.; Li, J.; Li, K.; Li, R. Cumulative impact of cascade power stations on water temperature. Adv. Water Sci. 2008, 19, 273–297. (In Chinese) [Google Scholar]
- Liu, L.; Chen, K.; Zhang, S. Study on cumu-lative effects of water temperature by cascade hydropower stations built on rivers. J. China Inst. Wa-Ter Resour. Hydropower Res. 2007, 5, 173–180. (In Chinese) [Google Scholar]
- Hao, H.; Deng, Y.; Li, K.; Li, R.; Li, J. Study on water temperature cumulative effects of diversion type cascade development. J. Sichuan Univ. 2009, 41, 29–34. [Google Scholar]
- Zhang, S.; Yan, J.; Li, G. Cumulative effects of cascade development project adjustment on water temperature. J. Hydraul. Eng. 2014, 45, 1336–1343. (In Chinese) [Google Scholar]
- Shi, W.; Chen, Q.; Yi, Q.; Yu, J.; Ji, Y.; Hu, L.; Chen, Y. Carbon emission from cascade reservoirs: Spatial heterogeneity and mechanisms. Environ. Sci. Technol. 2017, 51, 12175–12181. [Google Scholar] [CrossRef]
- Peng, Y.; Ji, C.; Gu, R. A multi-objective optimization model for coordinated regulation of flow and sediment in cascade reservoirs. Water Resour. Manag. 2014, 28, 4019–4033. [Google Scholar] [CrossRef]
- Sabo, J.; Ruhi, A.; Holtgrieve, G.; Elliott, V.; Arias, M.; Ngor, P.B.; Räsänen, T.; Nam, S. Designing river flows to improve food security futures in the Lower Mekong Basin. Science 2017, 358, eaao1053. [Google Scholar] [CrossRef]
- Barbosa, F.; Padisák, J.; Espíndola, E.; Borics, G.; Rocha, O. The cascading reservoir continuum concept (CRCC) and its application to the river Tietê-basin. In Proceedings of the Workshop on Theoretical Reservoir Ecology, São Paulo State, Brazil, 25–30 January 1999. [Google Scholar]
- O’Reilly, C.M.; Sharma, S.; Gray, D.K.; Hampton, S.E.; Read, J.S.; Rowley, R.J.; Schneider, P.; Lenters, J.D.; McIntyre, P.B.; Kraemer, B.M. Rapid and highly variable warming of lake surface waters around the globe. Geophys. Res. Lett. 2015, 42, 10773–10781. [Google Scholar] [CrossRef]
- Arora, R.; Tockner, K.; Venohr, M. Changing river temperatures in northern Germany: Trends and drivers of change. Hydrol. Process. 2016, 30, 3084–3096. [Google Scholar] [CrossRef]
Figure 1.
Map of the lower Jinsha River (black solid line, the flow direction is from south to north) with major tributaries (thin black lines). The inset shows the location of the main map within the Yangtze River basin (blue line) in China (not to scale). Symbols mark the location of the Xiluodu and Xiangjiaba dams, as well as the location of Suijiang weather stations (SJWS) and Yongshan weather station (YSWS), hydrological stations (XJBGS, PSGS, XLDGS, HTGS, see Table S1 for details) and sampling points for field monitoring (P1–P6).

Figure 2.
Time series of annual mean precipitation in the Jinsha River basin (a) and annual mean discharge (b) at gauging stations located upstream (HTGS), and downstream (PSGS, XJBGS) of the two studied reservoirs. The filling of the Xiangjiaba reservoir in 2012 (vertical dashed line) divides the time series into the pre- and post-impoundment periods.

Figure 3.
The seasonal distribution of the mean percentage change of discharge at XLDGS (a) and XJBGS (b) relative to the pre-impoundment period. Percentage change = (monthly mean discharge after impoundment − monthly mean discharge in pre-impoundment period) × 100%/monthly mean discharge in pre-impoundment period.

Figure 4.
(a) Annual mean water temperature at HTGS, PSGS, and XJBGS from 2000 to 2015. Black symbols show the annual mean air temperature in the reservoir basin. Solid lines indicate significant linear trends of mean water temperature at HTGS; (b) Correlation between monthly mean air temperature and water temperature during the pre-impoundment period. The solid line shows a linear regression (according to the equation in the legend); (c) Correlation between monthly mean air temperature and water temperature during the post-impoundment period, with different colors denoting different seasons (see legend). Solid lines show linear regressions (equations provided in legend).

Figure 5.
(a) Box plot of monthly mean water temperature between 2000 and 2011 (pre-impoundment period) at PSGS (see caption of Figure 3 for explanations of the box plot elements). The line plot shows the measured water temperature at XJBGS in 2013–2015 (post-impoundment). (b) Monthly mean temperature difference between the post- and pre-impoundment periods at XJBGS (monthly average temperature in 2013–2015 minus monthly average temperature from 2000 to 2011).

Figure 6.
Simulated vertical and longitudinal distribution of water temperature in Xiluodu and Xiangjiaba reservoirs during (a) winter, (b) spring, (c) summer, and (d) autumn 2015. The location of the turbine intakes as well as in and outflow rates are indicated by labels.
Figure 6.
Simulated vertical and longitudinal distribution of water temperature in Xiluodu and Xiangjiaba reservoirs during (a) winter, (b) spring, (c) summer, and (d) autumn 2015. The location of the turbine intakes as well as in and outflow rates are indicated by labels.

Figure 7.
Contour plots of simulated water temperatures at a cross-section near the Xiangjiaba dam from March to August 2015, with the Xiluodu reservoir (a) and without Xiluodu operation (b).
Figure 7.
Contour plots of simulated water temperatures at a cross-section near the Xiangjiaba dam from March to August 2015, with the Xiluodu reservoir (a) and without Xiluodu operation (b).

Figure 8.
Water temperature of the discharge at the Xiangjiaba reservoir in 2015 for different situations (without dam: average water temperature from 2000 to 2011, Xiangjiaba: the Xiangjiaba dam with river water temperature inflow; Xiangjiaba + Xiluodu: both dams in operation).
Figure 8.
Water temperature of the discharge at the Xiangjiaba reservoir in 2015 for different situations (without dam: average water temperature from 2000 to 2011, Xiangjiaba: the Xiangjiaba dam with river water temperature inflow; Xiangjiaba + Xiluodu: both dams in operation).


Table 1.
Main features of the cascading hydroelectric reservoirs in the lower reaches of Jinsha River (* denotes dams under construction). Dead water level refers to the lowest water level that allows the reservoir to operate under normal operation.
Table 1.
Main features of the cascading hydroelectric reservoirs in the lower reaches of Jinsha River (* denotes dams under construction). Dead water level refers to the lowest water level that allows the reservoir to operate under normal operation.
| Reservoir | Hydropower Capacity (MW) | Dam Height (m) | Normal Water Level (m a.s.l.) | Dead Water Level (m a.s.l.) | Storage Capacity (108 m3) | Hydraulic Residence Time (days) | Operation Year |
|---|---|---|---|---|---|---|---|
| Xiangjiaba | 7750 | 162 | 380 | 370 | 52 | 16 | 2012 |
| Xiluodu | 13,860 | 285.5 | 600 | 540 | 129 | 37 | 2013 |
| Baihetan * | 16,000 | 289 | 820 | 760 | 179 | - | 2022 |
| Wudongde * | 10,200 | 270 | 950 | 920 | 43 | - | 2020 |
Table 2.
Baseline deviation index (IBD, Equation (1)), phase offset time index (IPO, Equation (2)), extreme fluctuation index (IEC, Equation (3)). We considered the monthly average water temperature at PSGS from 2000–2011 as the natural water temperature baseline (pre-impoundment period).
Table 2.
Baseline deviation index (IBD, Equation (1)), phase offset time index (IPO, Equation (2)), extreme fluctuation index (IEC, Equation (3)). We considered the monthly average water temperature at PSGS from 2000–2011 as the natural water temperature baseline (pre-impoundment period).
| Site | Year | IBD | IPO (days) | IEC |
|---|---|---|---|---|
| XLDGS | 2014 | 0.23 | 23 | 0.92 |
| 2015 | 0.19 | 20 | 0.88 | |
| XJBGS | 2013 | 0.12 | 16 | 1.13 |
| 2014 | 0.37 | 34 | 0.90 | |
| 2015 | 0.33 | 31 | 0.83 |
© 2019 by the authors. Licensee MDPI, Basel, Switzerland. This article is an open access article distributed under the terms and conditions of the Creative Commons Attribution (CC BY) license (http://creativecommons.org/licenses/by/4.0/).
Share and Cite
MDPI and ACS Style
Long, L.; Ji, D.; Liu, D.; Yang, Z.; Lorke, A. Effect of Cascading Reservoirs on the Flow Variation and Thermal Regime in the Lower Reaches of the Jinsha River. Water 2019, 11, 1008. https://doi.org/10.3390/w11051008
AMA Style
Long L, Ji D, Liu D, Yang Z, Lorke A. Effect of Cascading Reservoirs on the Flow Variation and Thermal Regime in the Lower Reaches of the Jinsha River. Water. 2019; 11(5):1008. https://doi.org/10.3390/w11051008
Chicago/Turabian StyleLong, Lianghong, Daobin Ji, Defu Liu, Zhengjian Yang, and Andreas Lorke. 2019. "Effect of Cascading Reservoirs on the Flow Variation and Thermal Regime in the Lower Reaches of the Jinsha River" Water 11, no. 5: 1008. https://doi.org/10.3390/w11051008
Note that from the first issue of 2016, this journal uses article numbers instead of page numbers. See further details here.