Article

A Targeted Grouting and Water Blocking Method Based on Hydrological Tracer Testing and Its Engineering Applications

1
Geotechnical and Structural Engineering Research Center, Shandong University, Jinan 250061, China
2
School of Civil Engineering, Shandong University, Jinan 250061, China
3
School of Qilu Transportation, Shandong University, Jinan 250061, China
4
China Resources Cement Company Limited, Nanning 530000, China
*
Authors to whom correspondence should be addressed.
Water 2019, 11(5), 1000; https://doi.org/10.3390/w11051000
Submission received: 26 March 2019 / Revised: 29 April 2019 / Accepted: 9 May 2019 / Published: 13 May 2019
(This article belongs to the Section Hydrology)

Abstract

:
Hydrological tracer testing is an effective way to determine the law of recharge and the transport of groundwater. In karst collapse mine water treatment, the hydrological tracing test can determine information such as the runoff velocity and the pattern of underground runoff, so that targeted grouting becomes possible. In this paper, NaCl was used as a tracer, and the content of the tracer was determined by the chloride ion selective electrode method. The NaCl concentration–time curve was plotted, and we obtained a tracer test method that can determine the runoff of the karst quantificationally. The method can quantificationally obtain the groundwater transport velocity, runoff pattern, and connectivity. This combination of grouting rate, grouting pressure, and setting time realized the localized targeted grouting and achieved a significant water damage control effect.

1. Introduction

The problem of water inrush is one of the most serious and typical geological disasters [1]. Historical data show that more than 50% of water inrush problems occur in karst development areas [2]. Especially in the southwestern part of China, unfavorable karst geological development is extensive, and the problem of inrush water has brought many geological disasters, causing huge economic losses to the country and its people [3,4,5,6,7,8].
In karst areas, the hydrological tracer test has become an effective means to ascertain the groundwater force connection, determine the mainstream guidance of groundwater, and calculate the groundwater flow velocity [9,10,11,12,13]. In the hydrological tracer test, changes in the tracer quantity in underground migration are determined by means of conductivity or titration, and then the underground runoff is determined. However, there are many problems. The electrical conductivity is greatly affected by the ambient temperature, and the nodes of chemical titration are not easy to grasp [14]. Therefore, the selection of a suitable tracer method is very important for determining the hydraulic relationship of underground runoff.
Many scholars have studied the sensitivity of aquifer-based aquifer systems [15,16,17,18,19,20,21]. Lu et al. [22] studied the parameters of a karst aquifer through a hydrological tracer test based on the conductivity effect of NaCl. Yin [23] used CaCl2 and NaCl as tracers to show a water-filled deposit. The tracer test reveals how to select a tracer in order to obtain reliable and stable data. Wang [24] used an automatic conductivity measuring instrument to conduct salt testing in the Babao Reservoir in Yunnan, and compared the difference between the conductivity method and the chemical titration method. Hydrological tracer tests have been widely used to analyze the relationship between different hydrogeological units, the groundwater movement law of karst systems, underground river excretion, and so on [25,26,27,28]. However, there are few related discussions on identifying the groundwater connection type of karst sag mines by using hydrological tracer testing, and applying it to engineering disaster management. In this paper, the chloride ion selective electrode method is introduced, and a quantitative description method of the pipeline fracture groundwater force connection is established and applied to mine water inrush treatment. The method has the advantages of inferring the connectivity of the groundwater flow; clarifying the connection type of the groundwater; optimizing the grouting material, velocity, and pressure according to different connection types; and solving the relationship between the slurry viscosity and diffusion distance. The method realizes the efficient treatment of gushing water in karst depression mines.

2. A Targeted Grouting and Water Blocking Method for Depressed Mines Based on a Hydrological Tracer

At present, although physical detection technology has made great progress, it is only possible to determine the approximate area of the water passage. The drilling often connects with the main pipeline through a crack, and the key to determining whether the water passage can be blocked or not is that the grout enters the water passage pipeline smoothly and has certain anti-erosion ability. This puts higher demands on the choice of grouting materials. If the setting time of the grouting material is too short, the crack is easily blocked. If the setting time of the material is too long, the grouting material does not reach the condensed state when the crack enters the pipeline, which is not conducive to the retention of the grout. Therefore, the hydrological tracer test is used to analyze the relationship between the crack and the water passage, which is of guiding significance for the grouting material. The basic parameter of the tracer test is the groundwater flow velocity, and the groundwater flow state can be judged based on the rising point and the peak of the curve of the concentration time at the recovery point. It is generally assumed that the initial flow rate of the trace element is the maximum flow velocity, vmax, and the flow velocity at the peak occurrence is the average flow velocity, vave. Combined with the wave number and recovery rate of the tracer, the groundwater flow velocity can be qualitatively analyzed so as to analyze the relationship between the fracture and the pipeline. Finally, an anti-scouring grouting material suitable for different water flow speeds and different setting times can be selected to realize the targeted control of the karst water inrush. In addition, the ratio of the injection point to the recovery point can determine the proportion of the connected fracture (effective fracture), which has a certain guiding significance for single-hole grouting.

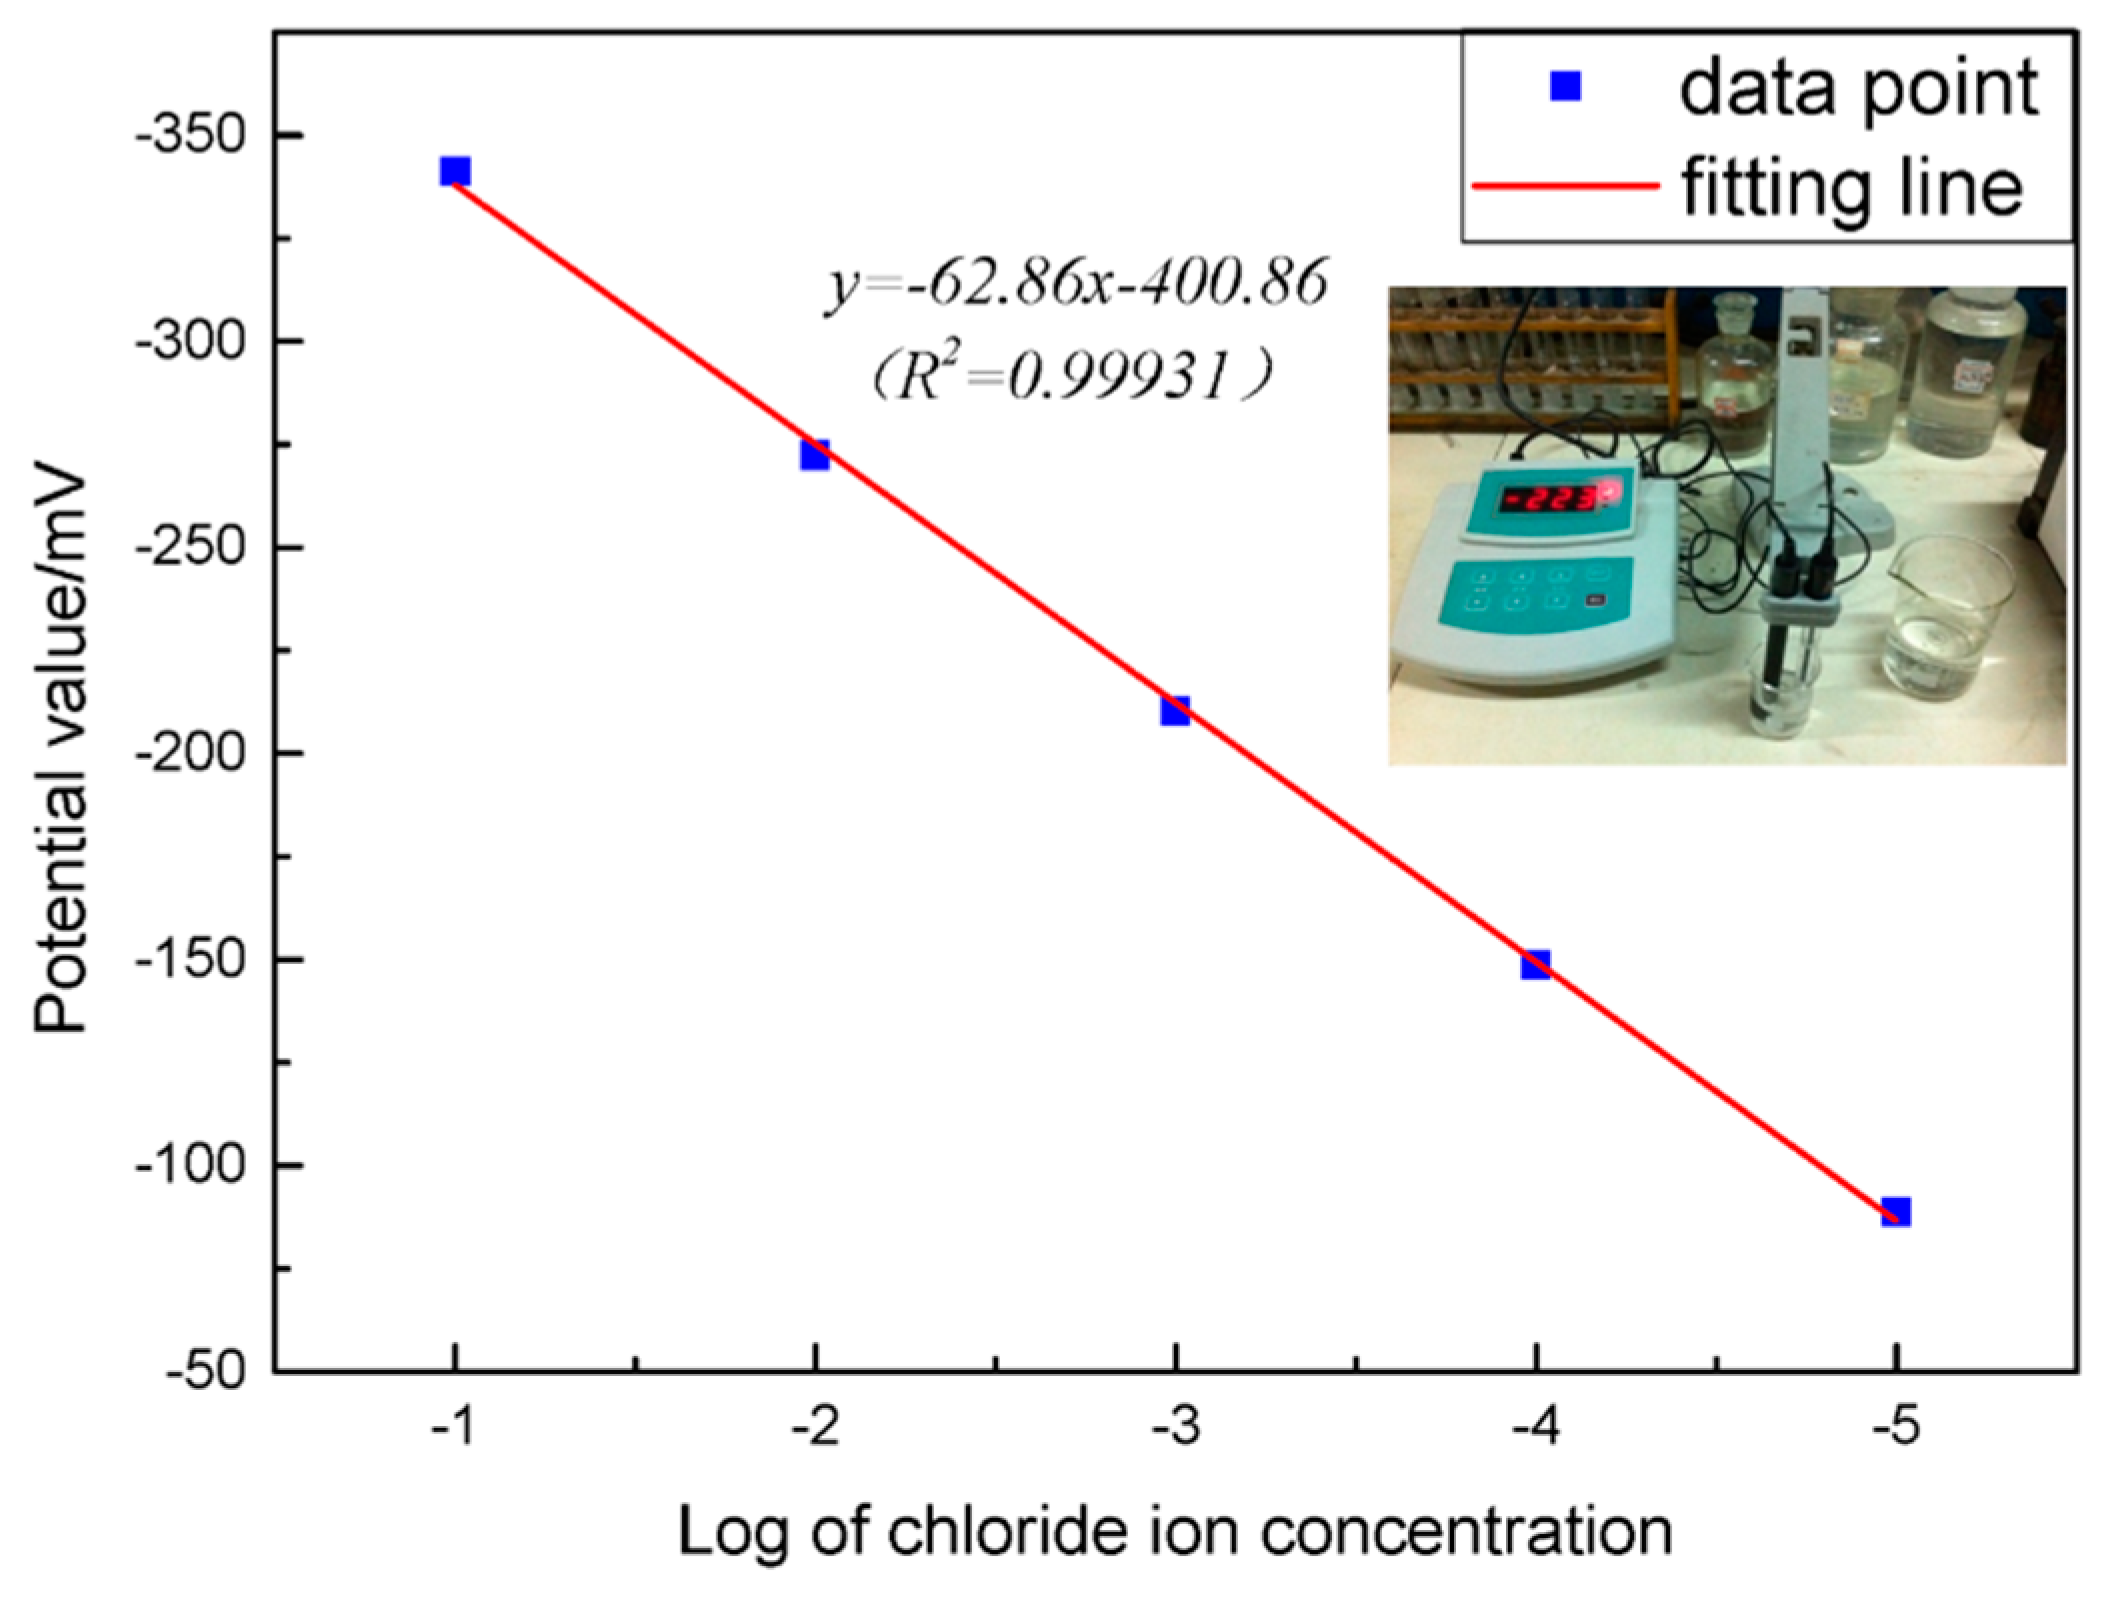
2.1. Determining the Chloride Ion Selective Electrode Parameters

In this test, the chloride ion selective electrode method was used to determine the content of chloride ions in the slurry. The principle is that different chloride ion concentrations correspond to different potentials. After the calibration of the sodium chloride standard solution, a linear correlation line, the calibration line, was obtained. The direction was determined by the difference in the chloride ion concentration corresponding to the potential difference.
The chloride ion selective electrode used in this experiment has a measurement range of 10−1–5 × 10⁻⁵ mol/L, and the reference electrode was a K2SO4 electrode (K2SO4 saturated solution). The electrode was calibrated using a standard solution to obtain a fitting curve of “E-lgCcl” (Figure 1), y = −62.86x − 400.86, and the sample obtained at the water outlet point was filtered and the corresponding potential value was measured so as to determine the concentration value of NaCl.

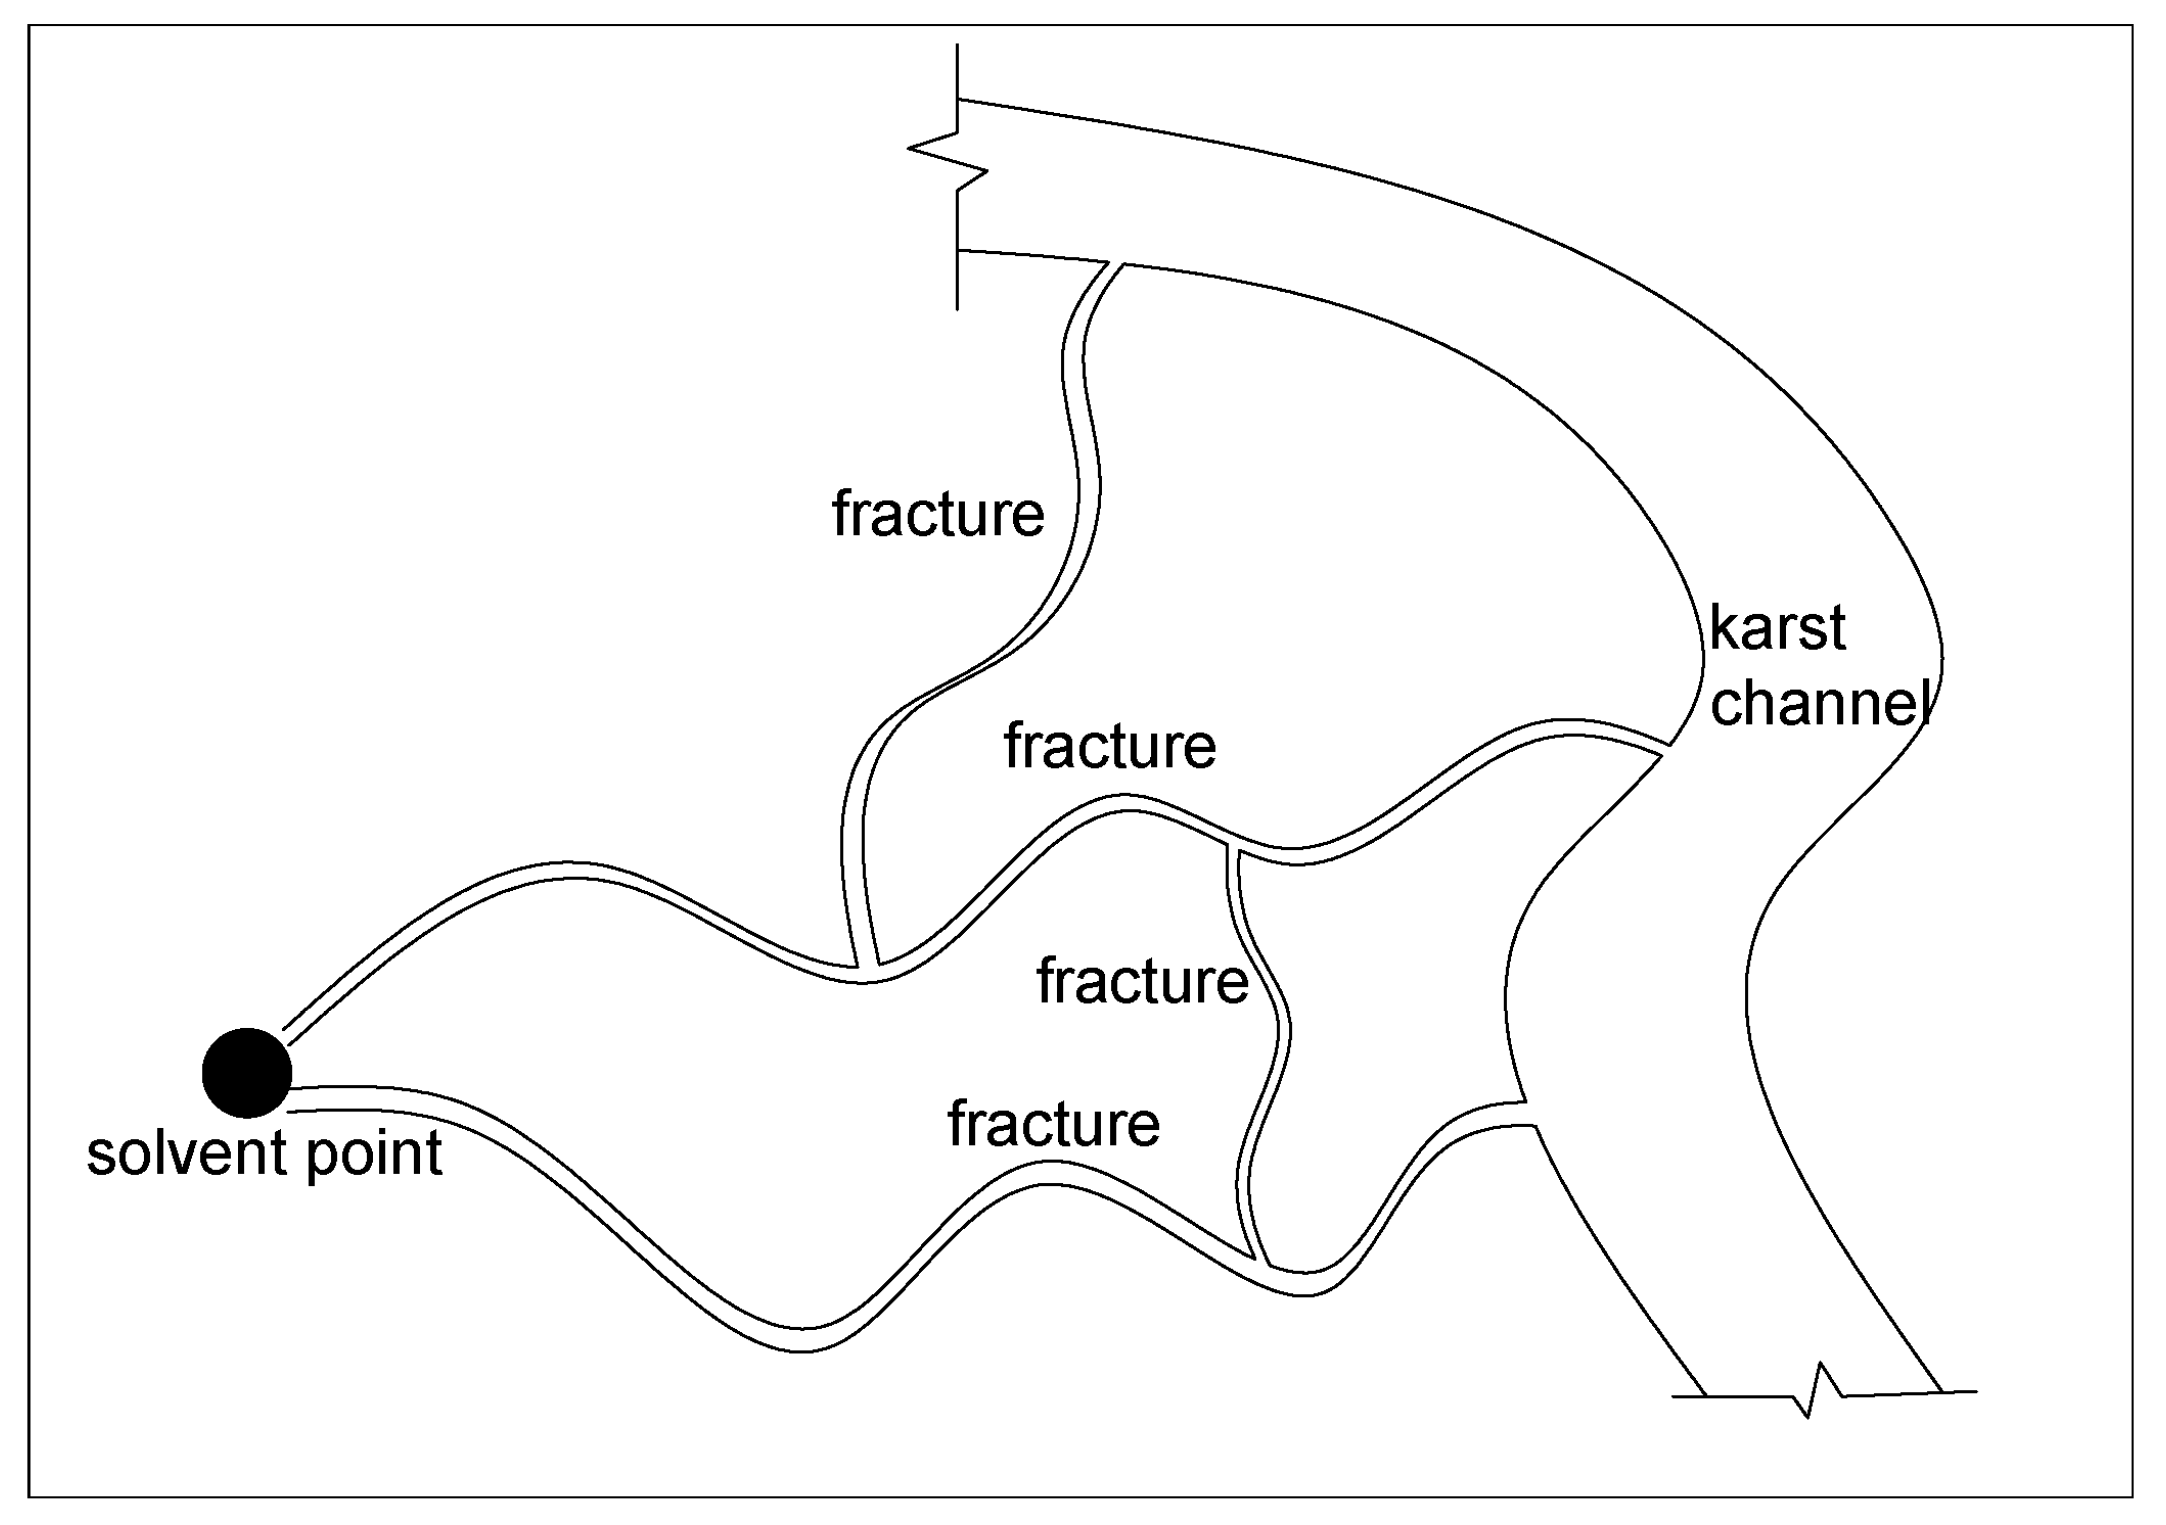
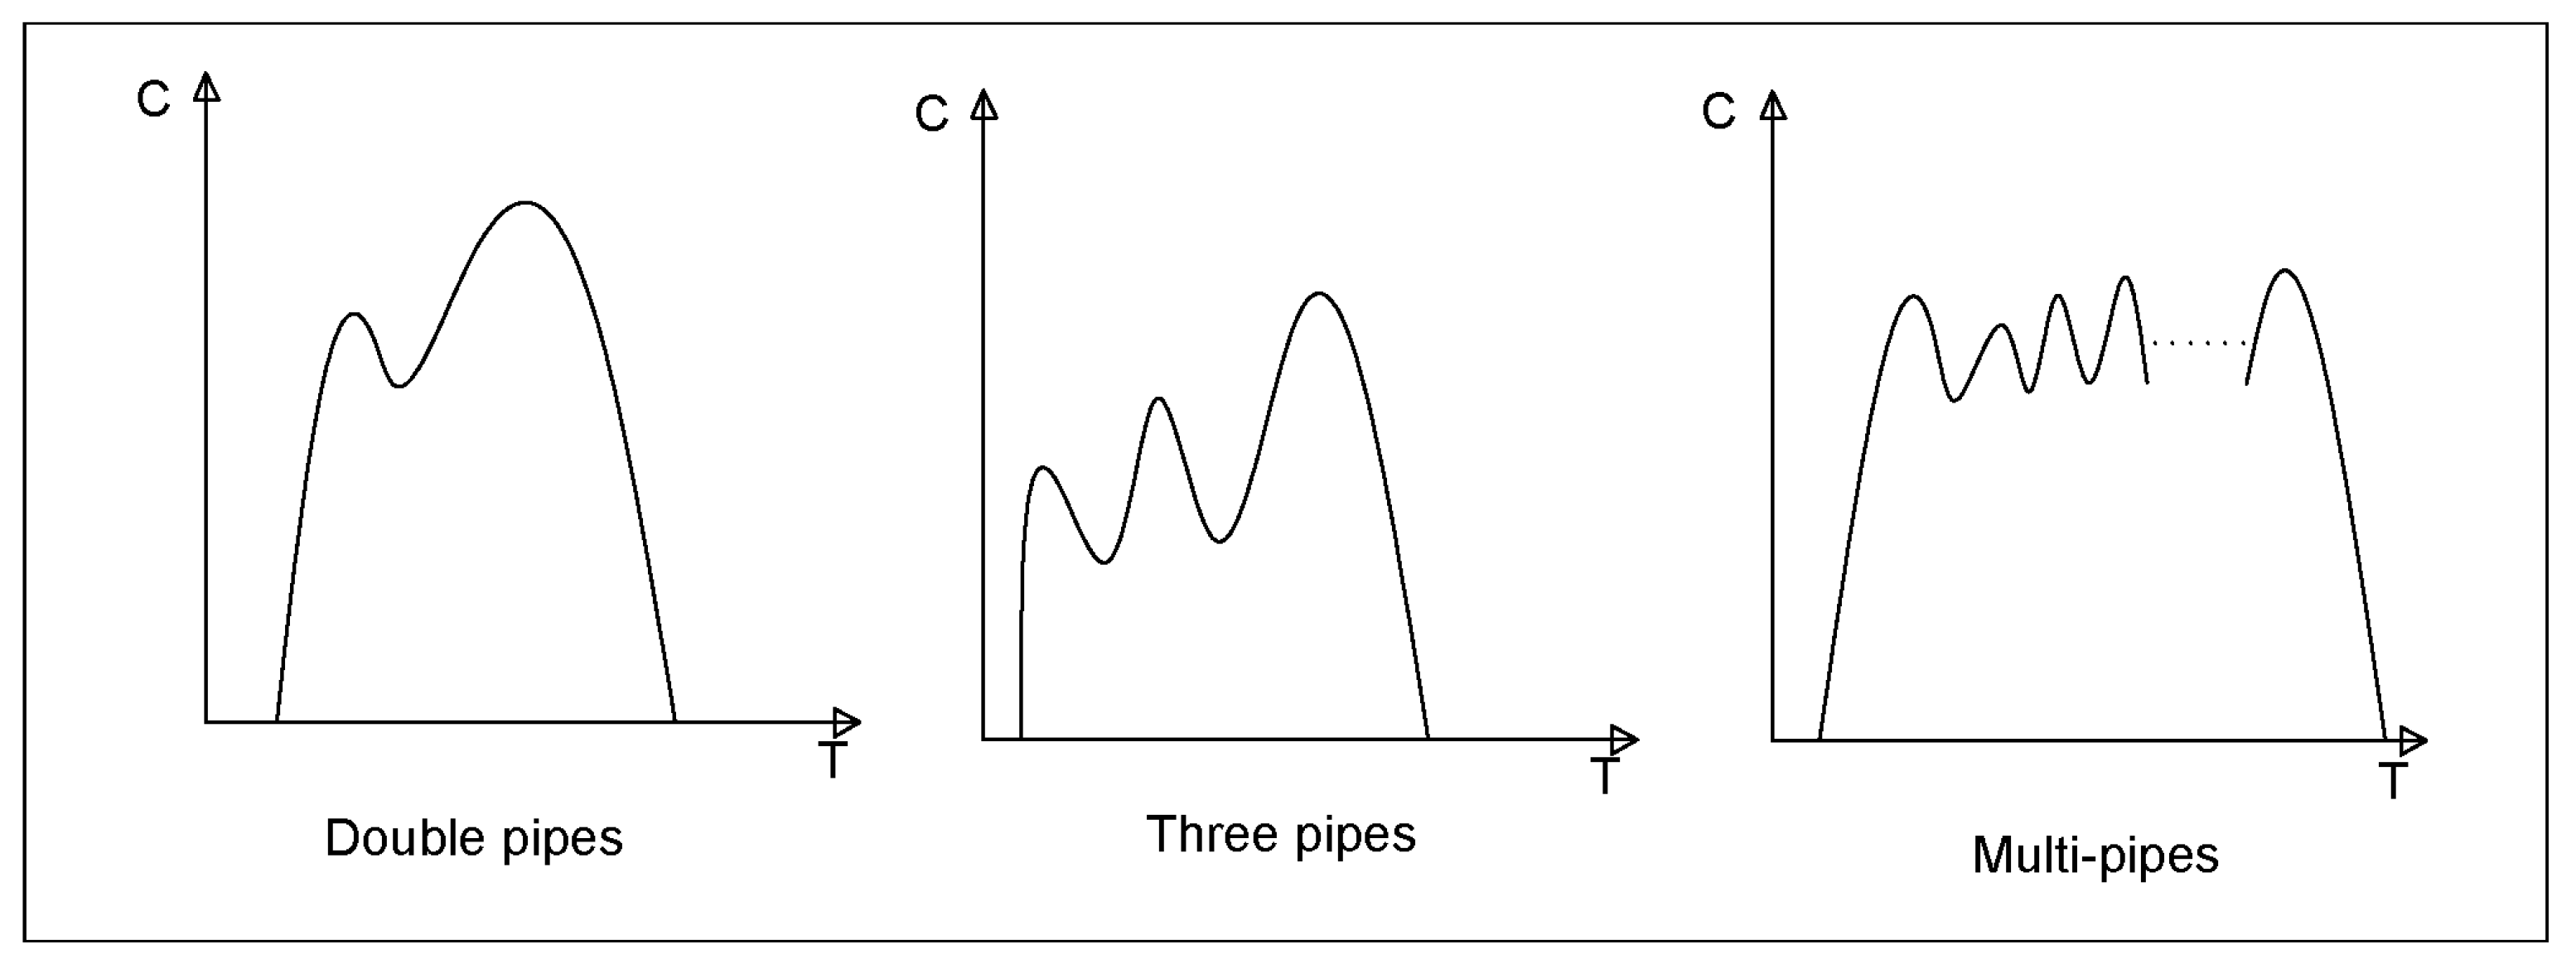
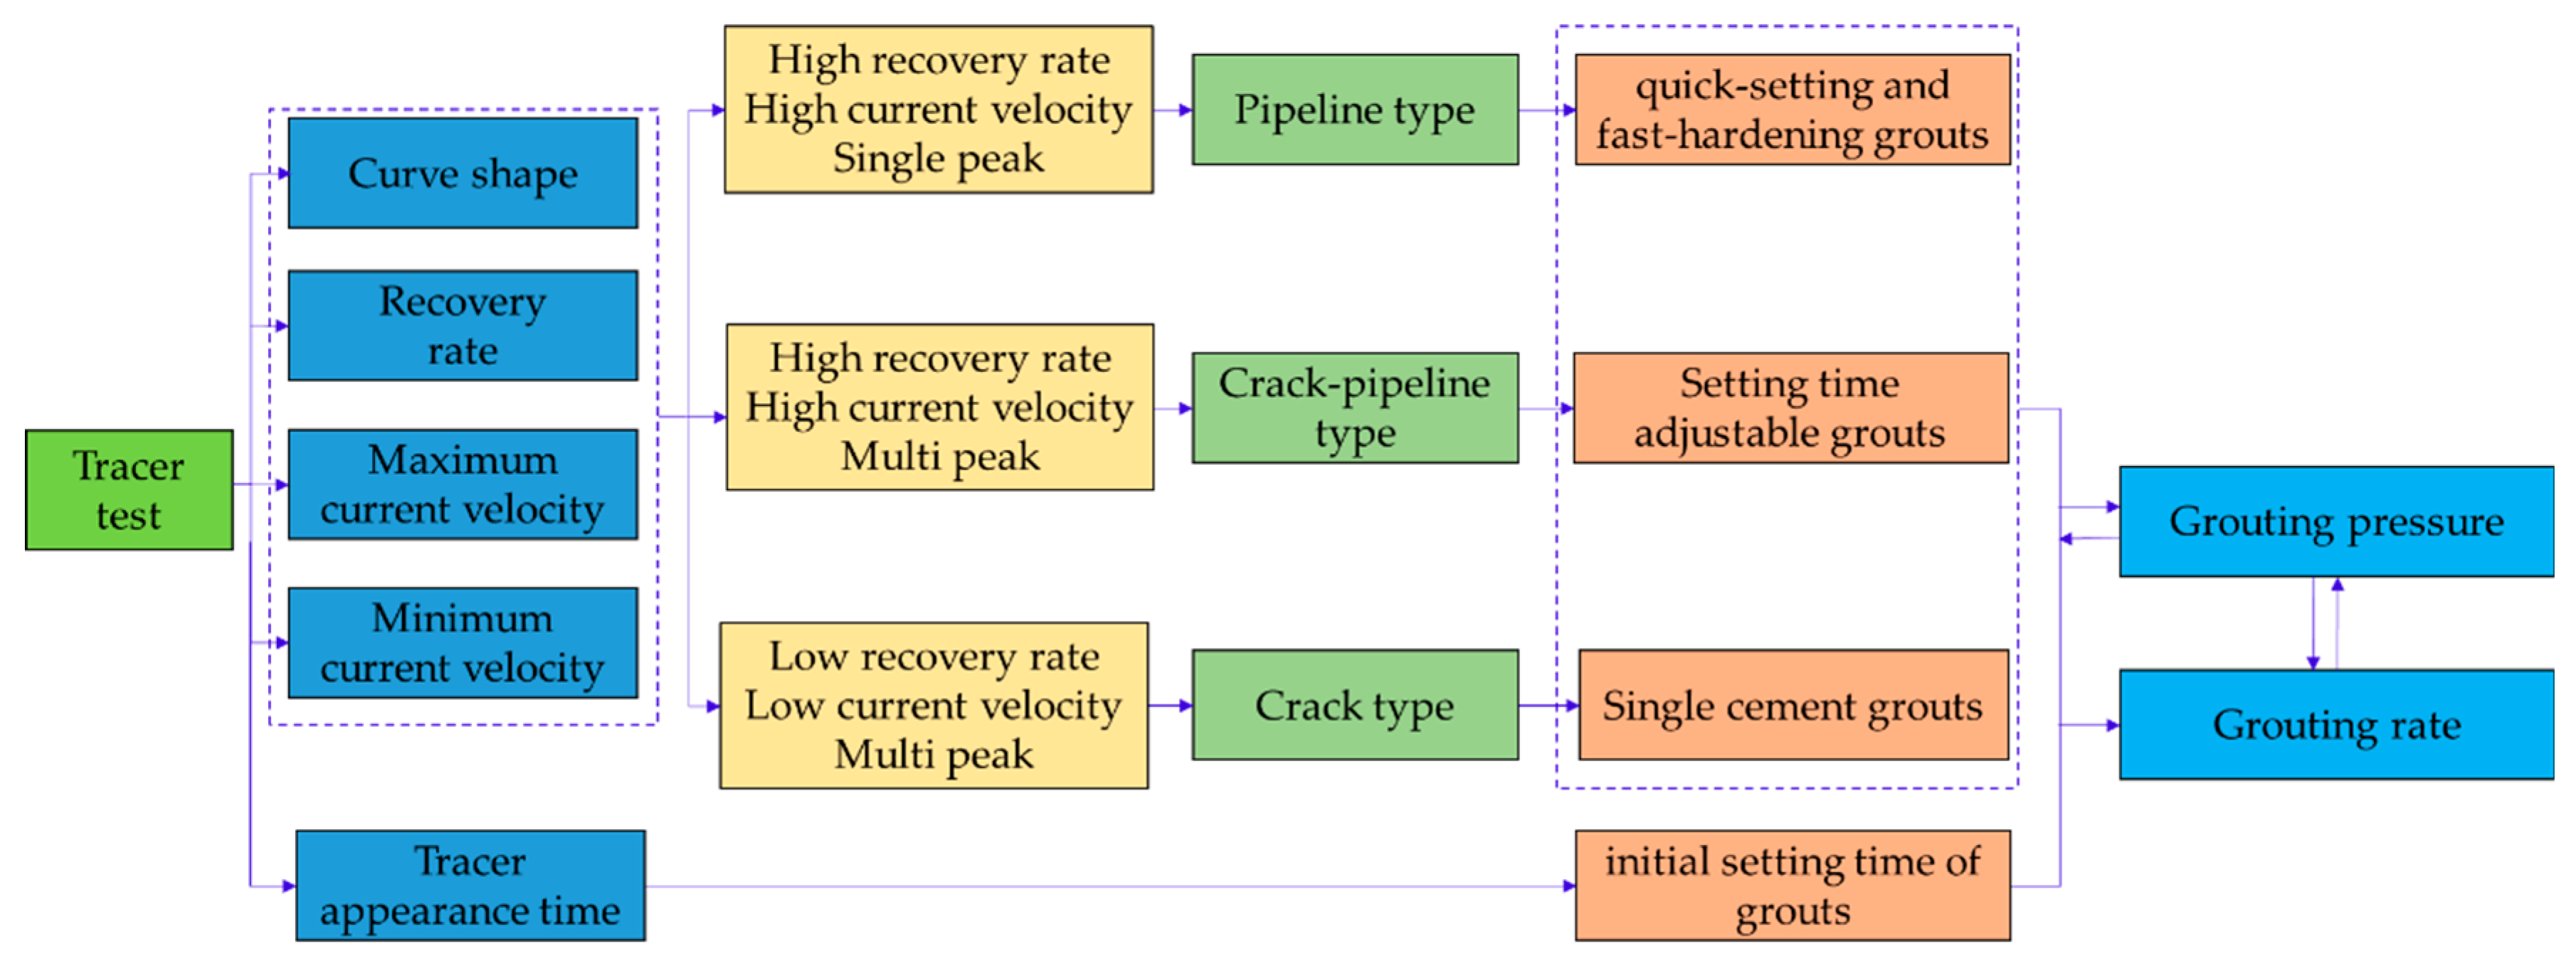
2.2. Identifying the Groundwater Connection Type

Under the influence of the groundwater flow, the distribution of solute in an underground pipeline is similar to an elongated elliptical shape; the concentration in the center of the tracer dispersion range is the highest and gradually decreases. In a networked karst structure, the groundwater is dispersed and multi-turbulent, making it a rapidly dispersing flow field that does not conform to the basic assumption of Darcy’s law. The fluid dynamic dispersion equation does not depend on Darcy’s law, so it is feasible to establish a mathematical model. It is assumed that at t = 0, the tracer with mass M is instantaneously injected at the origin of the infinite karst water dispersion flow field, and the diffusion law satisfies the following solution problem [11]:
c t = D L 2 c y 2 + D T 2 c y 2 v c x
| x | > 0 , | y | > 0 , t > 0
+ n c ( x , y , t ) d x d y = M , t 0
lim ( x , y , t ) = 0 , t > 0
| x y | | | .
Its solution is as follows:
c ( x , y , t ) = 1 4 π D T t M / n 4 π D L t exp [ ( x v t ) 2 4 D L t y 2 4 D T t ] .
In Equations (1)–(6), c is the concentration of the solute, x and y are the dimensional coordinates, M is the solute mass, v is the solute diffusion rate, t is the solute diffusion time, and D is the diffusion coefficient.
In the karst pipeline-fracture gushing water, the injection point is parallel to the pipeline, with n strips of water. As shown in Figure 2, the tracer enters the gap and then flows from the connected gap to the downstream pipeline. The tracer obtained is a superposition of the output values of the respective gap flows, and a plurality of peaks appear in the trace curve.
In this paper, under the conditions of tracing in a fast-distributing flow to a confluence flow field, and the amount of water in the sampling site being mainly confluent with the solution gap in the dye belt, a parallel flow field tracer mathematical model was derived, as shown in Equation (7). According to this model, the theoretical curve was drawn, as shown in Figure 3.
c = 1 Q 0 4 π D T t 1 4 π D L t i = 1 n m i exp ( ( x i v i t ) 2 4 D L t y i 2 4 D T t )
where xi, yi, mi, and vi are the length, width, incoming tracer mass, and average flow velocity of the ith solution flow, respectively; D is the diffusion coefficient; t is time; and Q0 is the amount of water.
Through the tracer test, the curve of the NaCl concentration with time can be visually reflected, and parameters such as the maximum water flow velocity, average water flow velocity, and the relationship between the dosage point and the recovery point can be obtained as follows:
v max s t 1
v a v e s t p
where vmax is the maximum water velocity of the underground runoff, vave is the average velocity of the underground runoff, s is the connected distance, t1 is the shortest time found by the tracer, and tp is the peak time of the tracer.
The solute mass, m1, collected by the image calculation was compared with the initial solute mass, m0, and the proportion of the water content in the solute diffusion region to the water content of the recovery point was analyzed. The principle can be written as follows:
m 1 = Q t 1 t 2 c ( t ) d t
k = m 1 m 0
where m0 is the initial solute mass, m1 is the mass of solute collected at the recovery point, Q is the outlet point flow rate, c(t) is the time-dependent function of the NaCl concentration, and k is the mass ratio.
It can be seen from the above that through the shape of the concentration curve of the reagent, the number of cracks in the underground runoff and the number of pipes can be obtained. The time of the inflection point and the connection speed can be used to estimate the connection between the crack and the main pipe. Through the quality of the solute recovery, the underground runoff can be clarified. According to the contribution rate of the water inflow point, the groundwater connection form can be analyzed.

2.3. The Targeted Grouting Method

The targeted grouting method is based on the parameters and curve form obtained by the hydrological tracer test, determining the form of underground runoff, the maximum runoff velocity, average runoff velocity, and the close relationship between the dosing point and the water point. The grouting material and grouting rate are selected by identifying the connection form of the underground runoff. If it is judged to be a pipeline connection, a quick-setting and fast-hardening grouting material and high-speed grouting are selected. If it is judged to be a crack-pipeline connection, a polymer-cement grouting material with an adjustable setting time is selected. It should be controlled to enter the crack without initial coagulation, and flow out of the crack with initial coagulation. The grouting rate can be adjusted according to the grouting pressure. If it is judged to be the crack-type, single cement slurry grouting can be used first. The water–cement ratio can be regulated by the grouting pressure. According to the maximum runoff velocity, the grouting material can be designed to ensure the maximum retention rate at this flow rate. According to the close relationship between the injection point and the water point, the grouting volume can be predicted so as to avoid unrestricted grouting and waste of grout. The technology roadmap of the targeted grouting is shown in Figure 4.

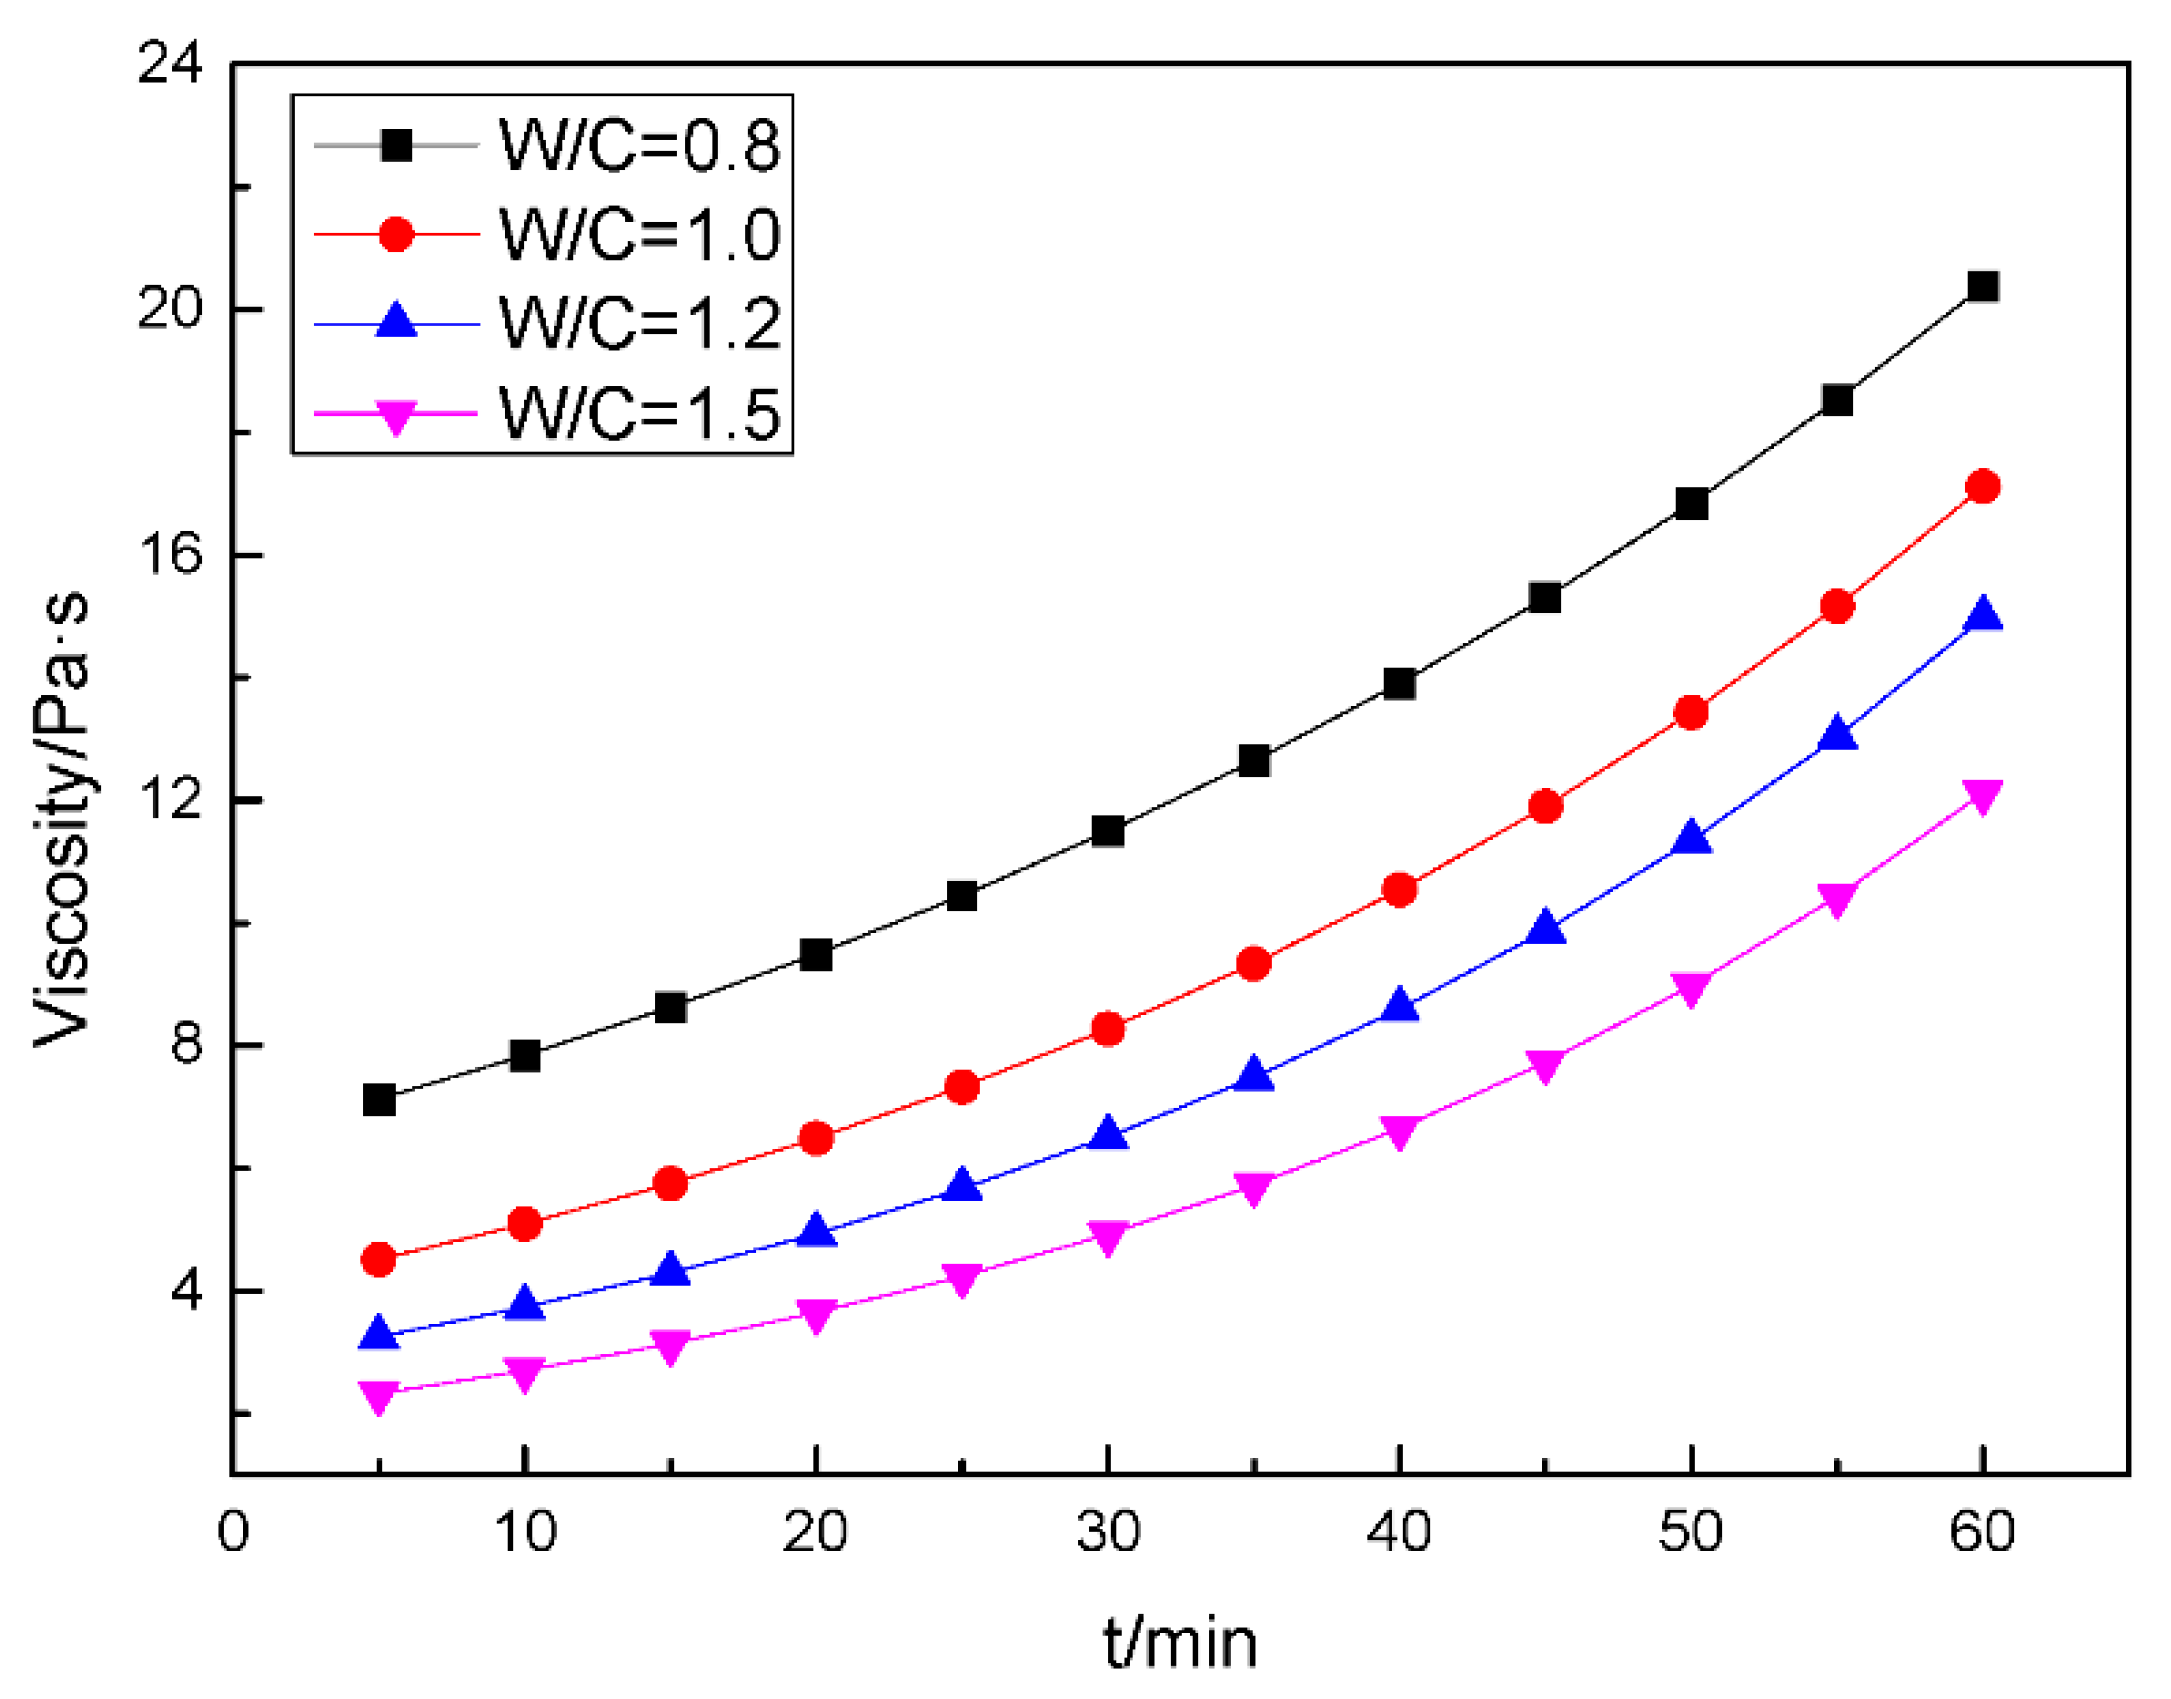
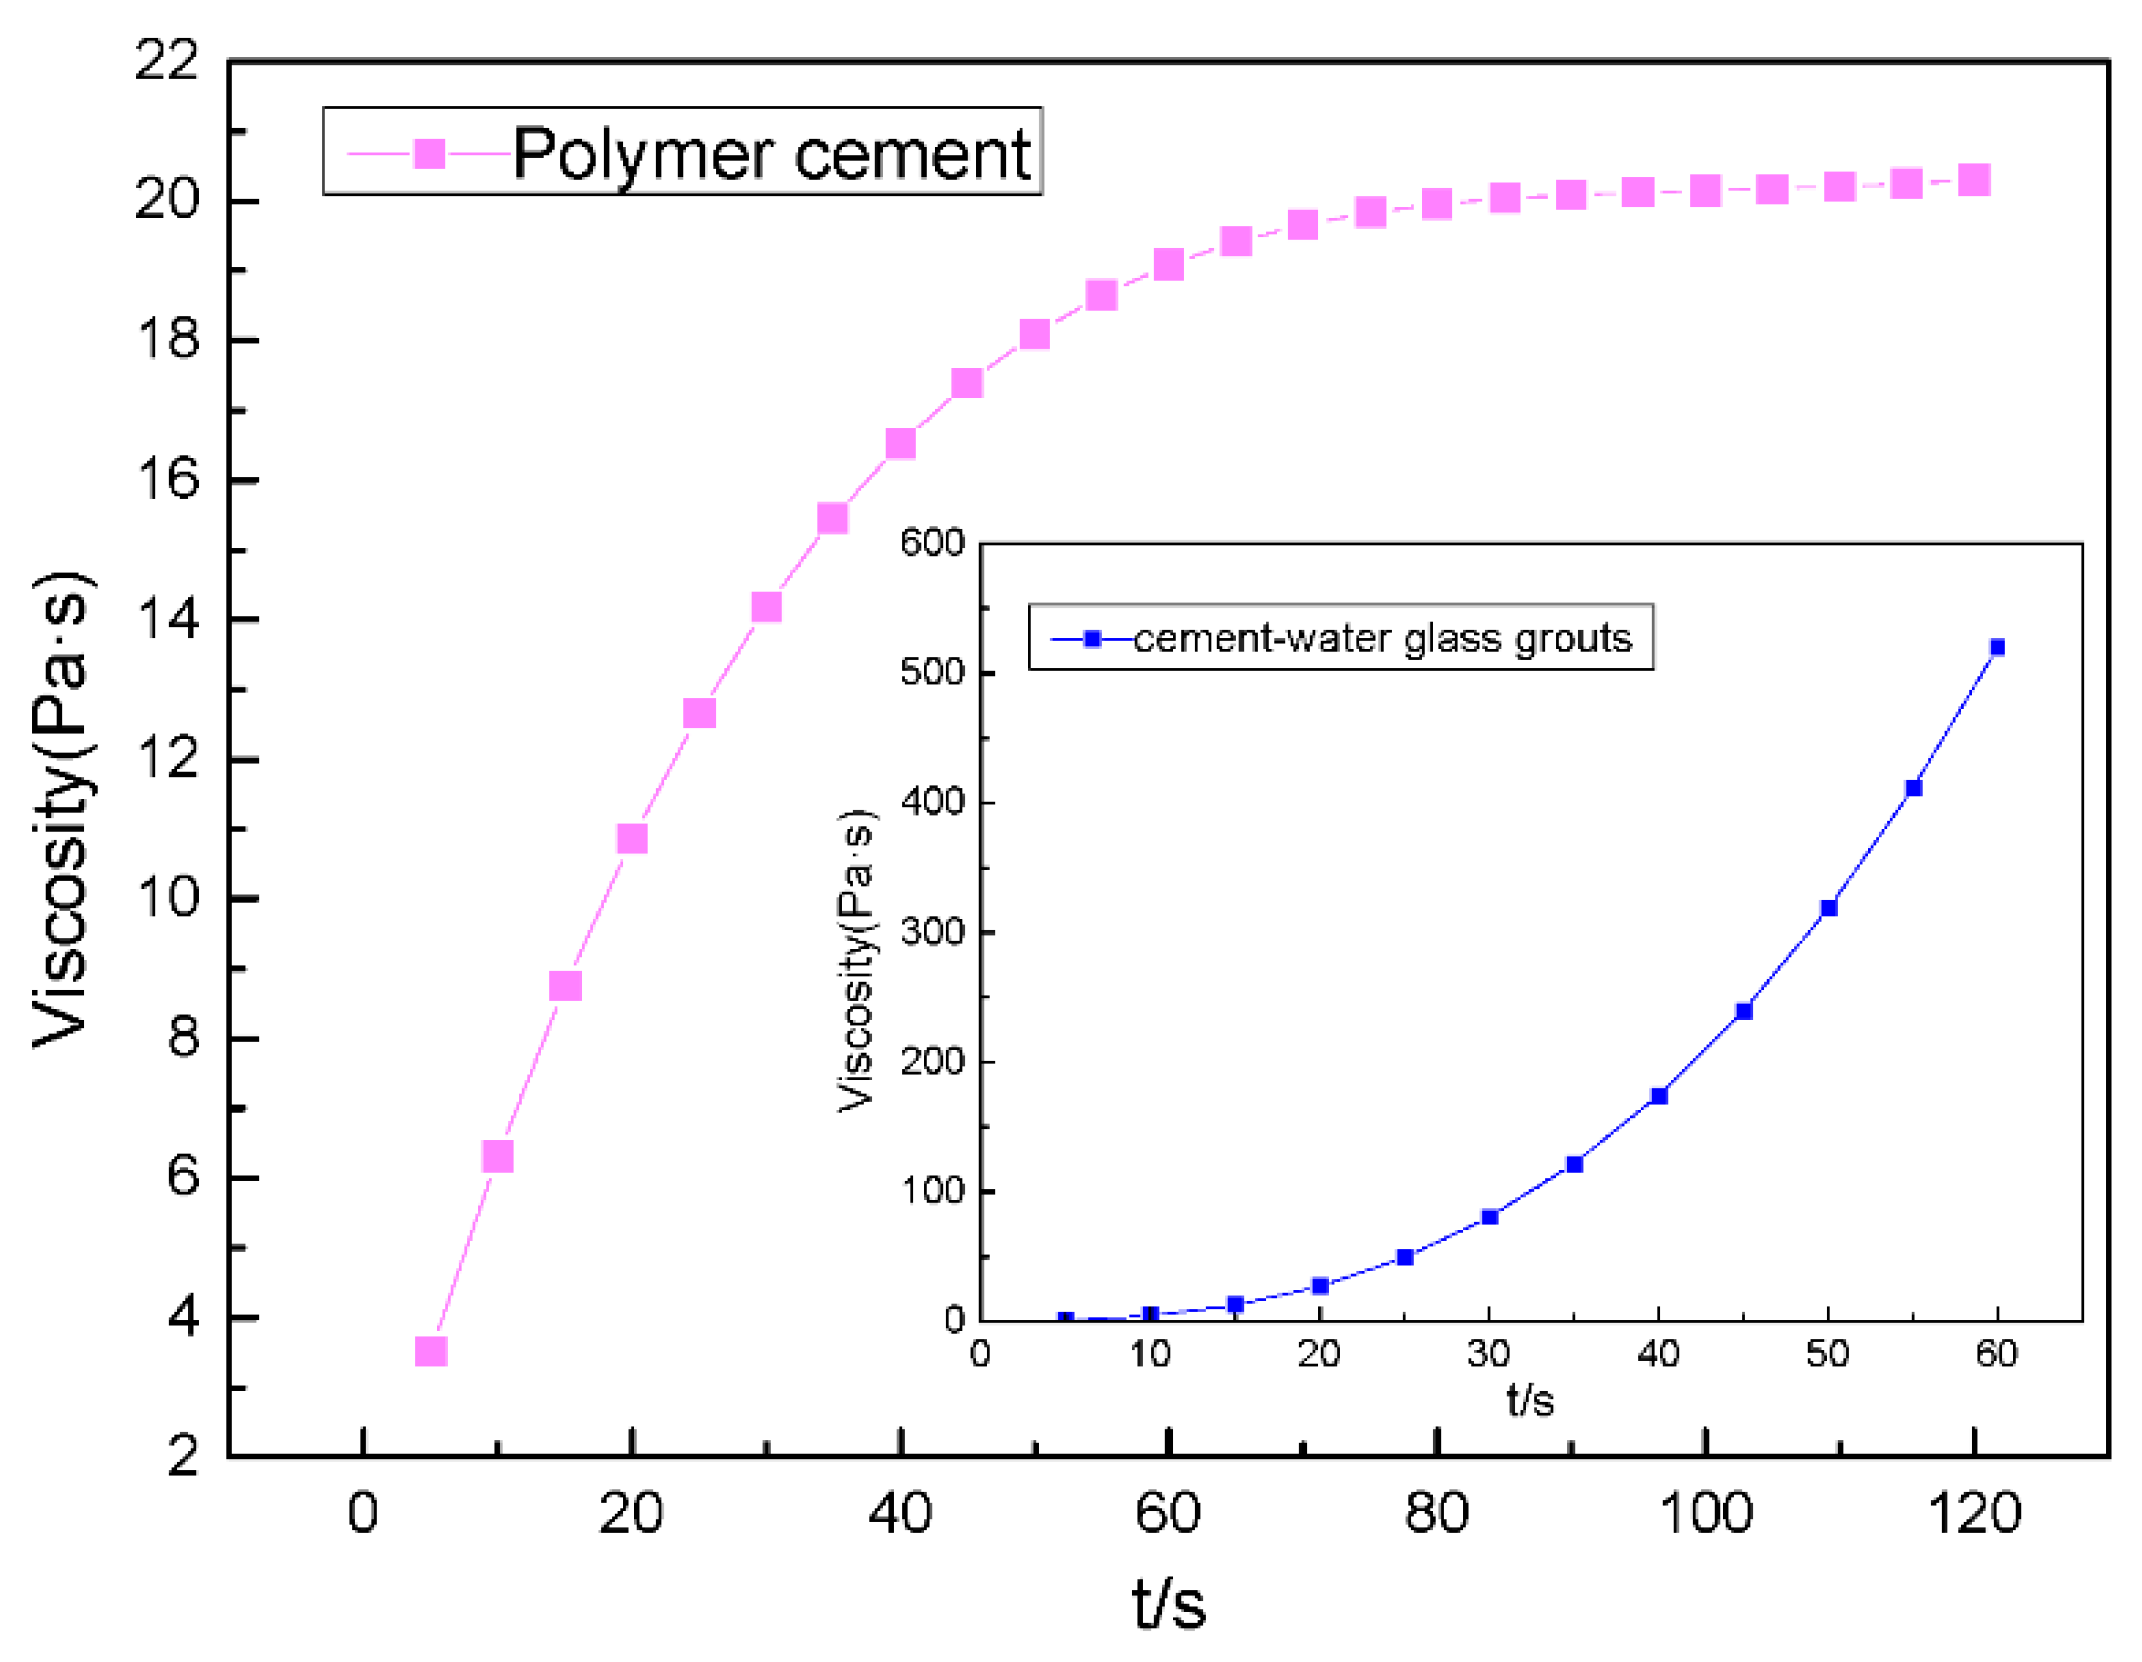
2.3.1. Grouting Material Optimization

At present, grouting materials mainly include Portland cement slurry, special cement slurry, cement–water glass slurry, modified cement–water glass slurry, chemical grouting materials, and so on. These grouting materials have their own characteristics, and in recent years, great progress has been made with grouting materials, but the common cement slurry and cement-based double-liquid slurry still occupy a relatively large proportion of the grouting materials. When selecting the grouting material for dynamic water grouting, the setting time of the grouting material and the viscosity of the grouting material must be considered.
In Table 1, the initial and final setting times of commonly used grouting materials are listed. In the treatment of the karst depression-type mine water inrush, the appropriate grouting material is selected from the groundwater flow velocity and runoff type, with injecting at the appropriate time and path being an effective means of preventing water washout.
According to the results of the connection test method proposed in Section 2.2, if the groundwater connection type is determined to be a fracture type, because of the small size range of the fissures, especially in karst areas, the limestone strength is high, and under certain grouting pressure, the grouts diffusion distance is difficult to meet the design requirements. Therefore, in order to ensure the grouting effect, it is necessary to select grouting materials with a long initial setting time, good fluidity, and small particle size. The cement single slurry is preferred. If the fissure is too small, the superfine cement slurry with a retarder can be used.
If it is determined to be a fracture-pipe type, the length and width of the connecting fracture determine the grouting material selected. In general, the width of the fracture is smaller and the flow velocity is smaller. Therefore, for this type of connection, the grouting material is not initially solidified when entering the fracture, and reaches the initial solidification state when flowing out of the fracture. Because the length of the fracture is difficult to judge, therefore, for the grouting material, its viscosity should reach a certain value, and the viscosity state should remain stable for a certain period of time. Under this condition, the grouts can flow to the main pipe under low pressure, and with the help of various admixtures, the slurry also has a certain anti-scouring ability. Therefore, the grouting material with an adjustable setting time, strong injectability after initial setting, and strong dynamic water scouring resistance should be selected, and the grouting material mix proportion should be adjusted according to the grouting pressure and grouting running condition.
If it is determined to be a pipeline type, because the pipeline is larger and the flow speed is generally larger, the grouting fluid should reach the initial setting state in the borehole, the grouting material should quickly condense, and should reach a certain strength value in a short period of time so as to prevent the scouring of dynamic water. Therefore, cement–sodium silicate slurry is the preferred grouting material, with a short initial setting time and short initial and final setting interval.

2.3.2. Determining the Grouting Rate

The grouting rate mainly depends on the setting time of the grouting material, the length of the grouting pipe, the drilling depth, and the connectivity of the underground runoff. The grouting borehole reveals different conditions for the underground water channel or fissure, and the grouting rate used is also different. According to the results of the connection test method proposed in Section 2.2, if the connection type between the borehole and the water outlet is determined to be a fracture type, because the cracks are narrow and the grouting material is long in condensation, in order to ensure the grouting expansion distance in the cracks and loss to the invalid range, low-speed grouting is selected.
For the fracture-pipeline type, because the setting time of grouts has a certain adjustment space, the grouting rate should be adjusted according to the initial setting time of slurry. If the grouting rate is too high, the slurry will enter the pipeline before the initial setting. The slurry retention rate cannot be guaranteed. If the grouting rate is too low, the slurry will reach the initial setting state before entering the fracture, which may block the fracture. Therefore, the appropriate grouting rate should be selected according to the initial setting time.
If it is determined to be a pipeline type, the grouting rate should be increased according to the size of boreholes. The grouting volume can be increased by multi-pump combined grouting operation. If the grouting hole is too short, the length of grouting pipeline should be increased appropriately.
If the grouting rate is q, the grouting rate can be expressed as follows:
{ q < V p + V d + V f t n ( Fracture   type ) V p + V d t n < q < V p + V d + V f t n ( Fracture - pipe   type ) V p t n < q < V p + V d t n ( pipe   type )
where Vp is the pipeline volume, Vd is the drilling volume, Vf is the volume of the fracture, and tn is the initial setting time of the grouting material.

2.3.3. Grouting Pressure Control

Initial grouting pressure control has different requirements for various types of connected forms. For fracture type, because of the good fluidity and long initial setting time of grout, the initial pressure of grouting is basically in a non-pressure state. Fracture-pipeline connection requires a certain pressure to ensure the continuous diffusion of slurry due to the initial setting state of slurry in the fracture. Therefore, a certain pressure should be guaranteed. The initial pressure of the grouting should be determined according to the slurry running condition at the water point and material properties, but it should generally be less than 2 MPa. For the pipeline type, because of the good penetration of the pipeline connection, the initial grouting pressure is still small, generally less than 0.5 MPa, even if the quick setting and early strength grout is used.
The final pressure of the grouting has a strong relationship with the head pressure, the type of slurry, and the diffusion distance. The grouting pressure is mainly controlled by the water pressure of the head. At the end of grouting, the pressure of the grouting is affected by the hydrostatic pressure and the influence of the diffusion radius. Therefore, the final pressure, Pz, of the grouting is generally 1.5 times larger than the hydrostatic pressure, P0, and less than 0.15 times the compressive PC of the intact rock mass.
1.5 P 0 P Z 0.15 P C
In the case of the same grouting material, the grouting pressure relationship of different connected types is as follows:
P pipe < P fracture - pipe < P fracture .
In actual engineering practices, the grouting pressure needs to be selected according to the type of groundwater connection.

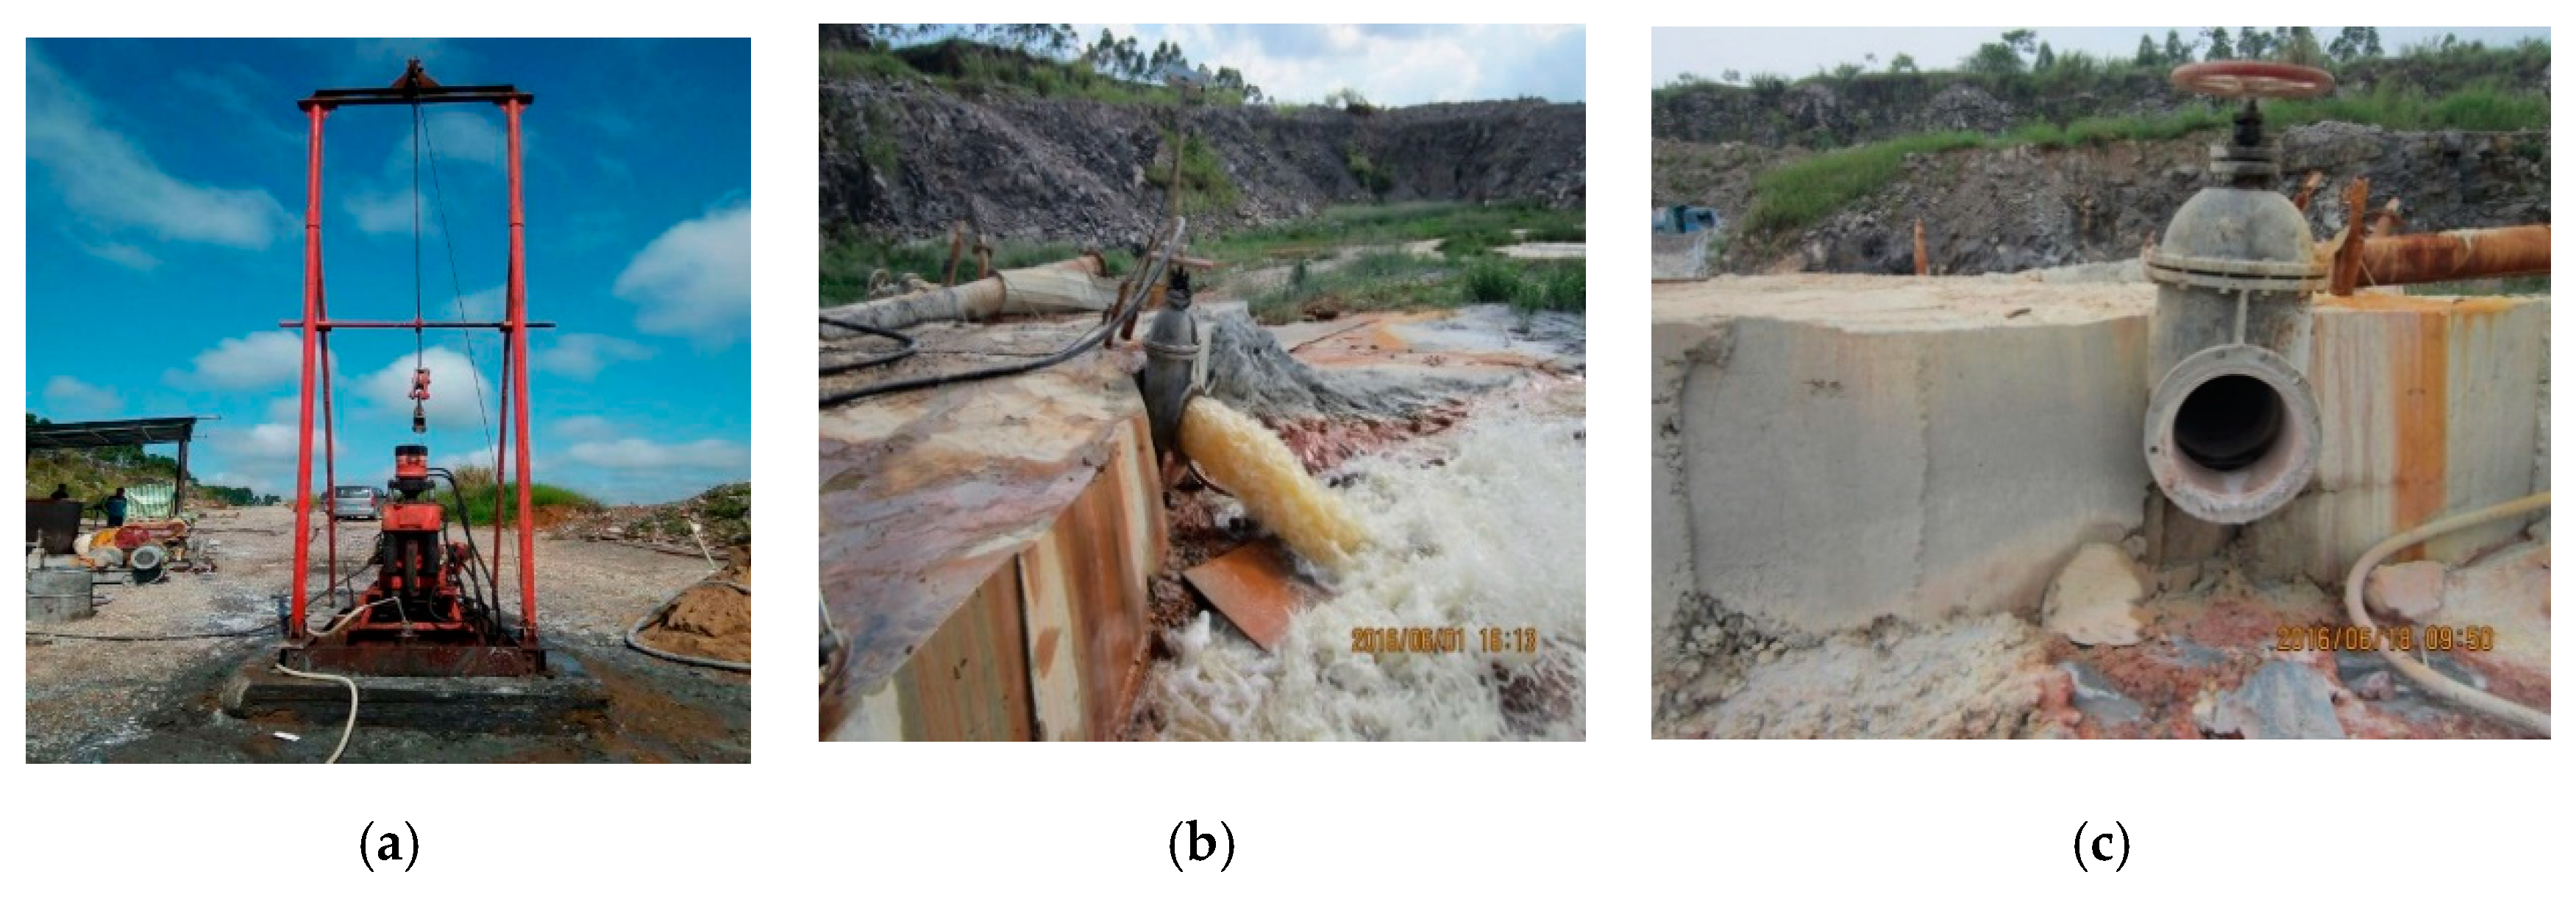
3. Field Testing and Engineering Applications

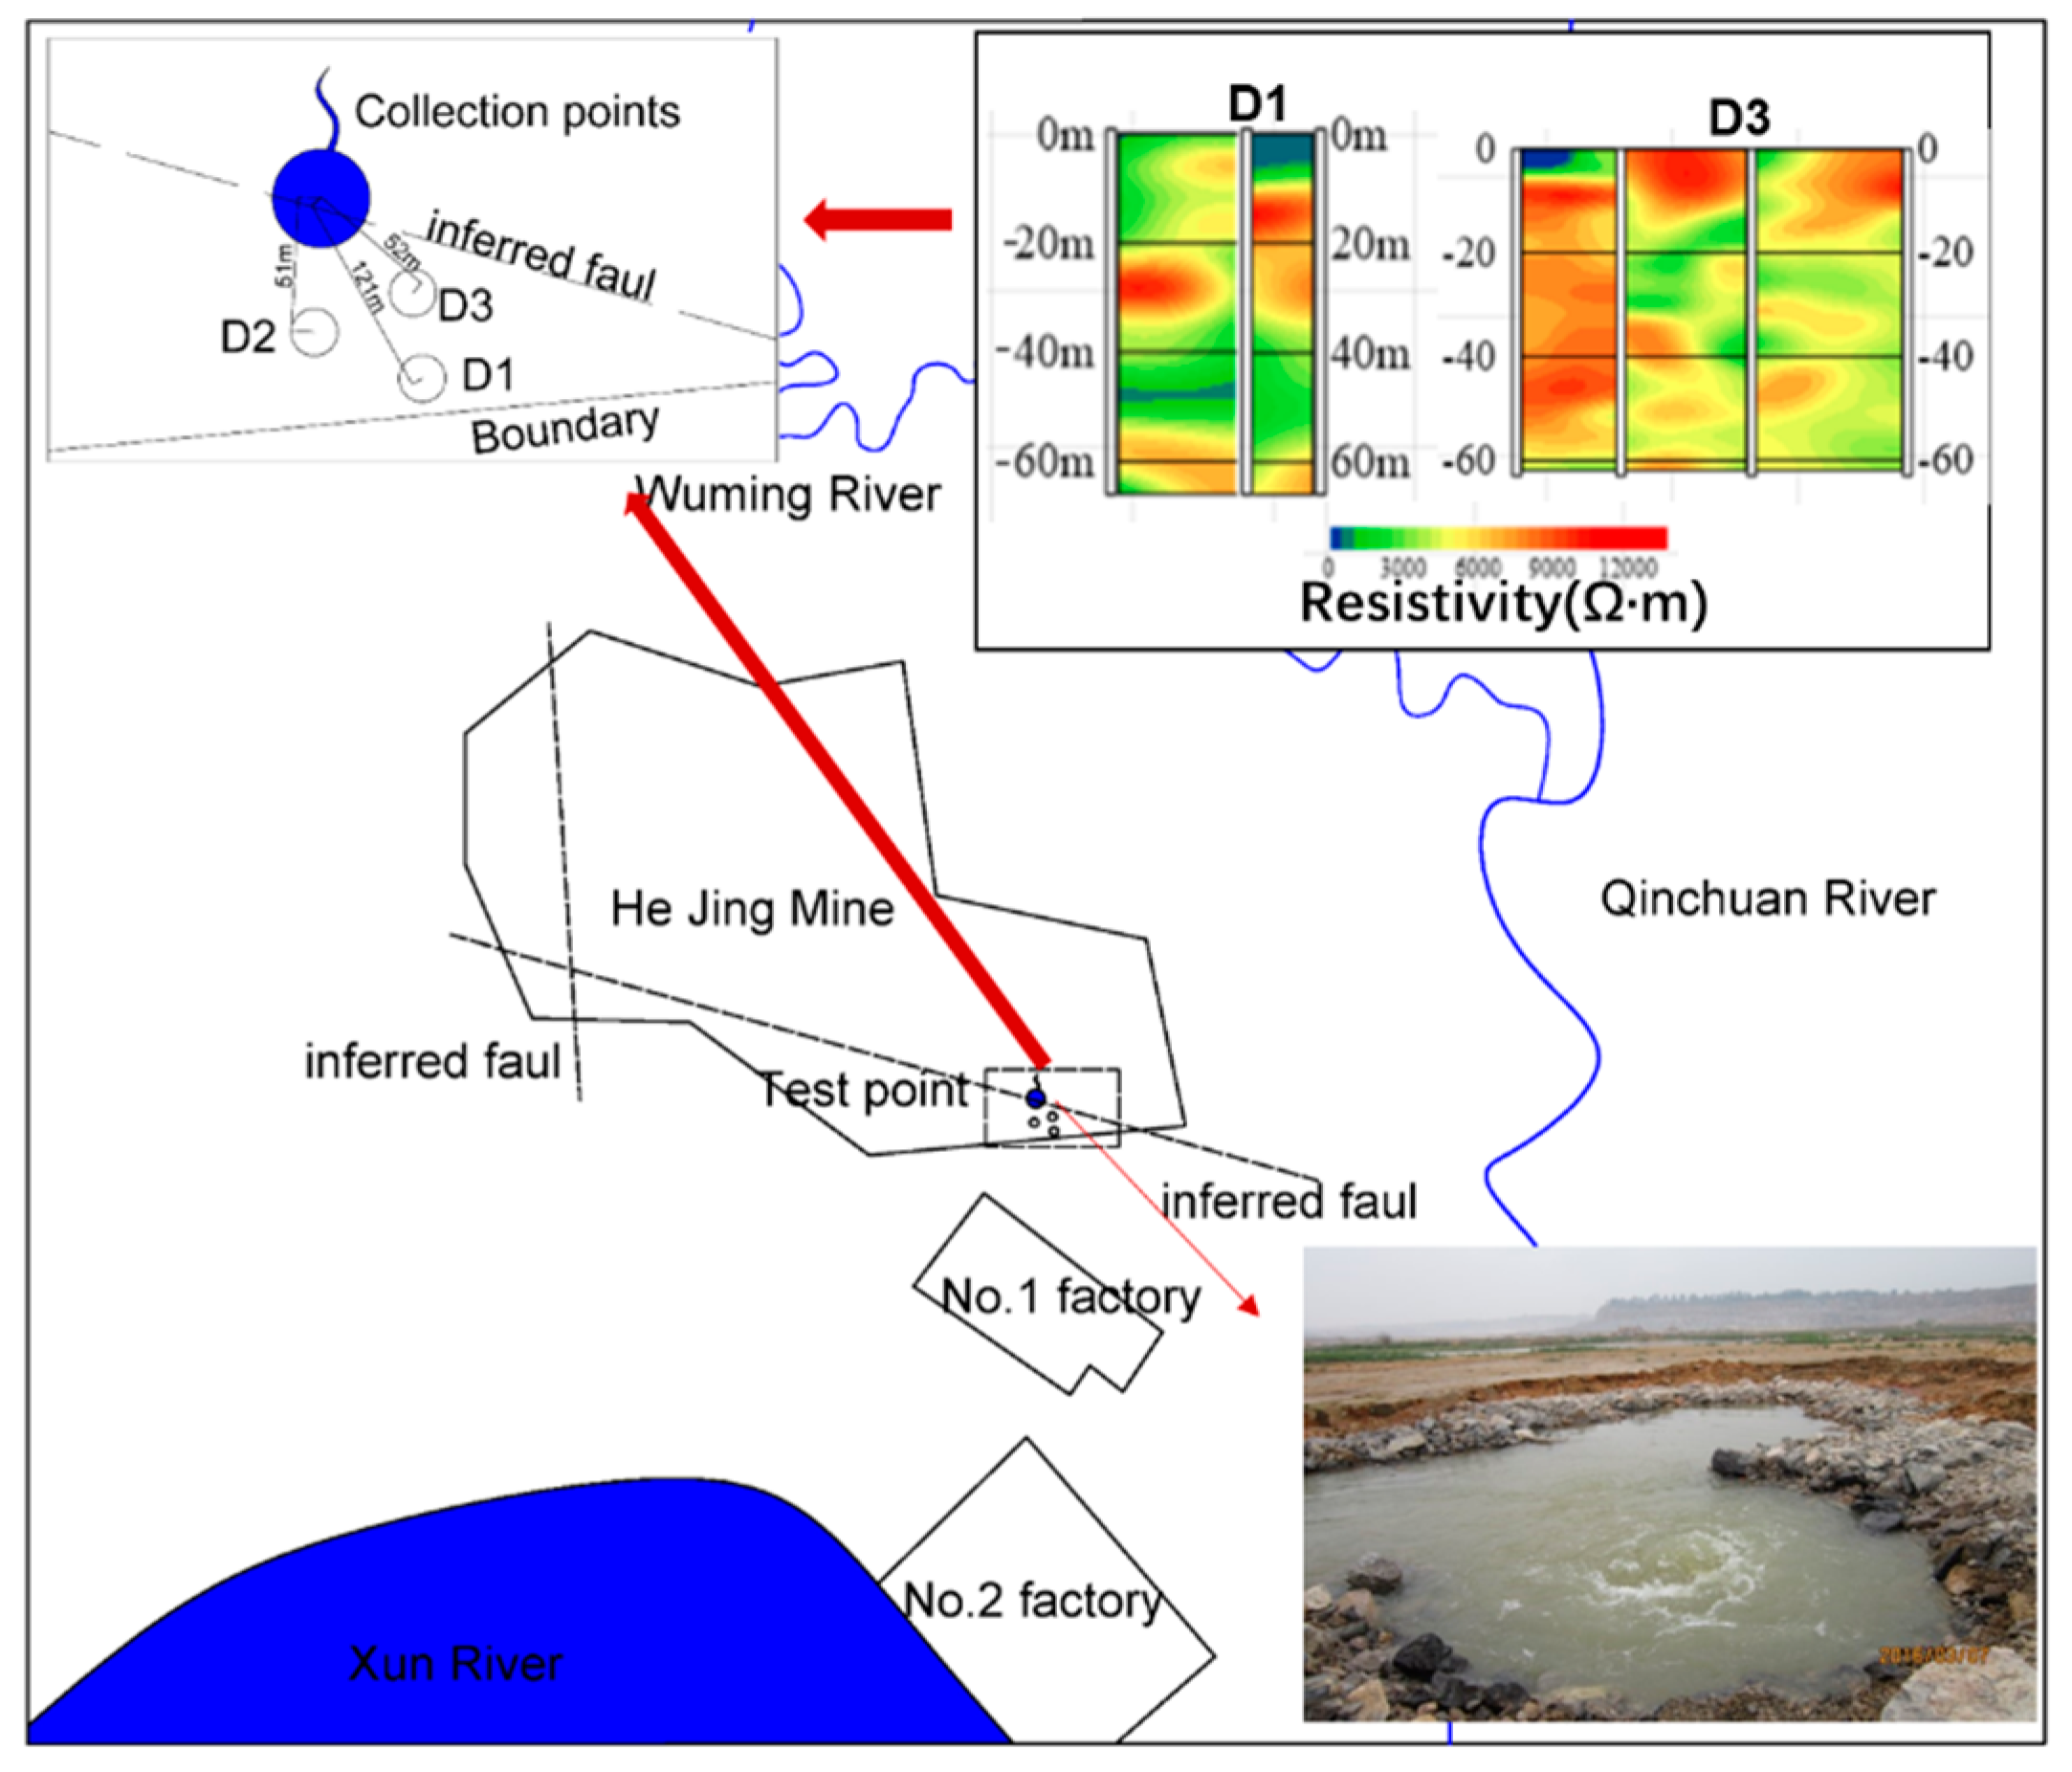
3.1. Tracer Test Drop Hole Layout

The test was carried out in a karst mine in Guangxi. The mining was divided into three sections: a 28 m section, a 10 m section, and a −5 to 10 m section. Steps were reserved between the sections, and drilling was carried out on the steps. The mining area is located in the east wing of the Yujiang syncline. The whole stratum is monoclinically layered, with a single shape and stable production. It is generally 156–174°∠10–18°, and no obvious folds are visible. The mining area is surrounded by water on three sides (as shown in Figure 5). As a result of years of mining, the pits form a hydraulic drop funnel, and the surrounding water systems are all collected into the pit. According to the drainage data of the mine from 2008 to 2015, the maximum water inflow of the mine is 326,000 m3/day. The recovery point of this test is the water outlet point with a daily water inflow of 71,200 m3/day, as shown in Figure 5. According to the results of the geophysical exploration, holes D1 and D3 were selected as the injection points, and hole D2 was used as the control injection point. A quantity of 20 kg of NaCl was dissolved in 100 kg of water; it was placed at the dispensing point at a certain time and was simultaneously sampled at the recovery point, and water samples were taken once every 1 min for 60 min. In order to reduce the measurement error, the chloride ion selective electrode was used to measure each water sample five times, the maximum and minimum values were removed, and the other three groups of data were averaged.

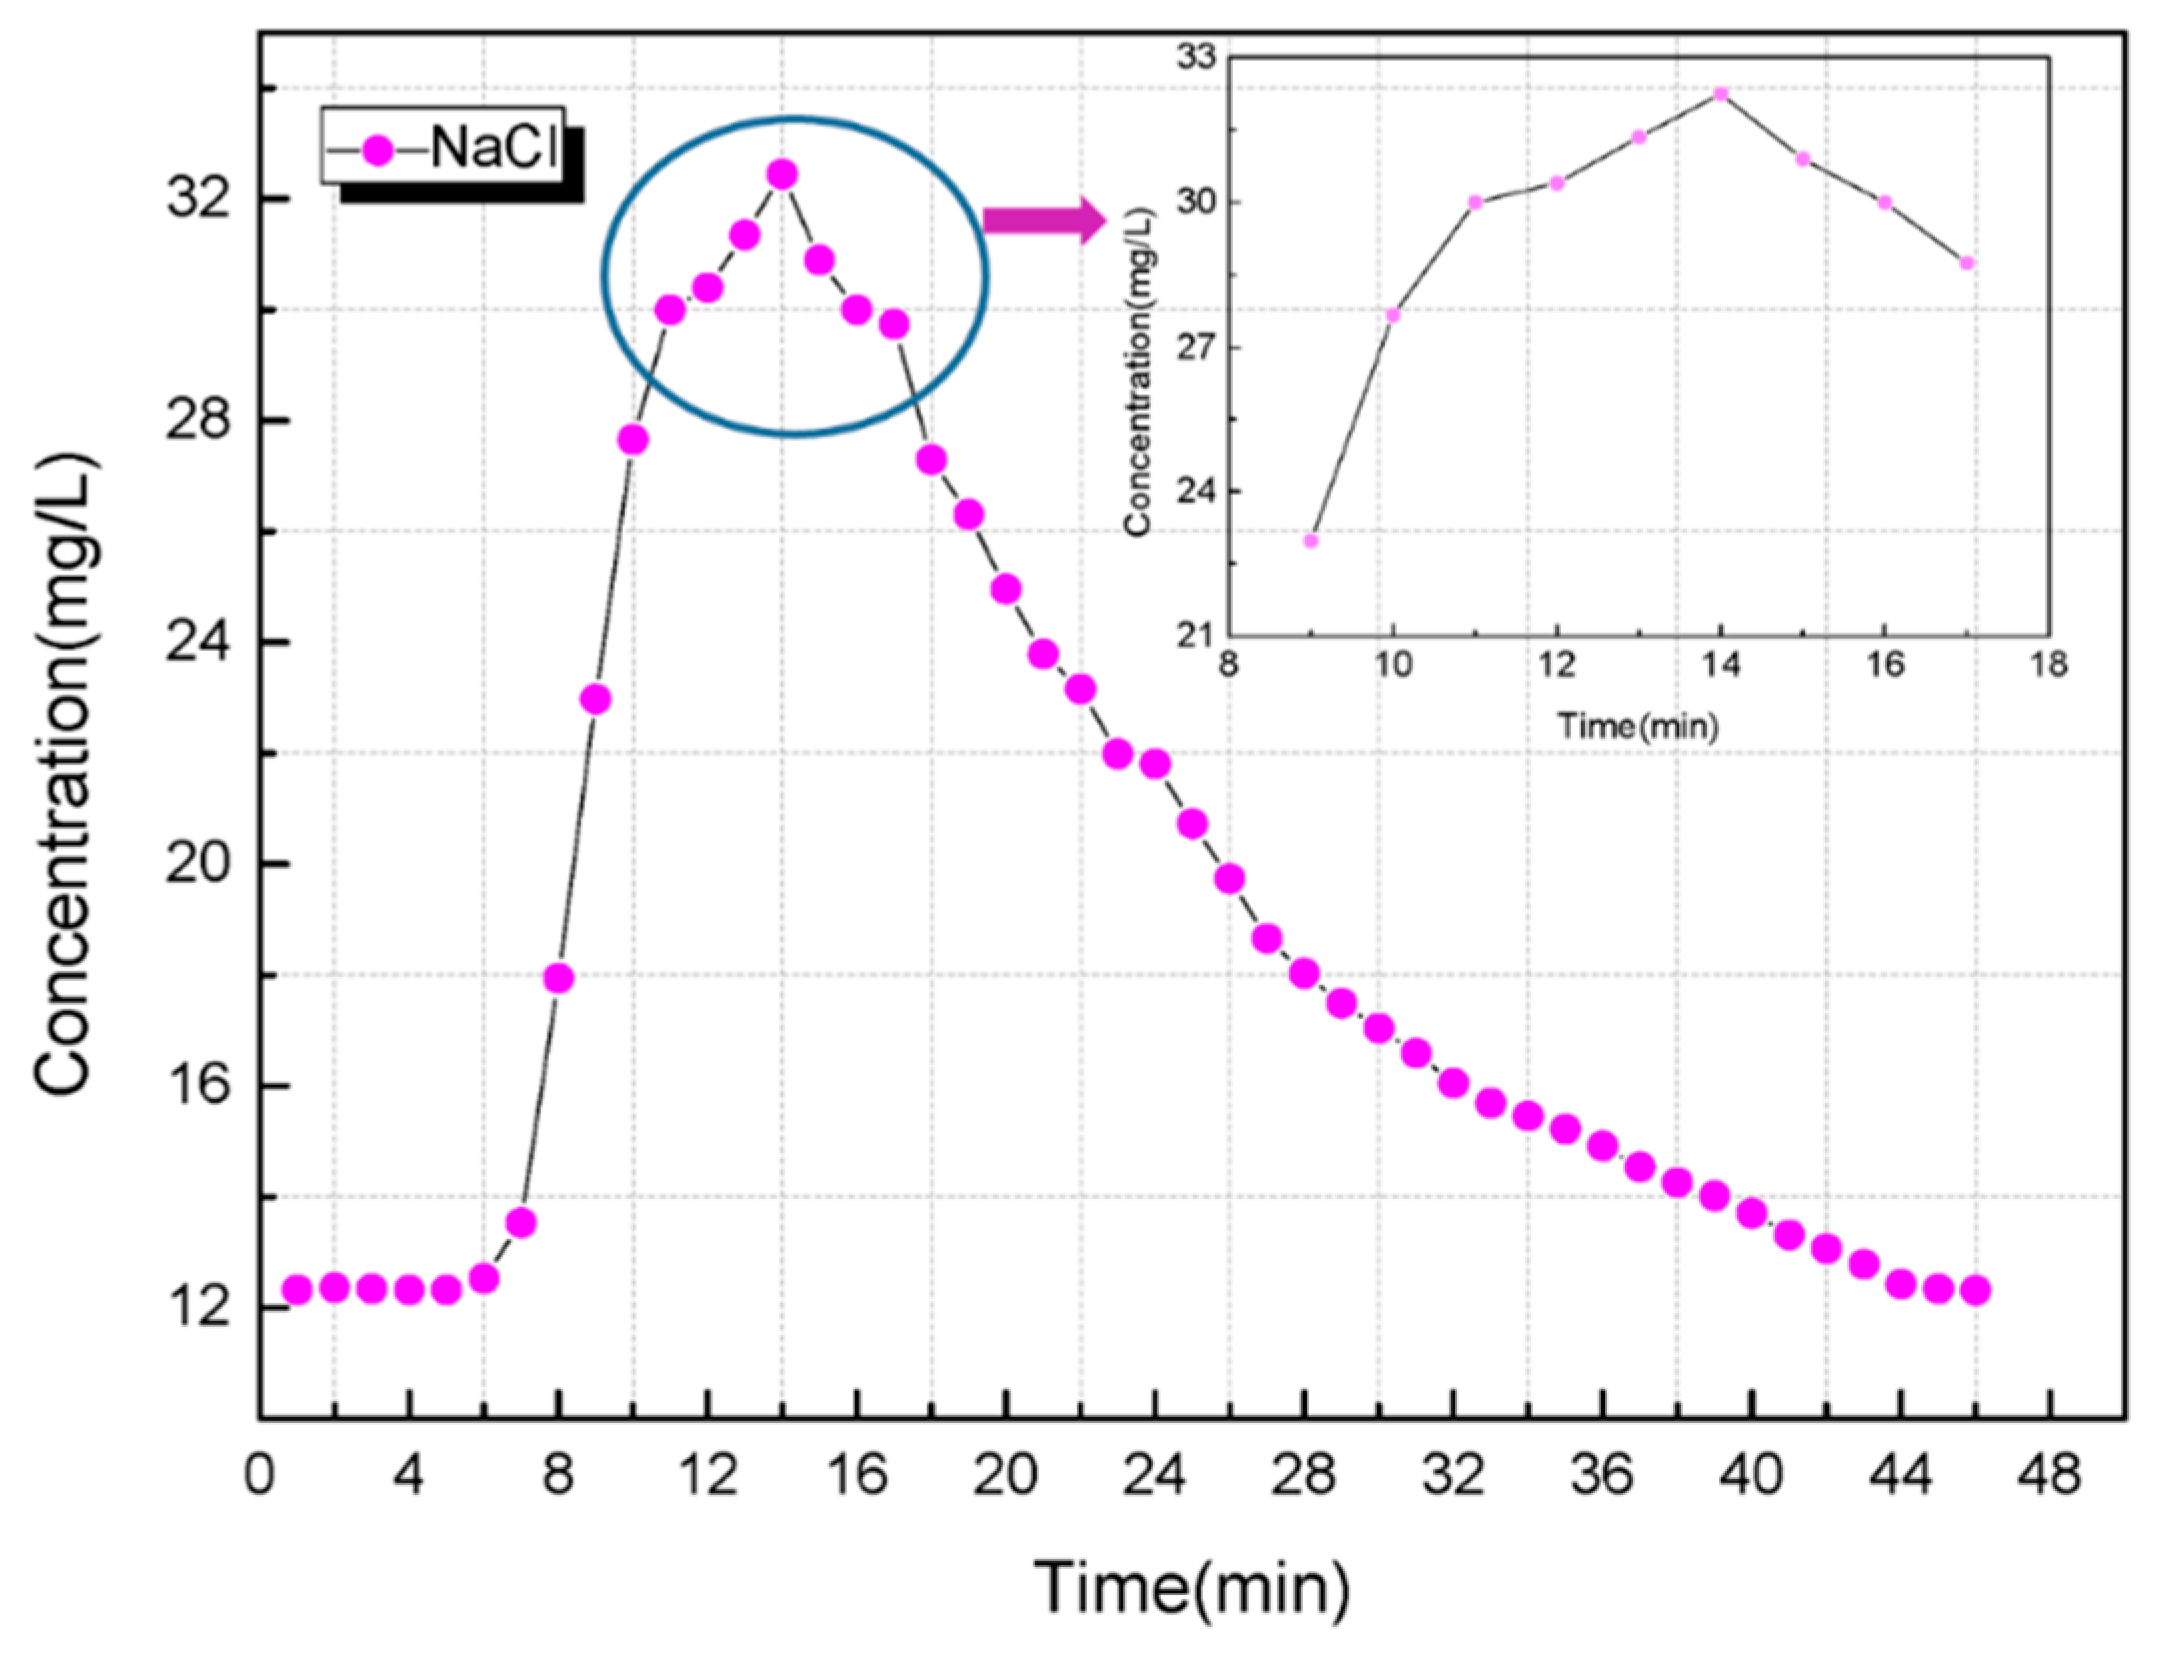
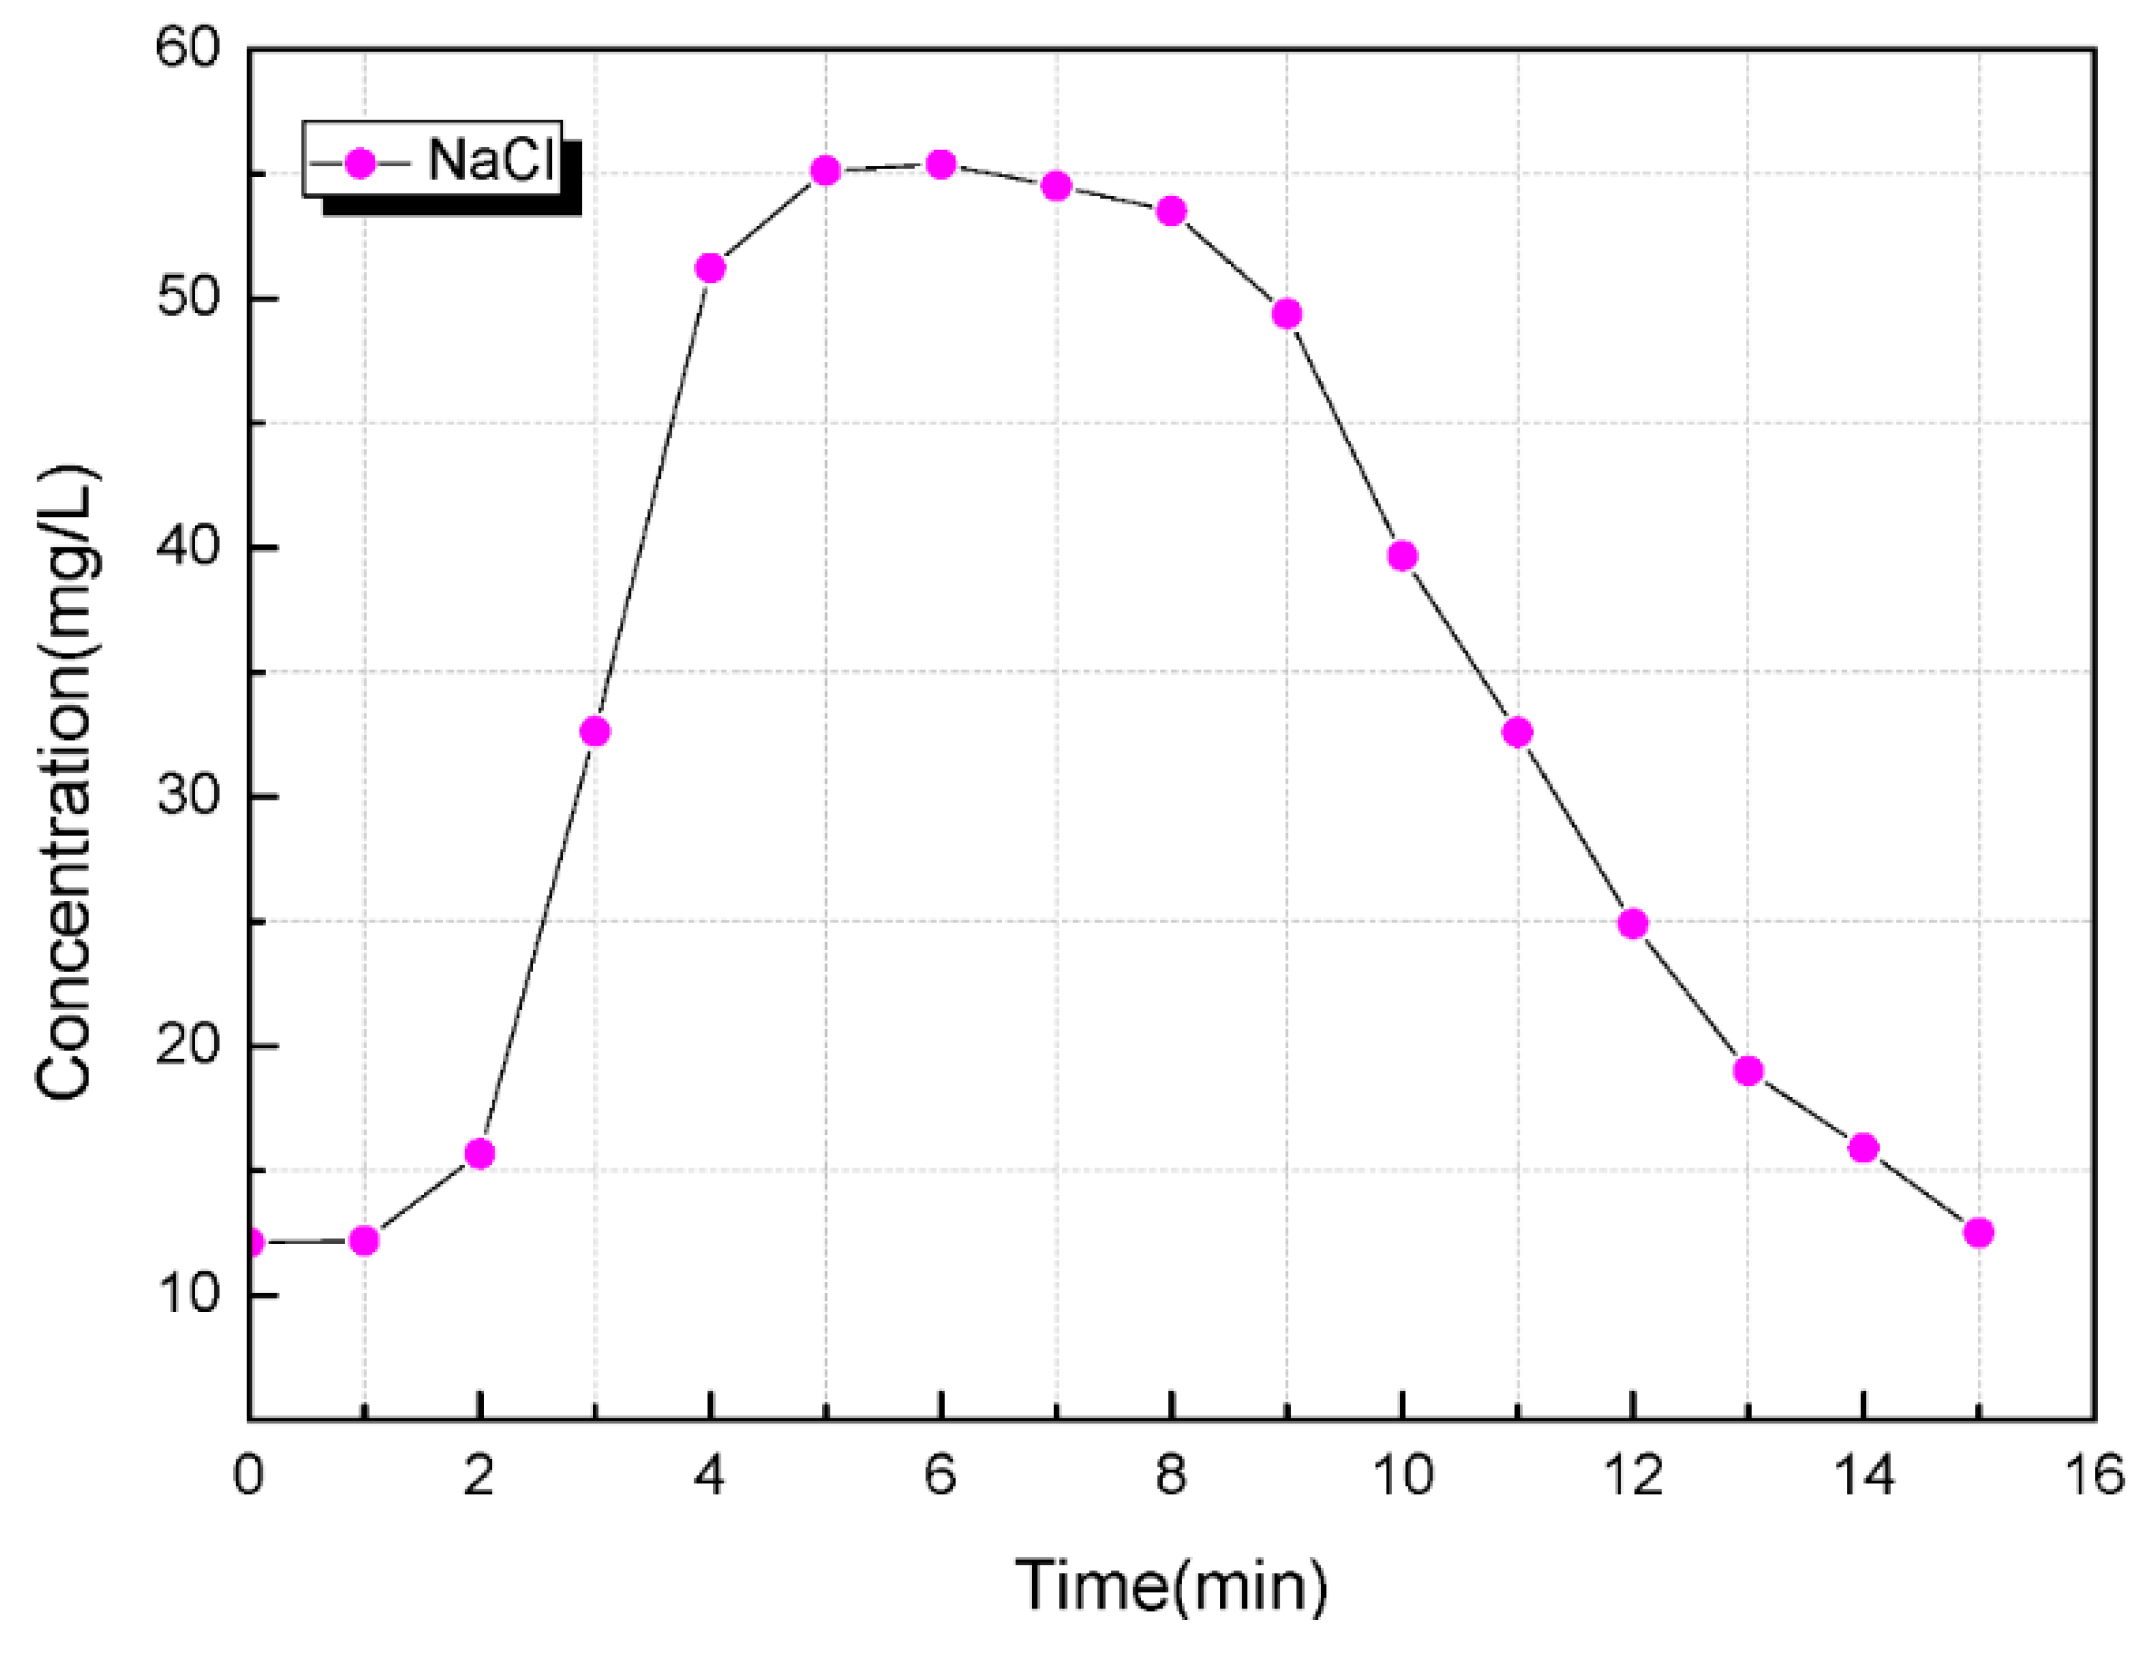
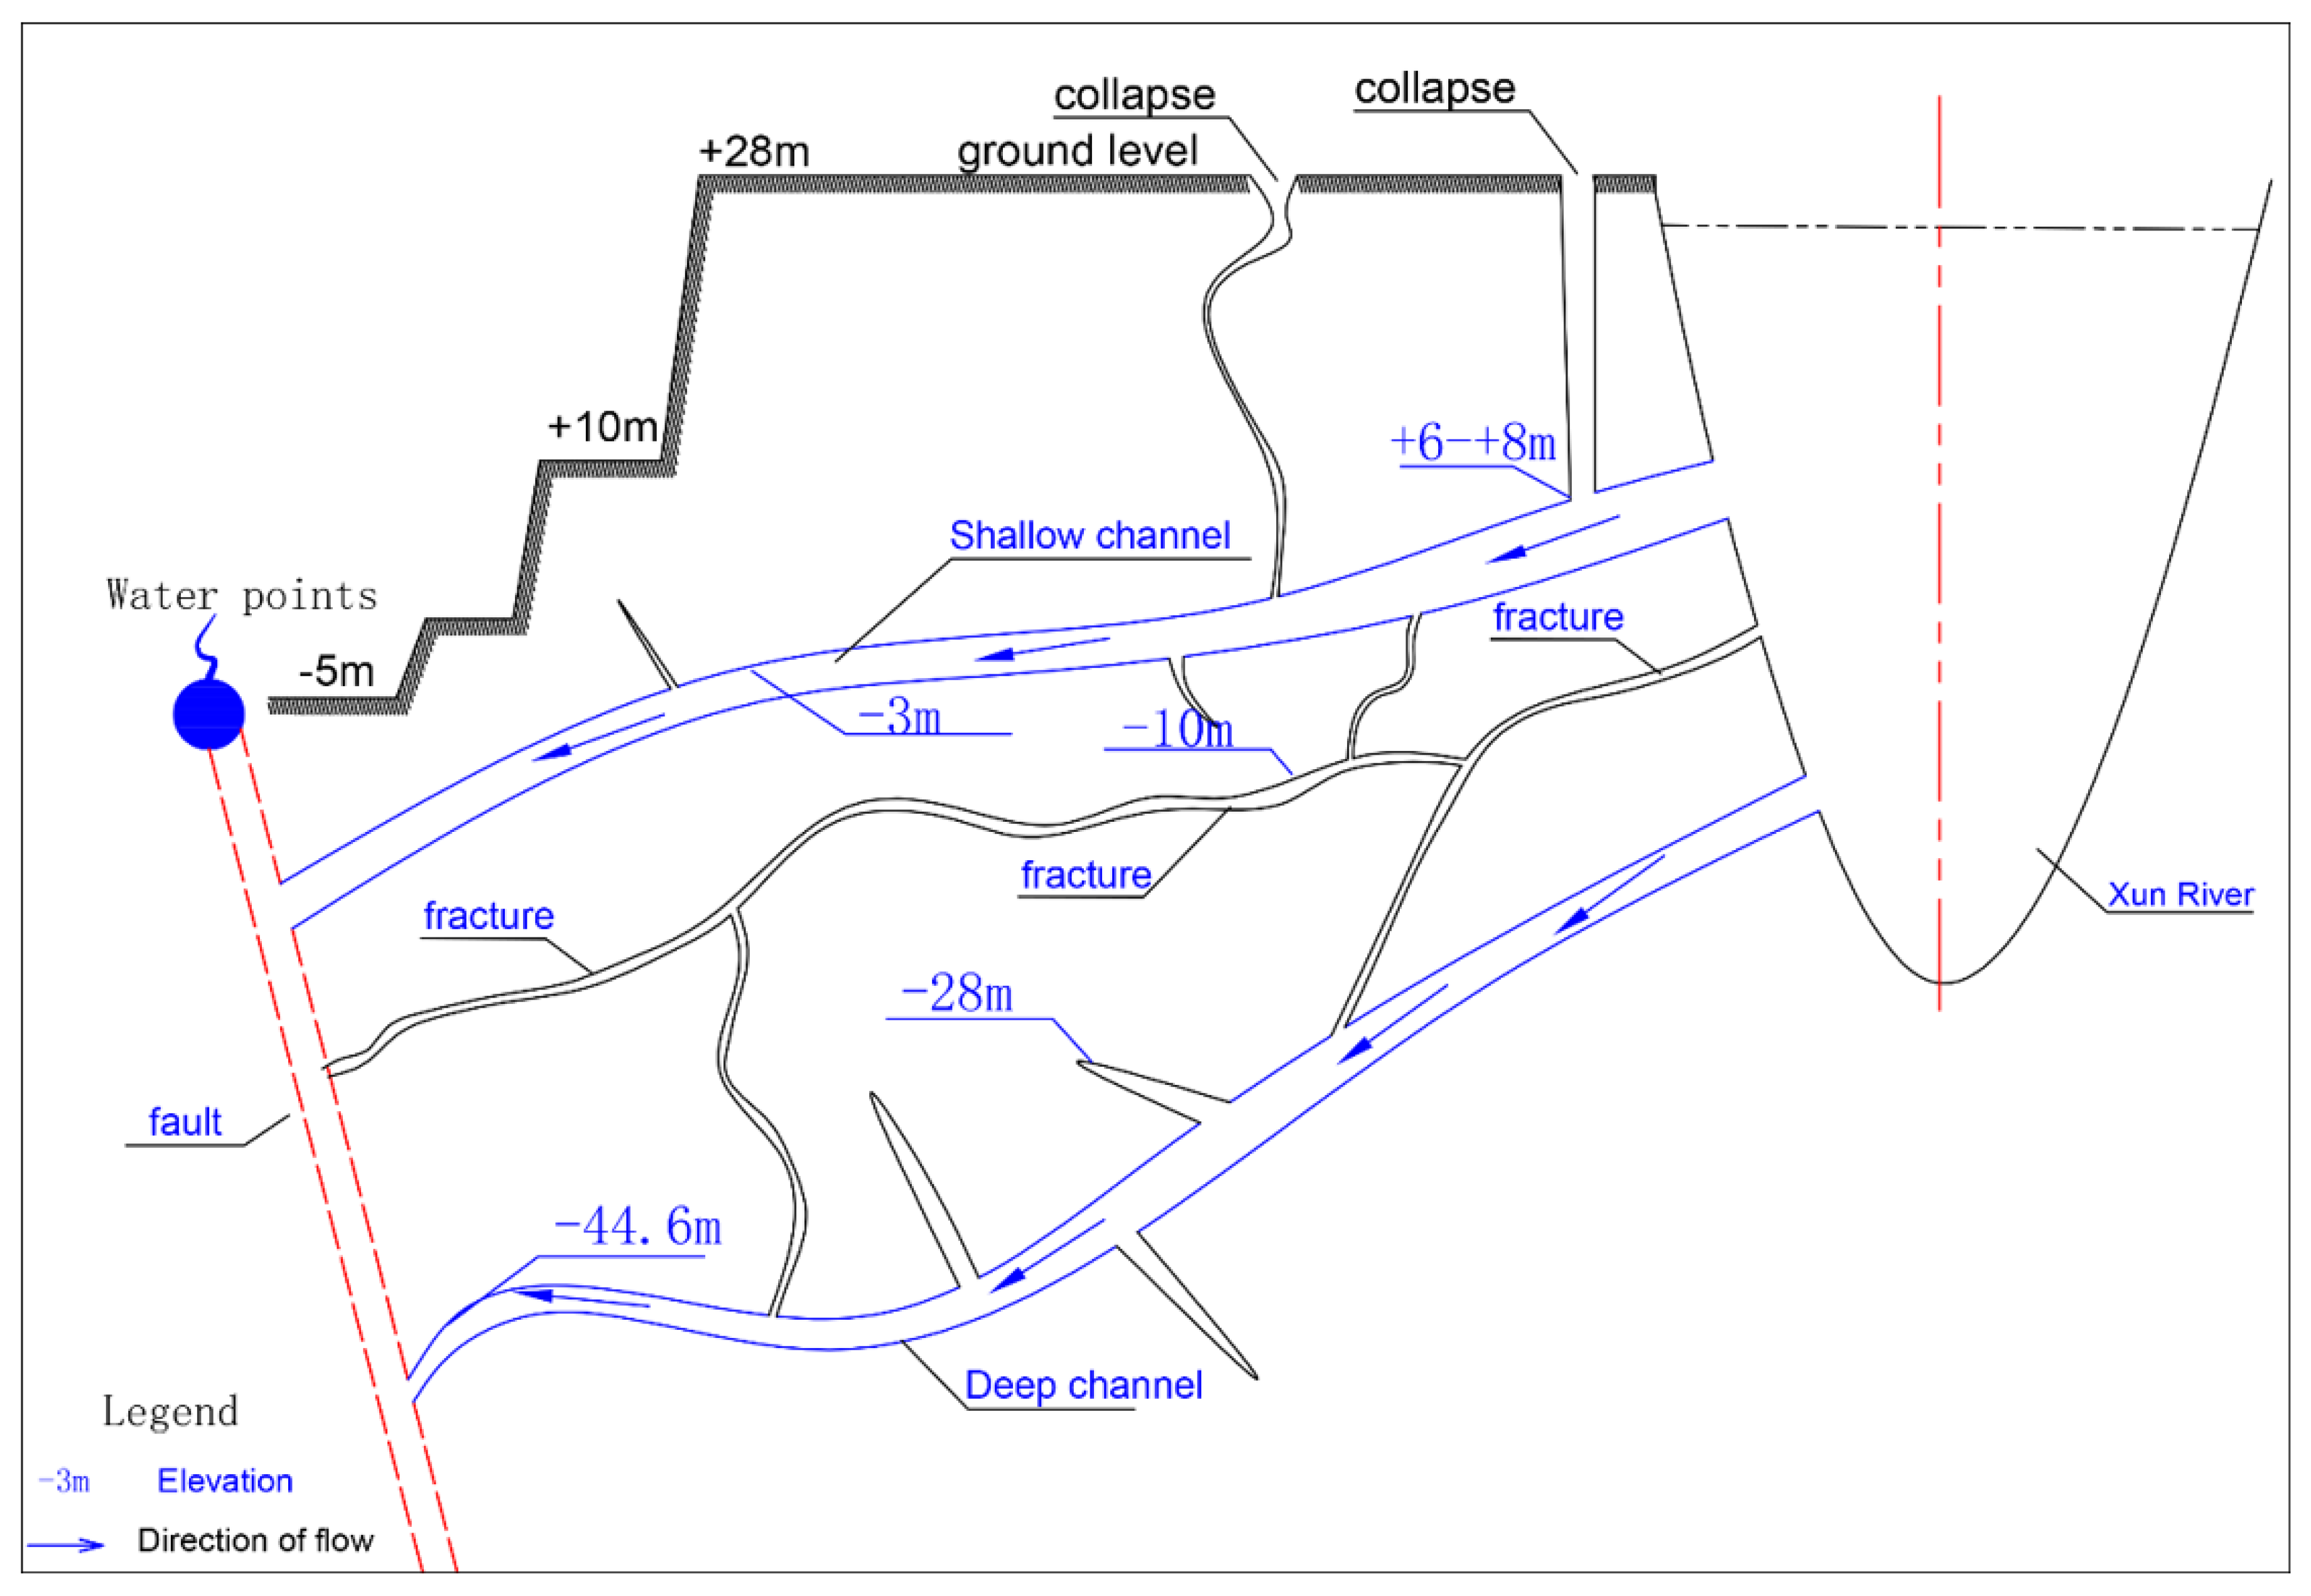
3.2. Analysis of the Hydrological Tracer Test Results

The water sample was filtered, and the chloride ions in the sample were measured using a chloride ion selective electrode. By testing the initial water sample, the concentration of NaCl in the recovered point water was about 12 mg/L.
From Figure 6, point 1 of the collection point corresponds to the NaCl concentration–time curve of the recovery point. After 6 min, the NaCl content in the water sample began to increase. The underground runoff velocity was not less than 0.33 m/s, and the peak appeared at about 15 min. The NaCl concentration was 33 mg/L, and the average water velocity of the underground runoff was calculated to be 0.14 m/s. The mass m1 of the recovered solute was 14.24 kg by the grid method, and the water content of the solute diffusion zone accounted for 71.2% of the water output of the recovery point. According to the curve shape, the curve has an inflection point at around 11 min. Therefore, we inferred that the connected channel is not unique. Through on-site field investigation, the water quality of the recovery point was turbid, and the recharge channel of the recovery point was divided into a shallow channel and a deep channel, with the deep channel being the main channel.
It can be seen from the analysis in Figure 7 that after the NaCl solution is put into point 2, the solute is detected at the recovery point after 12 min. It was concluded that the fastest water velocity in the underground runoff area was 0.07 m/s, and the NaCl concentration peaked after 26 min. The concentration was 13.4 mg/L, so the average water velocity in the runoff region was found to be 0.03 m/s. Small peaks appeared at 18 and 38 min, indicating that there are at least two small tributaries. The peak of the delivery point corresponds to a lower peak concentration, low average flow rate, and low recovery, and the curve lowering section is slower. It is presumed that the connection mode with the recovery point or the recovery point main pipeline is a crack connection.
It can be seen from Figure 8 that after the tracer was put in delivery point 3, NaCl was found at the recovery point after 2 min; the maximum water flow velocity was not less than 0.425 m/s, indicating that the connectivity is excellent, and the peak concentration was 55 mg/L. The appearance time was 6 min, and the average flow velocity of underground runoff was 0.14 m/s. The peak here is slower, indicating that there is a large water-filled cave with the underground runoff. The grid method was used to calculate the area of the curve: the mass of NaCl received at the recovery point was 16.68 kg, and the water content in the solute diffusion area accounted for 83.4% of the water at the recovery point, indicating that the pipeline runoff was mainly near the recovery point.
According to the above data, the karst can be developed into a pipeline-fracture type, and the pipeline has a certain relative independence. Injection hole 1 was connected to the main channel through the fracture, which is a pipe-fracture type runoff. The micro-cracks were connected to the recovery point. Dosing hole 3 has good connectivity, and it is inferred that the main channel connected to the gushing point is directly exposed. Based on the above inferences, an underground runoff map of this area was obtained, as shown in Figure 9.

3.3. Setting the Targeted Grouting Parameters

Targeted grouting refers to the realization of directional controllable grouting by adjusting the grouting rate, grouting pressure, material initial setting time, and so on, which can make the slurry condense in the most effective area. It can not only prevent the material from being washed away in the fast-flowing water because of the slow setting time, but it can also prevent the material from being blocked in the cracks connected with the main channel because of the fast setting time. Therefore, after determining the underground runoff conditions by hydrological tracer testing, the grouting rate needs to be calculated for the grouting pressure, and the initial setting time of the material is tested to determine the optimal grouting scheme.

3.3.1. Grouting Material Selection

Material selection depends on the type of runoff, connectivity, and different grouting materials. Before grouting, the final setting time of the self-developed organic polymer composite cement-based quick-setting double-liquid slurry with different cement water ratios (C/W) and different cement slurry self-developed materials volume ratio (volume ratio) was measured on site, as listed in Table 2. The quick-setting slurry has the characteristics of an adjustable initial setting time, good injection ability, and anti-washout properties. The most prominent advantage is that the initial setting and the final setting interval are long, the plasticity is good after the initial setting, the pumpability is good, and the anti-scouring performance is strong.
The variation of viscosity of single cement grouts with different water cement ratios can be expressed as follows:
u = ( 1 + 3 m 2.7 ) exp ( 0.12 m 2.5 e 1.6 m t ) , t 60
where m is the water cement ratio of the slurry, and t is the time.
From Figure 10, it can be seen that the viscosity of the single cement slurry increases slowly, and the viscosity is only 12–22 Pa·s in 60 min. It is suitable for grouting cracks and is beneficial for long-distance diffusion. As shown in Figure 11, the polymer cement grouting material can reach 20 Pa. s in 60 s, and its viscosity increases slowly after 60 s. Therefore, it is suitable for grouting in a fissure-pipeline channel, which can avoid blocking the connected cracks and ensure that grouts with a scouring ability enter the pipeline continuously. The viscosity of the cement–water glass double slurry reaches 500 Pa s within 60 s, and the initial and final setting time is short. It is suitable for drilling grouting with a pipeline connection, and can ensure rapid plugging.
The connection mode between D1 and the recovery point belongs to the pipeline-fracture type, and the connectivity between the fracture and the pipeline is good. Therefore, the polymer cement grouting material can be selected. According to the connection test results, the initial setting time of the grouting material should be less than 5 min. In actual engineering practices, the setting time of the polymer cement grouting material can be adjusted according to the scenario running conditions.
The connection point between D2 and the recovery point is a fracture type, and the connectivity is weak. Cement slurry with a water–cement ratio of 1 can be used for grouting, which is favorable for diffusion.
The connection point between D3 and the recovery point is a pipeline connection, the connectivity is strong, and the water volume in the pipeline is large, so anti-scouring double slurry can be used for grouting. In this case, the initial setting times of the double slurries of different ratios are as given in Table 2. Therefore, in this experiment, an anti-scouring double slurry with a ratio of gray to water of 1.5, and a volume ratio of 5:1 was used.

3.3.2. Grouting Rate

According to the connection test results, the connection mode between D1 and the recovery point is a pipe-fracture connection type. This connection mode requires that the grouting material have certain anti-scour performance and ensured fluidity when entering the fracture. After entering the main pipeline, the slurry can be brought to the initial setting state in order to ensure the retention of the slurry. The beginning initial setting time of the grouting material, tn, was 5 min, the material orifice was mixed, so the grouting pipeline volume, Vp, was 0, the grouting hole depth was 70 m, the diameter was 108 mm, and the drilling volume, Vd, was 0.64 m3. As the connected fracture volume is much smaller than the drilling volume, the solid connected fracture volume can be neglected. Except for in Equation (14), the grouting rate is as follows:
q > V p + V d t n = ( 0 + 0.64 ) / 5 = 128 L / min
So, the amount of grouting should be no more than 128 L/min.
The connection point between D2 and the recovery point is a crack connection. In order to fully diffuse the slurry, the crack should be completely blocked; cement single-liquid slurry was used for sealing, and the grouting rate can be appropriately reduced to prevent the slurry.
D3 and the recovery point are connected through a large pipeline. The water volume in the pipeline is large and the flow rate is high. In order to increase the plugging efficiency, the slurry needs to ensure the initial setting state in the borehole, so an anti-scouring two-liquid quick-setting slurry was used as the slurry. In order to form a block as soon as possible, the initial setting time of the selected grouting material, tn, was 30 s, the drilling depth was 60 m, the diameter was 108 mm, and the drilling volume, Vd, was 0.55 m3. Because of the drilling hole mixing method, the grouting pipe road volume is negligible, Vp is 0, and the grouting rate is as follows:
q = V p + V d t n = ( 0 + 0.55 ) / 5 = 1.1 m 3 / min
So, the injection rate of D3 was 1.1 m3/min. The grouting process of D3 hole was shown in Figure 12a. Before and after plugging are shown in Figure 12b,c.

3.3.3. Grouting Pressure

The final pressure of the grouting should take into account the head pressure of the water, the setting time of the material, and the type of pipe crack. The surrounding rock of the grouting area of this project is in good condition, the deepest grouting hole is −50 m, and the average water level of the connecting river is 20 m. Therefore, the head pressure of the water is 0.7 MPa. The compressive strength of limestone is 60 MPa. According to Equation (15), the grouting pressure should be controlled to 1.05 MPa < p < 9 MPa. In order to improve the retention rate of the grouting, a padding pad was constructed on site; the design compressive strength of the pad was 6 MPa, so the sum of the head pressure of water and the grouting pressure needed to be less than 6 MPa. Thus, the final pressure control range of the grouting was 1.05 MPa < p < 5.3 MPa.

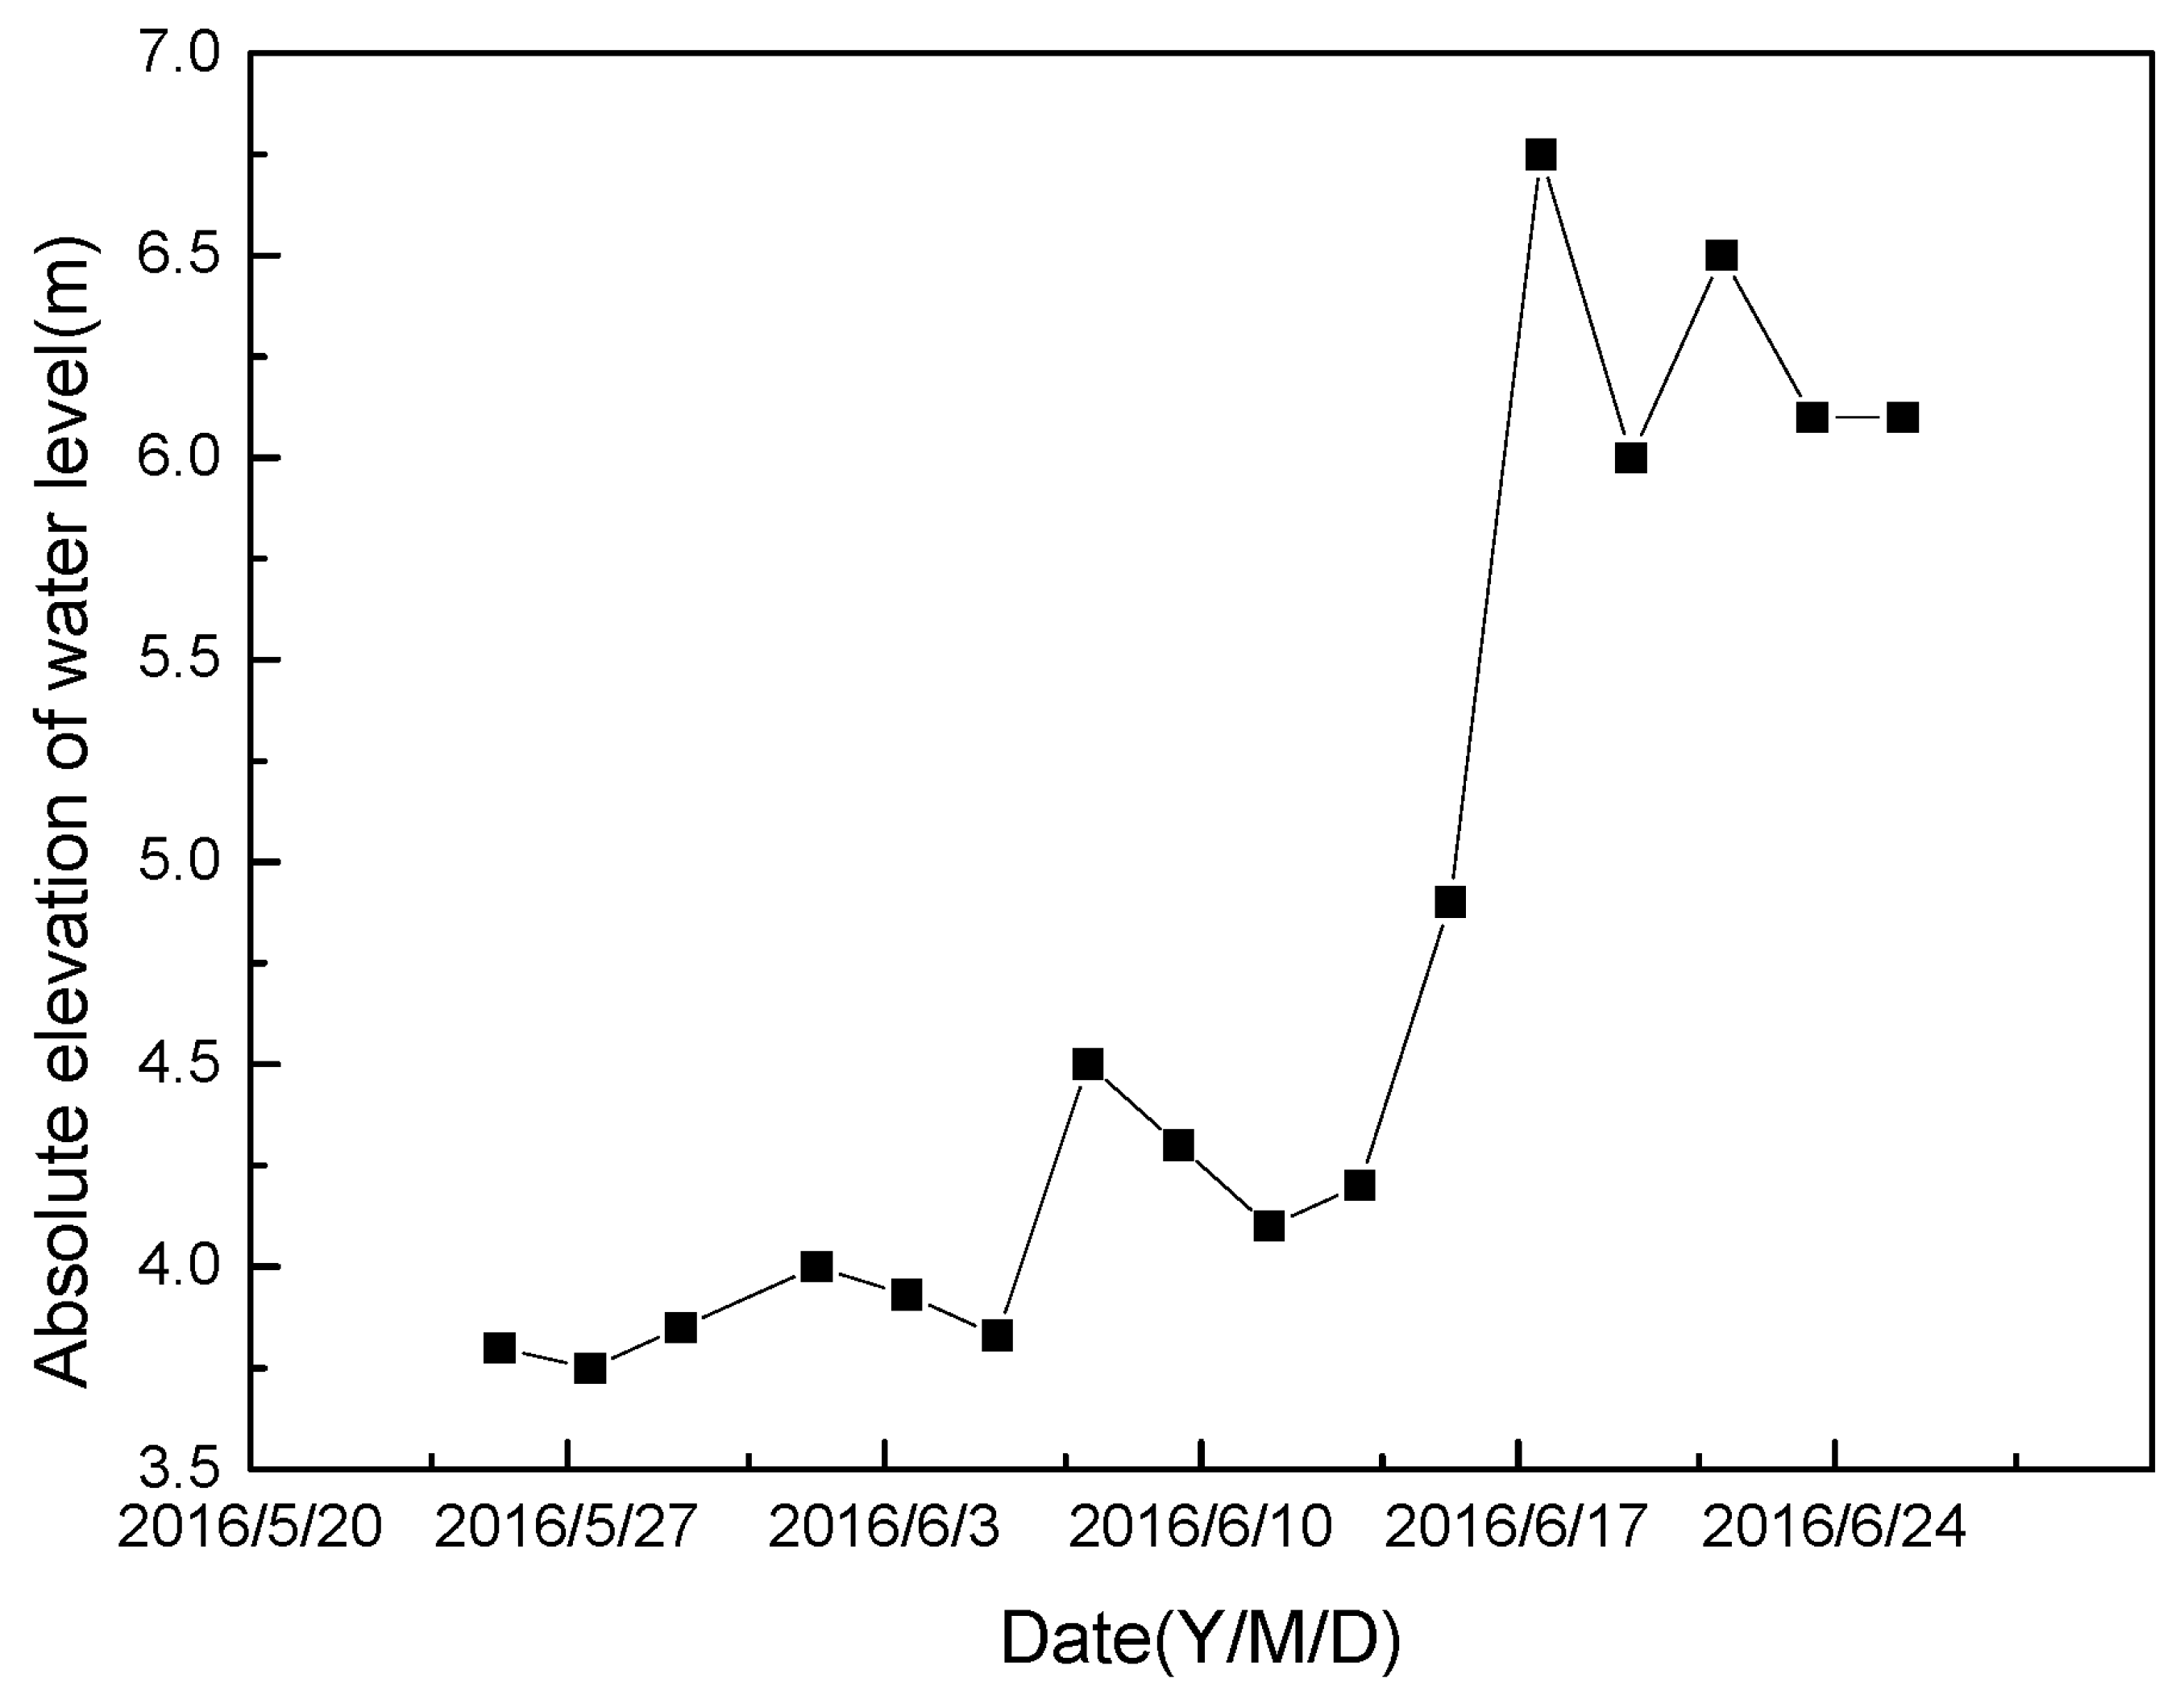
3.4. Field Test Implementation and Sealing Effect

Field Test Implementation

The comprehensive double slurry setting times, hydrological tracer testing, topographical features, revealing point depths, and so on, when adopting different grouting schemes for different hole positions, are as shown in Table 3.
Through the hydrological observation hole, the changes in the water in the mine could be grasped. The water level of the hydrological observation hole is closely related to the water in the mine, and changes can reflect the effect of grouting and plugging in the mine. The project has a hydrological observation hole outside of the pit, which is directly related to the monitoring of the water inrush point. The water level change before and after the plugging is shown in Figure 13. It can be seen that the water level of the observation hole was maintained at 4 m before the receiving point was blocked. After the water inrush point achieved complete sealing, the water level rose obviously to about 7 m. A comparison of the water inrush points before and after blocking is shown in Figure 14.

4. Conclusions

(1) This paper proposed a method to identify the type of groundwater connectivity from the tracer recovery rate and the number of peaks of the tracer curve, and to determine the maximum velocity and average velocity of the groundwater flow in a depression mine.
(2) Based on the hydrological tracer test data, the connection type of groundwater in a karst depression-type mine was obtained, the grouting material was optimized according to different connection types, and the grouting rate and grouting pressure were controlled to realize the targeted control of gushing water in the depression mine.
(3) In a limestone depression mine in Guangxi, a tracer test was carried out to obtain the connection type between the borehole and the water outlet point, the maximum water flow velocity of the runoff, and the minimum water flow velocity. Based on this, material optimization, grouting rate determination, and pressure control setting were performed. Finally, the plugging of the water outlet was realized.

Author Contributions

Conceptualization, Y.Z. and B.Z.; methodology, Y.Z. and J.W.; formal analysis, S.W.; investigation, H.L.; resources, C.L., G.Z., J.H.; writing—original draft preparation, Y.Z.; writing—review and editing, S.W. and B.Z.; visualization, J.W. and Z.X.; supervision, S.W. and B.Z.; project administration, B.Z.; funding acquisition, J.W., H.L. and L.L.

Funding

This research was funded by National Natural Science Foundation of China: No. 51809158, Shandong Provincial Natural Science Foundation, China: ZR2018BEE045, China Postdoctoral Science Foundation: 2018M630780.

Acknowledgments

I would like to express my gratitude to all those who have helped me during the writing of this thesis. I gratefully acknowledge the help of my supervisor Shugang Wang and Bo Zhang. I do appreciate her patience, encouragement, and professional instructions during my thesis writing. Also, I would like to thank Haiyan Li, Liping Li Zhenhao Xu, Jing Wang, Guodong Zhao and Junfei Han, who kindly gave me a hand when I had questions about this paper. Last but not the least, my gratitude also extends to my family who have been assisting, supporting and caring for me all of my life.

Conflicts of Interest

We declare that we do not have any commercial or associative interest that represents a conflict of interest in connection with the work submitted.

References

  1. Kuang, J. Theoretical and Engineering Examples of Grouting; Science Press: Beijing, China, 2001. [Google Scholar]
  2. Li, S.; Liu, R.; Zhang, Q.; Zhang, X. Protection against water or mud inrush in tunnel by grouting: A review. J. Rock Mech. Geotech. Eng. 2016, 8, 753–766. [Google Scholar] [CrossRef]
  3. Wolkersdorfer, C.; Bowell, R. Contemporary reviews of mine water studies in Europe. Mine Water Environ. 2004, 23, 161–173. [Google Scholar] [CrossRef]
  4. Wu, Q.; Wang, M.; Wu, X. Investigations of groundwater bursting into mine seam floors from fault zones. Int. J. Rock Mech. Ming Sci. 2004, 414, 557–571. [Google Scholar] [CrossRef]
  5. Jiang, J.; Liu, C.; Wu, C. Harmfulness and cause analysis of geolo-gical hazards in karst collapse. J. Road Southeast 2016, 3, 74–78. [Google Scholar]
  6. Wang, Y.; Shang, Y.; Yan, X.; Xu, X. Study on collapse mechanism in loose wall rock of shallow tunnel under rainfall. J. Harbin Inst. Technol. 2012, 2, 143–148. [Google Scholar]
  7. Yang, L.; Ling, R.; Li, Z.; Li, S. Influence of grout viscosity on the grouting reinforcement effect of completely weathered granite. China J. Highw. Transp. 2018, 10, 247–254. [Google Scholar]
  8. Yang, W.; Fang, Z.; Yang, X.; Shi, S.; Wang, J.; Wang, H.; Bu, L.; Li, L.; Zhou, Z.; Li, X. Experimental study of influence of karst aquifer on the law of water inrush in tunnels. Water 2018, 10, 1211. [Google Scholar] [CrossRef]
  9. Charlier, J.B.; Ladouche, B.; Maréchal, J.C. Identifying the impact of climate and anthropic pressures on karst aquifers using wavelet analysis. J. Hydrol. 2015, 523, 610–623. [Google Scholar] [CrossRef]
  10. Duran, L.; Fournier, M.; Massei, N.; Dupont, J.-P. Assessing the nonlinearity of karst response function under variable boundary conditions. Ground Water. 2015, 54, 46–54. [Google Scholar] [CrossRef]
  11. Hartmann, A.; Weiler, M.; Wagener, T.; Lange, J.; Kralik, M.; Humer, F.; Mizyed, N.; Rimmer, A.; Barberá, J.A.; Andreo, B.; et al. Process-based karst modelling to relate hydrodynamic and hydrochemical characteristics to system properties. Hydrol. Earth Syst. Sci. 2013, 17, 3305–3321. [Google Scholar] [CrossRef]
  12. Jourde, H.; Lafare, A.; Mazzilli, N.; Belaud, G.; Neppel, L.; Dörfliger, N.; Cernesson, F. Flash flood mitigation as a positive consequence of anthropogenic forcing on the groundwater resource in a karst catchment. Environ. Earth Sci. 2014, 71, 573–583. [Google Scholar] [CrossRef]
  13. Kong-A-Siou, L.; Fleury, P.; Johannet, A.; Estupina, V.B.; Pistre, S.; Dörfliger, N. Performance and complementarity of two systemic models (reservoir and neural networks) used to simulate spring discharge and piezometry for a karst aquifer. J. Hydrol. 2014, 519, 3178–3192. [Google Scholar] [CrossRef]
  14. Wang, K.; Zhang, R.; Zhou, Z.-H. Experimental study on heterogeneous flow in porous media by tracing technology, and application of diffusion-limited aggregation fractal modeling. J. Hydrol. Eng. 2007, 38, 6690–6693. [Google Scholar]
  15. Liu, R.; Li, S.; Zhang, Q.; Zhang, W.; Sun, Z.; Zhu, M. Research on application of tracer experiment analysis method to water hazards management in underground engineering. Chin. J. Rock Mech. Eng. 2011, 31, 814–821. [Google Scholar]
  16. Sun, G.; Mei, Z. Practical Underground Connection Test Method; Gui Zhou: Guizhou People’s Publishing House: Guiyang, China, 1988; pp. 20–70. [Google Scholar]
  17. Daniel, B.; Tahoora, S.N.; Bernhard, K. Modeling the hydrological impact of land use change in a dolomitedominated karst system. J. Hydrol. 2018, 567, 267–279. [Google Scholar] [CrossRef]
  18. Labat, D.; Mangin, A. Transfer function approach for artificial tracer test interpretation in karstic systems. J. Hydrol. 2015, 529, 866–871. [Google Scholar] [CrossRef]
  19. Chen, Z.; Hartmann, A.; Goldscheider, N. A new approach to evaluate spatiotemporal dynamics of controlling parameters in distributed environmental models. Environ. Modell. Softw. 2017, 87, 1–16. [Google Scholar] [CrossRef]
  20. Huang, Y.; Hou, X.; Fu, Z.; Wang, J. Detection of leakage paths at the Wanyao dam body in Southwest China by hydrochemical analysis and tracer testing. Environ. Earth Sci. 2018, 77, 791. [Google Scholar] [CrossRef]
  21. Sarrazin, F.; Hartmann, A.; Pianosi, F.; Wagener, T. V2Karst V1.0. A parsimonious large-scale integrated vegetation-recharge model to simulate the impact of climate and land cover change in karst regions. Geosci. Model Dev. Discuss. 2018, 11, 4933–4964. [Google Scholar] [CrossRef]
  22. Lu, C.; Shu, L.; Yuan, L. Determination of hydrogeologic parameters of karst aquifer based on tracer test. J. Jilin Univ. Earth Sci. Ed. 2009, 39, 717–721. [Google Scholar]
  23. Xian, Y. Study of the Groundwater t-Racing and its Application in Karst Area; Hehai University: Nanjing, China, 2006; pp. 2–4. [Google Scholar]
  24. Yin, S.; Xu, B.; Xu, H.; Xiang, X. The application of chemical tracer experiments on exploring the mine water filling conditions. J. China Coal Soc. 2014, 36, 229–234. [Google Scholar]
  25. Wang, J.; Jiang, G.; Hou, M.; Chen, D. Application of electric conductivity to the tracing test: A case study o-f babao reservoir. Acta Geosci. Sin. 2005, 26, 371–374. [Google Scholar]
  26. Aquino, T.; Aubeneau, A.; Bolster, D. Peak and tail scaling of breakthrough curves in hydrologic tracer tests. Adv. Water Res. 2015, 78, 1–8. [Google Scholar] [CrossRef]
  27. Yonghe, G. Application of connection test in karst area. Geotech. Invest. Surv. 2016, 1, 519–525. [Google Scholar]
  28. Schneidera, A.; Hohenbrinkaetl, T.L. Variability of earthworm-induced biopores and their hydrological effectiveness in space and time. Pedobiol. J. Soil Ecol. 2018, 71, 8–19. [Google Scholar] [CrossRef]
Figure 1. Potential value and chloride ion concentration logarithm.
Water 11 01000 g001
Figure 2. Schematic of the pipe-fissure.
Water 11 01000 g002
Figure 3. Concentration-Time curve of pipeline-fracture water inrush.
Water 11 01000 g003
Figure 4. The technology roadmap of targeted grouting.
Water 11 01000 g004
Figure 5. Mine area distribution.
Water 11 01000 g005
Figure 6. The NaCl concentration–time curve of D1.
Water 11 01000 g006
Figure 7. The NaCl concentration–time curve of D2.
Water 11 01000 g007
Figure 8. The NaCl concentration–time curve of D3.
Water 11 01000 g008
Figure 9. Inferred underground runoff map.
Water 11 01000 g009
Figure 10. Variation of viscosity of cement slurry with different proportions.
Water 11 01000 g010
Figure 11. Variation of viscosity of typical polymer cement and cement–water glass grouts.
Water 11 01000 g011
Figure 12. D3 grouting (a) and the collection points before (b)/after (c) plug off.
Water 11 01000 g012
Figure 13. Water observation curve.
Water 11 01000 g013
Figure 14. Contrast photo of before (a) and after (b).
Water 11 01000 g014
Table 1. Table of setting time and applicability of slurry.
MaterialsInitial Setting TimeFinal Setting TimeMine Water Shutoff Applicability
Portland cement7–14 h12–36 hSmall fracture
Sulphate aluminum cement>25 min<180 minDynamic water fracture
Cement–water glass10–600 s10 min–dozens of minutesLarge discharge and high flow rate
Polymer cement10–600 s10 min–dozens of minutesHigh fracture density
Chemical grouts10–60 s2–10 minDeep pipes and cracks
Table 2. Initial setting time of D3 grouting materials (s). C—cement; W—water.
Volume Ratio1:12:13:15:1
C/W
0.617010090170
170605080
1.545403530
Table 3. A table of grouting control.
PointRevealing Point DepthTopographical FeaturesGrouting MaterialsC/WTwo-liquid RatioInitial Setting TimeGrouting Rate (L/min)
152.5 mLimestone, filled with a small amount of yellow mudPolymer cement1.255 min260
236 mLimestone, broken beltSingle slurry115 h35
346 mCave, filling siltAnti-scouring quick-setting double slurry1.55:130 s1100

