Evaluation of Future Flood Risk According to RCP Scenarios Using a Regional Flood Frequency Analysis for Ungauged Watersheds


1
Department of Land, Water and Environment Research, Korea Institute of Civil Engineering and Building Technology, Goyang 10223, Korea
2
Department of Civil and Environmental Engineering, Hanyang University, Seoul 04763, Korea
3
Department of Civil and Environmental Engineering, Hanyang University, Ansan 15588, Korea
*
Author to whom correspondence should be addressed.
Water 2019, 11(5), 992; https://doi.org/10.3390/w11050992
Submission received: 24 March 2019
/
Revised: 30 April 2019
/
Accepted: 7 May 2019
/
Published: 11 May 2019
(This article belongs to the Special Issue Study for Ungauged Catchments—Data, Models and Uncertainties)
Abstract
:According to the accepted climate change scenarios, the future rainfall in the Korean peninsula is expected to increase by 3–10%. The expected increase in rainfall leads to an increase of runoff that is directly linked to the stability of existing and newly installed hydraulic structures. It is necessary to accurately estimate the future frequency and severity of floods, considering increasing rainfall according to different climate change scenarios. After collecting observed flood data over twenty years in 12 watersheds, we developed a regional frequency analysis (RFA) for ungauged watersheds by adjusting flood quantiles calculated by a design rainfall-runoff analysis (DRRA) using natural flow data as an index flood. The proposed RFA was applied to estimate design floods and flood risks in 113 medium-sized basins in South Korea according to representative concentration pathway (RCP) scenarios. Regarding the future of the Korean peninsula, compared with the present, the flood risks were expected to increase by 24.85% and 20.28% on average for the RCP 8.5 and 4.5 scenarios, respectively.
1. Introduction
Climate change is one of the most extensively researched and discussed issues affecting the natural and human environment. As discussed in previous studies, due to climate change, rainfall patterns will become more irregular, the frequency of concentrated heavy rains will increase, and flood damage is expected to increase in the future [1]. Therefore, it is imperative to accurately estimate current or future design floods. Estimation of the design flood is the most basic engineering process that determines the design criteria of hydraulic structures. A design flood is a hypothetical flood (i.e., peak discharge in this study) adopted as the basis in engineering design of a water resources system [2].
There are two practical methods for estimating design floods; a flood frequency analysis (FFA) which estimates design floods via statistical analyses of observed streamflow data, and a design rainfall-runoff analysis (DRRA) which estimates design floods using a conceptual rainfall-runoff model coupled with statistical analyses of observed rainfall data. The United States has developed an FFA-based guideline (Bulletin 17B) to estimate design floods using abundant flow data for water resources design [3]. The United Kingdom applies the FFA for gauged watersheds and employs the DRRA for ungauged watersheds [4]. Many countries in Europe such as Austria, Cyprus, Germany, Denmark, France, Ireland, Italy, Lithuania, Norway, Poland, Slovakia, Spain, and the United Kingdom share flood data to perform point or regional frequency analyses. The Centre for Ecology and Hydrology [5] provides technical examples and guidelines to help the selection of an appropriate probability distribution across Europe for a regional frequency analysis (RFA). Likewise, Australia calculates design floods by localizing the results of DRRA and FFA for the site of interest [6].
There are three major issues concerning that the FFA and the DRRA provide different design floods even though they are applied for the same region. The first is due to a difference in the number of observed data. McKerchar and Macky [7] found that the FFA is less reliable than the DRRA and the RFA when applied to the watershed with fewer observations. Calver et al. [8] showed that two methods estimated different 50-y design floods by a maximum of ±35%. The second is that the nonlinearity in the relationship between rainfall and runoff influences the estimation of design floods. A unit hydrograph was developed assuming that the relationship between rainfall and runoff is linear and time-invariant. Even though the assumptions of linearity and time invariance are inadequate for actual watersheds, it is still currently used because of its simplicity. In 15 Korean dam watersheds, floods increased by 42%, while rainfall amounts increased by an average of 17.6% [9], clearly showing a nonlinearity. In addition, the relationship between the design rainfall and the design flood varies according to the return periods. Choi et al. [10] found that the difference of design floods between the two methods depends on the watershed area. The third is due to the difference in watershed characteristics. In watersheds with very short travel times, the specific flow rate is overestimated by all conceptual hydrological models, including the rational method and the unit hydrograph method [11]. Rogger et al. [12] conducted a Monte Carlo simulation to demonstrate that, in most catchments, the event-based model produces larger flood estimates than the FFA. The reasons for these differences depend on the watershed characteristics and the different rainfall inputs that were applied.
The RFA is a method developed to estimate design floods in ungauged areas or areas with a lack of site data [4,13,14,15]. The RFA estimates are consistently closer to the estimates from the flood records than the estimates based on rainfall-runoff methods [7]. In addition, the intensity and frequency of heavy rainfall are increasing due to climate change. The Intergovernmental Panel on Climate Change (IPCC) 5th assessment report has predicted that the average global temperature would rise by 0.85 °C over the past 133 years (1880–2012) due to global warming [16]. By the decade 2006–2015, human activity had warmed the world by 1 °C compared to pre-industrial times (1850–1900). If the current warming rate continues, the world would reach human-induced global warming of 1.5 °C around 2040 [17], and Korea’ precipitation will increase by 18% by the end of the 21st century, according to the representative concentration pathway (RCP) scenario. Since there are many ungauged watersheds in Korea, the RFA should be applied to estimate design floods, which can be utilized to estimate the flood risk and then to mitigate flood damage in the future.
Recently, future flood risks are being studied using various climate change scenarios [18,19,20,21,22]. Because climate change is likely to affect the water cycle by influencing the precipitation patterns [23], it is important to integrate the anticipated changes into the design flood in response to the increasing flood risk. Various technologies for disaster prediction, preparation, and prevention are needed to cope with future flood disasters, and it is necessary to calculate accurate future hydrological quantities to ensure the stability of hydraulic structures. We need to develop a method to estimate the design floods for preparing a comprehensive flood mitigation plan considering climate change, especially for the ungauged watershed.
The objectives of this study are to develop a RFA for estimating design floods of medium-sized watersheds and to assess the flood risks in South Korea according to RCP climate change scenarios.
2. Study Areas and Data Sources
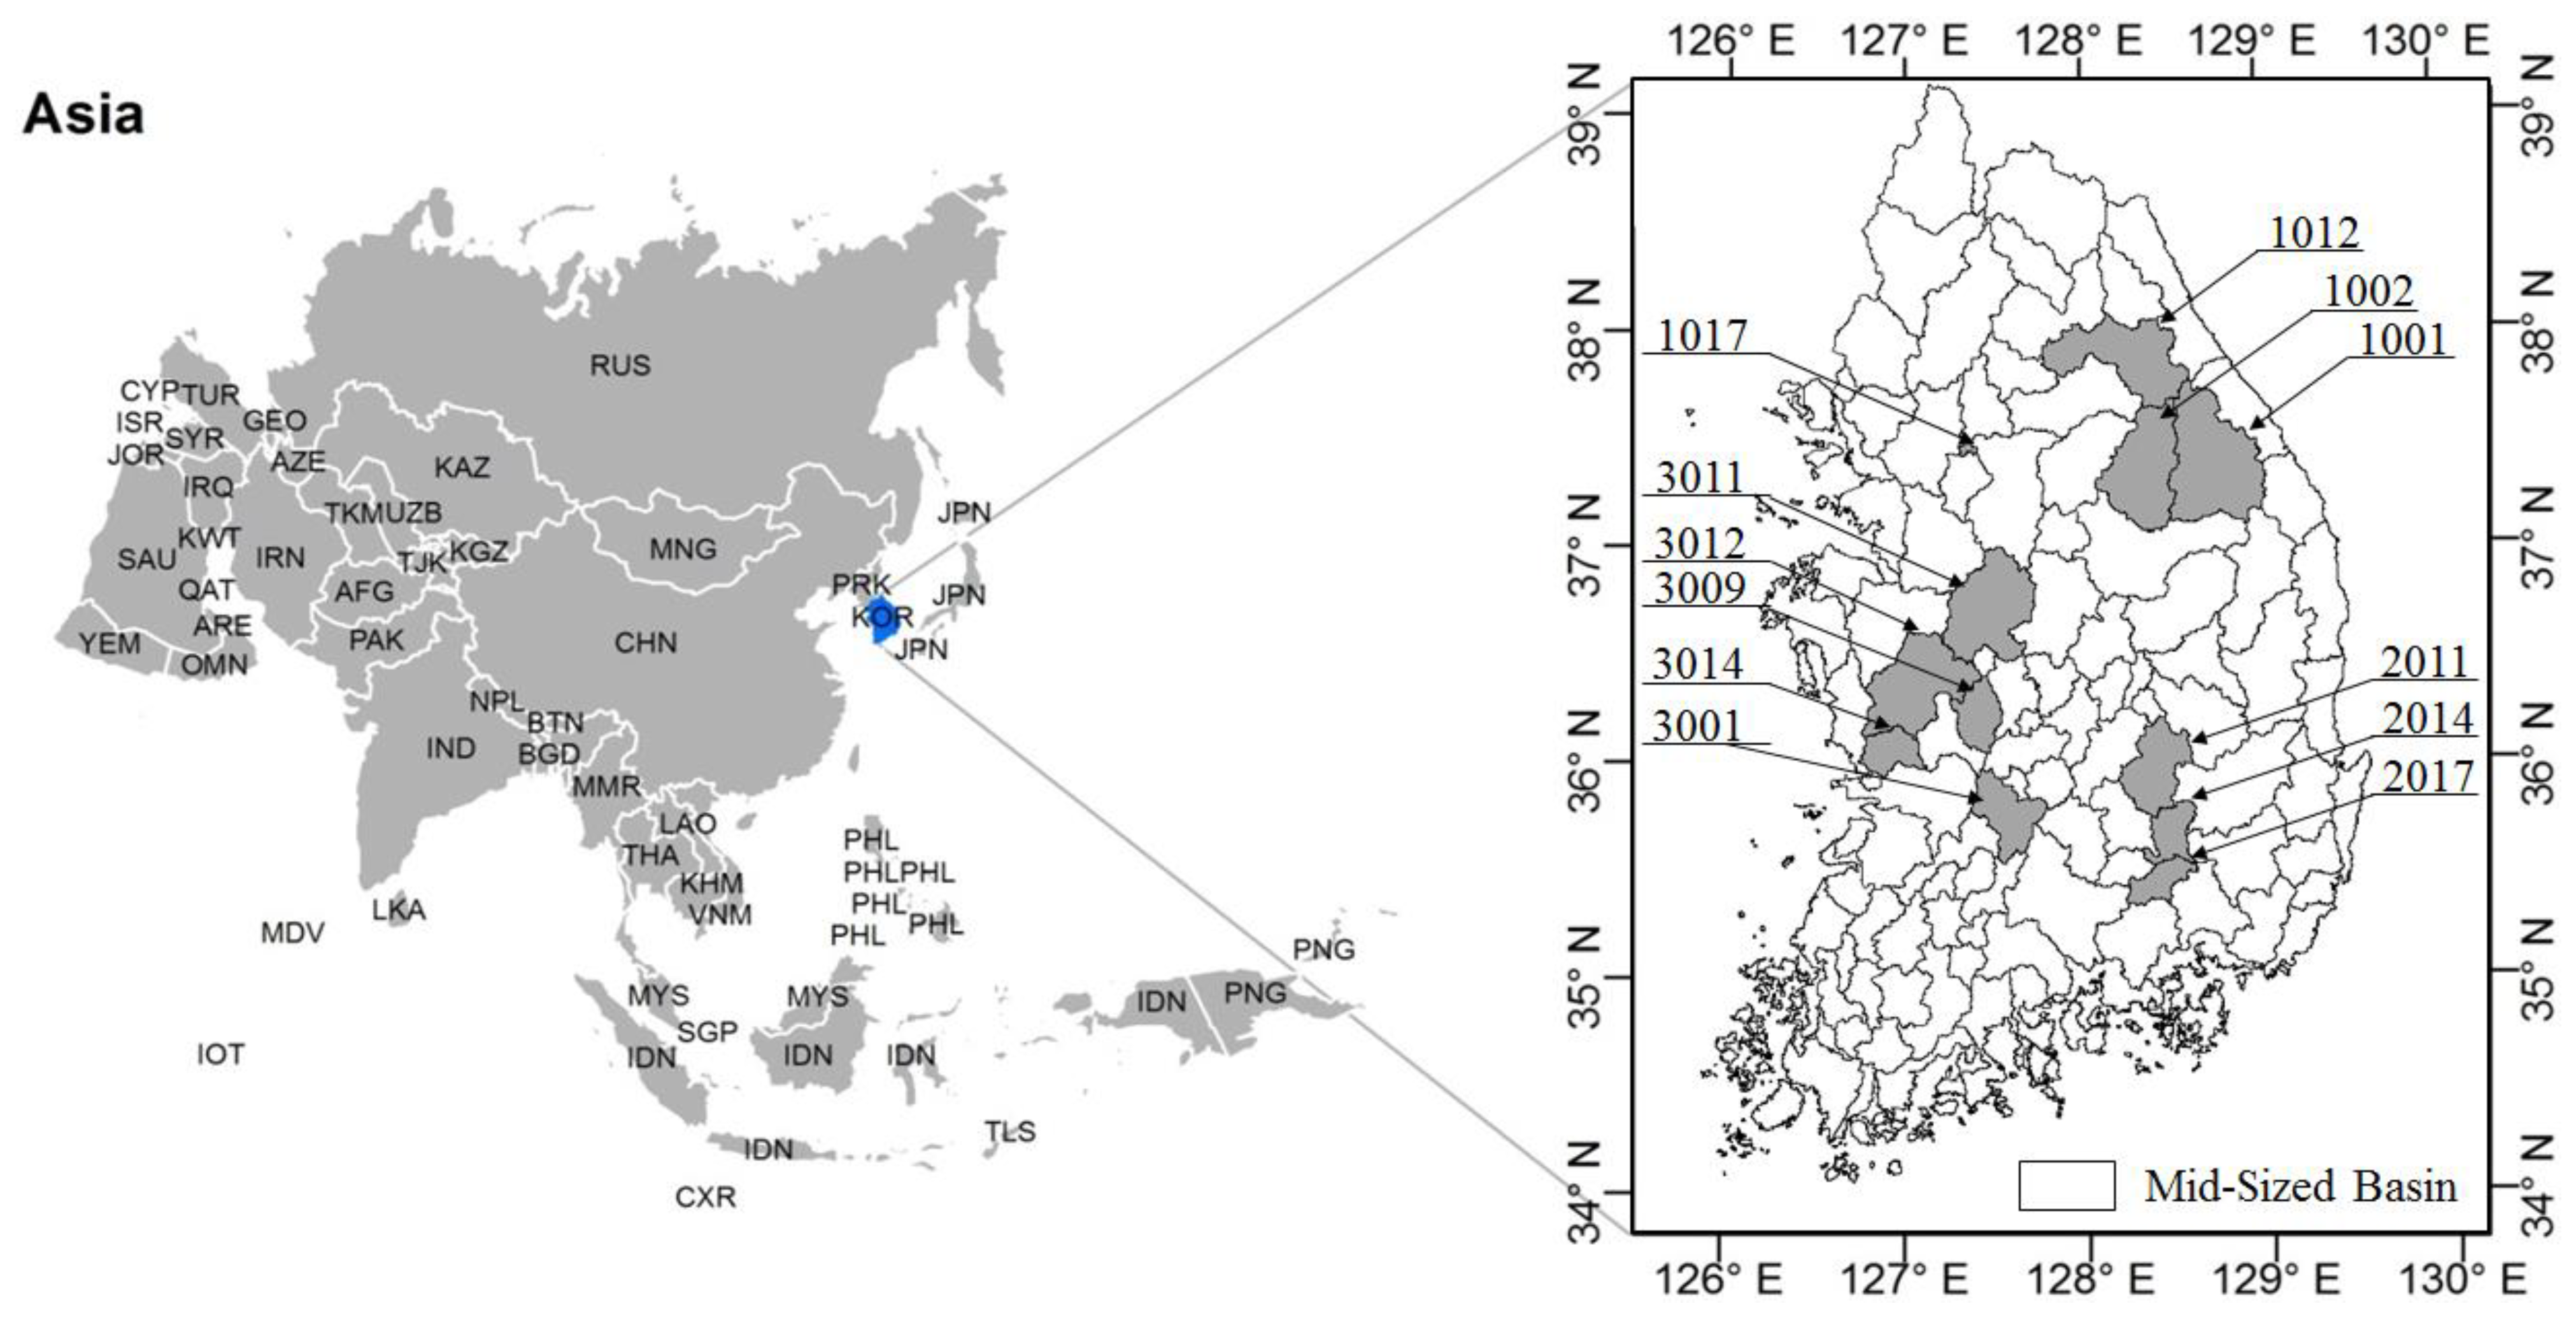
We selected 12 watersheds for developing an RFA, as shown in Figure 1: Four in the Han River (#1001, #1002, #1012, #1017), three in the Nakdong River (#2011, #2014, #2017), and five in the Geum River (#3001, #3009, #3011, #3012, #3014), and collected rainfall and streamflow data. The four digits in Figure 1 present the code number of watershed.
The FFA is a method to estimate design floods by a statistical frequency analysis using annual maximum flow data. The DRRA is a method to estimate design floods by a rainfall-runoff model after performing a statistical frequency analysis using annual maximum rainfall data.
We first performed the FFA and the DRRA to evaluate the estimated design floods for the selected watersheds. The watershed information and data sources are shown in Table 1. In this study, the design floods estimated by the FFA were assumed as the true values because the FFA provides the estimates from the statistical analyses of observed streamflow data. For some areas without sufficient observed streamflow data, the FFA can be applied after stochastically simulating flood events [24]. In this study, we collected the DDRA-based design floods from the government reports and used them to develop an RFA for ungauged watersheds, which is presented in Section 3, because they were already verified and accepted by the Ministry of Land, Infrastructure, and Transport (MOLIT), Korea. We also employed the natural flow data used for developing Water Vision for 2011–2020, which were calculated by the tank model for medium-sized watersheds in Korea. The natural flow was calculated by estimating the average rainfall and potential evapotranspiration (using Hargreaves formula). MOLIT estimated the natural flows for medium-sized basins during 1966–2003 to develop a national comprehensive water resources management plan [25]. The parameters of the Tank model have been calibrated and verified through Nash–Sutcliffe Efficiency (NSE) and Ratio of Volume (ROV). The estimated natural flows have been evaluated and approved by the Korea Meteorological Administration (KMA). Therefore, we used the natural flow data estimated by a Tank model considering climate change scenarios which were provided by KMA [26].
Specifically, the natural flow rates were used to calibrate the design floods estimated by the DRRA for ungauged watersheds. The proposed RFA was applied to estimate design floods in 113 medium-sized basins considering future climate change scenarios provided by KMA [27]. Kim et al. [28] produced daily maximum temperature, daily mean temperature, daily minimum temperature, and daily precipitation data with 1 km horizontal resolution for 10 years from 2001 to 2010 using MK (Modified Korean)-PRISM (Parameter-elevation Regressions an Independent Slopes Model). KMA has also simulated MK-PRISM for RCPs 4.5 and 8.5 [29] and provides natural flows for medium-sized watersheds as application information items in the water resources sector. Finally, risk maps corresponding to future climate change scenarios were developed through hydrological risk analysis.
Because Korea lacks flow observation data, it is difficult to perform the FFA; therefore, it is inevitable to perform the RFA in practice. In this study, we have developed a regional frequency analysis using 12 gauged watersheds with streamflow observations. We have also employed the natural flows to assess the future flood risk according to the RCP scenario.
3. Regional Flood Frequency Analysis
It is necessary to test the independence and homogeneity of the observed data before performing a statistical frequency analysis. The tests using the lag-one serial correlation coefficient and the indicator for nonhomogeneity indicated that the data used in this study including observed streamflows and simulated natural flows were independent and homogeneous. Based on the goodness-of-fit test, this study employed the generalized extreme value distribution (GEV) for annual maximum streamflow data. The parameters of GEV were estimated by the probability-weighted moment method (PWM).
This study developed a regression equation to estimate the design floods by adjusting the design floods estimated by the DRRA and using the natural flows. After investigating various regression equations, such as an exponential, power, and growth-rate equation, a two-variable regression equation was chosen as given in Equation (1), which had the highest R2 compared with others.
where Qt,FFA and Qt,DRRA are the t-y floods estimated by the FFA and the DRRA, respectively, Qt,NF is the t-y flood estimated by the FFA using natural flows, and a, b, and c are regression coefficients. In this study, a, b, and c were determined as shown in Table 2.
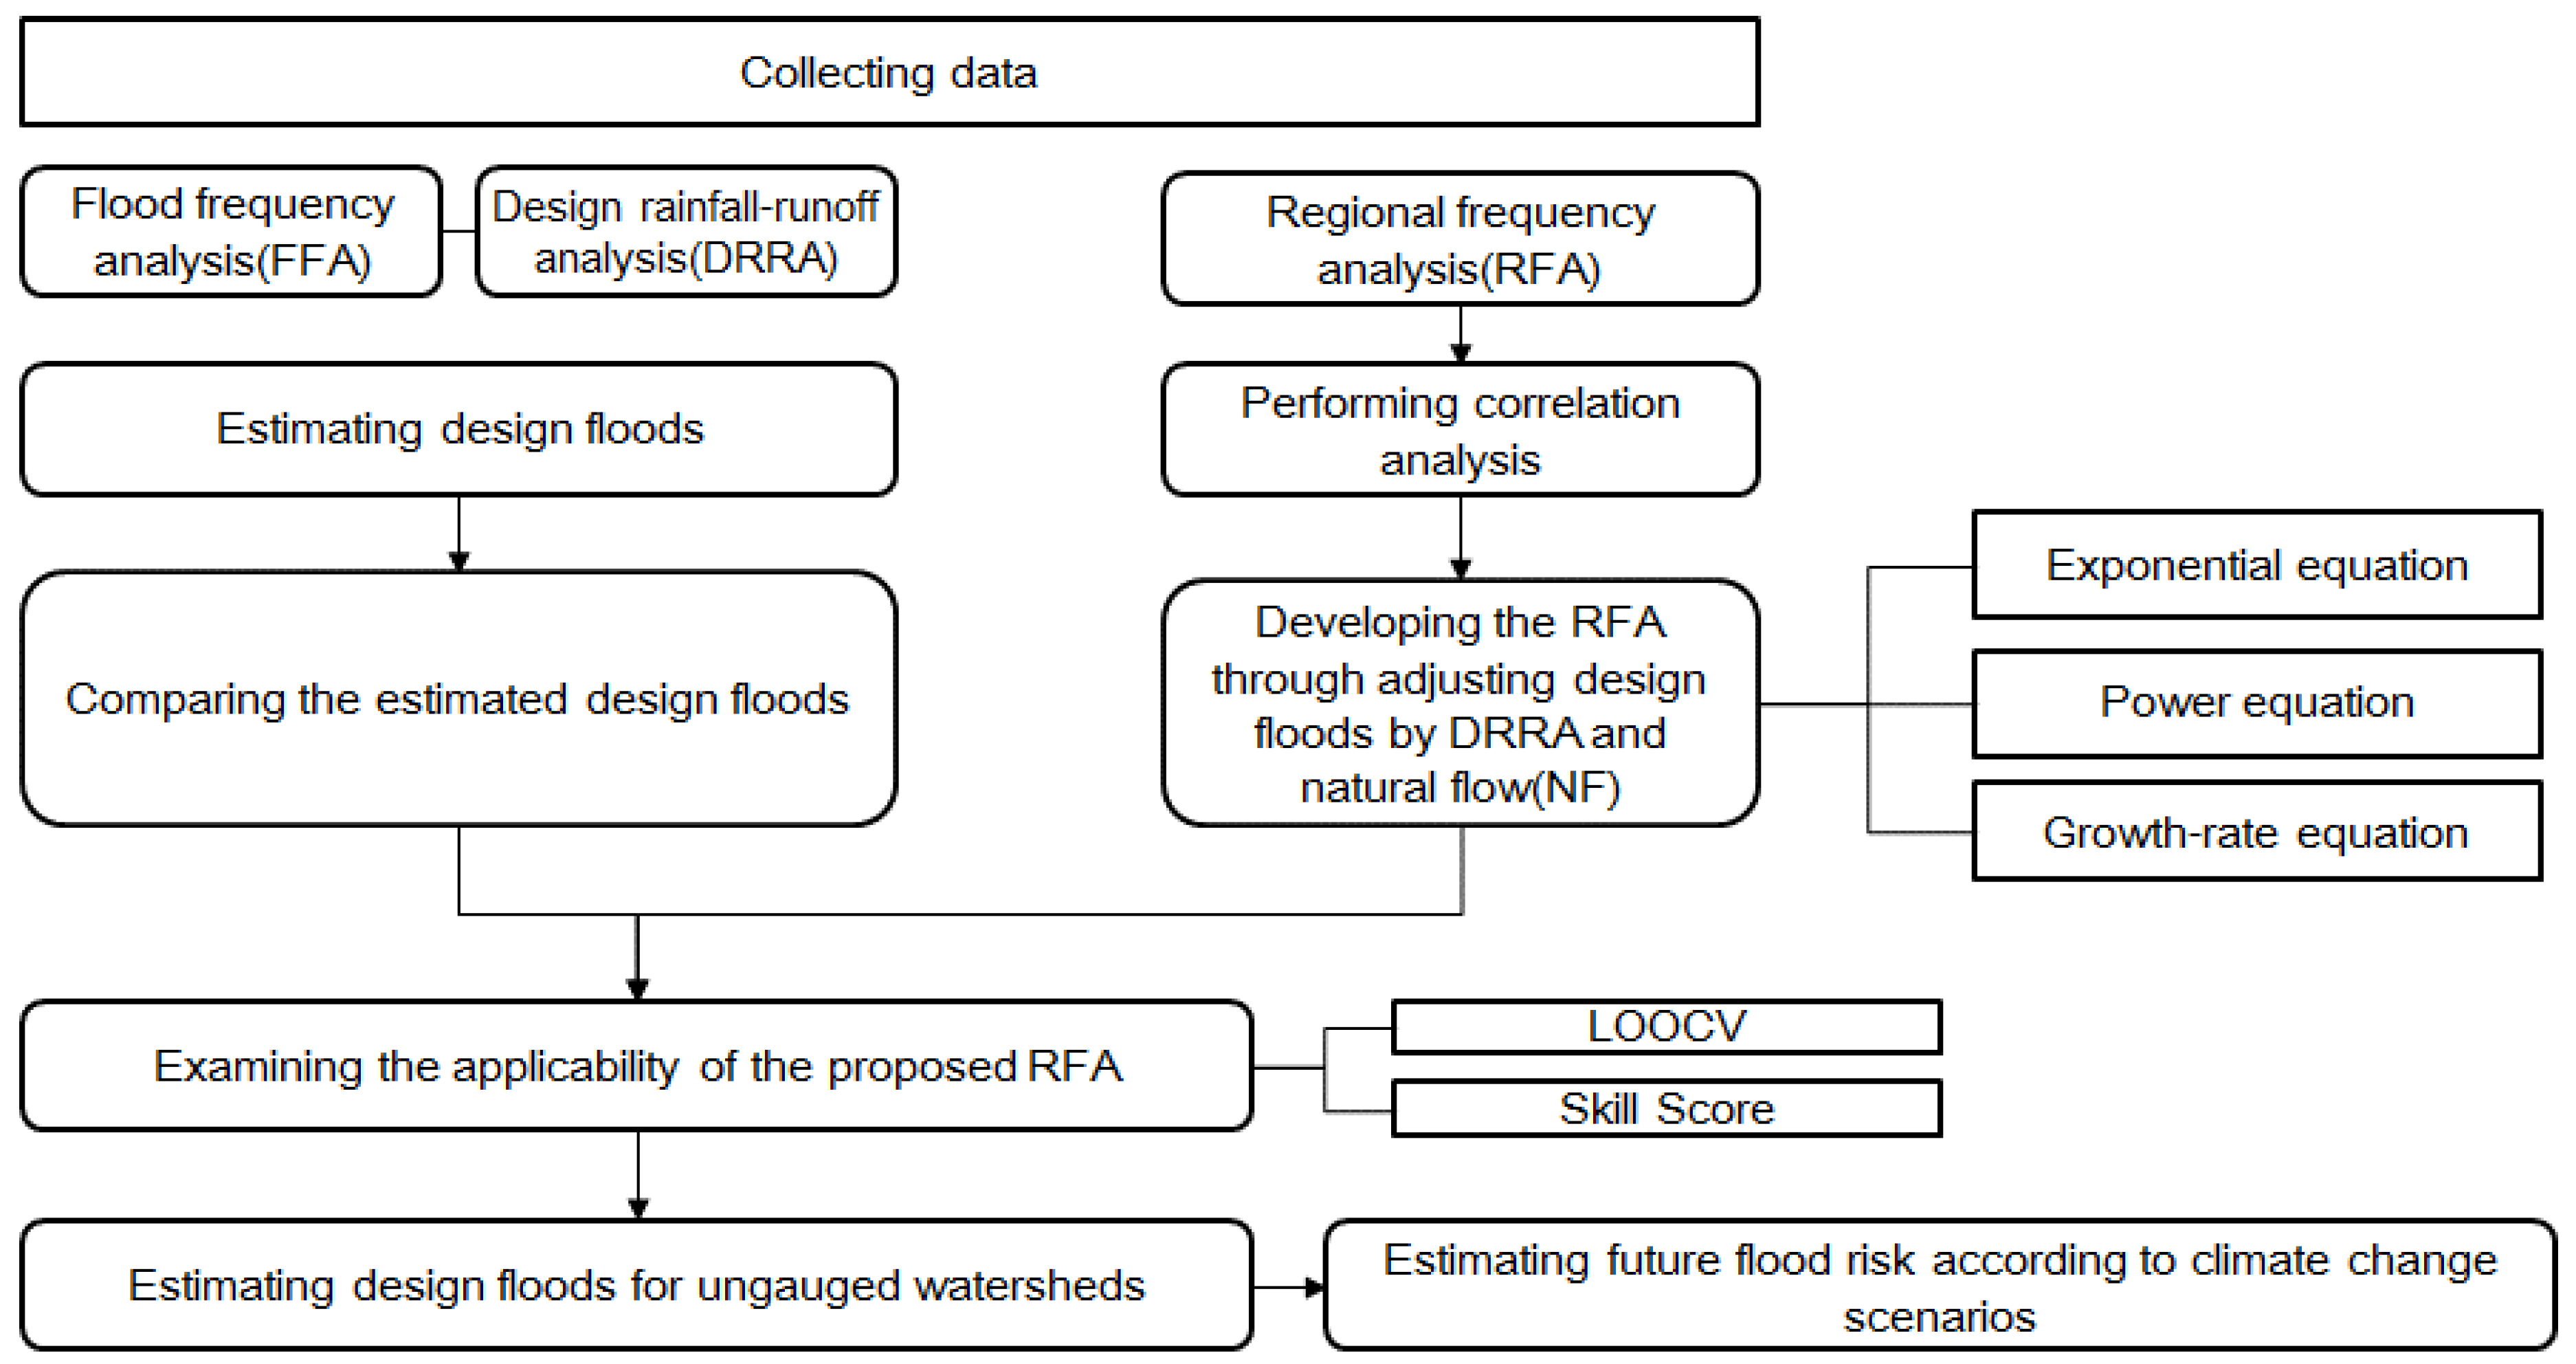
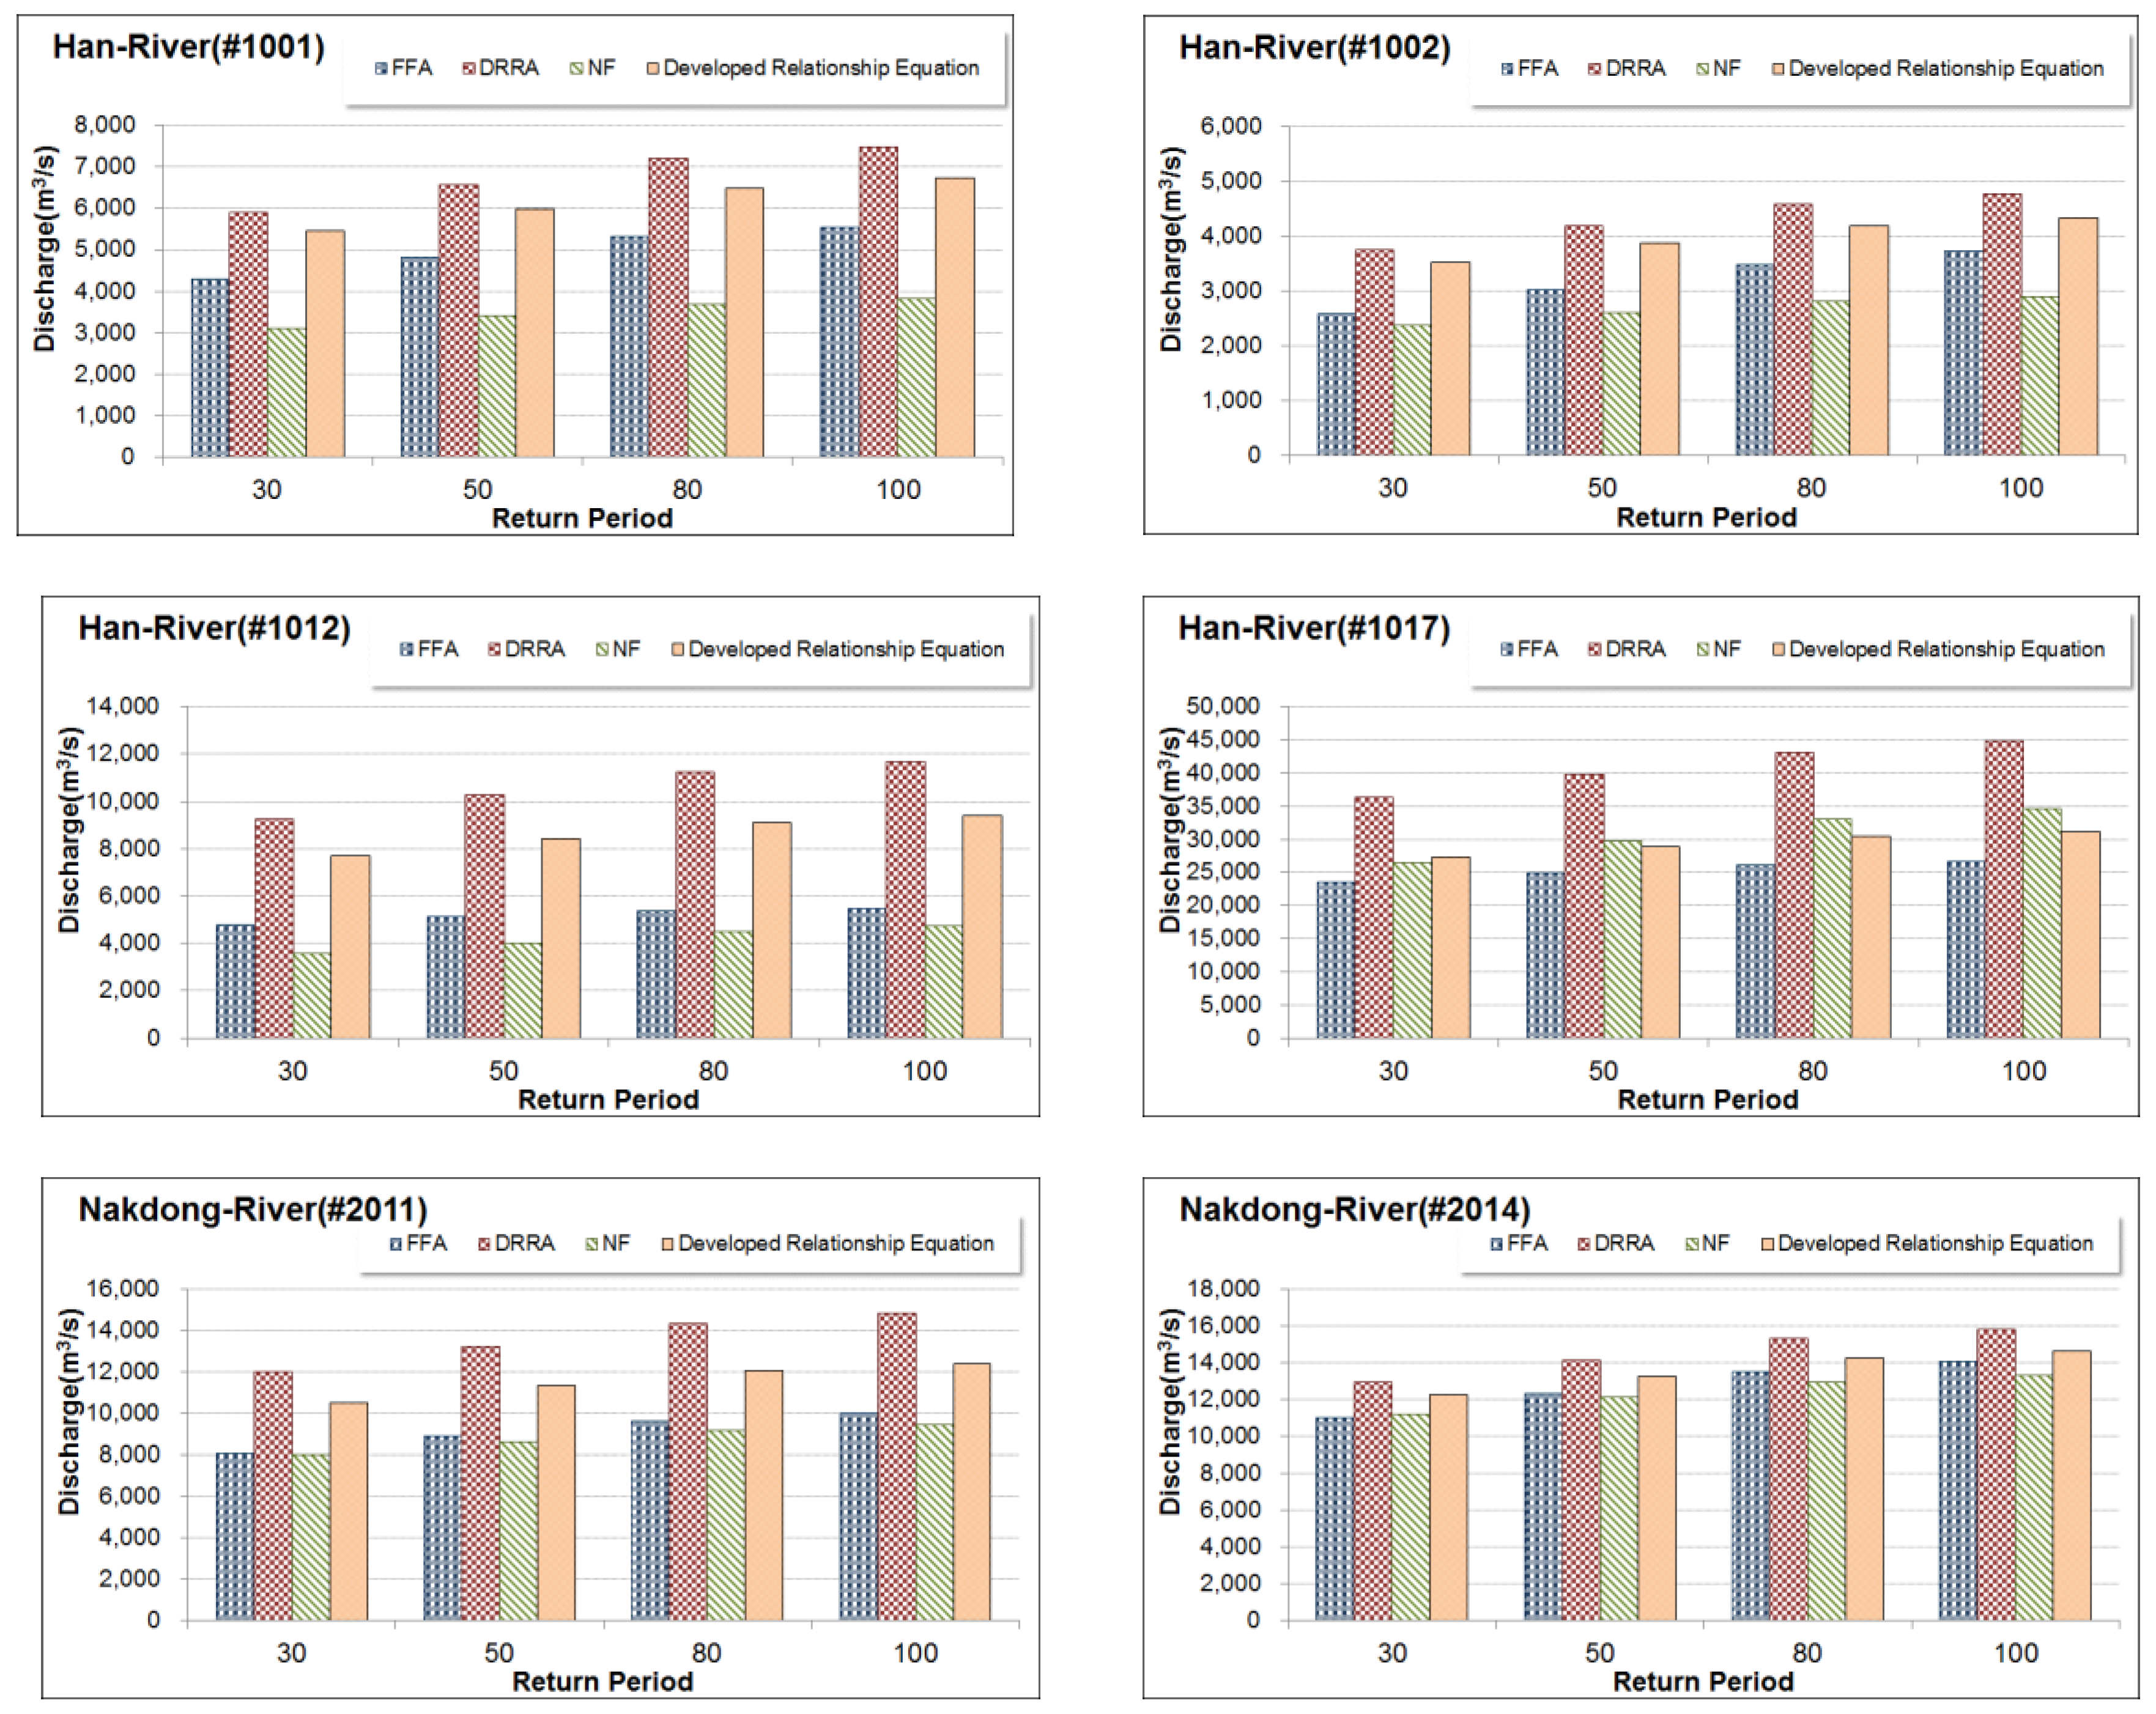
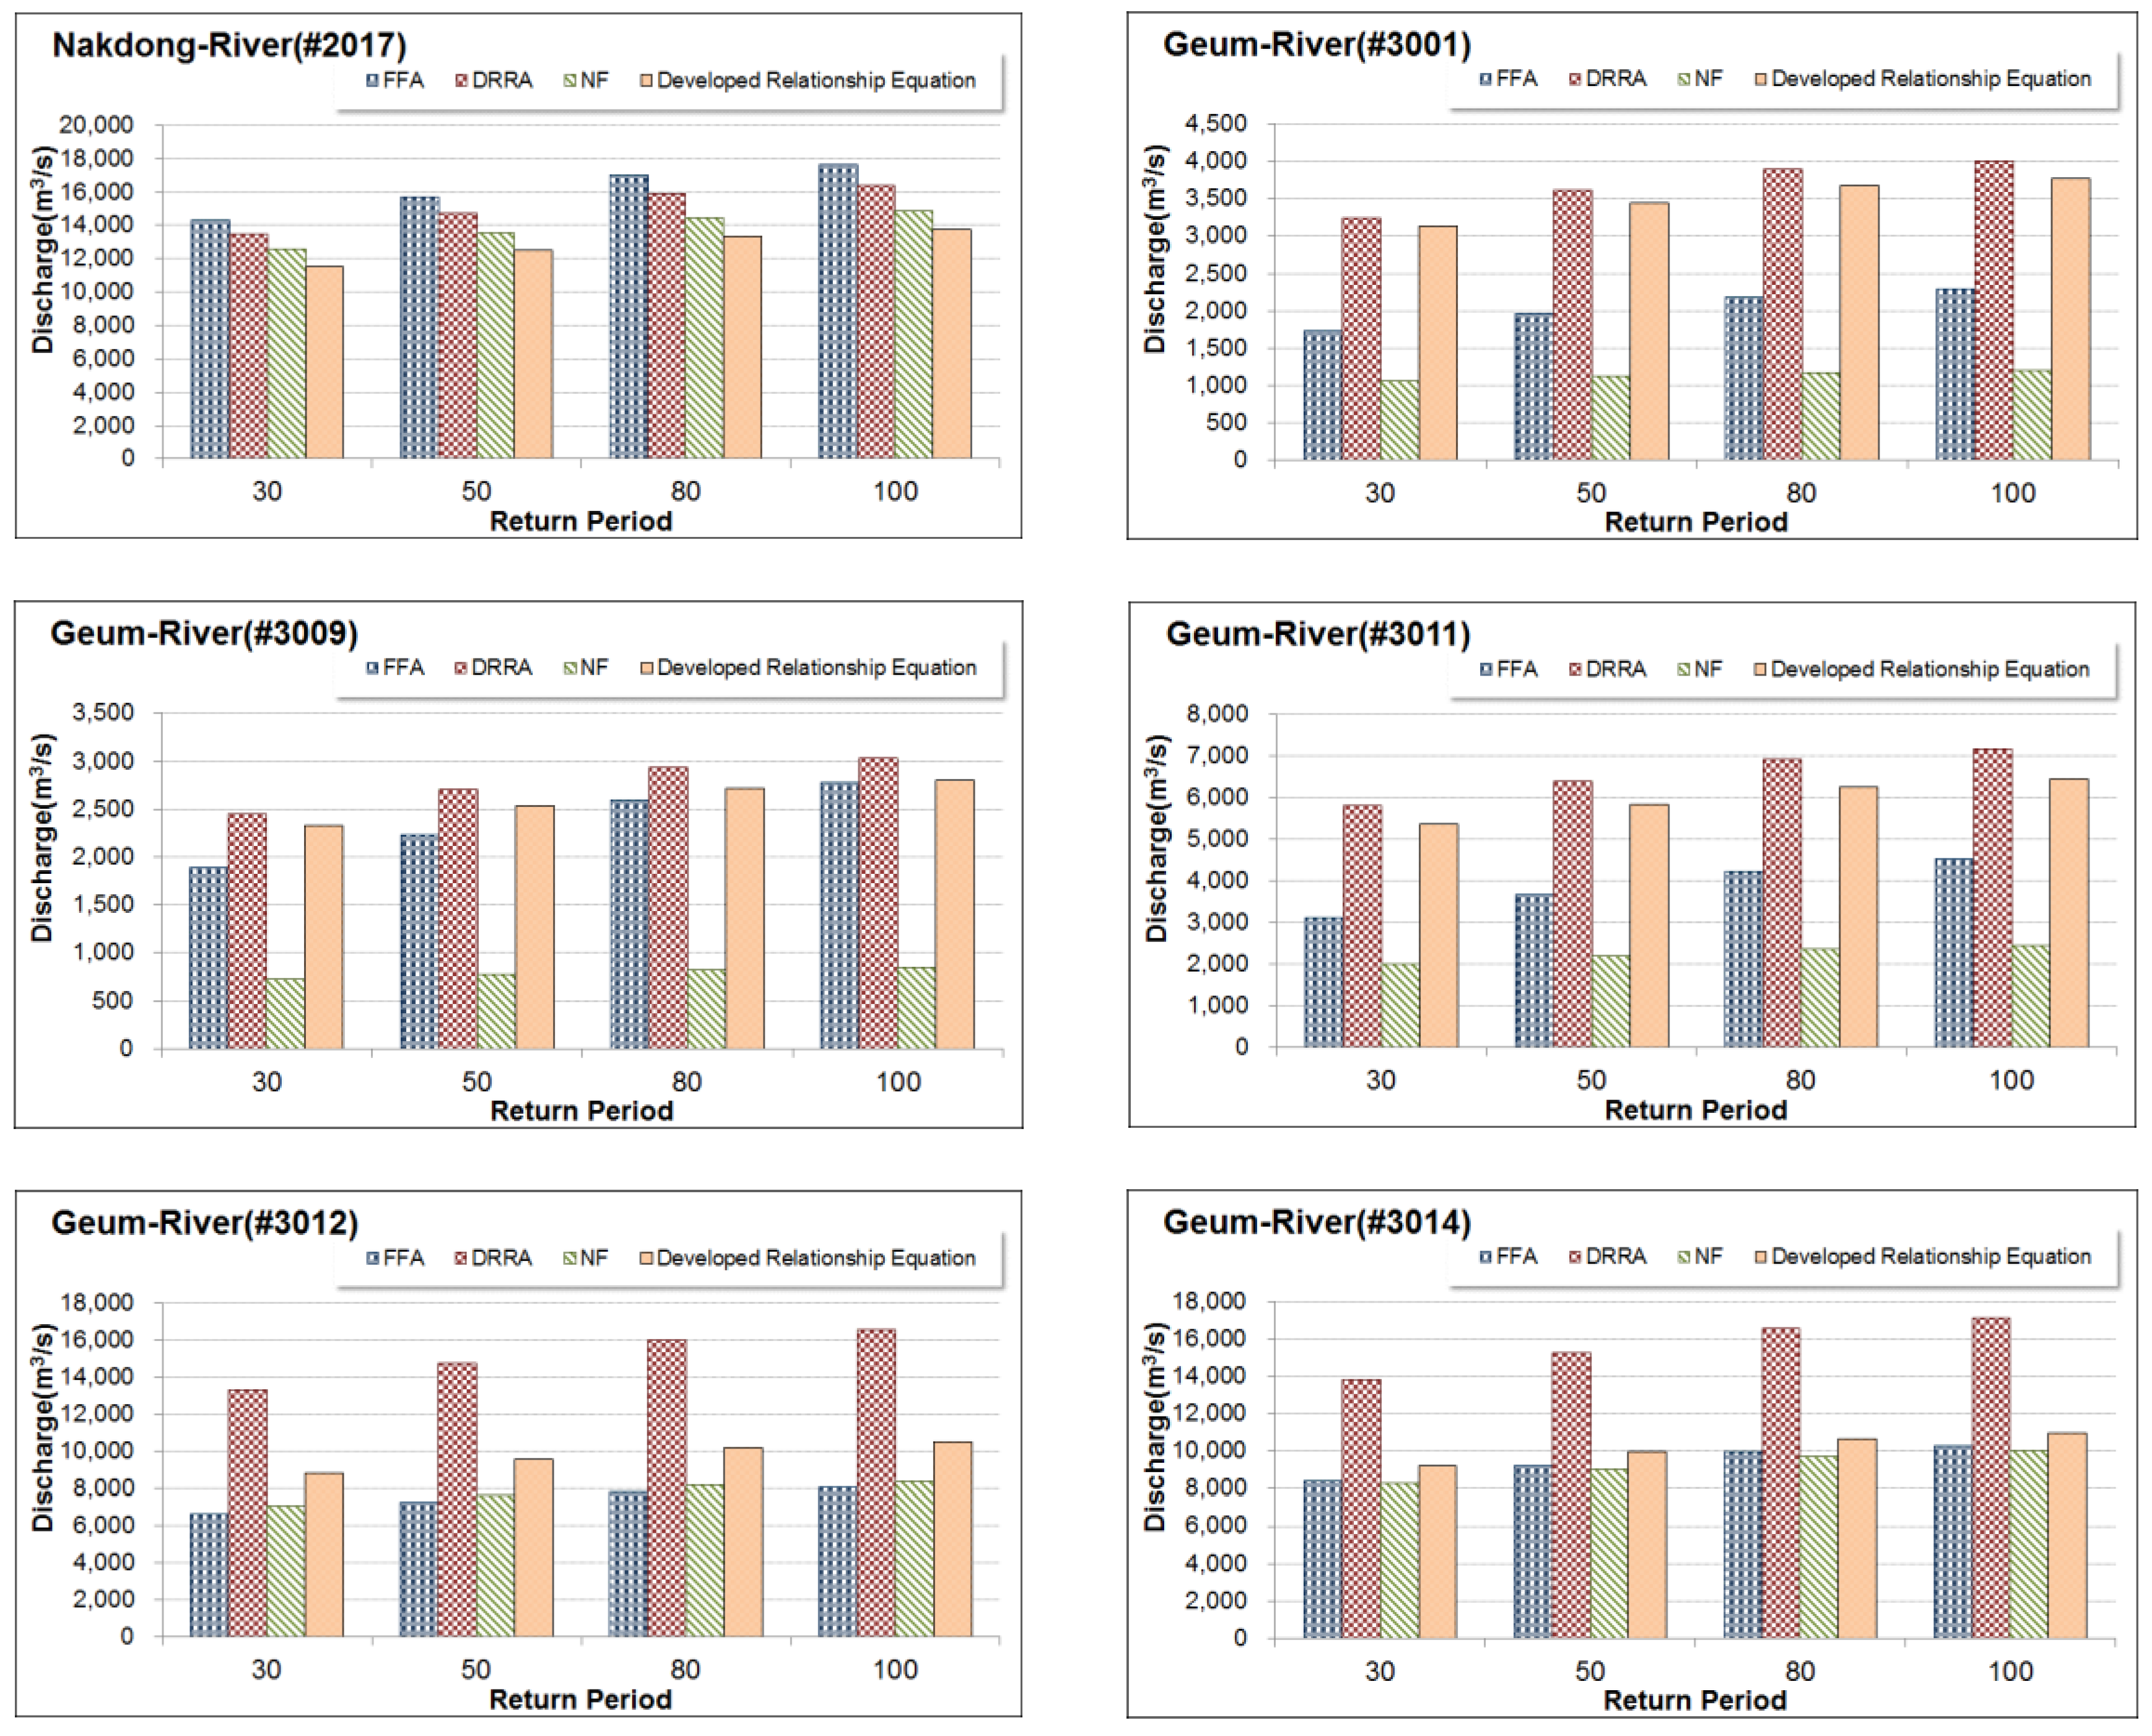
Figure 2 shows the flow chart of this study. The design floods estimated by three methods, i.e., Qt,FFA, Qt,DRRA, and Qt,NF (t = 30, 50, 80, and 100 years), are shown in Figure 3. In the Han River basin, the design flood of FFA was estimated to be 8.51%~58.43% (average 27.71%) smaller than the DRRA. In the Nakdong River basin, the FFA was estimated to be 5.78%~26.32% (average 15.10%) smaller than the DRRA. In the Geum River basin, the errors were ranged from 6.26% to 67.55% (average 33.10%).
To apply Equation (1) to ungauged watersheds, it is necessary to calculate the design floods using watershed characteristics. According to Yoon et al. [34] which estimated the design floods for ungauged watersheds using the ratio of flood quantile and annual streamflow, we developed equations to calculate Qt,NF, as given in Equation (2). To identify most significant watershed characteristics, after constructing the annual maximum series of natural flow, we analyzed the correlations between the annual average natural flow and topographical characteristic factors; the correlation coefficients were 0.992 with basin area, 0.960 with river length, 0.164 with river slope, and 0.219 with watershed mean width. The optimal regression equation was derived using the coefficient of determination. Thus, using basin area and river length, a power law equation was derived as given in Equation (3).
where It is the ratio of flood quantile and the annual natural flow (), is the annual average natural flow, A is the basin area, and L is the river length. After calculating the value of for each watershed, Table 3 summarizes the averaged It for various return periods and analysis periods as defined in Section 4.1. In this study, Qt,NF was calculated by applying It to Equation (2) considering the watershed characteristic factor after applying the mean value calculated by watershed and frequency.
The RFA developed in this study, as given in Equations (1)–(3), has the advantage that it uses rainfall data relatively abundant in South Korea, instead of using insufficient streamflow data and the characteristics of ungauged watersheds with the simulated natural flows. In addition, the process is relatively simple. To verify the applicability, we applied a leave-one-out cross-validation (LOOCV) analysis and a skill score (SS) using the root mean squared error (RMSE) for a quantitative evaluation.
The LOOCV examines the effect of data on the statistical significance. When using n data points for statistical calculation, we calculate the statistics using (n-1) data points, remove one, and then verify the calculated statistics using each variation. The SS measures the relative performance of a prediction method, as given in Equation (4).
where is the perfect prediction accuracy, is the prediction accuracy of the existing method, and is the accuracy of the new method.
The SS ranges from −∞ to +1. A positive value of the SS means the forecast is an improvement over the standard forecast, whereas a negative value means that the forecast has lower accuracy than the standard forecast [35]. In this study, after assuming that one of the 12 watersheds was an ungauged watershed, using the remaining 11 watersheds’ information, the RFA was developed and then applied to the assumed ungauged watershed. This method was repeatedly applied to the 12 watersheds, one by one. The LOOCV procedure was repeated by successively dropping each station, one at a time. Predicted values for all basins were then compared to the observed ones. For this purpose, two classical criteria were used here: RMSE and SS [36]. The results of the LOOCV analyses are shown in Table 4, in which all stations except for #2017 have positive skill scores. The average of SS was 23.2% for all 12 stations and 45.6% for 11 stations, except for #2017. As a result, when the proposed correction formula was applied, the accuracy was improved by 45.6% on average compared with the flood estimated by DRRA.
4. Applications
4.1. Design Floods for Climate Change Scenarios
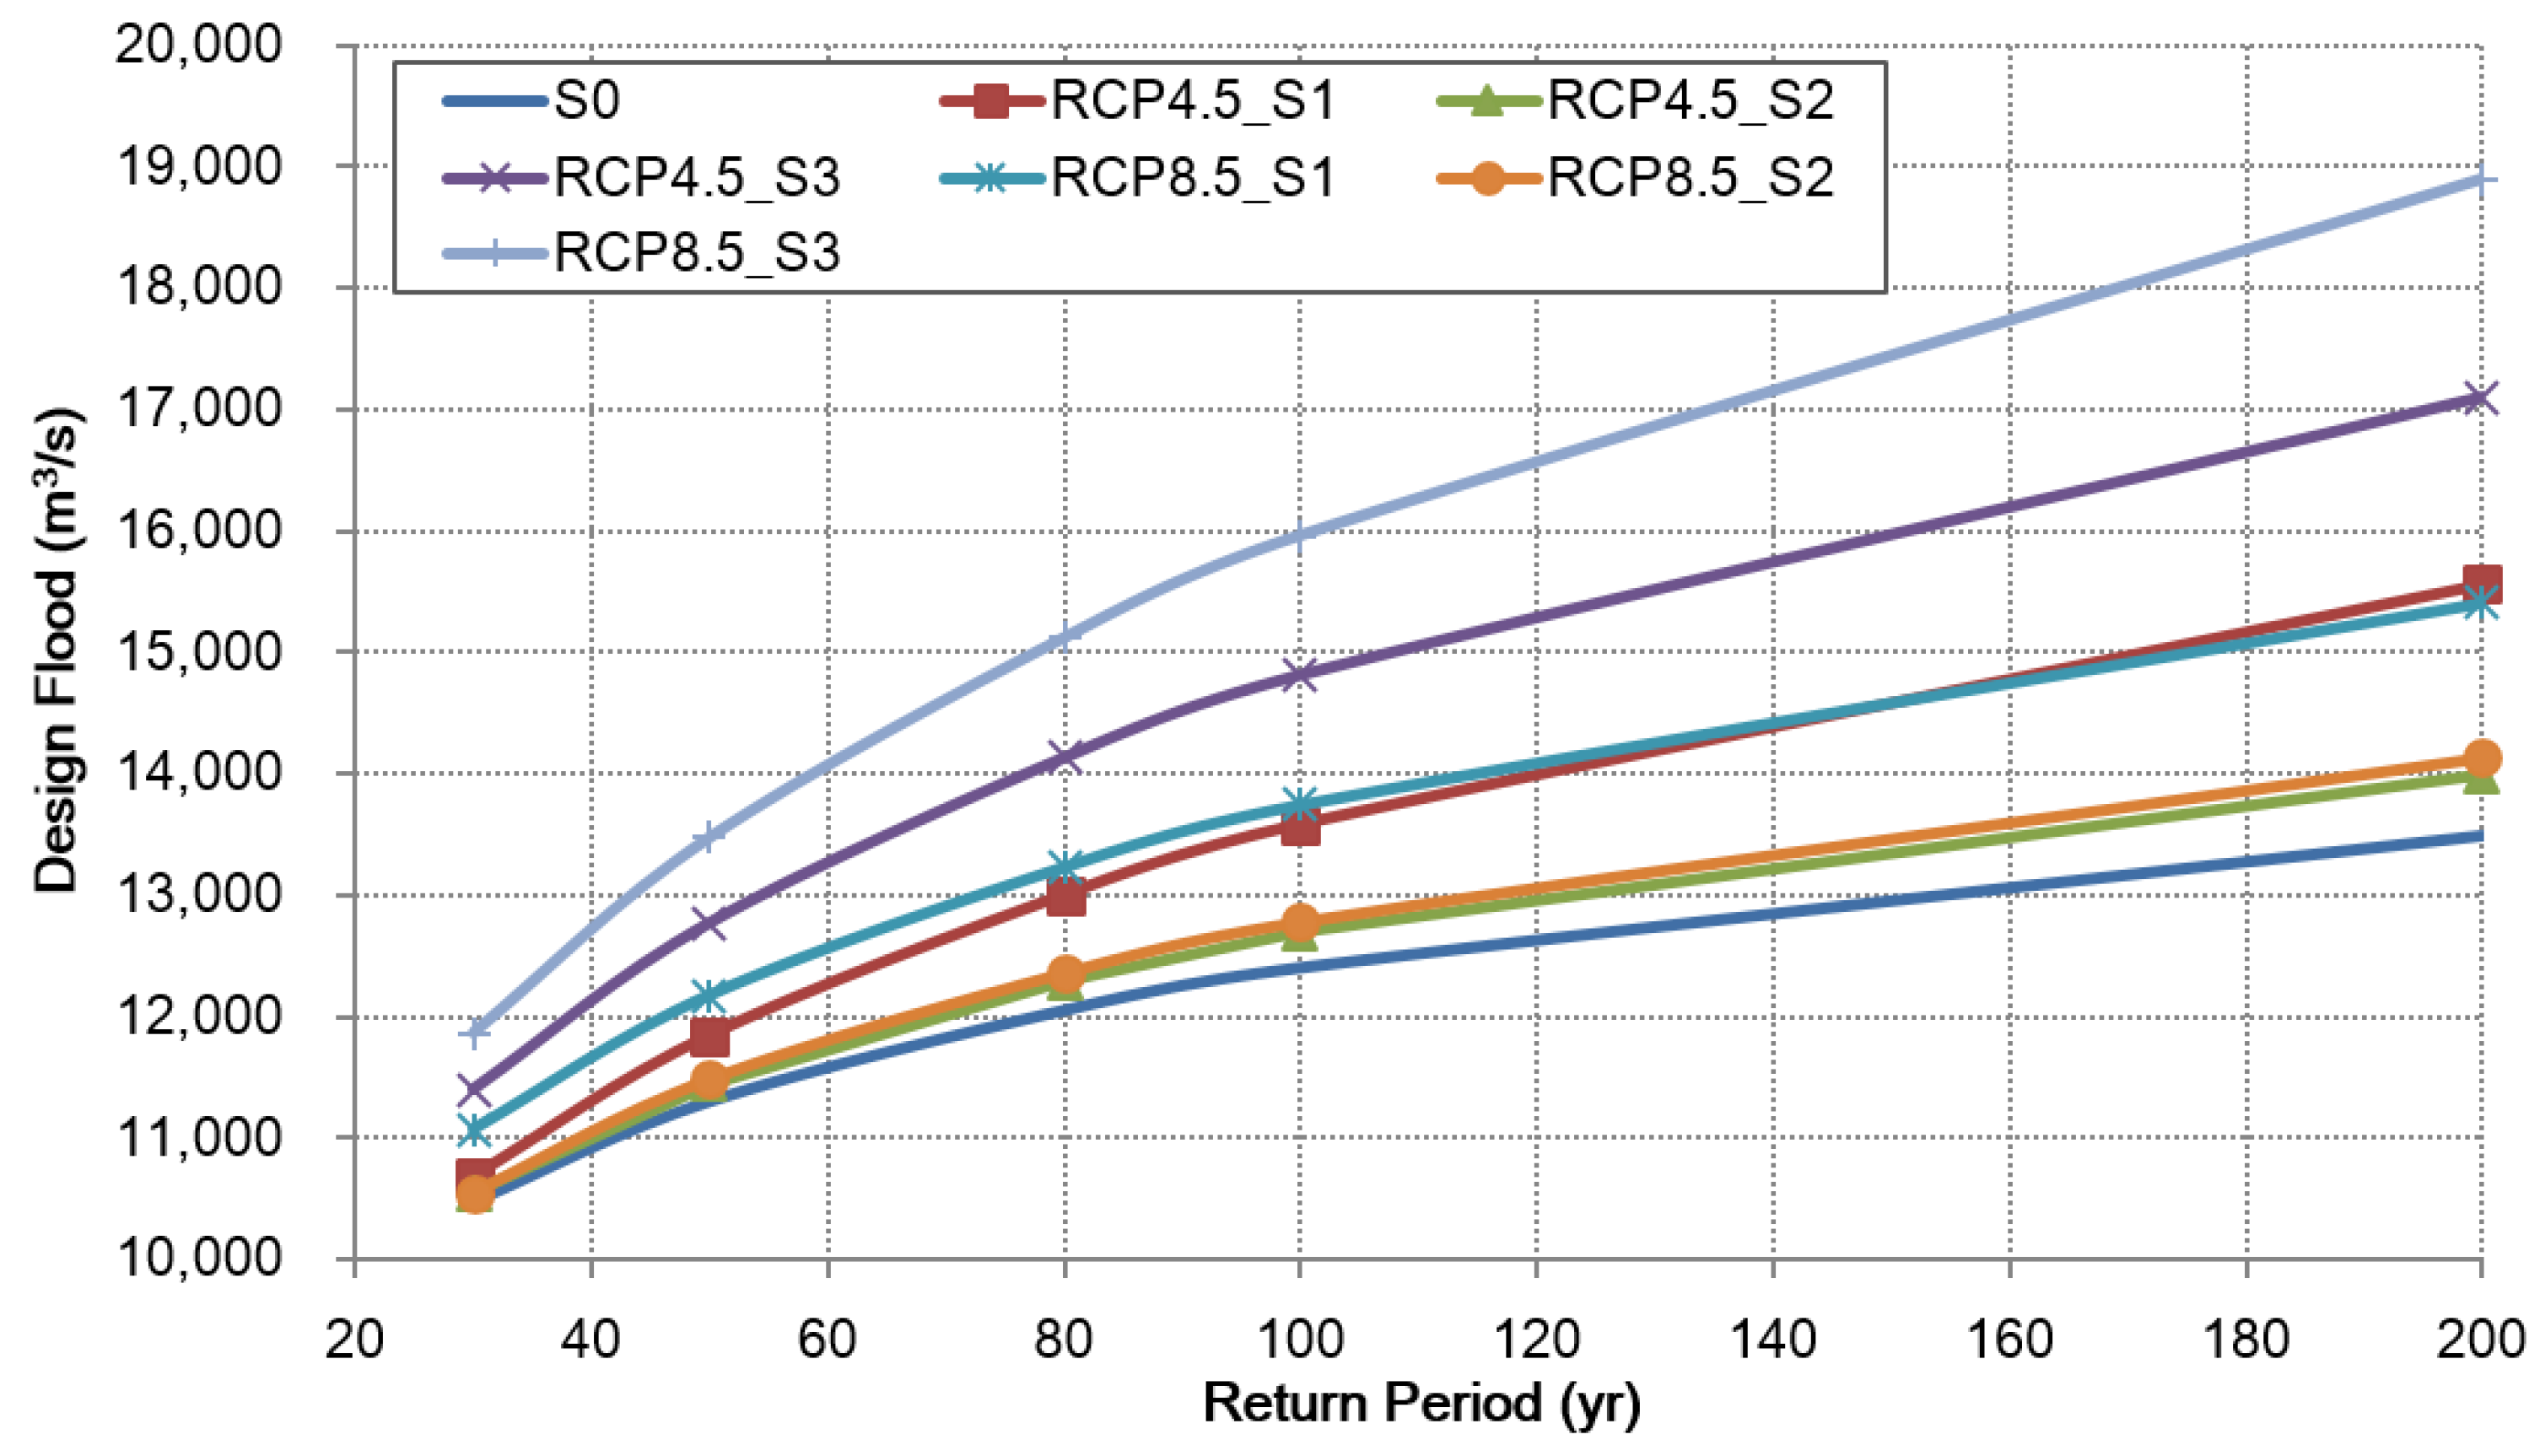
We applied the RFA to climate change scenarios after dividing the future period into 30-y intervals: S0 (present), S1 (2011–2040), S2 (2041–2070), and S3 (2071–2100). For example, the 100-y floods were estimated to be 27% larger than the present and S3 for the RCP 4.5 and 40% larger for the RCP 8.5. In both scenarios, the 100-y floods of current and S2 period were similar at low return periods, but they were estimated to be up to 5% at high return periods. Figure 4 shows the design flood curves for two RCP scenarios for the watershed #2011 in which the biggest change occurred.
Quintero et al. [37] found that by the end of the current century, the 100-y flood could increase by 47% to 52% in the catchments of the Cedar River and by 25% to 34% in the catchments of the South Skunk River in Iowa. Kim et al. [38] used the same periods (S1, S2, S3) classified in this study and found that the 50-y floods to increase by 10% to 22%, the 100-y floods by 10% to 24%, and the 200-y floods by 30% to 43% for the Miho river basin, Korea. This means that future climate change may increase the risk of extreme floods.
4.2. Flood Risk Assessment
We applied the proposed RFA to 113 medium-sized watersheds in South Korea to assess flood risk based on the hydrological risk, according to the climate change scenarios. The hydrological risk of the natural or functional failure of a hydraulic structure can be expressed as Equation (5) [39].
where R is the hydrological risk, P(F) is the non-exceedance probability, T is the return period, and n is the expected life of the structure.
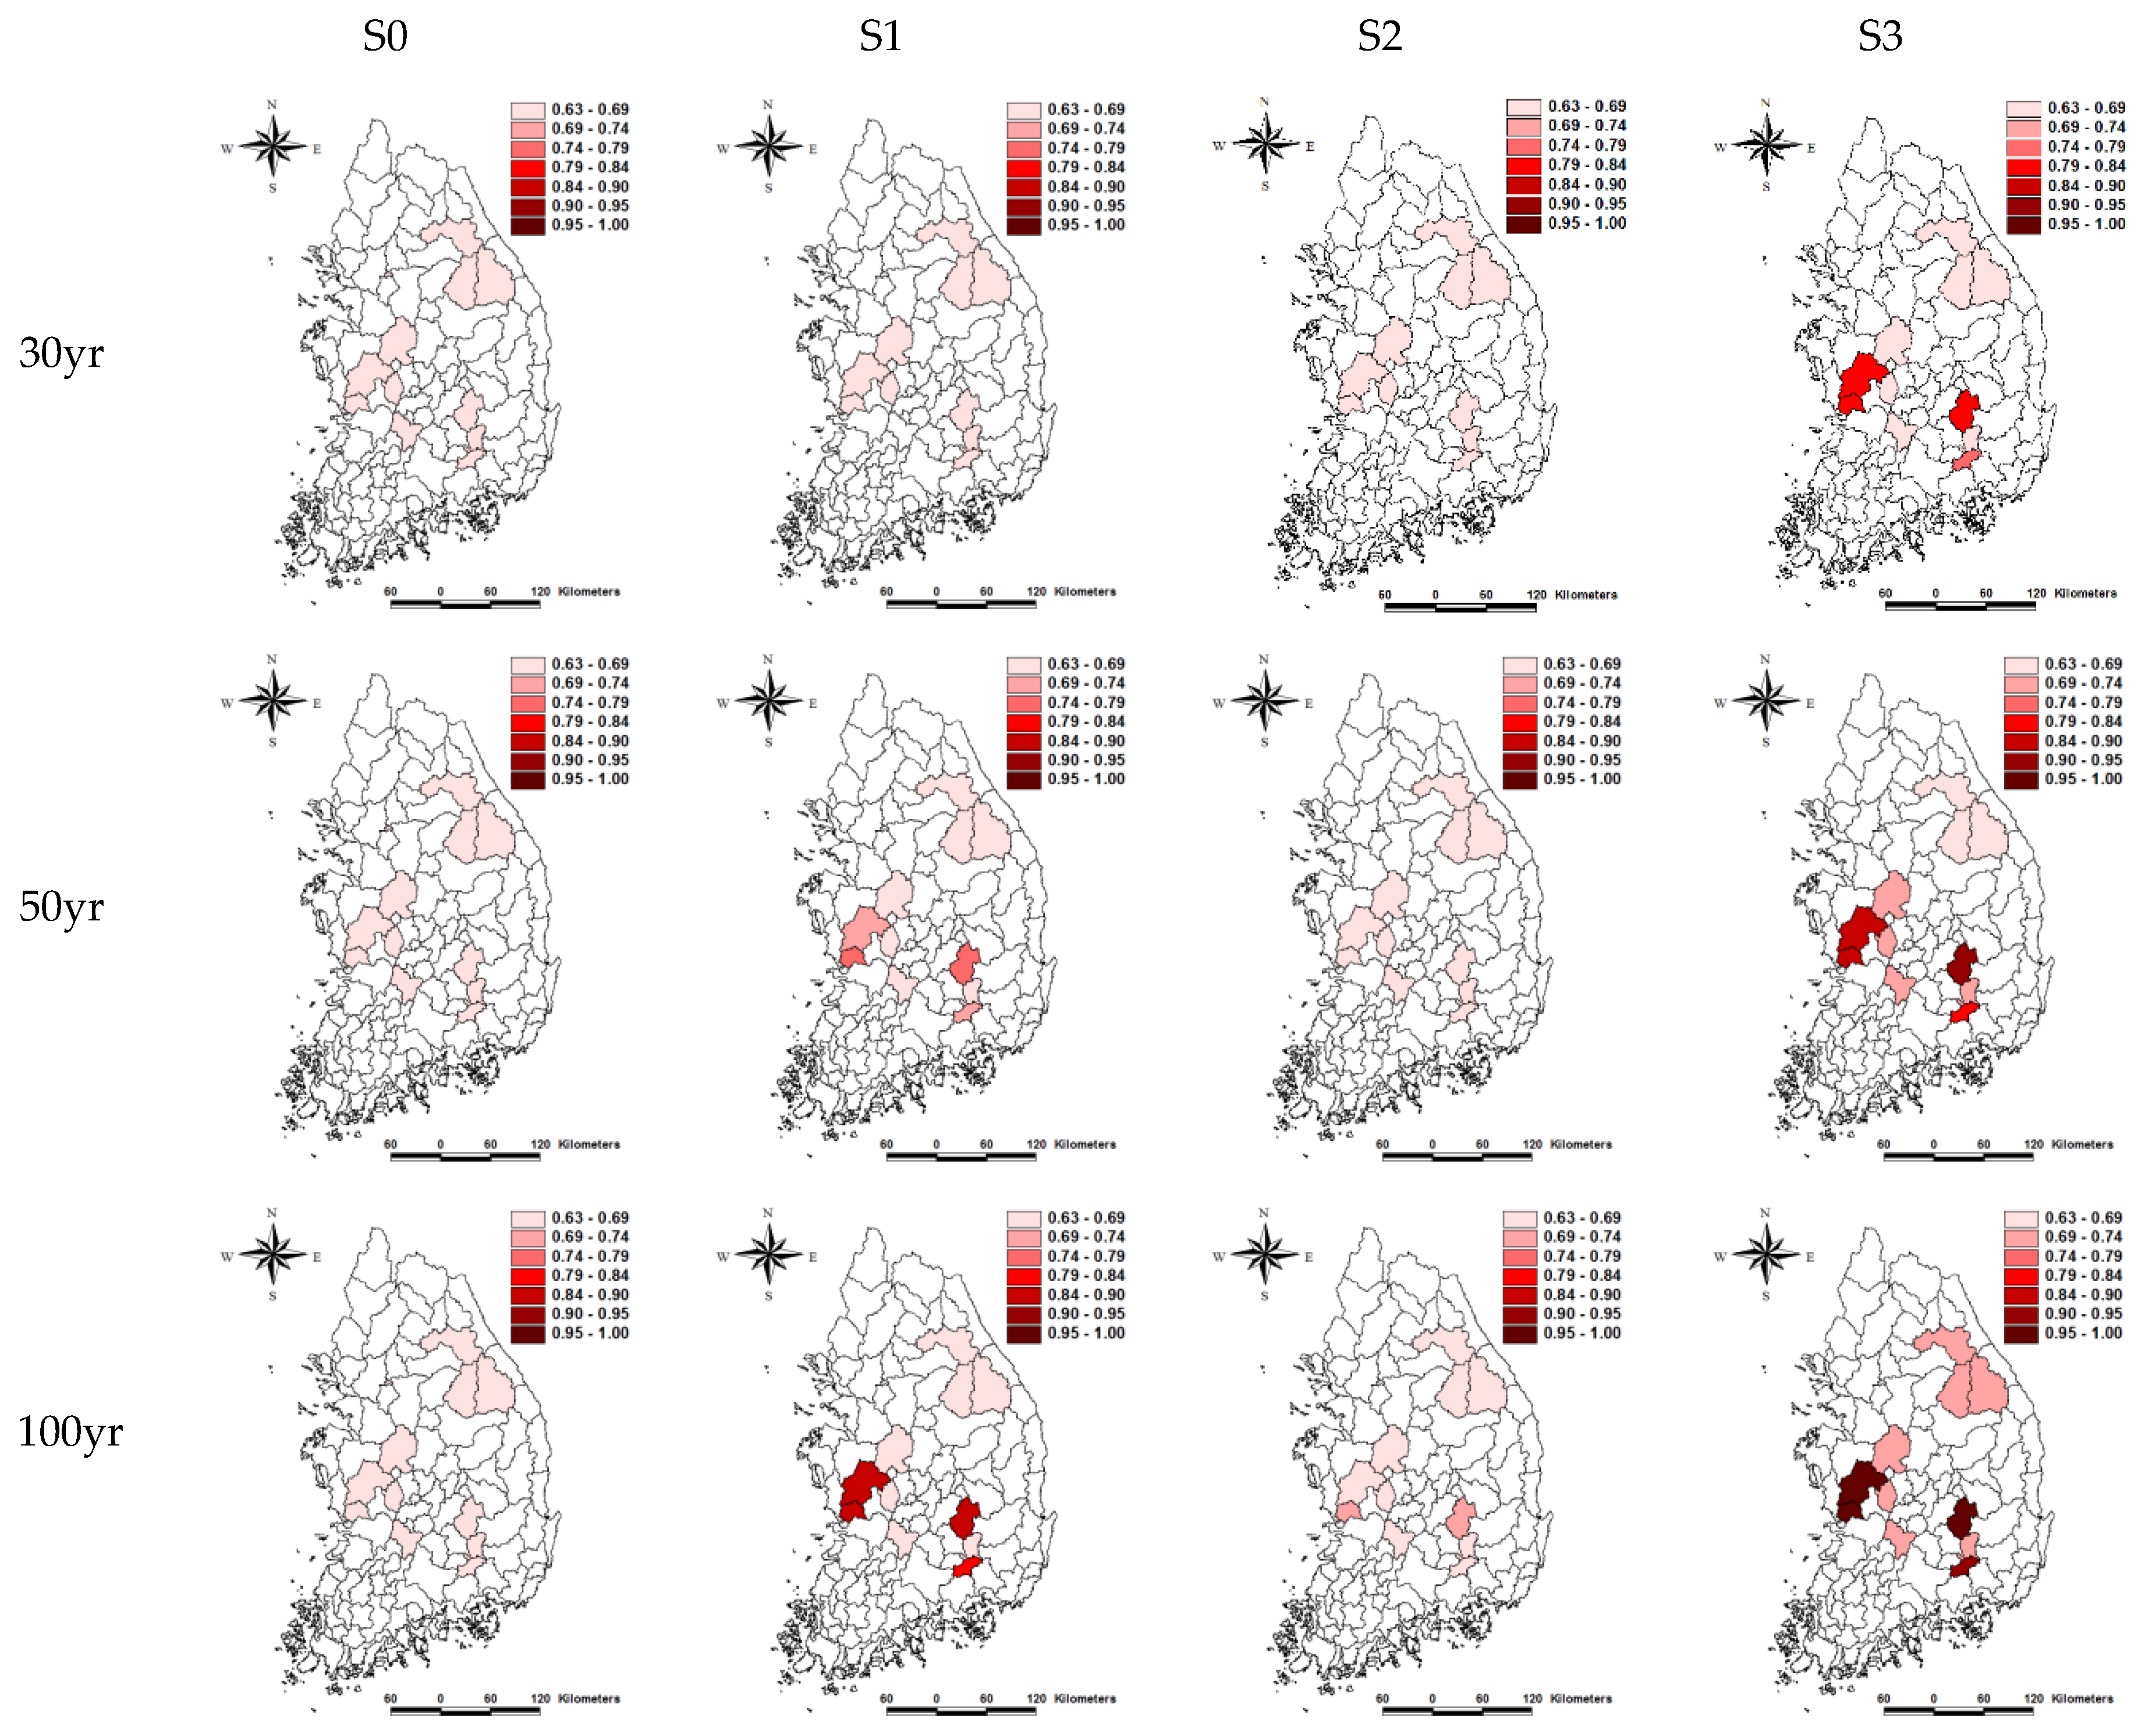
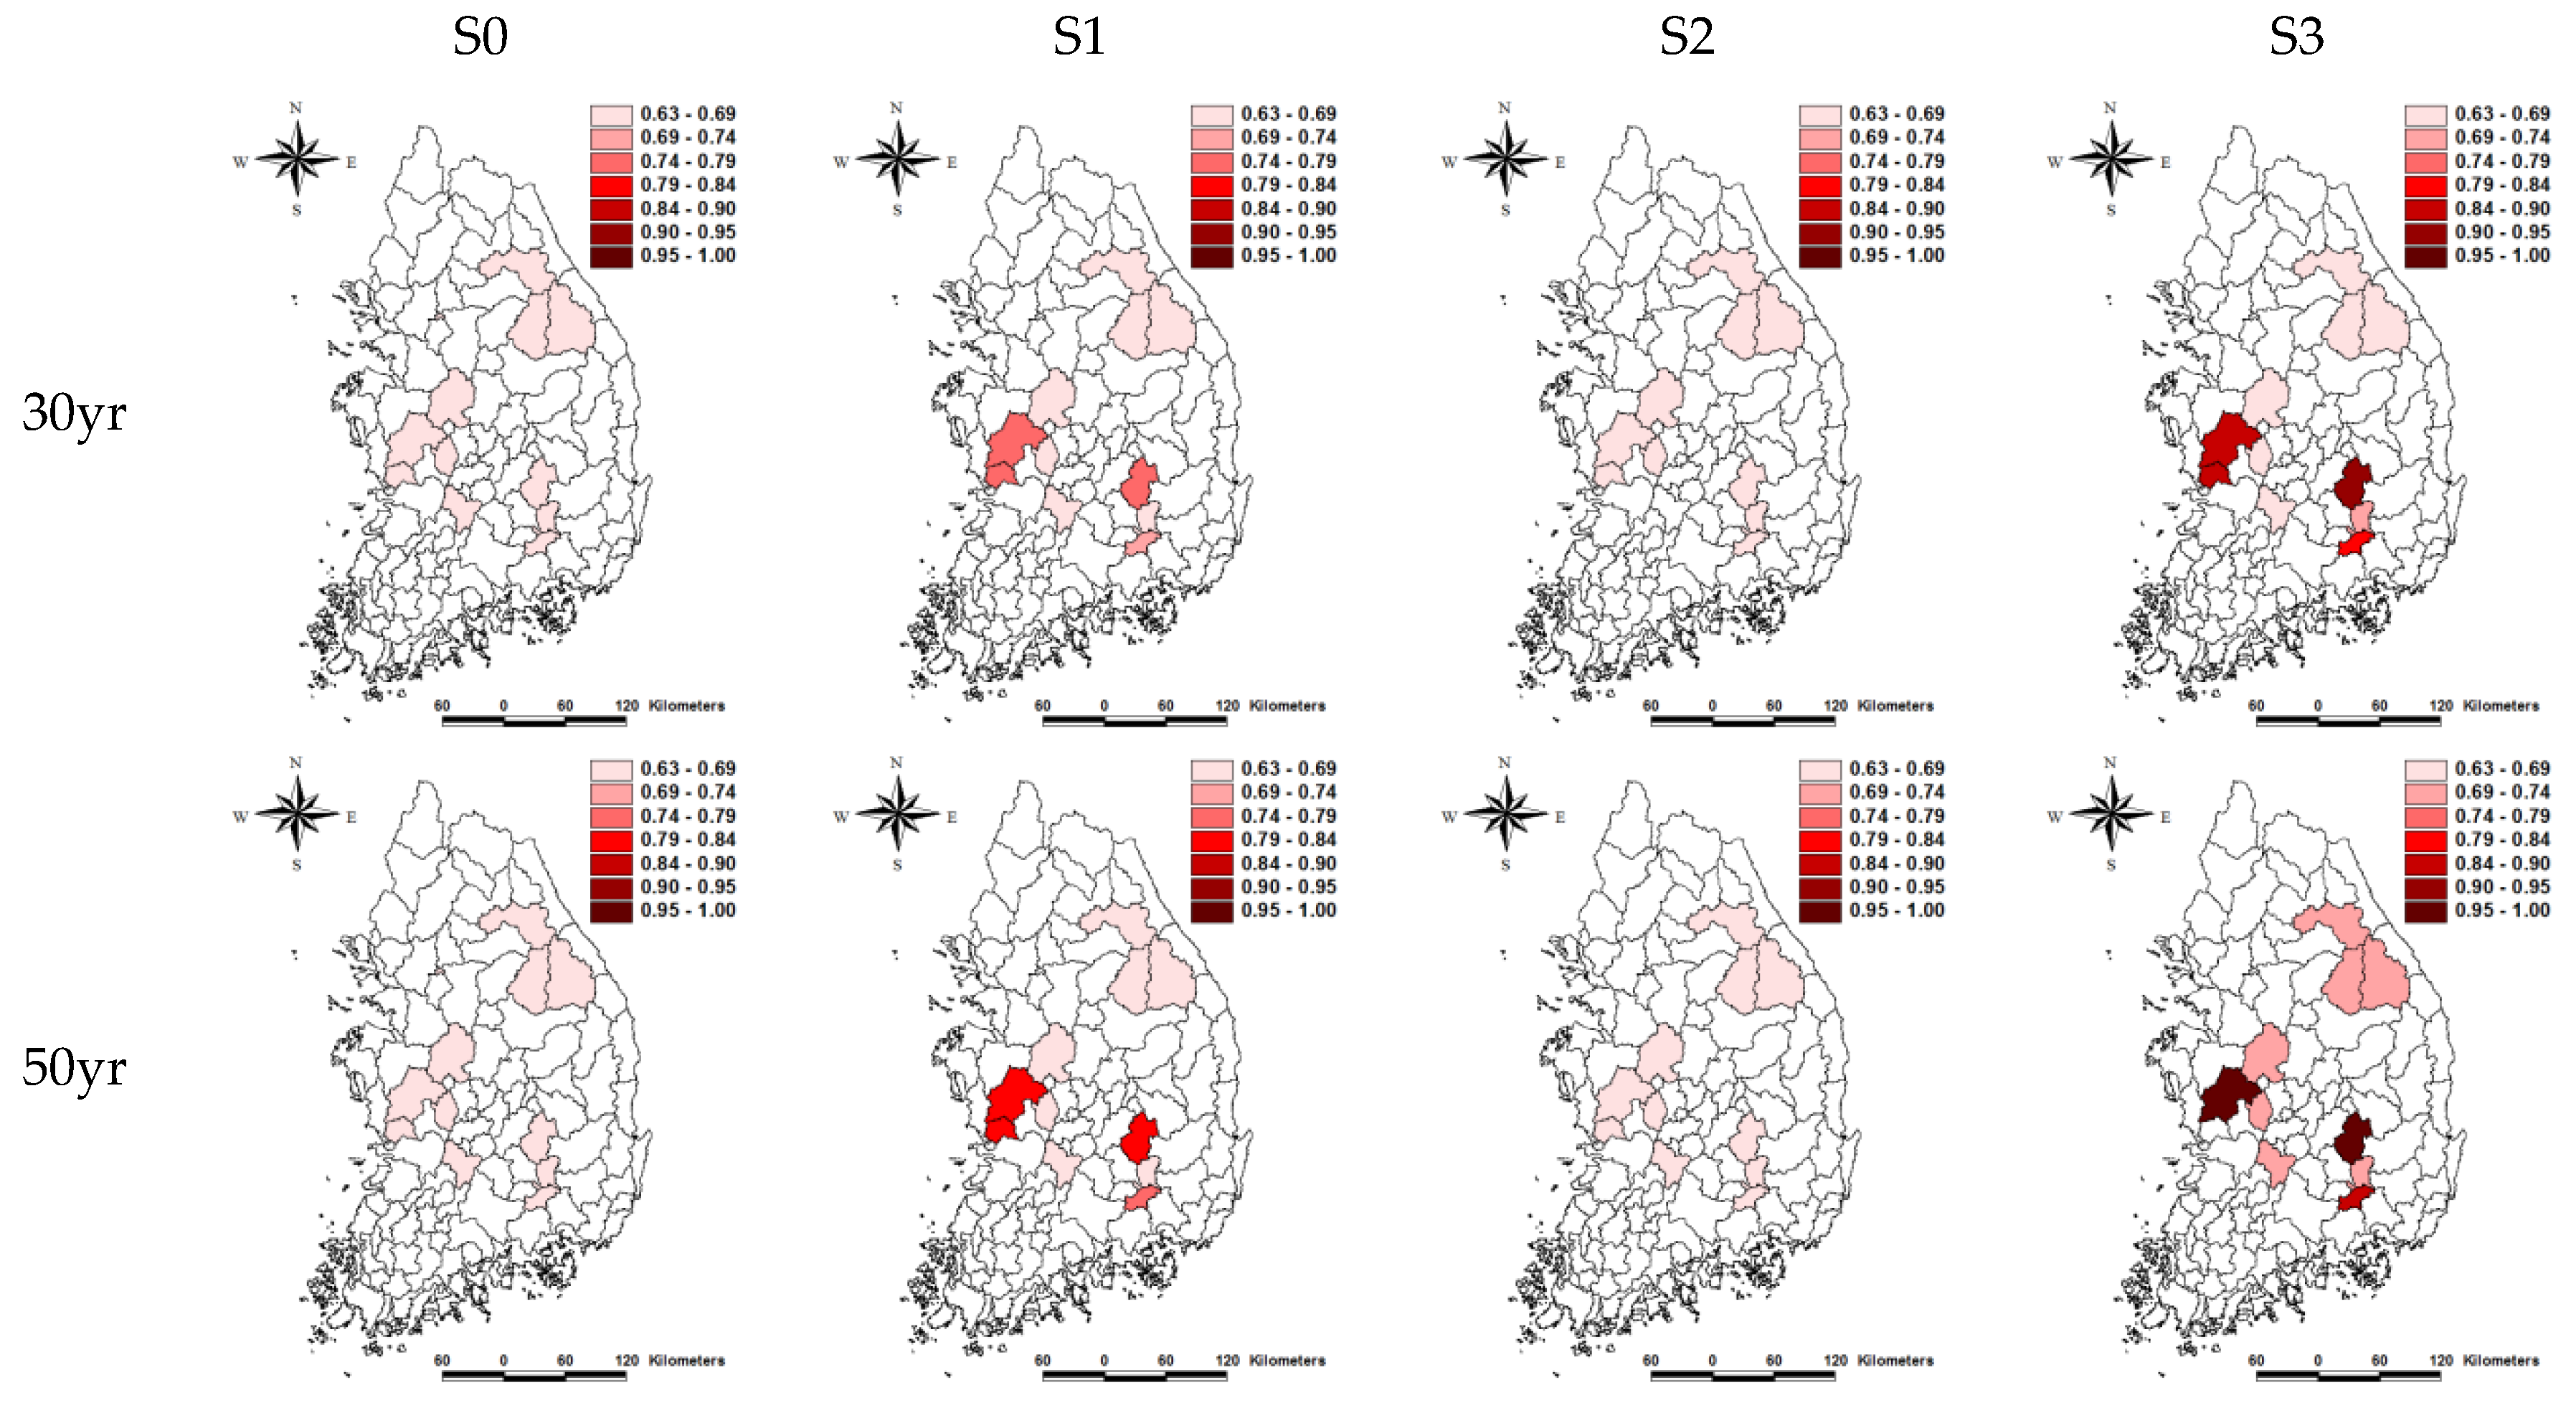
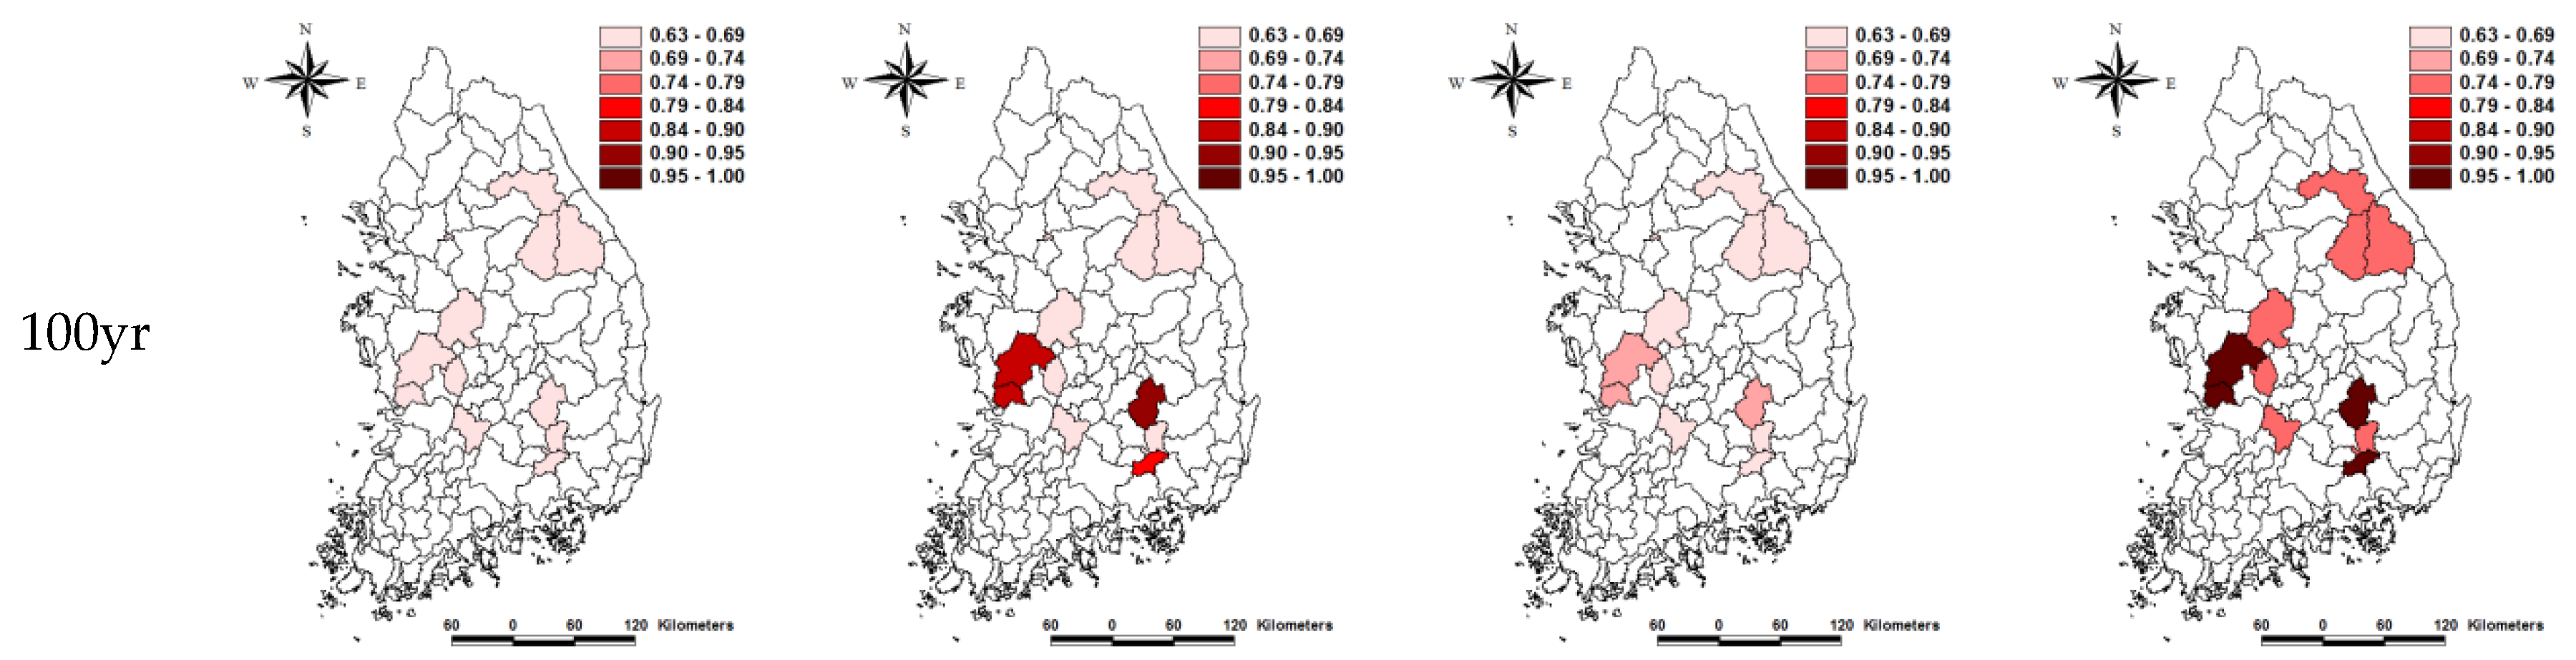
The flood risk was evaluated to be smaller in the S1 period than in the S2 as a whole. The reason is two-fold: the hydrological flood risk was assessed to be small because the natural flow of the climate change scenario in S2 was smaller than S0. Except for #1017 basin, the flood risk increased from the present to the future, and the risk increased by 0.193 on average compared to S0 and S3 at a 100-y return period in the RCP 8.5 scenario. In the RCP 4.5 scenario, the flood risk was 0.156. The accuracy was likely to decline when the ratio between the maximum annual average of natural flow and the average watershed width was 500 or more (as in the case of #2017), but the accuracy was high in watersheds with small watershed areas. Figure 5 and Figure 6 show how the flood risk of each watershed changes from the present (S0) to the future (30 years, 50 years, 100 years) according to climate change scenarios.
5. Conclusions
The DRRA overestimated design floods compared with the FFA on average 52% for 12 watersheds in this study. As a result of examining the applicability using the skill score, the watershed #2017 had a negative SS and opposite tendency. The natural flow was considered as an index flood and estimated using watershed characteristics such as watershed area and river length.
The SS of the Han River basin showed an accuracy of 37.16% in #1001, of 33.1% in #1002, of 36.14% in #1012, of 74.95% in #1017 basin, and the average of accuracy was 45.34%. Except in the case of #2017, in Nakdong River basin, #2011 and #2014 had 46.85% and 52.86% accuracy, respectively, with an average accuracy rate of 49.86%. In Geum River basin, #3001, #3009, #3011, #3012, and #3014 showed an accuracy of 12.74%, 24.36%, 24.29%, 70.51%, and 88.84%, respectively. The total average of the whole basin increased to 44.15%. The relationship between flood risk and future flood risk was derived using the natural flow of future RCP climate change scenarios. As the RCP scenarios of each watershed were applied through the flood risk map, the flood risk increased, except for #1017. If we applied the RCP 8.5 scenario to the developed RFA against the present, it was determined that the design floods for the medium-sized watersheds will increase in the future by 11% on average, and 40% to maximum. Future flood risks due to relative hydrological risk also increased by 0.193 for the 100-y flood. In South Korea, the design flood can be calculated using the RFA developed in this study because it can be applied for ungauged watersheds using rainfall data relatively abundant in South Korea. Since the flood risk was confirmed to increase in the future relative to the present, the comprehensive flood control plans and strategies for the stability of hydraulic structures should be implemented to cope with severe floods in the future.
Uncertainty comes from estimated parameters, simulated natural flows, regression curves, and the analysis of DRRA. This study was limited to perform the uncertainties of estimated design floods from the RFA. In addition, the developed RFA was not applied to other medium-sized watersheds, because we could not obtain the results of the DRRA for medium-sized watersheds. However, the RFA developed in this study is applicable for the medium-sized watersheds in South Korea when the DRRA is performed for the watershed for comprehensive flood mitigation planning after surveying characteristics of watershed.
Author Contributions
N.W.K.; project administration and visualization. J.-Y.L.; writing—original draft and methodology. D.-H.P.; visualization. T.-W.K.; conceptualization, and writing review and editing.
Funding
This research was supported by grants from the Strategic Research Project [20180374-101] funded by the Korea Institute of Civil Engineering and Building Technology and the Disaster and Safety Management Institute [MOIS-DP-2015-05] funded by Ministry of the Interior and Safety of Korean government.
Conflicts of Interest
The authors declare no conflict of interest.
References
- Loo, Y.Y.; Billa, L.; Singh, A. Effect of climate change on seasonal monsoon in Asia and its impact on the variability of monsoon rainfall in Southeast Asia. Geosci. Front. 2015, 6, 817–823. [Google Scholar] [CrossRef]
- Jain, S.K.; Singh, V.P. Chapter 10—Reservoir sizing. Dev. Water Sci. 2003, 51, 555–612. [Google Scholar]
- United States Geological Survey. User’s Manual for Program PeakFQ, Annual Flood-Frequency Analysis Using Bulletin 17B Guidelines; United States Geological Survey: Reston, VA, USA, 2006.
- Institute of Hydrology. Flood Estimation Handbook; Institute of Hydrology: Wallingford, UK, 1999. [Google Scholar]
- Centre for Ecology & Hydrology (CEH). European Procedures for Flood Frequency Estimation; European Cooperation in Science and Technology: Lancaster, UK, 2012. [Google Scholar]
- The Institution of Engineers. Australian Rainfall and Runoff; Commonwealth of Australia (Geoscience Australia): Canberra, Australia, 2001. [Google Scholar]
- MCKerchar, A.; Macky, G.H. Comparison of a regional method for estimating design floods with two rainfall-based methods. J. Hydrol. 2001, 40, 129–138. [Google Scholar]
- Calver, A.; Stewart, E.; Goodsell, G. Comparative analysis of statistical and catchment modeling approaches to river flood frequency estimation. J. Flood Risk Manag. 2009, 2, 24–31. [Google Scholar] [CrossRef]
- Lee, J.H.; Lee, J.K.; Kim, T.W.; Kang, J.Y. Comparative study on calculation method for design flood discharge of dam. J. Korea Water Resour. Assoc. 2011, 44, 940–954. [Google Scholar] [CrossRef]
- Choi, J.; Ji, J.; Yi, J. A study on rainfall-runoff frequency analysis for estimating design flood. J. Korea Water Resour. Assoc. 2015, 48, 605–612. [Google Scholar]
- Korea Water Resources Association (KWRA). Commentary of Rivers Design Standard; KWRA: Seoul, Korea, 2005. [Google Scholar]
- Rogger, M.; Kohl, B.; Pirkl, H.; Viglione, A.; Komma, J.; Kirnbauer, R.; Merz, R.; Blöschl, G. Runoff models and flood frequency statistics for design flood estimation in Austria—Do they tell a consistent story? J. Hydrol. 2012, 456, 30–43. [Google Scholar] [CrossRef]
- Potter, K.W.; Lattenmaier, D.P. A comparison of regional flood frequency estimation methods using are sampling method. Water Resour. Res. 1990, 26, 415–424. [Google Scholar] [CrossRef]
- Cunnane, C. Statistical distributions for flood frequency analysis. World Meteorological Organization Operational. Hydrol. Rep. 1989, 33, 718. [Google Scholar]
- Stedinger, J.R.; Tasker, G.D. Regional hydrologic analysis 1. Ordinary, weighted and generalized least squares compared. Water Resour. Res. 1985, 21, 1421–1432. [Google Scholar] [CrossRef]
- IPCC. Climate Change 2014: Synthesis Report. Contribution of Working Groups I, II and III to the Fifth Assessment Report of the Intergovernmental Panel on Climate Change; IPCC: Geneva, Switzerland, 2014. [Google Scholar]
- IPCC. Global Warming of 1.5 °C. An IPCC Special Report on the Impacts of Global Warming of 1.5 °C Above Pre-Industrial Levels and Related Global Greenhouse Gas Emission Pathways, in the Context of Strengthening the Global Response to the Threat of Climate Change, Sustainable Development, and Efforts to Eradicate Poverty; World Meteorological Organization: Geneva, Switzerland, 2018. [Google Scholar]
- Ekstrӧm, M.; Fowler, H.J.; Kilsby, C.G.; Jones, P.D. New estimates of future changes in extreme rainfall across the UK using regional climate model integration. 2. Future estimates and use in impact studies. J. Hydrol. 2005, 300, 234–251. [Google Scholar] [CrossRef]
- Cameron, D. An application of the UKCIP02 climate change scenarios to flood estimation by continuous simulation for a gauged catchment in the northeast of Scotland, UK (with uncertainty). J. Hydrol. 2006, 328, 212–226. [Google Scholar] [CrossRef]
- Frei, C.; Schöll, R.; Fukutome, S.; Schmidli, J.; Vidale, P.L. Future change of precipitation extreme in Europe: Intercomparison of scenarios from regional climate models. J. Geophys. Res. 2006, 111, D06105. [Google Scholar] [CrossRef]
- Kim, B.S.; Kim, B.K.; Kyung, M.S.; Kim, H.S. Impact assessment of climate change on extreme rainfall and I-D-F analysis. J. Korea Water Resour. Assoc. 2008, 41, 379–394. [Google Scholar] [CrossRef]
- Nam, W.S.; Ahn, H.J.; Kim, S.H.; Heo, J.H. The impact of climate change on sub-daily extreme rainfall of Han river basin. J. Korean Soc. Disaster Secur. 2015, 8, 11–17. [Google Scholar]
- Zhou, Q.; Mikkelsen, P.S.; Halsnæs, K.; Arnbjerg-Nielsen, K. Framework for economic pluvial flood risk assessment considering climate change effects and adaptation benefits. J. Hydrol. 2012, 414, 539–549. [Google Scholar] [CrossRef]
- Arnaud, P.; Cantet, P.; Aubert, Y. Relevance of an at-site flood frequency analysis method for extreme events based on stochastic simulation of hourly rainfall. Hydrol. Sci. J. 2016, 61, 36–49. [Google Scholar] [CrossRef]
- Ministry of Land, Infrastructure and Transport (MOLIT). Long-Term Comprehensive Plan for Water Resources; MOLIT: Seoul, Korea, 2006.
- Korea Meteorological Administration (KMA). Available online: https://www.climate.go.kr (accessed on 25 October 2018).
- Kim, M.-K.; Lee, D.-H.; Kim, J. Production and validation of daily grid data with 1 km resolution in South Korea. Ku Clim. Res. Inst. Publ. 2013, 8, 13–25. [Google Scholar]
- You, J.; Kwon, H.-H.; Lee, J.-H.; Kim, T.-W. Influence of evapotranspiration on future drought risk using bivariate drought frequency curves. KSCE J. Civ. Eng. 2016, 20, 2059–2069. [Google Scholar] [CrossRef]
- Intergovernmental Panel on Climate Change (IPCC). Climate Change 2013: The Physical Science Basis. Contribution of Working Group I to the Fifth Assessment Report of the Intergovernmental Panel on Climate Change; Cambridge University Press: Cambridge, UK; New York, NY, USA, 2013. [Google Scholar]
- Ministry of Land, Infrastructure and Transport (MOLIT). Comprehensive Master Plans for Han River Basin; MOLIT: Seoul, Korea, 2008.
- Ministry of Land, Infrastructure and Transport (MOLIT). Comprehensive Master Plans for Nakdong River Basin; MOLIT: Seoul, Korea, 2009.
- Ministry of Land, Infrastructure and Transport (MOLIT). Comprehensive Master Plans for Geum River Basin; MOLIT: Seoul, Korea, 2008.
- Ministry of Land, Infrastructure and Transport (MOLIT). Water Vision for 2011~2020; MOLIT: Seoul, Korea, 2011.
- Yoon, Y.N.; Shin, C.-K.; Jang, S.-H. An estimation of flood quantiles at ungauged locations by index flood frequency curves. J. Korea Water Resour. Assoc. 2005, 38, 1–9. [Google Scholar] [CrossRef]
- World Meteorological Organization (WMO). Forecast Verification for the African Severe Weather Forecasting Demonstration Projects; WMO: Geneva, Switzerland, 2014. [Google Scholar]
- Bessafi, M.; Morel, B.; Lan-Sun-Luk, J.-D.; Chabriat, J.-P.; Jeanty, P. A method for mapping monthly solar irradiation over complex areas of topography: Réunion Island’s case study. In Climate-Smart Technologies; Springer: Berlin, Germany, 2013; pp. 295–306. [Google Scholar]
- Quintero, F.; Mantilla, R.; Anderson, C.; Claman, D.; Krajewski, W. Assessment of changes in flood frequency due to the effects of climate change: Implications for engineering design. Hydrology 2018, 5, 19. [Google Scholar] [CrossRef]
- Kim, B.S.; HA, S.R. The impact assessment of climate change on design flood in Mihochen basin based on the representative concentration pathway climate change scenario. J. Wetl. Res. 2013, 15, 105–114. [Google Scholar] [CrossRef]
- Chow, V.T.; Maidment, D.R.; Mays, L.W. Applied Hydrology; McGraw-Hill Book Company: New York, NY, USA, 1988. [Google Scholar]
Figure 1.
Study areas.

Figure 2.
Study flow chart.

Figure 3.
Design floods estimated by various methods.


Figure 4.
Estimated design floods for #2011.

Figure 5.
Flood risk map according to representative concentration pathway (RCP) 4.5 scenario.

Figure 6.
Flood risk map according to representative concentration pathway (RCP) 8.5 scenario.


Table 1.
Sources of data for estimating design floods.
| Method | Period | Source of Data | ||
|---|---|---|---|---|
| Present (S0) | FFA | 1995–2014 (20 years) | Observed Data | |
| DRRA | Han River: 56 stations (~2004) | Comprehensive Master Plans for Han River Basin [30] | ||
| Nakdong River: 60 stations (~2007) | Comprehensive Master Plans for Nakdong River Basin [31] | |||
| Geum River: 41 stations (~2004) | Comprehensive Master Plans for Geum River Basin [32] | |||
| NFS0 | 1967–2013 | Natural flow (tank model) | Water Vision for 2011~2020 [33] | |
| Future (S1) | NFS1 | 2011–2040 | CCIC_APPL_WTRS_RCP4.5_RO_2000_2100_ALL_IC200(KMA) CCIC_APPL_WTRS_RCP8.5_RO_2000_2100_ALL_IC200(KMA) | |
| Future (S2) | NFS2 | 2041–2070 | ||
| Future (S3) | NFS3 | 2071–2100 | ||
FFA: Flood frequency analysis, DRRA: Design rainfall-runoff analysis, NF: Natural flow.
Table 2.
Regression coefficients for watersheds.
| Medium-Sized Watersheds | Coefficient | |||
|---|---|---|---|---|
| a | b | c | ||
| Han River | # 1001 | 2.447 | 0.764 | 0.137 |
| # 1002 | 3.026 | 0.714 | 0.165 | |
| # 1012 | 2.620 | 0.749 | 0.145 | |
| # 1017 | 41.834 | 0.842 | −0.235 | |
| Nakdong River | # 2011 | 4.145 | 0.111 | 0.739 |
| # 2014 | 3.113 | 0.717 | 0.159 | |
| # 2017 | 2.148 | 0.408 | 0.493 | |
| Geum River | # 3001 | 3.013 | 0.715 | 0.164 |
| # 3009 | 2.718 | 0.740 | 0.150 | |
| # 3011 | 2.875 | 0.726 | 0.158 | |
| # 3012 | 3.985 | 0.212 | 0.638 | |
| # 3014 | 3.315 | 0.177 | 0.692 | |
Table 3.
Averaged It according to the analysis periods and return periods.
| Period | Return Period (Year) | ||||
|---|---|---|---|---|---|
| 30 | 50 | 80 | 100 | 200 | |
| S0 | 2.01 | 2.19 | 2.37 | 2.45 | 2.70 |
| S1 | 2.17 | 2.43 | 2.69 | 2.81 | 3.23 |
| S2 | 2.03 | 2.24 | 2.45 | 2.55 | 2.88 |
| S3 | 2.38 | 2.79 | 3.22 | 3.44 | 4.26 |
Table 4.
Results of the leave-one-out cross-validation (LOOCV) analysis.
| Watersheds | Skill Score (%) | |
|---|---|---|
| Han River | # 1001 | 37.16 |
| # 1002 | 33.10 | |
| # 1012 | 36.14 | |
| # 1017 | 74.95 | |
| Nakdong River | # 2011 | 46.85 |
| # 2014 | 52.86 | |
| # 2017 | −223.20 | |
| Geum River | # 3001 | 12.74 |
| # 3009 | 24.36 | |
| # 3011 | 24.29 | |
| # 3012 | 70.51 | |
| # 3014 | 88.84 | |
© 2019 by the authors. Licensee MDPI, Basel, Switzerland. This article is an open access article distributed under the terms and conditions of the Creative Commons Attribution (CC BY) license (http://creativecommons.org/licenses/by/4.0/).
Share and Cite
MDPI and ACS Style
Kim, N.W.; Lee, J.-Y.; Park, D.-H.; Kim, T.-W. Evaluation of Future Flood Risk According to RCP Scenarios Using a Regional Flood Frequency Analysis for Ungauged Watersheds. Water 2019, 11, 992. https://doi.org/10.3390/w11050992
AMA Style
Kim NW, Lee J-Y, Park D-H, Kim T-W. Evaluation of Future Flood Risk According to RCP Scenarios Using a Regional Flood Frequency Analysis for Ungauged Watersheds. Water. 2019; 11(5):992. https://doi.org/10.3390/w11050992
Chicago/Turabian StyleKim, Nam Won, Jin-Young Lee, Dong-Hyeok Park, and Tae-Woong Kim. 2019. "Evaluation of Future Flood Risk According to RCP Scenarios Using a Regional Flood Frequency Analysis for Ungauged Watersheds" Water 11, no. 5: 992. https://doi.org/10.3390/w11050992
Note that from the first issue of 2016, this journal uses article numbers instead of page numbers. See further details here.