Use of Artificial Intelligence to Improve Resilience and Preparedness Against Adverse Flood Events
by
 , , , ,
Sara Saravi
1,* ,
,
Roy Kalawsky
1,
Demetrios Joannou
1,
Monica Rivas Casado
2,
Guangtao Fu
3 and
Fanlin Meng
3 1
Wolfson School of Mechanical, Electrical & Manufacturing Engineering, Advanced VR Research Centre, Loughborough University, Loughborough LE11 3TU, UK
2
School of Water, Energy and Environment, Cranfield University, Cranfield, Bedfordshire MK43 0AL, UK
3
Centre for Water Systems, College of Engineering, Mathematics and Physical Sciences, University of Exeter, Exeter, Devon EX4 4QF, UK
*
Author to whom correspondence should be addressed.
Water 2019, 11(5), 973; https://doi.org/10.3390/w11050973
Submission received: 12 February 2019
/
Revised: 30 April 2019
/
Accepted: 6 May 2019
/
Published: 9 May 2019
(This article belongs to the Special Issue Flood Risk and Resilience)
Abstract
:The main focus of this paper is the novel use of Artificial Intelligence (AI) in natural disaster, more specifically flooding, to improve flood resilience and preparedness. Different types of flood have varying consequences and are followed by a specific pattern. For example, a flash flood can be a result of snow or ice melt and can occur in specific geographic places and certain season. The motivation behind this research has been raised from the Building Resilience into Risk Management (BRIM) project, looking at resilience in water systems. This research uses the application of the state-of-the-art techniques i.e., AI, more specifically Machin Learning (ML) approaches on big data, collected from previous flood events to learn from the past to extract patterns and information and understand flood behaviours in order to improve resilience, prevent damage, and save lives. In this paper, various ML models have been developed and evaluated for classifying floods, i.e., flash flood, lakeshore flood, etc. using current information i.e., weather forecast in different locations. The analytical results show that the Random Forest technique provides the highest accuracy of classification, followed by J48 decision tree and Lazy methods. The classification results can lead to better decision-making on what measures can be taken for prevention and preparedness and thus improve flood resilience.
1. Introduction
Climate change is expected to increase the frequency and intensity of extreme events, including flooding. Across the world, flooding has an enormous economic impact and cost millions of lives. The number of large scale natural disasters have significantly increased in the past few years; this results in considerable impact to human lives, environment and buildings, and substantial damage to societies. During these disasters, vast quantities of data are collected on the characteristics of the event via governmental bodies, society (e.g., citizen science), emergency responders, loss adjusters and social media, amongst others. However, there is a lack of research on how this data can be used to inform how different stakeholders are/can be directly or indirectly affected by large scale natural disasters pre-, during and post-event disaster management decisions. There is a growing popularity and need for the use of Artificial Intelligence (AI) techniques [1] that bring large-scale natural disaster data into real practice and provide suitable tools for natural disaster forecasting, impact assessment, and societal resilience. This in turn will inform on resource allocation, which can lead to better preparedness and prevention for a natural disaster, save lives, minimize economic impact, provide better emergency respond, and make communities stronger and more resilient.
The majority of the work done in the area of AI in flooding has been on the use of social media [2] (e.g., Facebook, Twitter or Instagram) where status update, comments and photo sharing have been used for data mining to improve flood modelling and risk management [3,4,5]. The author of [6] has used Artificial Neural Networks (ANN) in flash flood prediction using data from soil moisture and rainfall volume. Further research [7] has focused on the use of the Bursty Keyword technique combined with the Group Burst algorithm to retrieve co-occurring keywords and derive valuable information for flood emergency response. AI has also been used on images provided by citizens affected by flooding for emergency responders to have situational awareness. In [8], the authors explored the use of algorithms based on ground photography shared within social networks. Use of specific algorithms for satellite images or aerial imagery [9] to detect flood extent was also explored. Within this context, the resolution of the imagery collected is of key relevance to detect features of interest due to the complexity of the imagery acquired in urban areas [10]. Some studies have focused on the analysis of high resolution, real-time data processing to derive flood information [11,12].
Overall, the majority of disaster-monitoring methods are based on change detection algorithms, where the affected area is identified through a complex elaboration on images from pre- and post-event. Change detection can be applied to the amplitude or intensity, filtered or elaborated versions of the amplitude [2,13,14]. For example, in [15], a technique based on change detection applied to quantities related to the fractal parameters of the observed surface was developed to address change detection. In [16], information extracted from images taken and shared on social media by people in flooded regions was combined with the embedded metadata within them to detect flood patterns. In this study, a convolutional inception network was applied on pre-trained weights on ImageNet to extract rich visual information from the social media imagery. A word embedding was used for the metadata to represent the textual information continuously and feed it to a bidirectional Recurrent Neural Networks (RNN). The word embedding was initialized using Glove vectors, and finally, the image and text features were concatenated to find out probability of the sample, including related information about flooding. Similarly, in [17], an AI system was designed to retrieve social media images containing direct evidence of flooding events and derive visual properties of images and the related metadata via a multimodal approach. For that purpose, an image pre-processing including cropping and test-set pre-filtering based on image colour or textual metadata and ranking for fusion was implemented. In [18,19], Convolutional Neural Networks and Relation Networks were used for end-to-end learning for disaster image retrieval and flood detection from satellite images.
2. Methodology
Flood management strategies and emergency response depend upon the type of area affected (e.g., agricultural or urban) as well as on the flood type (e.g., fluvial, pluvial or coastal). Resilience measures are generally deployed by governmental agencies to reduce the impact of flooding. The use of AI to derive flood information for specific events is well documented in the scientific literature. However, little is known about how AI could inform future global patterns of flood impact and associated resilience needs.
The main focus of this paper is on the use of AI and more explicitly Machine Learning (ML) applied to natural disasters involving flooding to estimate the flood type from the weather forecast, location, days event lasted, begin/end location, begin/end latitude and longitude, injuries direct/indirect, death direct/indirect and property and crop damage.
The proposed method uses historical information collected from 1994 to 2018, to learn the patterns and changes in various parameters’ behaviours in flood events and make remarks for the future events. This paper focuses only on providing an insight on how floods behave differently in terms of damage. Using the historic data, the models developed adapt to all the changes over time by learning from past information and can provide high accuracy of classification. The proposed technique is highly adjustable to use for estimating any other desired parameters, providing a detailed set of historic data. This technique combined with other proposed techniques from literature, such as satellite imagery, social media information, etc. can provide a very powerful tool for having insight to flood events and help with preparedness, reduce impact, and better decision making.
The flood pathways and key variables are first described, and data sourcing and ML techniques used in this study are then explained, and finally the model evaluation metrics are provided.
2.1. Flood Pathways and Key Variables
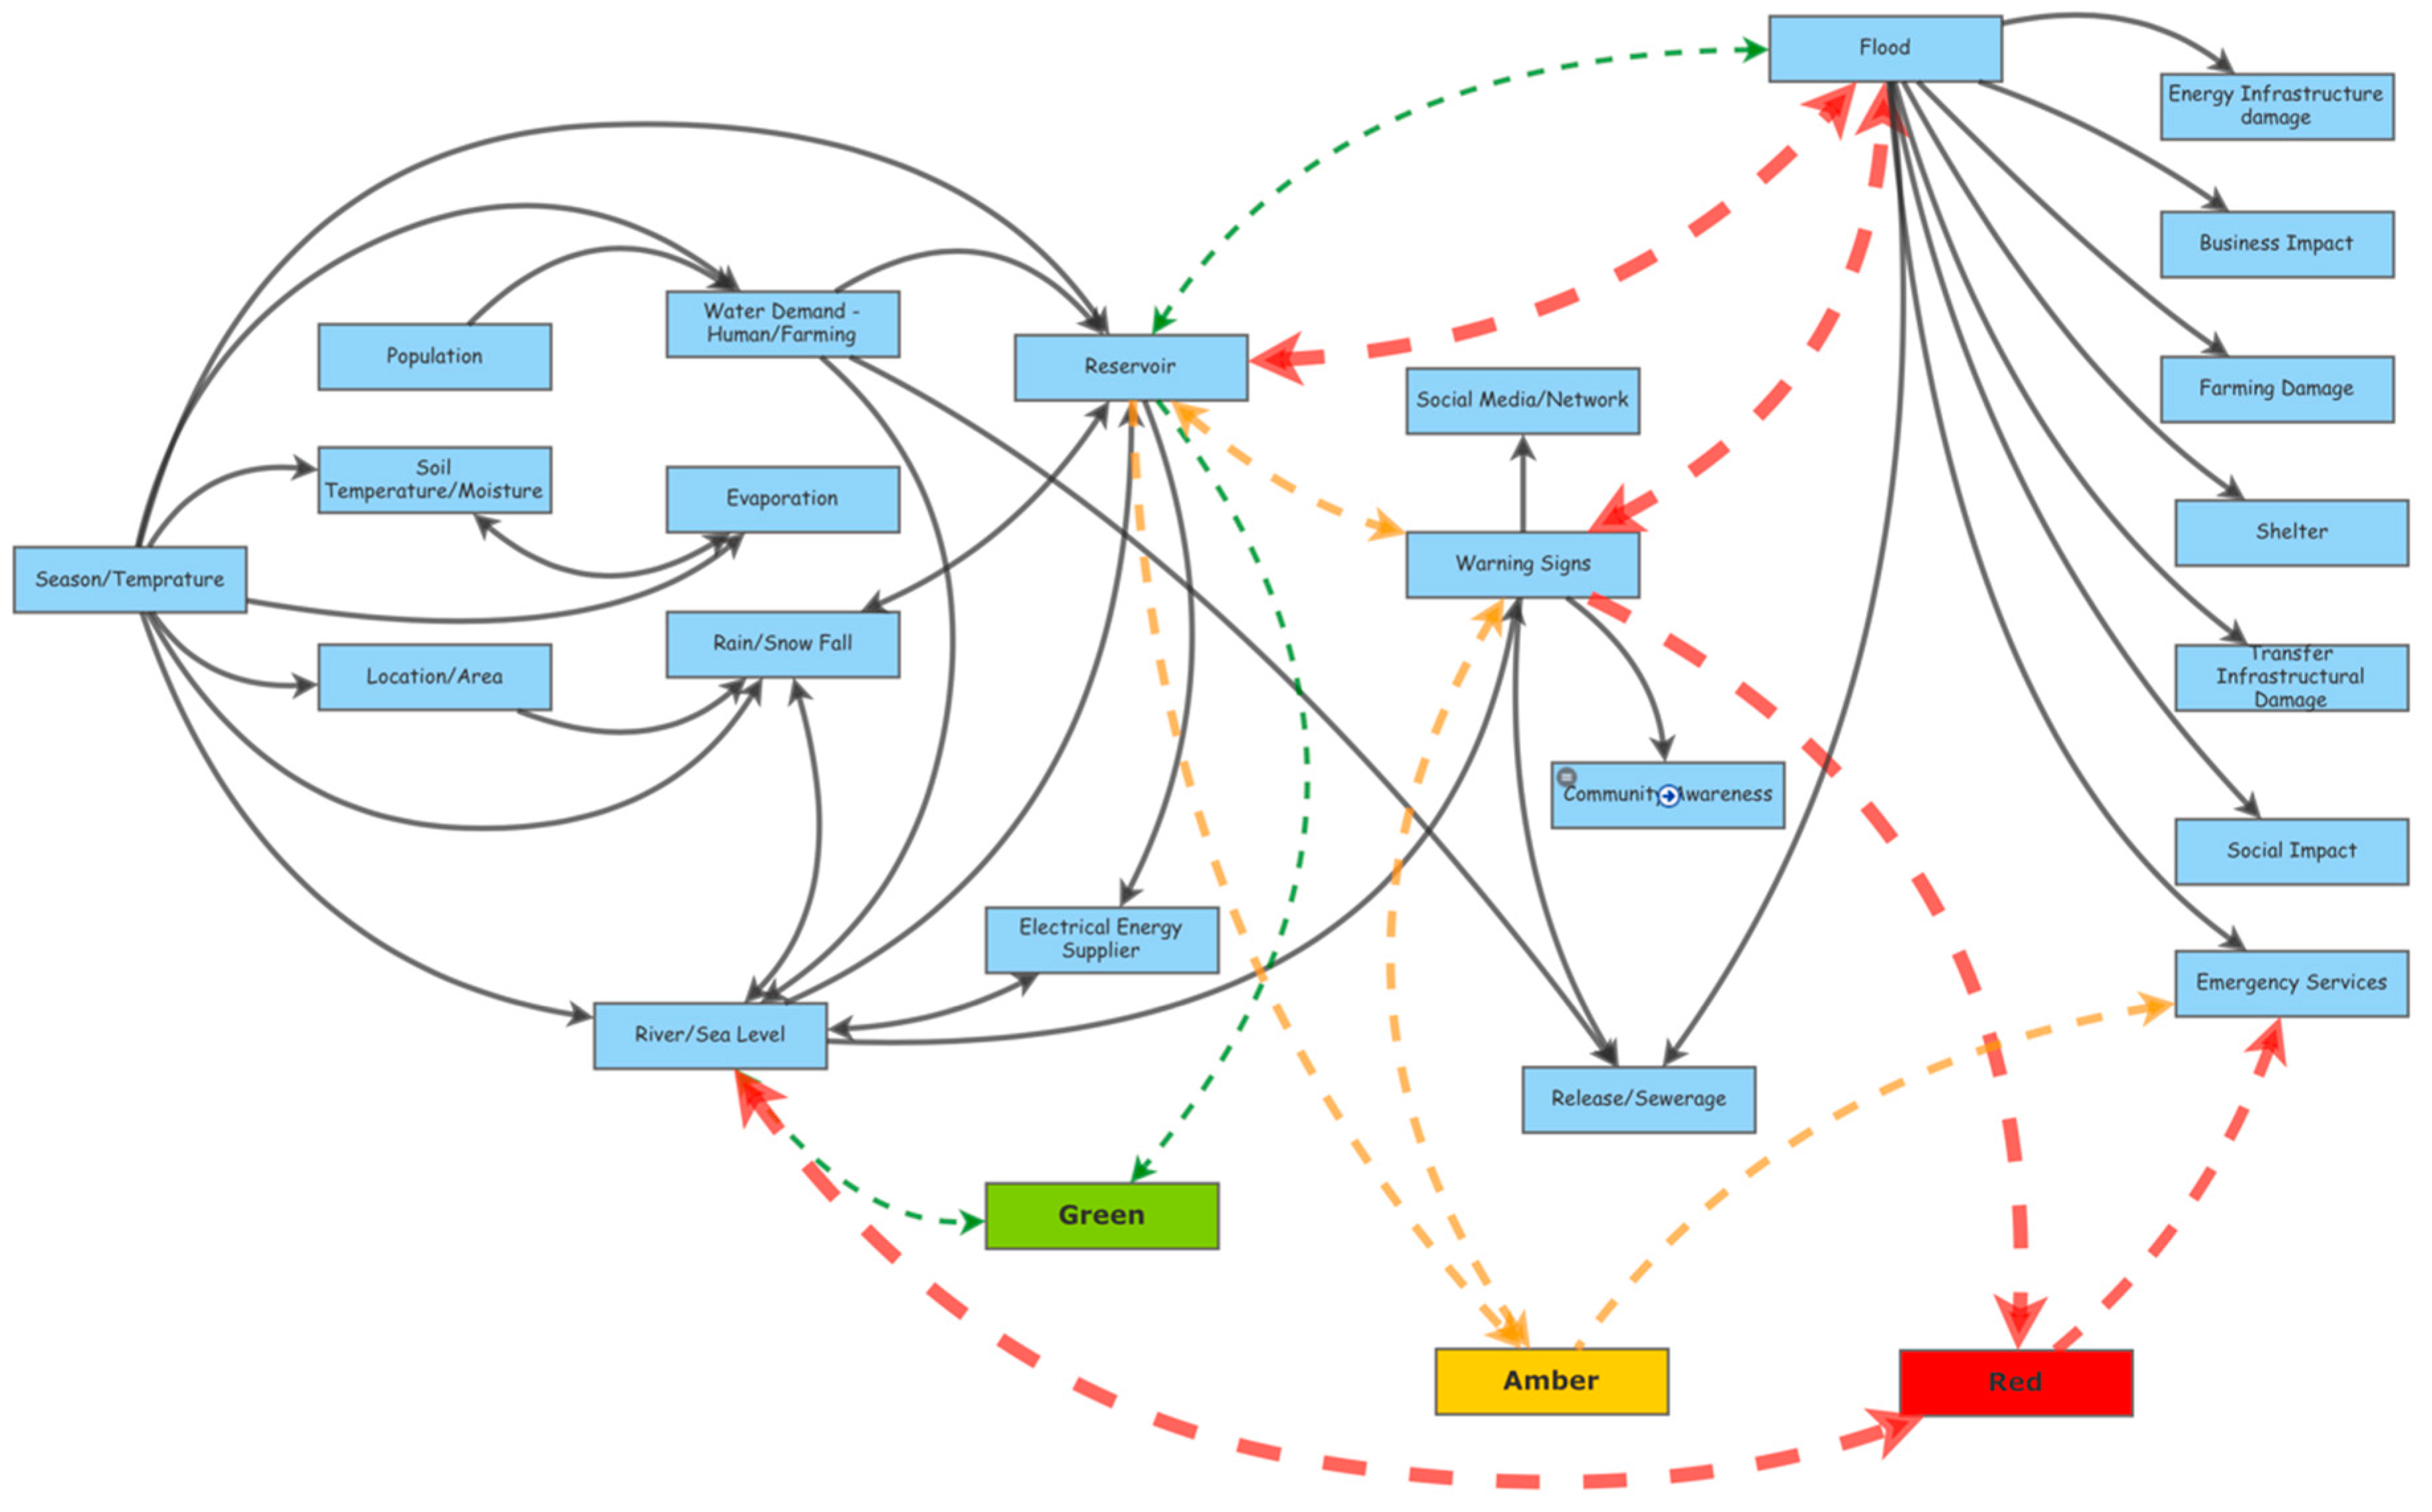
An important step in the process is to create influence maps as visual aids to illustrate how related variables interact and affect each other. Figure 1 indicates an overall causal loop diagram for a full flooding scenario. This map includes all the stakeholders and their interaction i.e., natural climate change, man-made facilities, businesses, public and governmental sectors, and social media.
The season, temperature, location of the area (highland/inland, coastal/urban), and rain/snowfall can affect the levels of the sea or river and reservoirs. Usage of water by energy suppliers, human/farming water demand can change the balance of the reservoirs and river water levels and indicate a warning sign for flooding. The use of social media and public awareness can help tackle the risks of a flooding event. When the flooding occurs, many sectors are affected i.e., road/rail way damage, gas/water pipe damage, power cut, farming damage, etc. Emergency response and access to food and local amenities are restricted. Grocery prices spike due to lack of supply and businesses are affected by physical building damage or lack of human resources. In this loop, public awareness, emergency responses (local/public), early release of sewerage system, and shelters can help save lives.
There are three states in the diagram in Figure 1: Green refers to normal conditions, amber refers to caution for a probability of flooding, and red refers to a very high risk or event of flooding.
2.2. Data Collation and Preparation
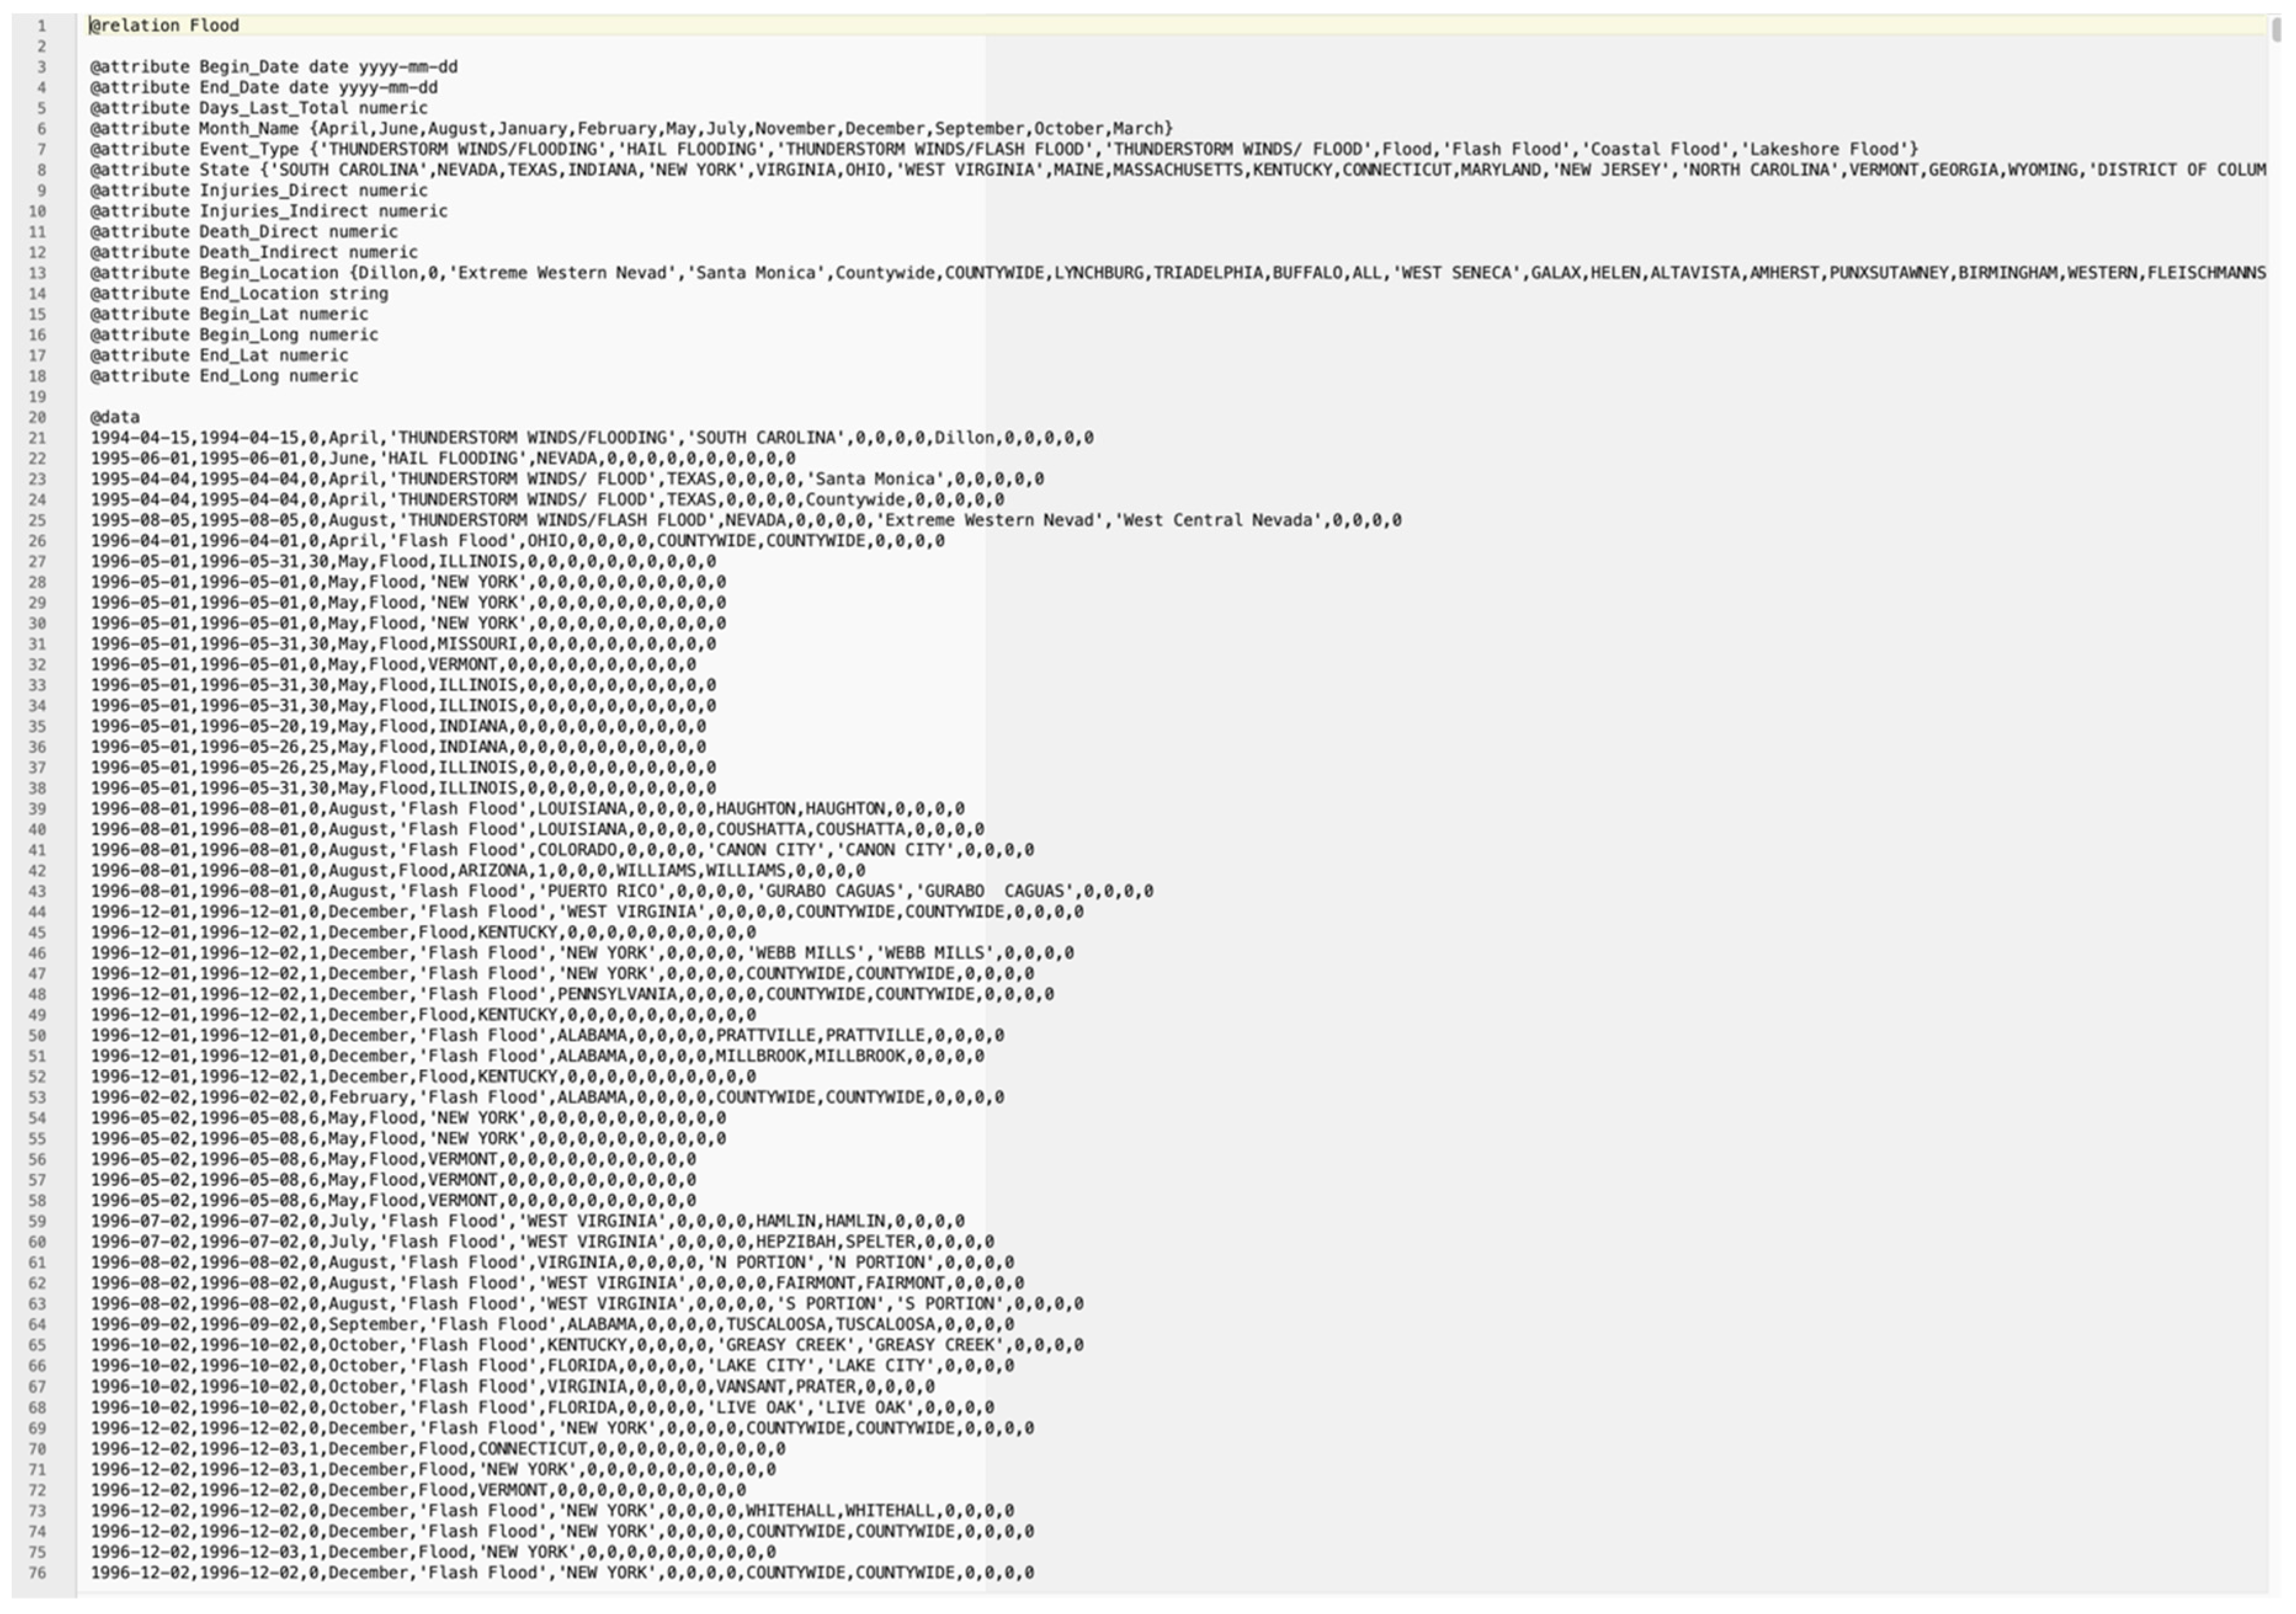
One of the most important requirements for this research was a detailed historic and inclusive data set, which was acquired from Federal Emergency Management Agency (FEMA) [20], National Oceanic and Atmospheric Administration (NOAA) [21] and National Climatic Data Centre (NCDC) [21]. The data used in this study covers the period of 1950 until 2018. However, the data of flooding events is recorded from the year 1994 onwards and is inclusive of all event types, i.e., heavy snow, thunderstorm, fog, hail, flood, high wind, etc. Table 1 summarises the different attributes used to build models within the ML based framework.
The data sets collated were inspected for outliers and extreme values, missing data and redundant information via a bespoke MATLAB application known as Flood Data Aggregation Tool (FDAT) developed for this purpose by the authors. FDAT removes all existing outliers and missing data and re-orders the data based on specific categories chosen for the implementation of the ML techniques and it converts the alphanumeric and alphabetic data to numeric data using one-hot encoding.
The processed dataset is then divided into training and testing data sets. The training data set is used to develop the model whereas the testing data set is used to quantify the accuracy of the model built. A larger portion of data is separated for training and the remaining is used for testing and validation to ensure accuracy of the classification model built and software performance. Figure 2 shows an overview of the overall analytical process employed in this study. The raw data collected is fed to FDAT tool for data cleaning, normalisation, aggregation, and other pre-processing steps. The output data is divided into testing and training data and passed through the ML/data mining tool, the patterns are extracted, and the model is built, followed by analysis to verify its quality.
2.3. Machine Learning—Model Development
AI is human intelligence demonstrated by machines and ML is an approach to achieve AI. In this study, the focus will be on supervised ML to learn from historic data, find clustered data, and build classification model for future events. This type of ML works particularly best when used in combination with historic data (results included). For this purpose, a number of data mining tools such as: Weka [22], MATLAB [23] and Orange [24] have been deployed. The reason for using two softwares (Weka and Orange) for this purpose is to test more ML techniques with various training and testing dataset sizes. The data is divided into two parts. The first will be used for training and generating the model, and the second will be used for testing and verification.
Several models were developed using different ML techniques to be able to measure and compare their performance and accuracy and choose the best. These techniques included Random Forest (RF), Lazy, J48 tree, Artificial Neural Network (ANN), Naïve Bayes (NB), and Logistic Regression (LR). The class for the model in all cases was set as “event type” (Table 1), which included flash floods, coastal floods, lakeshore floods and other kinds of floods. The independent attributes in all models were weather forecast, location, injuries direct, injuries indirect, death direct, death indirect, property damage ($) and crop damage ($) (Table 1). Two of these ML methods used i.e., RF and NB, are tested in both softwares (Weka and Orange) to ensure the accuracy of results.
2.3.1. Random Forest (RF)
RF [25] is a collaborative learning technique. It is a combination of the Bagging algorithm and the random subspace method and deploys decision trees as the basis for classifier. Each tree is made from a bootstrap sample from the original dataset. The key point is that the trees are not exposed to trimming, allowing them to partly overfit to their own sample of the data. To extend the classifiers at every branch in the tree, the decision of which feature to divide further is limited to a random sub-data from the full data set. The random sub-data is chosen again for each branching point.
2.3.2. Lazy
Lazy [25] learning is a ML approach where learning is delayed until testing time. The calculations within a learning system can be divided as happening at two separate times: training and testing (consultation). Testing time is the time between when an object is introduced to a system for an action to be taken and the time when the action is accomplished. Training time is before testing time during which the system takes actions from training data in preparation for testing time. Lazy learning refers to any ML process that postpones the majority of computation to testing time. Lazy learning can improve estimation precision by allowing a system to concentrate on deriving the best possible decision for the exact points of the instance space for which estimations are to be made. However, lazy learning must store the entire training set for use in classification. In contrast, eager learning need only store a model, which may be more compact than the original data.
2.3.3. J48 Decision Tree
A decision tree is an analytical machine-learning model that estimates the target value of a new test sample data based on several characteristic values of the training data. The nodes within a decision tree represent the attributes, the branches between the nodes represent the probable values that the attributes in training data may have, and the terminal nodes represent the final classification value of the attribute to be estimated.
J48 is an open source Java implementation of the C4.5 algorithm in the Weka data mining tool. In order to classify a new item, the J48 Decision tree [26] first has to generate a decision tree based on the training data attributes. Therefore, when it encounters a training set, it categorises the attribute that separates different samples most clearly. This feature allows most about the data instances to be classified and contains the highest information gain.
Amongst the possible features, if there is any value for which there is no uncertainty, which the data instances falling within its category have the same value for the target variable, then that branch terminates and will be assigned to the target value obtained.
2.3.4. Artificial Neural Networks (ANN)
An ANN [25] is a data processing system that is inspired by the way neurons in biological brain systems process information, which facilitates a computer to learn from the information provided. The crucial component of this system consists of a large number of greatly interrelated processing features (neurones) working uniformly to solve problems. An ANN system is developed without any precise logic. Basically, an ANN system adapts and changes its configuration based on the pattern within the information that flows through the network during the learning phase, and very similar to human beings, it learns by example. An ANN is primarily trained with a large amount of data. Training involves feeding input data and stating what the output would be. ANN use numerous principles, including gradient-based training, fuzzy logic, genetic algorithms, and Bayesian methods.
ANNs are designed to identify patterns in the given information. Particularly classification task which is to classify data into pre-defined classes, clustering task which is to classify data into distinctive undefined groups), and estimation task which is to use past events to estimate future ones.
One of the challenges of using ANNs is the time it takes to train the networks, which can be computationally expensive for more complex tasks. Another challenge is that the ANNs are like a black box, in which the user can feed in information and receive a built model. The user can modify the model, but they do not have access to the exact decision-making process.
2.3.5. Naïve Bayes (NB)
NB [25] is a simple learning algorithm that uses Bayes’ rule along with a theory that the features are provisionally independent given the class. Although this independence theory is usually affected in practice, NB usually delivers competitive classification precision. NB is commonly used in practice because of its computational efficiency and many other desirable features such as low variance, incremental learning, direct prediction of posterior probabilities, robustness in the face of noise, and robustness in the face of missing values.
NB provides a system to use the information from training data to estimate the future probability of each class y given an object x. These estimations can be used for classification or other decision support applications.
2.3.6. Logistic Regression (LR)
LR [25] is a mathematical model for estimation of the probability of an episode happening based on the given input data. LR provides a tool for applying the linear regression methods to classification problems. LR is used when the target variable is categorical. Linear regression estimates the data by defining a straight-line equation to model or estimate data points. LR does not look at the relationship between the two variables as a straight line. Instead, LR uses the natural logarithm function to find the relationship between the variables and uses test data to find the coefficients. The function can then estimate the future results using these coefficients in the logistic equation. LR uses the concept of odds ratios to calculate the probability. This is defined as the ratio of the odds of an event happening to its not happening.
2.4. Model Evaluation Metrics
The system has been trained with several different combinations; however, the final system uses one based on the selected attributes, which was an output of the classifier attribute evaluation from an ML tool. All ML models developed were validated using evaluation criteria, i.e., confusion matrix [25], Mean Absolute Error (MAE) [25] and Root Mean Squared Error (RMSE) [25]. These metrics are used for summarising and assessing the quality of the ML model.
A confusion matrix summarises the classifier performance with regards to the test data. It is a two-dimensional matrix, indexed in one dimension by the actual class of an object and in the other by the class that the classifier allocates, and the cells represent: true positives (TP), false positives (FP), true negatives (TN) and false negatives (FN) identified in a classification. Multiple measures of accuracy are derived from the confusion matrix i.e., specificity (SP), sensitivity (SS), positive estimated value (PPV) and negative estimated value (NPV). These are calculated as follows:
SP = TN / (TN + FP)
SS = TP / (TP + FN)
PPV = TP / (TP + FP)
NPV = TN / (TN + FN)
The MAE is the mean of the absolute value of the error per instance over all samples in the test data. Each estimation error is the difference between the true value and the estimated value for the sample. MAE is calculated as follows:
where is the true target value for test sample , is the estimated target value for test sample , and is the number of test samples.
The RMSE of a model with respect to a test data is the square root of the mean of the squared estimation errors over all samples in the test data. The estimation error is the difference between the true value and the estimated value for a sample. RMSE is calculated as follows:
where is the true target value for test sample , is the estimated target value for test sample , and is the number of test samples.
3. Model Training and Testing Results
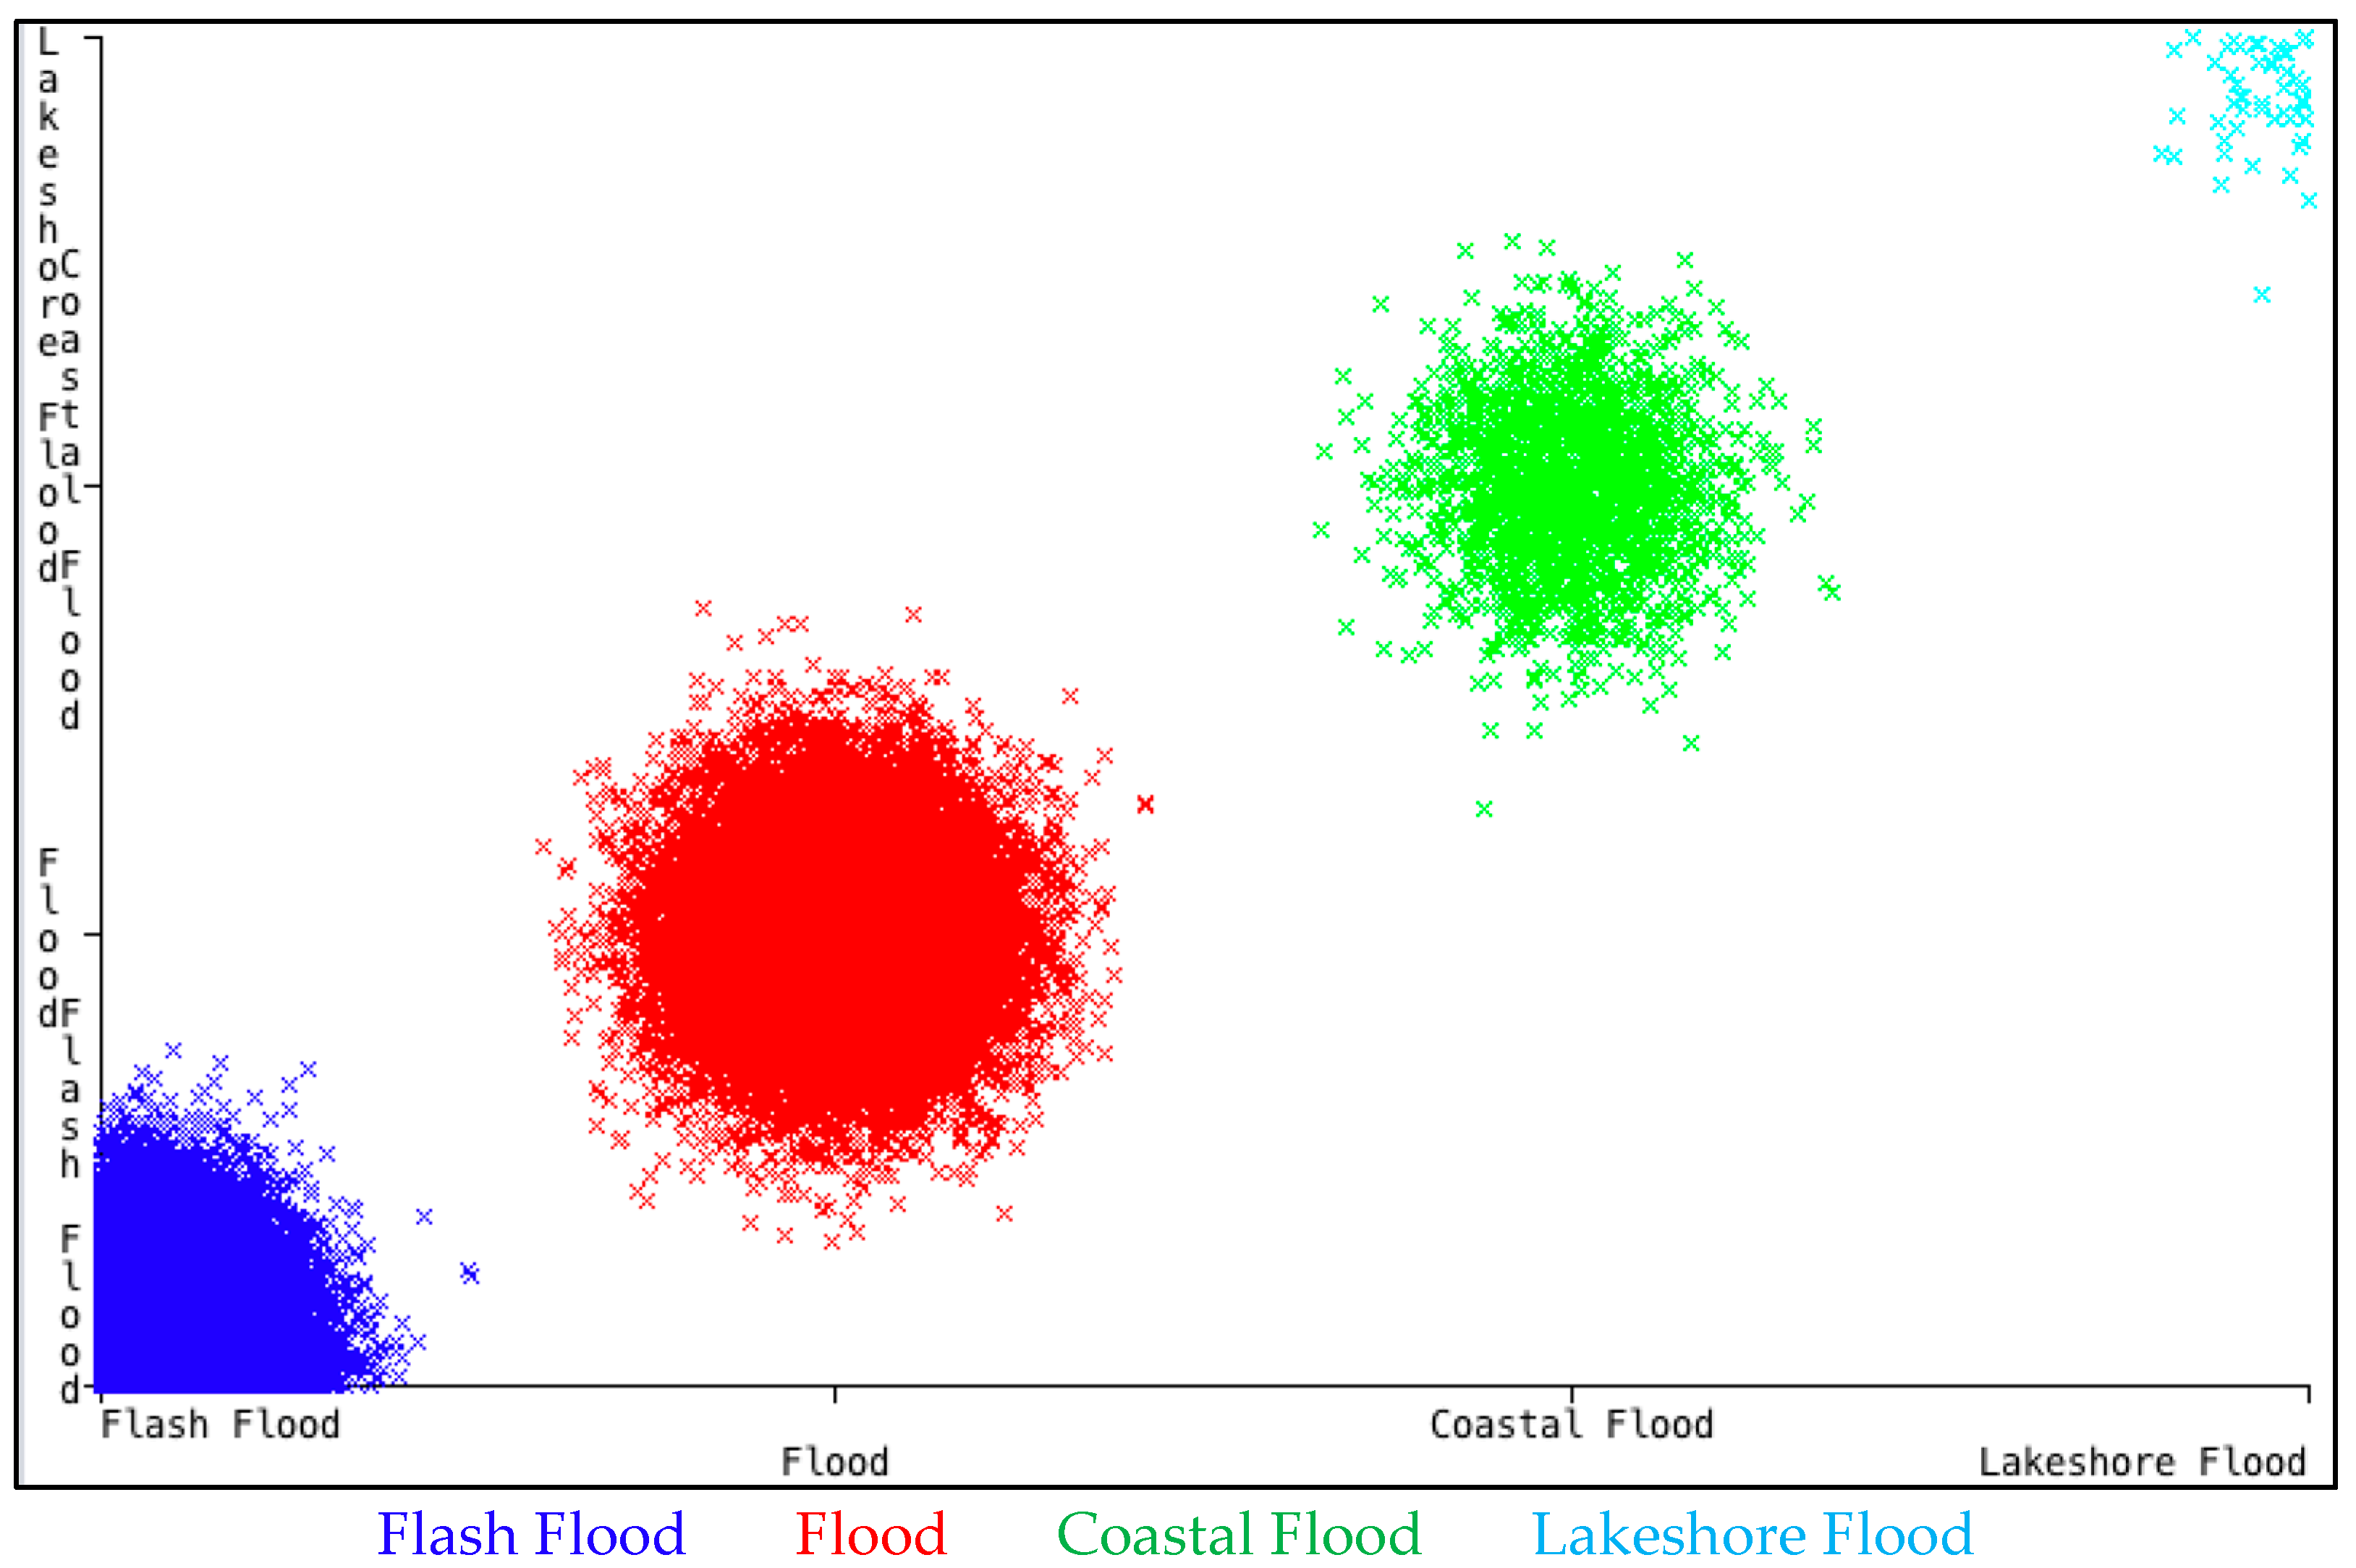
The original data consisted of 126,315 samples. After removing the outliers and filtering using ADAT application, 69,558 instances were narrowed down to be used for learning. The data was then divided into two parts: a larger section (data from 1994 to 2017) for training purposes and the smaller section (data from 2018) for testing purposes. A scattered plot of the training data for event type can be seen in Figure 4.
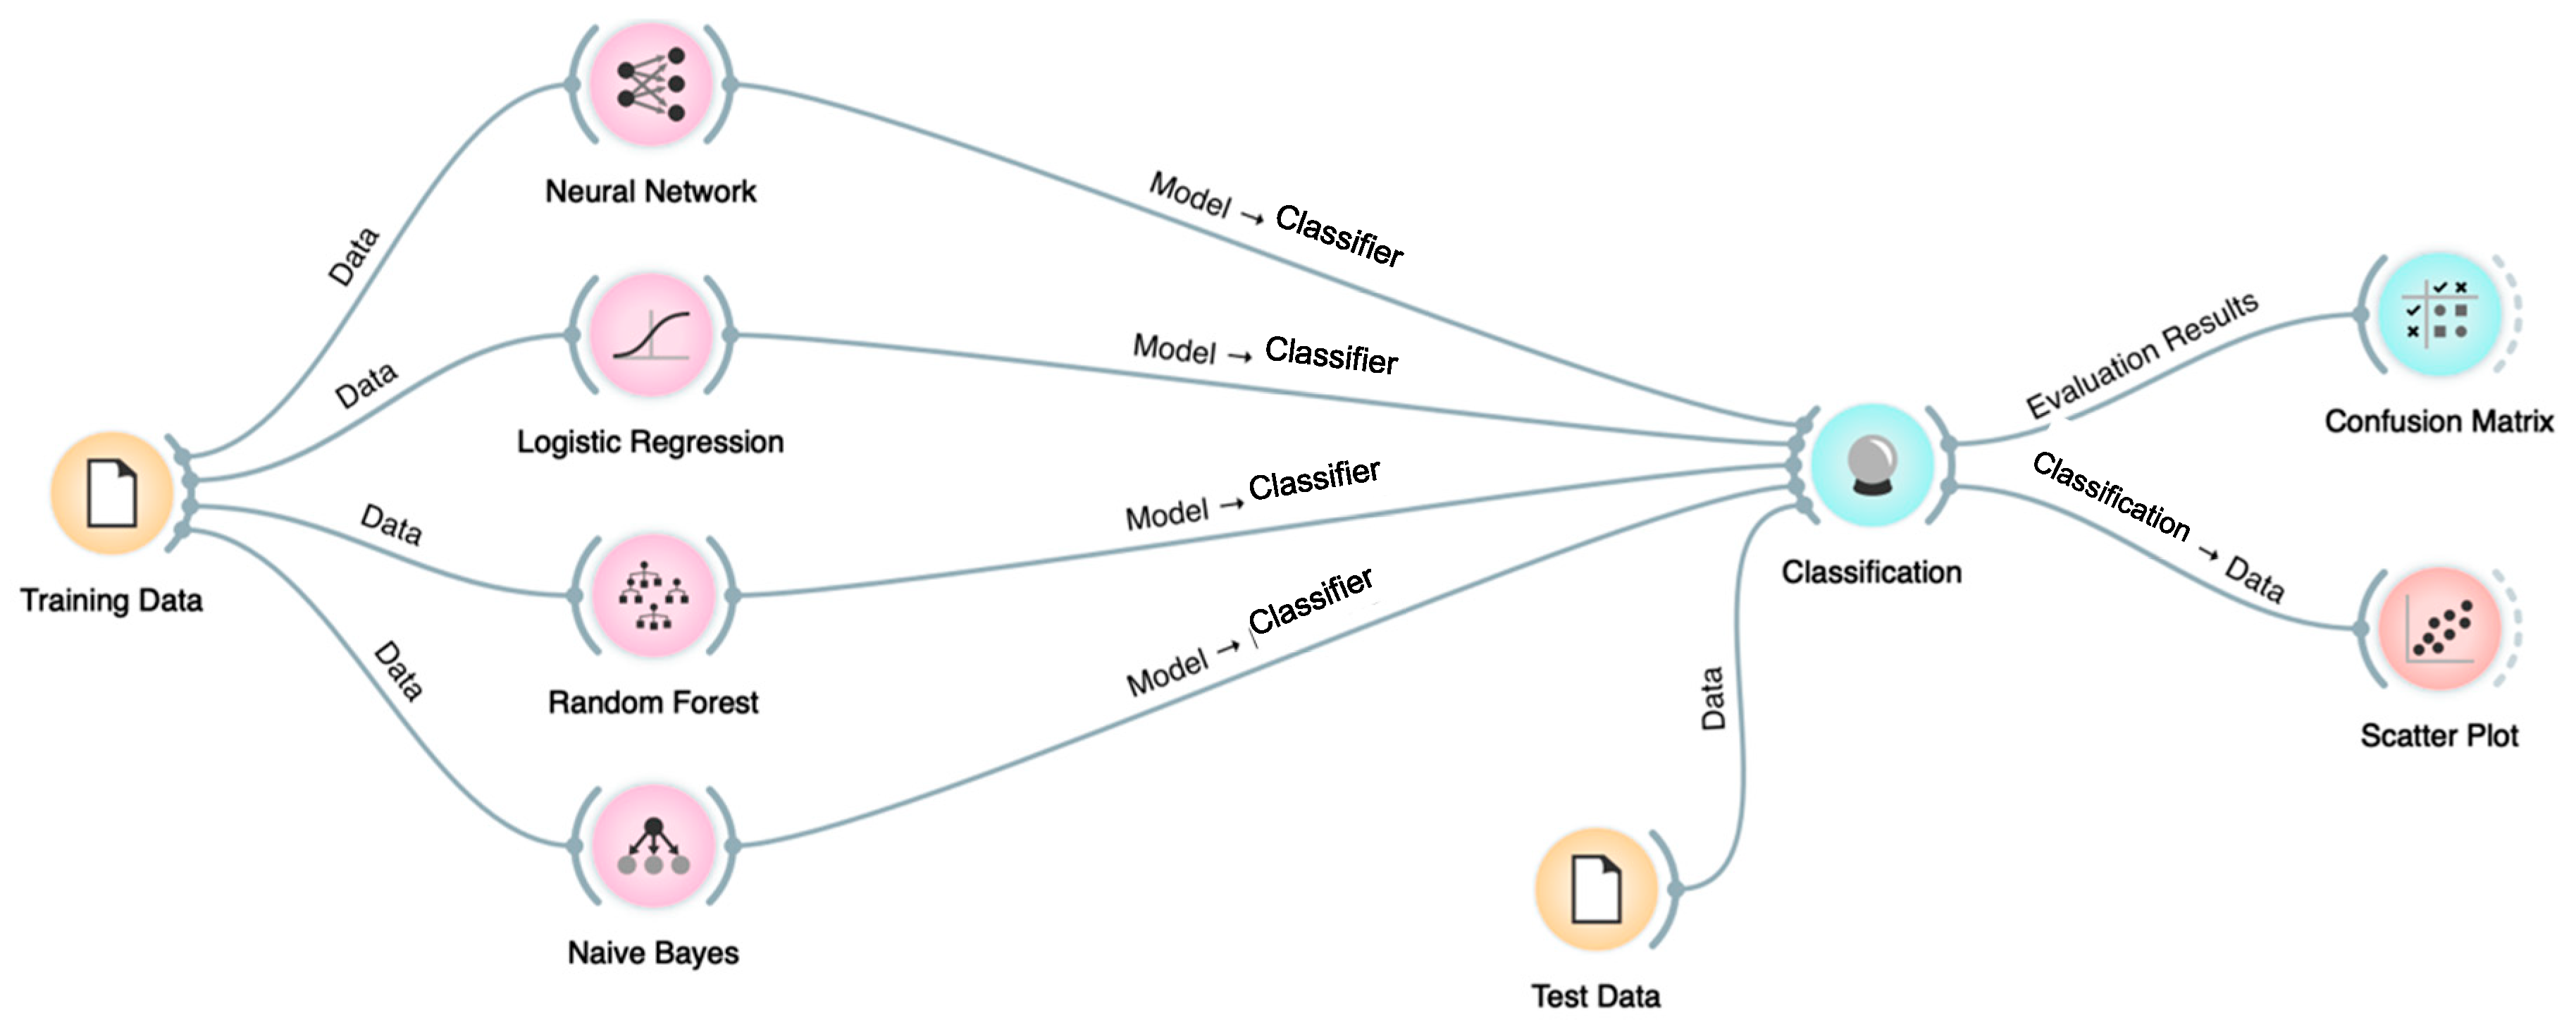
The test data for Orange software consists of 164 instances with target feature of “Event-Type”, of which 44 instances are coastal flood, 58 instances are flash flood, 53 are flood and 9 are lakeshore flood. The test data for Weka software consists of 3478 instances of which 100 are coastal flood, 2104 are flash flood, 1266 are flood and 8 are lakeshore flood. The testing dataset size can vary depending on the user desire and performance of the ML software and hardware capabilities. Four different types of ML techniques in Orange and four techniques in Weka are tested and evaluated in order to be able to choose the best performing technique. The techniques tested are RF, Lazy, J48 tree, ANN, NB, and LR. An overview of the model training and testing process is illustrated in Figure 5, which has been implemented in Orange. First, the training data is passed through different classification techniques (i.e., NN, LR, RF and NB) to build the classification models, then the models are tested using the test data. Finally, the evaluation results are produced and can be analysed and/or visualized (i.e., confusion matrix and scatter plot).
The results of the models and their performance are discussed below.
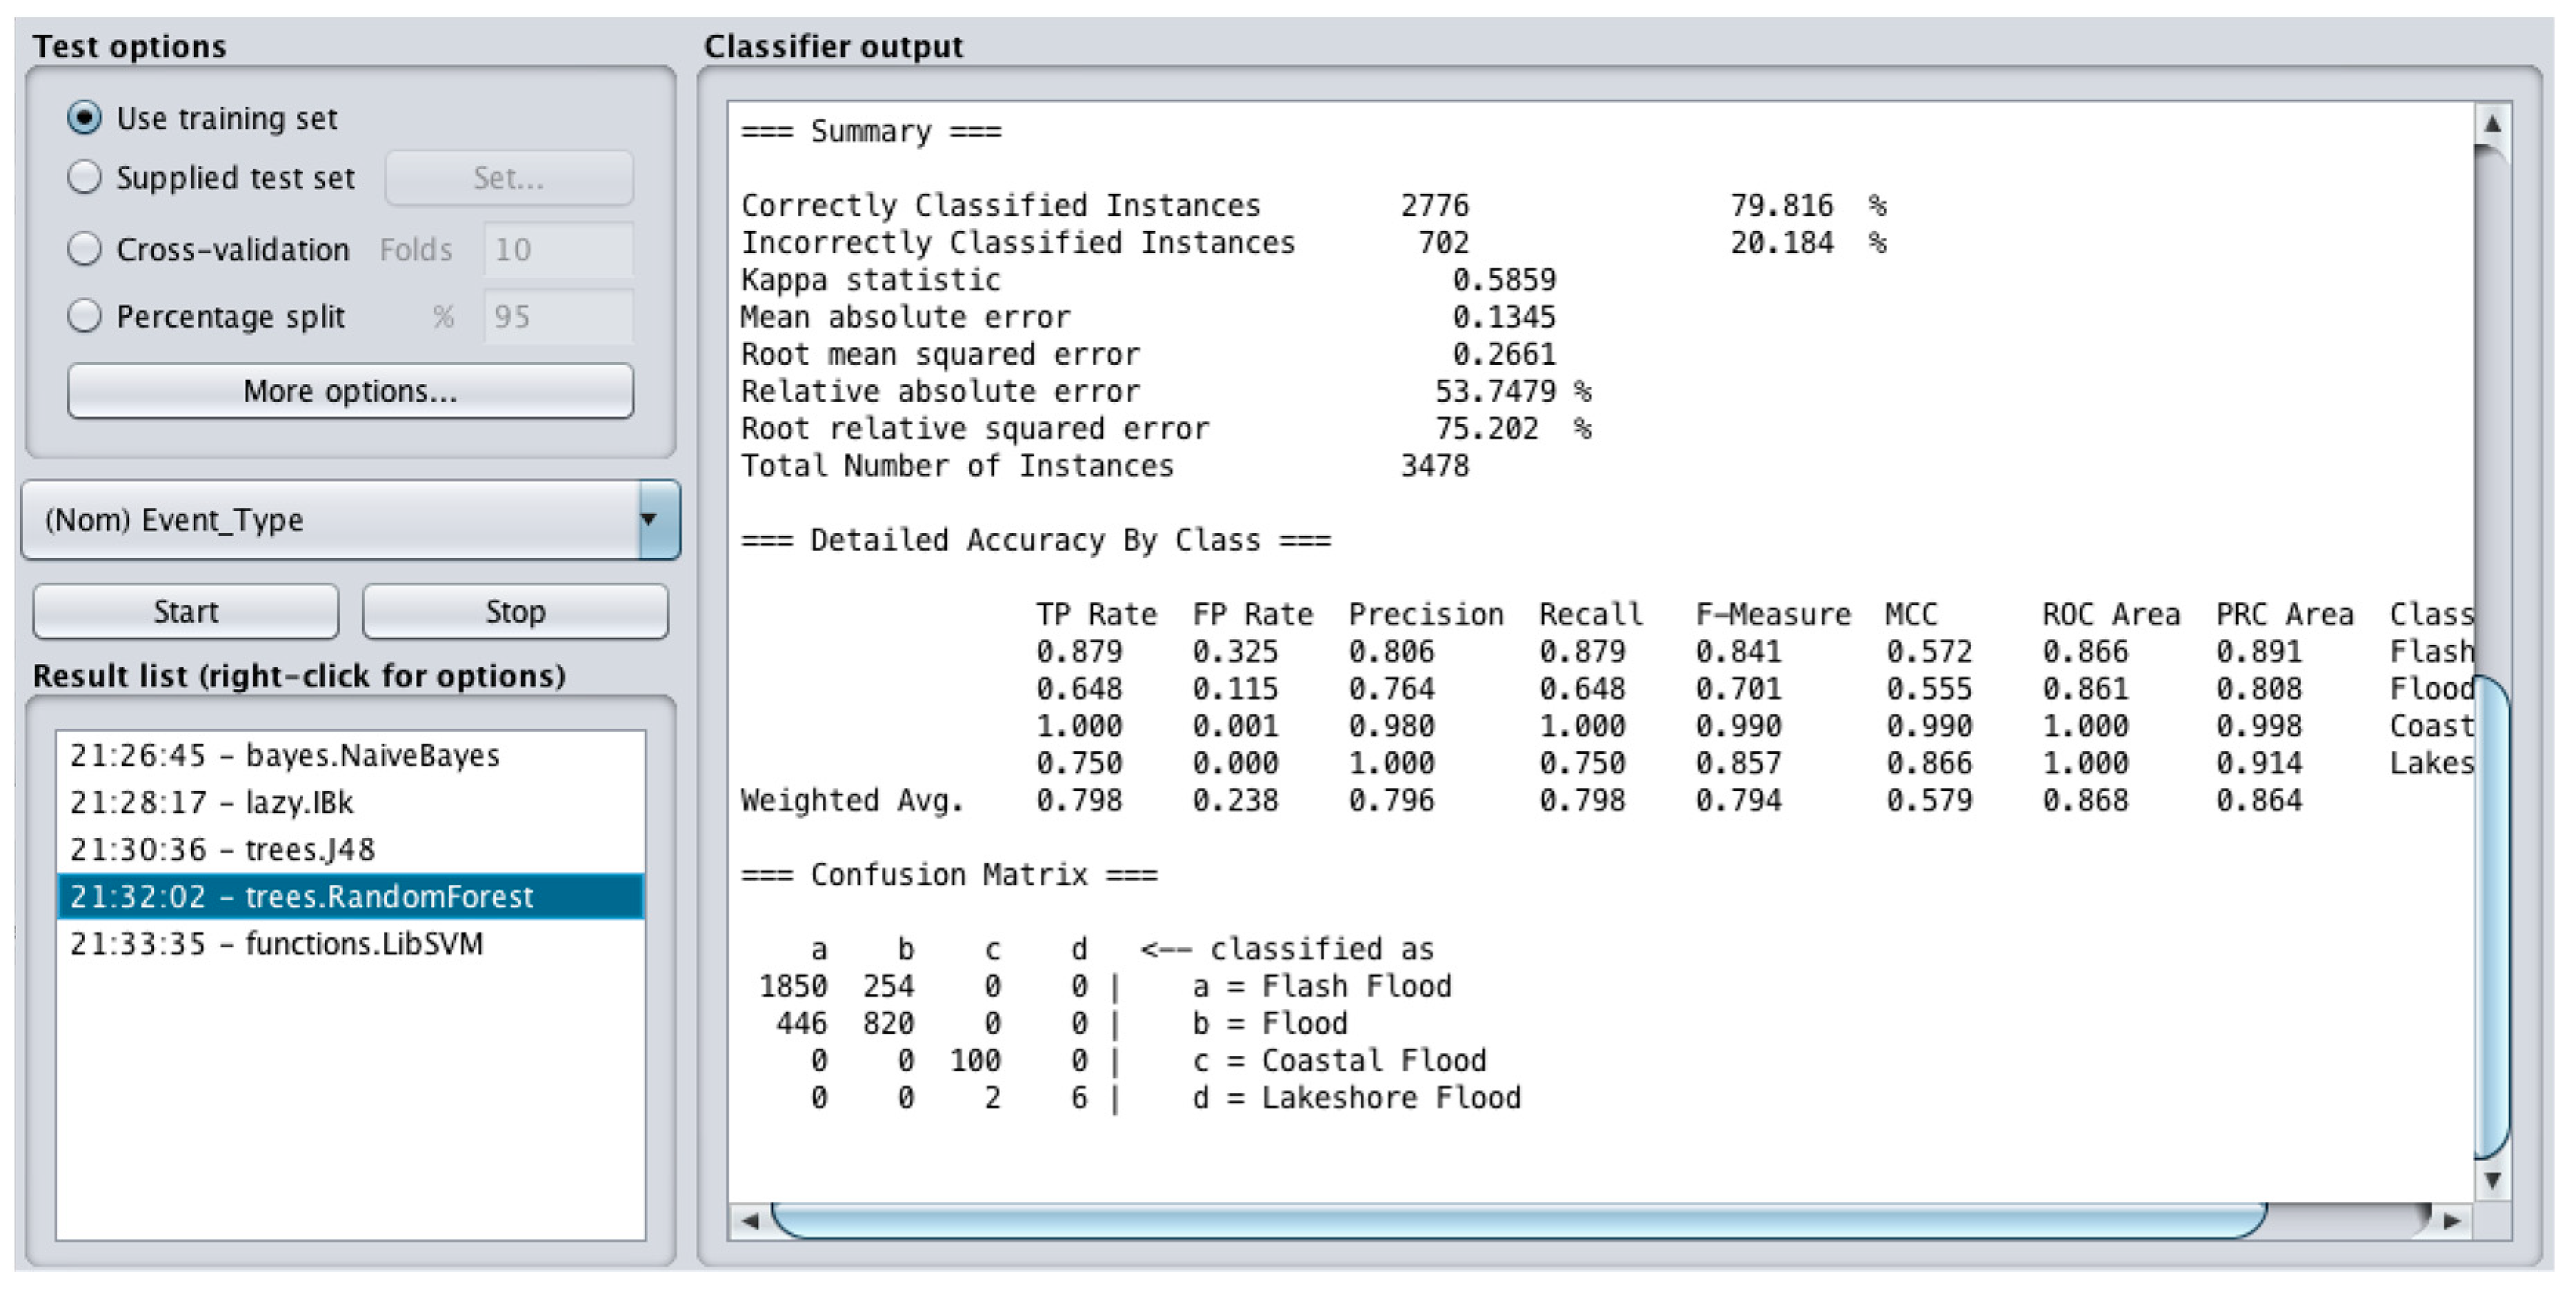
Based on the confusion matrix, the RF model using Orange software classified 7 out of 9 instances as Lakeshore Flood, 49 out of 53 as Flood, 32 out of 58 as Flash Flood and 44 out of 44 as Coastal Flood correctly. The correctly classified instances in total was 132 (80.49%). According to the proportion of the classifications on the test data, the RF was ahead of all other techniques. Figure 6 shows the evaluation results and confusion matrix for the RF model based on the supplied test set. Based on the confusion matrix, the RF model using Weka software classified 1850 out of 2104 as Flash Flood, 820 out of 1266 as Flood, 100 out of 100 as Coastal Flood and six out of eight instances as Lakeshore Flood correctly. The correctly classified instances in total are 2776 (79.83%). The MAE is 0.13 and RMSE is 0.27. The RF technique provides best results as compared to the techniques tested in Weka. Figure 7 indicates a visual classifier error for the RF model. The diagram shows the distribution of correctly classified instances in coloured clusters, where the bigger clusters (shown in crosses) are the correctly classified instances and the smaller clusters (shown with small squares) are the misclassified instances.
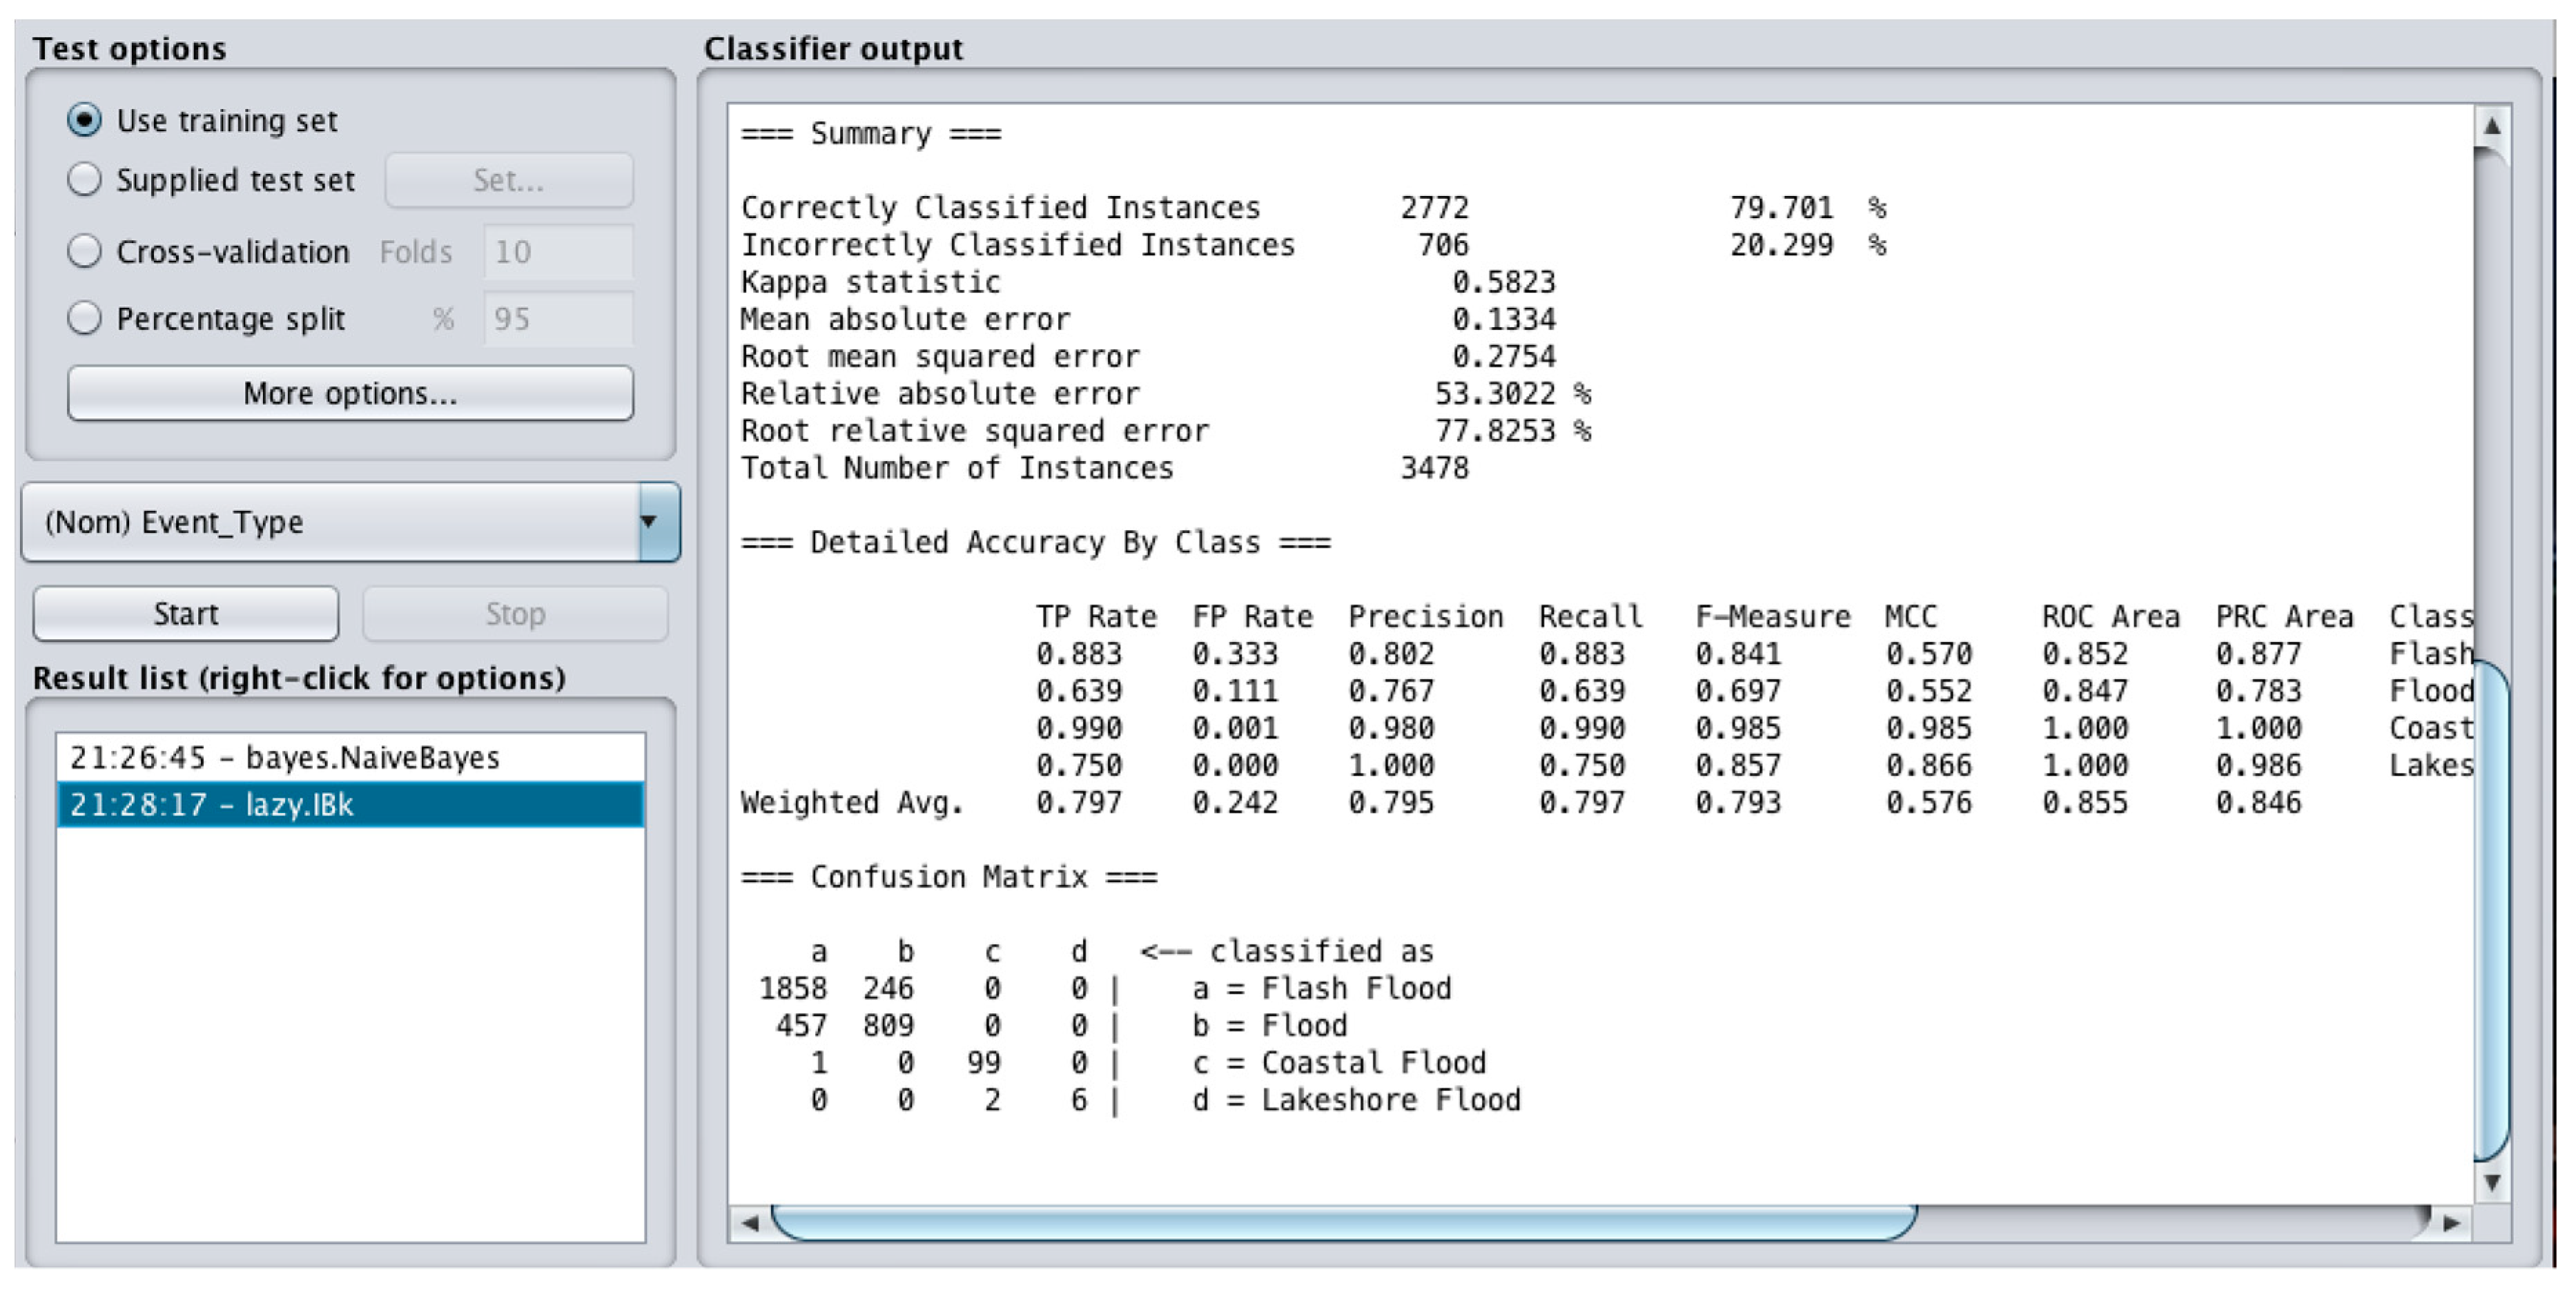
The confusion matrix result (Figure 8) indicates that the Lazy model (Weka) correctly classified 1858 out of 2104 as Flash Flood, 809 out of 1266 as Flood, 99 out of 100 as Coastal Flood and six out of eight instances as Lakeshore Flood. The correctly classified instances in total was 2772 (79.70%). The MAE was 0.13 and RMSE was 0.27. The Lazy technique provides better results than Naïve Bayes.
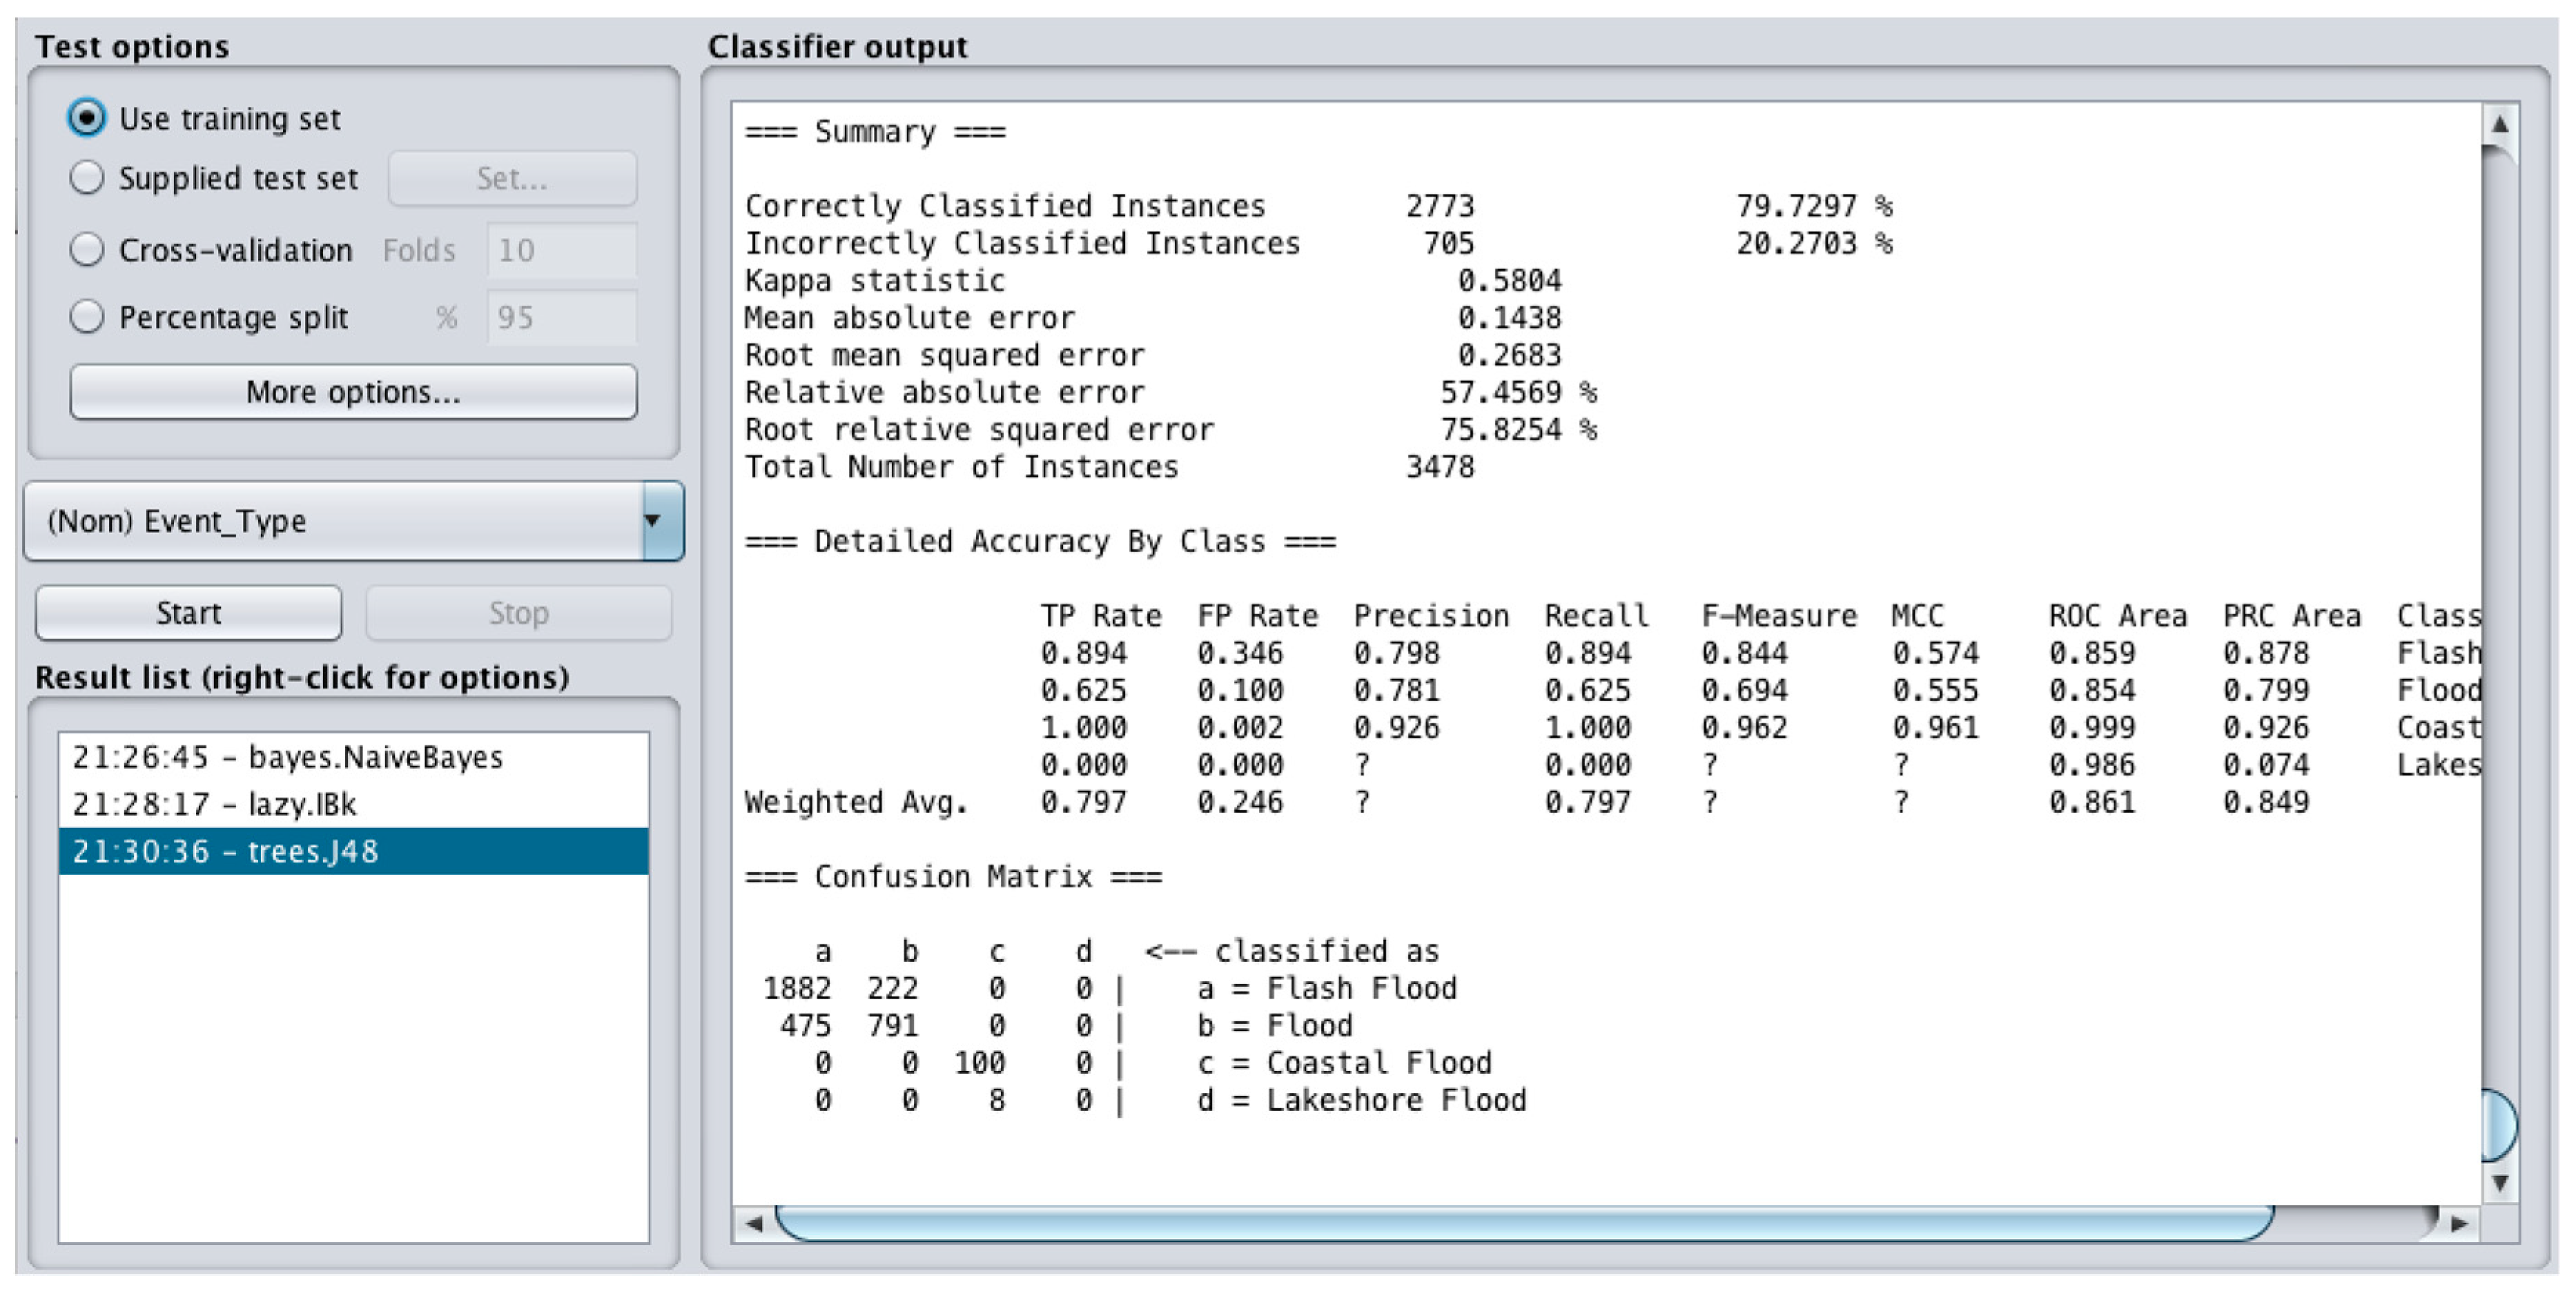
The confusion matrix (Figure 9) shows that the J48 model (Weka) classified 1882 out of 2104 as Flash Flood, 791 out of 1266 as Flood, 100 out of 100 as Coastal Flood and 0 out of 8 instances as Lakeshore Flood correctly. The correctly classified instances in total is 2773 (79.73% rate of success). The MAE is 0.14 and RMSE is 0.27; the J48 technique provides very similar results to Lazy.
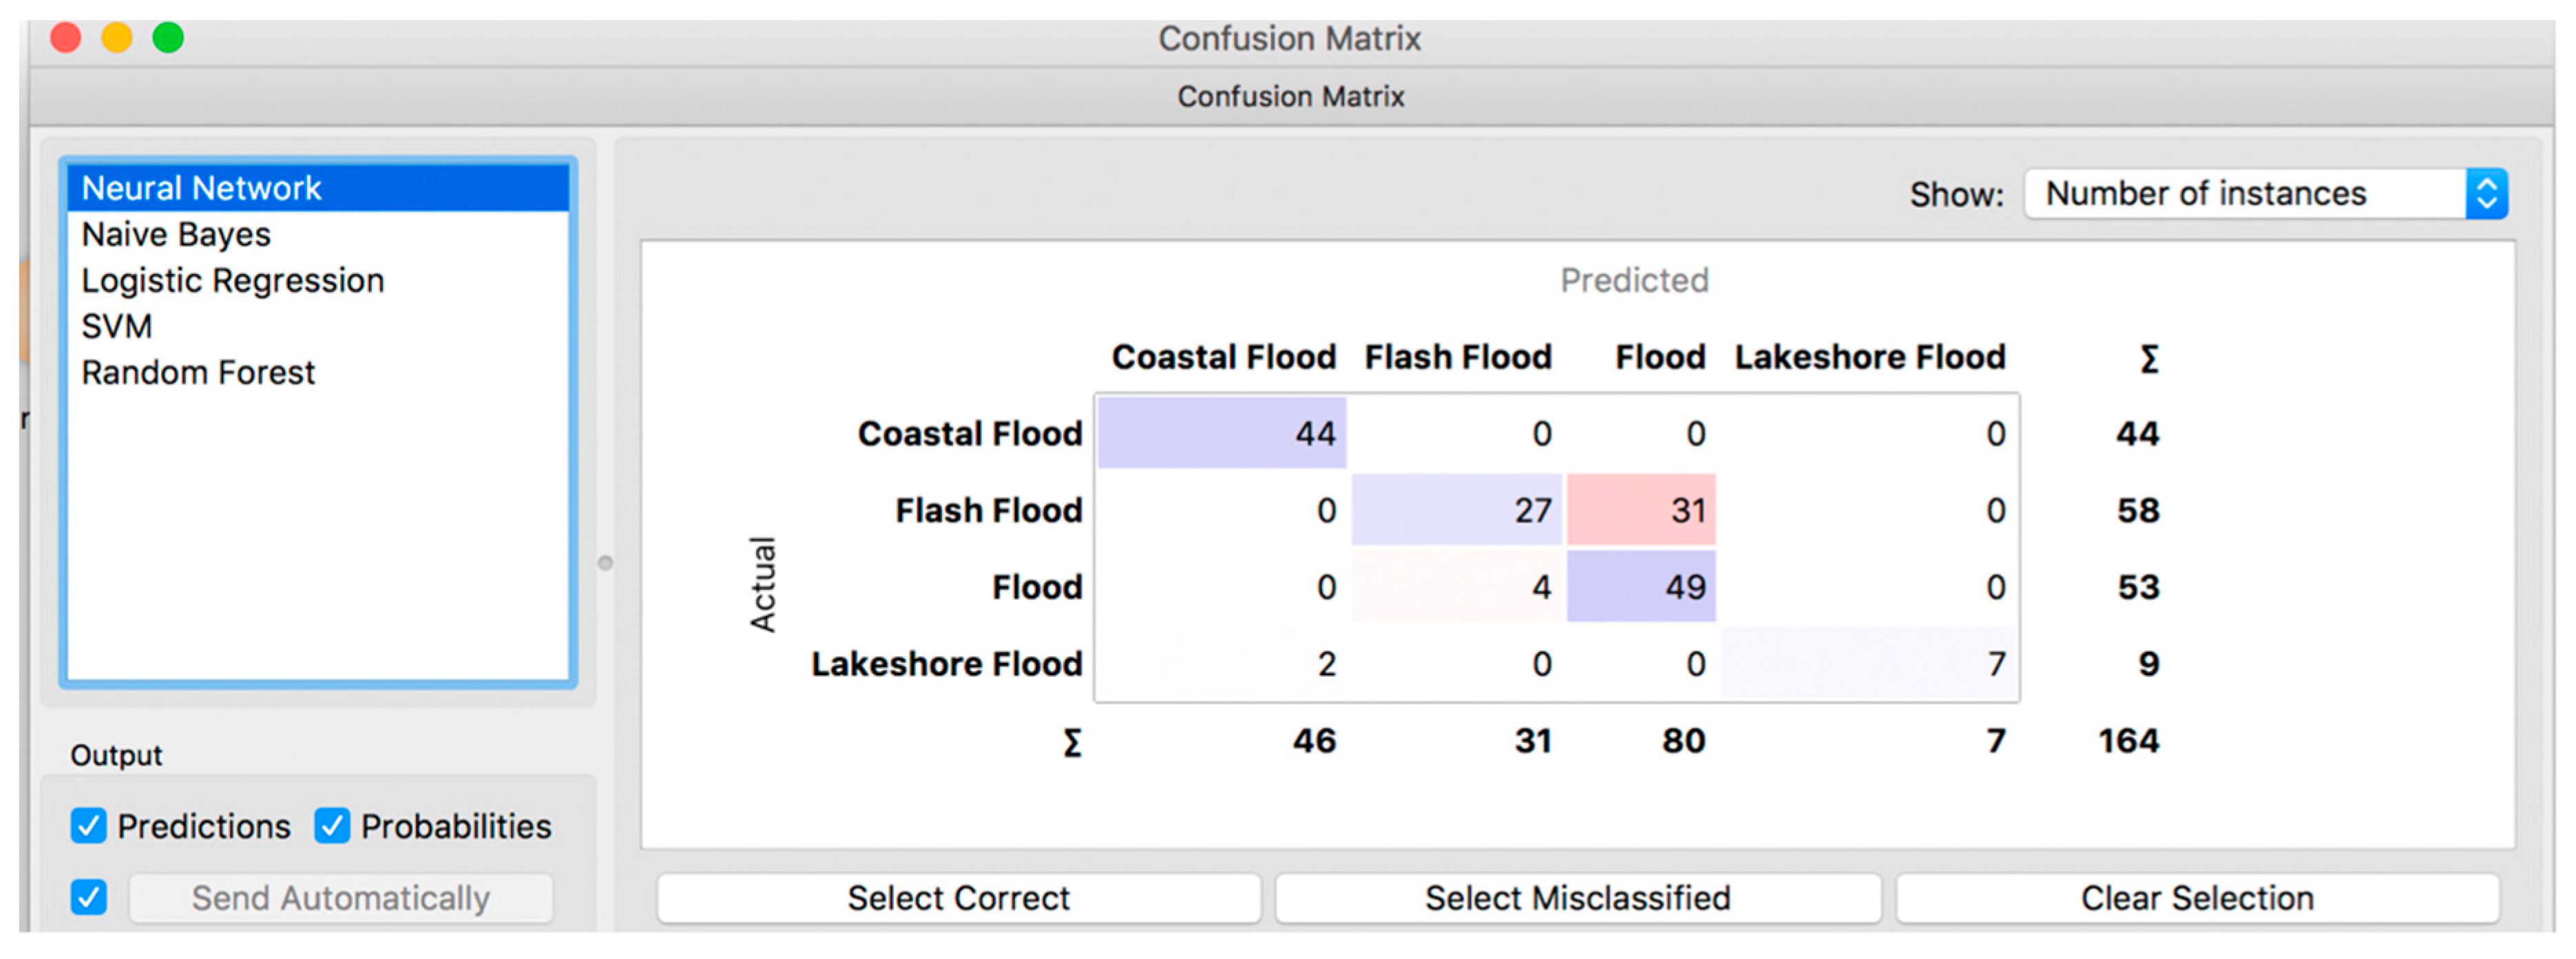
Based on the confusion matrix (Figure 10) result for the ANN model (Orange), successful classifications are 7 out of 9 as Lakeshore Flood, 49 out of 53 instances as Flood, 27 out of 58 as Flash Flood and 44 out of 44 as Coastal Flood correctly. The total of correctly classified instances is 127 (77.44% rate of success).
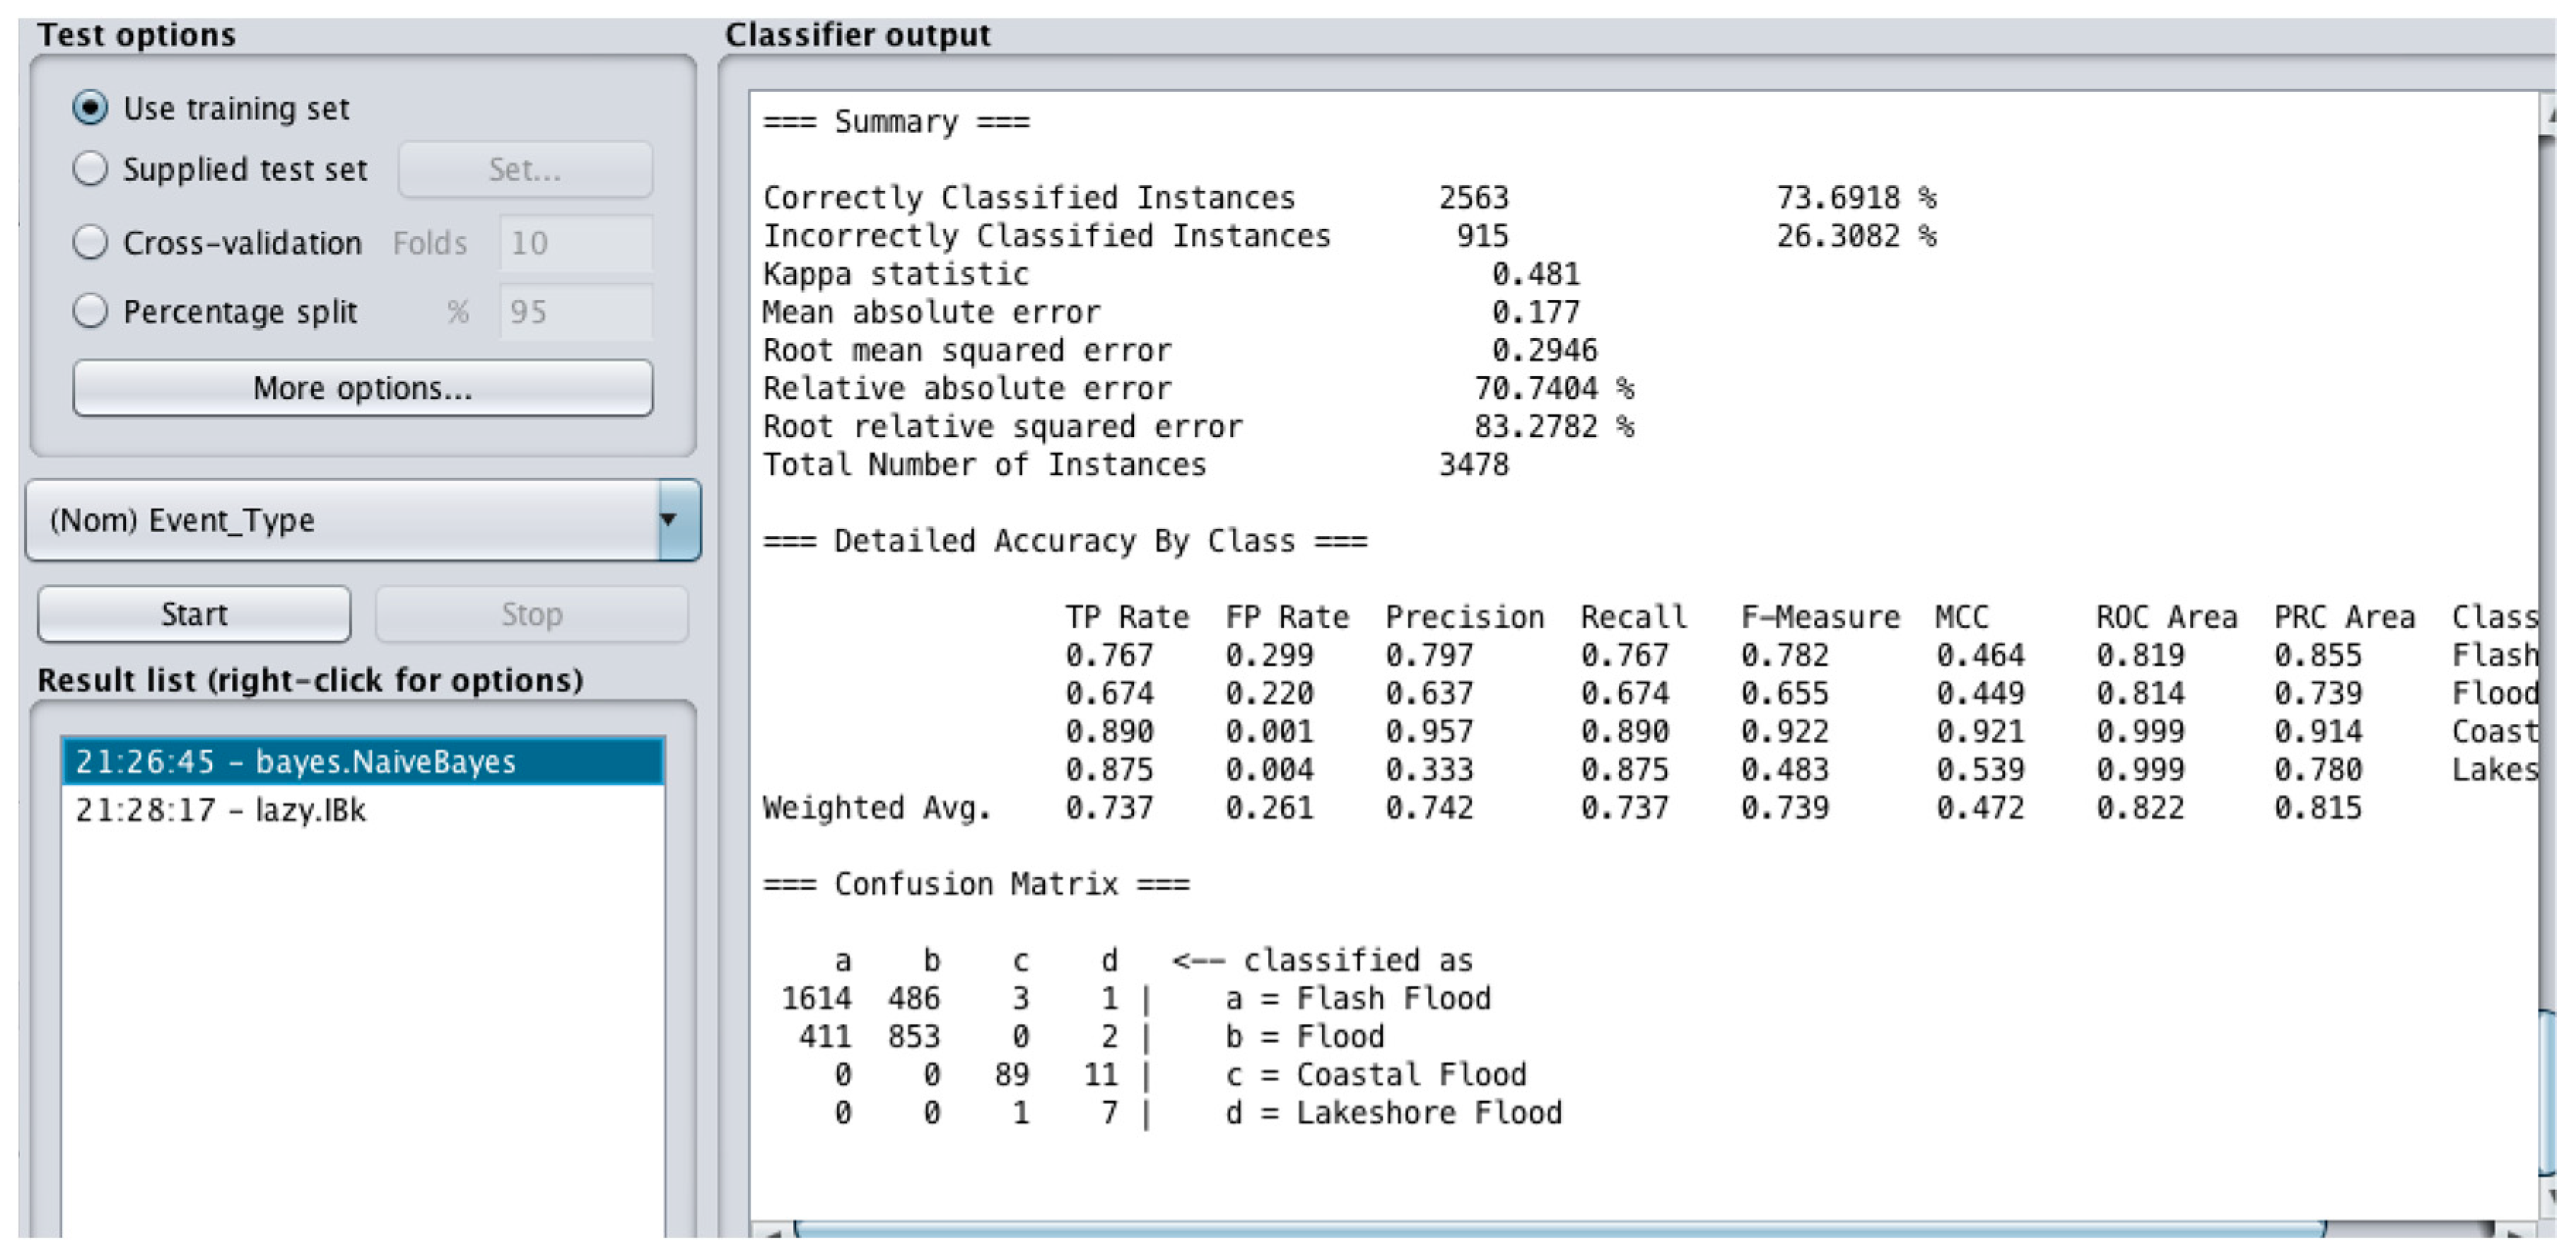
The NB model using Orange software correctly classified nine out of nine instances of Lakeshore Flood, 45 out of 53 as Flood, 27 out of 58 as Flash Flood and 44 out of 44 as Coastal Flood according to the resulting confusion matrix (Figure 10). The total of correctly classified instances was 125 (76.22%). The number of confused instances as Flash Flood and Flood are of a slightly higher proportion compared to the ANN based on 164 instances considered for validation. Correspondingly the confusion matrix showed that the NB model built using Weka software (Figure 11) classified 1614 out of 2104 as Flash Flood, 853 out of 1266 as Flood, 89 out of 100 as Coastal Flood and seven out of eight instances as Lakeshore Flood correctly. The correctly classified instances in total was 2563 (73.69%). The MAE was 0.18 and RMSE was 0.29. This outcome indicates that the NB has a very high classification accuracy when trained on a small data set or larger data set as both software have produced similar results when trained and tested on both large and small data sets.
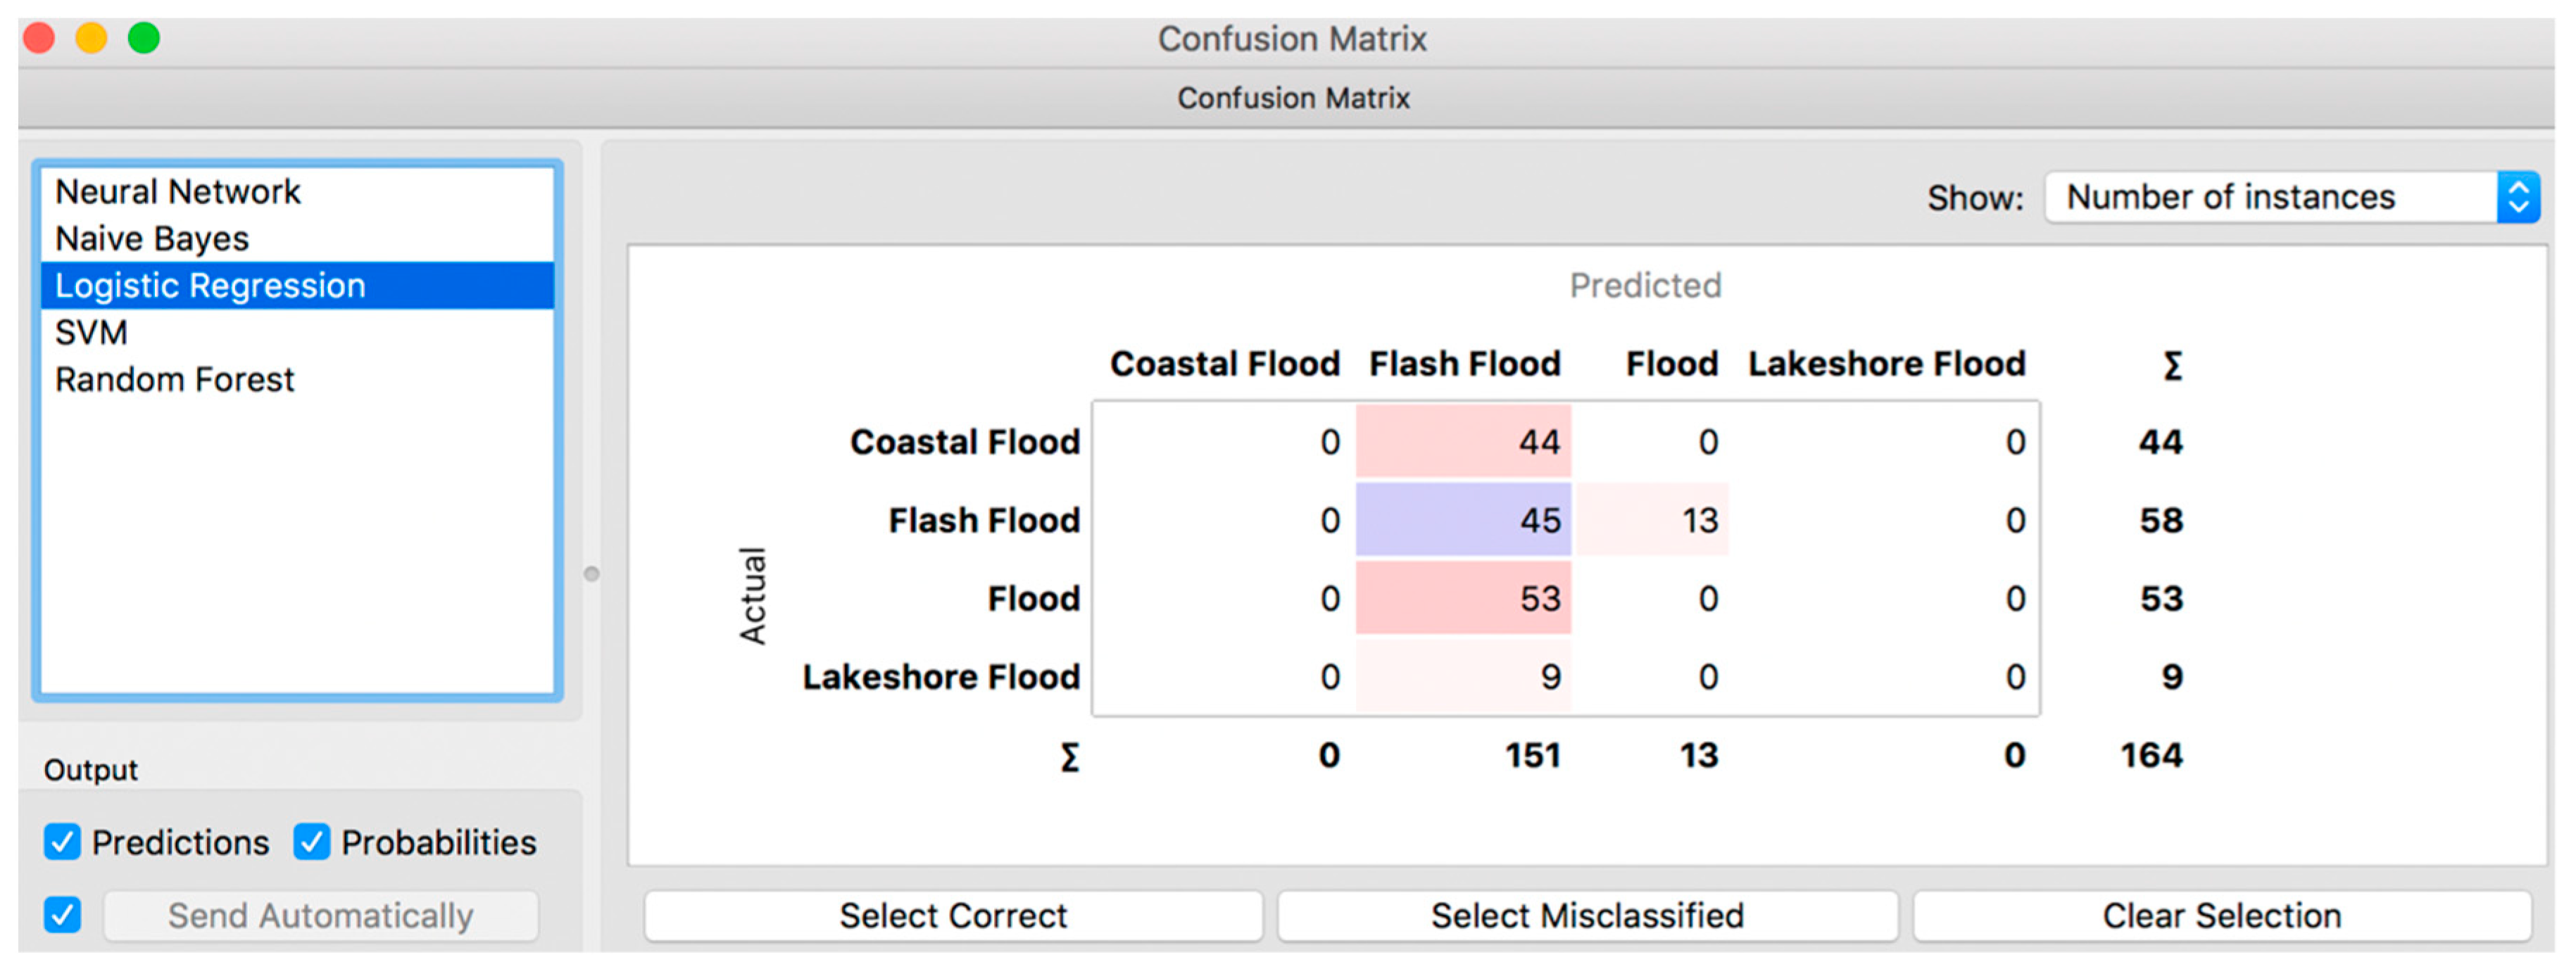
The LR model (Orange) is completely disregarded as it has provided as small as 27.44% correctly classified instances (Figure 12).
Table 2 shows the predicative models’ performance using the MAE and RMSE evaluation metrics.
4. Discussion
4.1. Model Performance
This paper takes advantage of historic data (23 years) collected from flood events to classify the type of the flood that is likely to happen in future. The data was filtered to remove outliers, correct the missing values, order the data, and more, using ADAT application. 69,558 instances (from years 1994 to 2017) were filtered as an output of the ADAT, which has been used in training the machine and the remaining 3642 instances (from 2018) were used for testing. 164 instances were used for test data in Orange software and 3478 instances were used as test data for Weka software with the class of “Event-Type”. Five types of ML techniques were tested and evaluated in order to be able to choose the best performing technique. The techniques tested are RF, Lazy, J48 tree, ANN, NB, and LR. Based on the evaluation metrics resulting from the models, it can be concluded that the best performing technique used in Orange software (based on the 164 test cases) proves to be the RF, with RMSE result of 2.06, MAE of 0.19 and correctly classified instance rate of 80.49%, followed by ANN with RMSE result of 2.45, MAE of 0.23 and correctly classified instance rate of 77.44%, NB with RMSE result of 2.52, MAE of 0.24 and correctly classified instance rate of 76.22% and LR with RMSE result of 5.52, MAE of 0.73 and correctly classified instance rate of 27.44%. The best performing technique used in Weka software (based on 3478 test cases) proves to be the RF, with RMSE result of 0.27, MAE of 0.1345 and correctly classified instance rate of 79.83%; followed by J48 with RMSE result of 0.27, MAE of 0.14 and correctly classified instance rate of 79.73%, Lazy with RMSE result of 0.27, MAE of 0.13 and correctly classified instance rate of 79.70% and NB with RMSE result of 0.29, MAE of 0.17 and correctly classified instance rate of 73.69%.
The comparison of the evaluation metrics from the models built using both software tools with different test data sets indicates that the RF performs best amongst all other techniques followed by ANN.
Note that the generated model can be used to provide an insight into the number of flooding events. For example, on using future estimation of weather forecast for the next 10 years from an environment agency, the built model can provide an understanding of the patterns and number of flooding events, and type of flood to be expected for that period.
4.2. Awareness, Preparedness and Resilience
The results of most flooding scenarios indicate that the event is a significant threat to people’s lives. Each of the emergency response elements shown in the influence map (Figure 1) such as emergency service, health service, community awareness and media coverage serve as a centre for the organisation of assistance supplies, which involves people who are trained to perform rescue tasks, of which one is for flood incidents. Flooding may result in the loss of a logistic centre and delay in responding to rescue operations. In this scenario, other elements must be used for coordination i.e., there may need to be a collaborative effort amongst response agencies from neighbouring districts and regions to help bring about normality to the affected areas. Sharing of resources and equipment to deal with a flood may be required if the local agencies are operating at their absolute capacity. In the UK, there is existing protocol that agencies adhere to for interagency collaboration and also inter-regional collaboration in times of crisis.
Flooding of infrastructure such as roads and bridges dramatically affect the ability of road users to get from a to b. This not only means that people will be unable to access these routes during a flood, but also that response agencies will be restricted in accessing certain positions, which is clearly problematic if urgent responses are needed. Even once the water withdraws, the residual deposits blocks the usage of the roadways and special equipment must be used to clear them. Flooding of businesses and schools could cause a disruption, preventing employees and students, respectively, from attending.
4.2.1. Flood Type Awareness and Classification
Based on the results of this study, which classifies flood type, it can be concluded that most emergency responders can be alerted of flood type that is likely to happen in the area. If emergency responders are not local to the area, they may not to be aware of what consequences different flood types can have and what kind of assistance is needed, specific to that flood type. For example, they might only envision damage to infrastructure and overlook building damages. Therefore, improvement measures can be taken to train more qualified staff to reduce the impact flooding may have on homes and other infrastructure.
4.2.2. Preparedness Planning
Depending on the flood type frequently happening to an area, plans can be set to reduce the threat and impact from flooding at the local level. The plan, called the preparedness plan, categorises the roles and responsibilities of each stakeholders i.e., emergency responders, firefighters, police, community and etc. that must take action in case of an emergency situation. By identifying the flood type that is likely to happen, the situation can be monitored and if it reaches an alarming level, a warning for evacuation can be issued to the people local to flood-prone areas. Also, the name of the closest shelter and evacuation route can be provided during an emergency.
4.2.3. Resilience
Bringing human knowledge and AI together is an important way to build resilience. The advantage of this research is to help comprehend, prioritise, and respond to the potential impact of flooding based on flood types and protect the community and environment. Flood type classification based on weather forecast will allow for key decision- makers such as local councils and emergency response agencies to take action to put in place mitigation measures to decrease the potential impact of an oncoming event.
This is achieved through better understanding of flood types and to make a long-term strategic plan to prioritise the need for investment based on flood type risk and consequence to reduce impact on lives, infrastructures, finances, etc. Solutions that are resilient to a variety of flood types can be made, mitigation measures can be implemented, and prioritising locations which are at higher risk can be kept under surveillance leading up to an anticipated flood occurrence.
5. Conclusions
This paper describes a robust evaluation of state-of-the-art ML techniques to classify flood type based on weather forecast, location, days event lasted, begin/end location (name of the place), begin/end latitude and longitude, injuries direct/indirect, death direct/indirect and property and crop damage to classify the flood type. The use of ML on historic data in terms of flood type classification is used for the first time in this study. Extensive historic data has been filtered and used for training and testing purposes. Several models were built and compared using evaluation metrics i.e., RMSE, MAE and confusion matrix. The comparison of the evaluation metrics from the models built suggest that the RF technique outperforms other techniques in terms of RMSE, MAE and confusion matrix (accuracy rate of 80.49%), followed by ANN (accuracy rate of 77.44%). One of the benefits of this work is that the same tools and techniques can be used to classify and estimate many other parameters, which have been used in currently used training set i.e., location, potential financial damage, etc.
This study has focused on flooding as a sub-branch of natural disasters. Nevertheless, there are many other possibilities to apply AI in natural disasters and help build resilience. Data mining can be applied to help insurance companies, estimate level of compensations, estimate damage to crops and buildings, and estimate number of injuries and death in specific areas. By being able to estimate more accurately and learn from past events, many lessons can be learned and applied in building resilience against natural disasters. This will also improve public awareness and preparedness, and save lives, if faced with an adverse natural condition.
A constraint in this study is restrictive access to inclusive data. Most of the big data sets are in the hands of private companies, and there are no principles for data sharing. Accessing and collecting these data is difficult and expensive.
The results from this study show for the first time that ML can be used to analyze datasets from historical disaster events to reveal the most likely events that could occur, should similar events be experienced in the future. From the literature review, to the best of the authors’ knowledge there is no equivalent set of data as the NCDC NOAA data from a UK source. It would be advantageous for the UK environmental agency to provide a detailed historic data from past natural disasters similar to the NCDC NOAA. This work has proven that the application of ML concept and if such data is made available from the UK, this ML method can be applied, and more advances can be made within the UK not only for flooding, but any type of natural disaster (based on provided data type) to help preparedness, raise awareness and build resilience in disaster management, especially in areas more prone areas to natural disasters.
The results are highly dependent on data quality and precision. If the data is not reliable or is “bad” data, the ML is trained on wrong information and therefore the results will be completely misleading. Missing information or parameter limitation can also adversely affect the model built.
For further study, building a predictive model for future events will be considered. Furthermore, the use of AI in more natural disaster areas and improving resilience in disaster management, especially in the UK, is strongly suggested.
Author Contributions
Conceptualization, S.S. and R.K.; Data curation, S.S. and D.J.; Formal analysis S.S. and D.J.; Funding acquisition, R.K.; Investigation, S.S.; Methodology, S.S.; Project administration, R.K. and G.F.; Resources, S.S.; Software, S.S.; Supervision, R.K.; Validation, S.S. and D.J.; Visualization, S.S.; Writing–original draft, S.S. and D.J.; Writing–review & editing, S.S.; R.K.; M.R.C.; G.F. and F.M.
Funding
This research was funded by the EPSRC for funding on BRIM (Building Resilience Into Risk Management), Ref: EP/N010329/1
Conflicts of Interest
The authors declare no conflict of interest.
References
- Arslan, M.; Roxin, A.; Cruz, C.; Ginhac, D. A review on applications of big data for disaster management. In Proceedings of the 2017 13th International Conference on Signal-Image Technology & Internet-Based Systems (SITIS), Jaipur, India, 4–7 December 2017; pp. 370–375. [Google Scholar] [CrossRef]
- Sande, C.J.V.D.; Jong, S.M.D.; Roo, A.P.J.D. A segmentation and classification approach of IKONOS-2 imagery for land cover mapping to assist flood risk and flood damage assessment. Int. J. Appl. Earth Obs. Geoinf. 2003, 4, 217–229. [Google Scholar] [CrossRef]
- Wang, Y.; Chen, A.; Fu, G.; Djordjevic, S.; Zhang, C.; Savic, D. An integrated framework for high-resolution urban flood modelling considering multiple information sources and urban features. Environ. Modell. Softw. 2018, 107, 85–95. [Google Scholar] [CrossRef]
- Mathioudakis, M.; Koudas, N. Twitter monitor: Trend detection over the twitter stream. In Proceedings of the 2010 ACM SIGMOD International Conference on Management of Data, ACM, Indianapolis, IN, USA, 6–10 June 2018; pp. 1155–1158. [Google Scholar]
- Smith, L.; Liang, Q.; James, P.; Lin, W. Assessing the utility of social media as a data source for flood risk management using a real-time modelling framework. J. Flood Risk Manag. 2017, 10, 370–380. [Google Scholar] [CrossRef]
- Sangeetha, S.; Jayakumar, D. Flash flood forecasting using different artificial intelligence method. Int. J. Eng. Trends Technol. 2018, 3, 140–144. [Google Scholar] [CrossRef]
- Robert, P.; Bella, R.; John, C.; Mark, C. Emergency Situation Awareness: Twitter Case Studies. Available online: https://link.springer.com/chapter/10.1007/978-3-319-11818-5_19 (accessed on 9 May 2019).
- Lopez-Fuentes, L.; Weijer, J.; González-Hidalgo, M.; Skinnemoen, H.; Bagdanov, D.A. Review on computer vision techniques in emergency situations. Multimed. Tools Appl. 2017, 77, 17069–17107. [Google Scholar] [CrossRef] [Green Version]
- Lai, C.L.; Yang, J.C.; Chen, Y.H. A real time video processing-based surveillance system for early fire and flood detection. In Proceedings of the Instru-mentation and Measurement Technology Conference Proceedings, Warsaw, Poland, 1–3 May 2007; pp. 1–6. [Google Scholar]
- Liu, F.; Xu, F.; Yang, S. A flood forecasting model based on deep learning algorithm via integrating stacked autoencoders with BP neural network. In Proceedings of the IEEE International Conference on Multimedia Big Data, Laguna Hills, CA, USA, 19–21 April 2017; pp. 58–61. [Google Scholar]
- Martinis, S. Automatic near real-time flood detection in high resolution X-band synthetic aperture radar satellite data using context-based classification on irregular graphs. Ph.D. Thesis, Electronic Theses of LMU Munich, Munich, Germany, 2010. [Google Scholar]
- Mason, D.C.; Davenport, I.J.; Neal, J.C.; Schumann, G.J.P.; Bates, P.D. Near real-time flood detection in urban and rural areas using high-resolution synthetic aperture radar images. Geosci. Remote Sens. 2012, 50, 3041–3052. [Google Scholar] [CrossRef]
- Sayers, W.; Savić, D.; Kapelan, A.; Kellagher, R. Artificial intelligence techniques for flood risk management in urban environments. Proc. Eng. 2014, 70, 1505–1512. [Google Scholar] [CrossRef]
- Wu, Z.Y.; Liu, W.; Xu, J.; Feng, S.; Palaiahnakote, T.L. Context-aware attention lstm network for flood prediction. In Proceedings of the 24th International Conference on Pattern Recognition (ICPR), Beijing, China, 20–24 August 2018; pp. 1301–1306. [Google Scholar] [CrossRef]
- Witten, I.H.; Eibe, F.; Hall, M.A. Data Mining: Practical Machine Learning Tools and Techniques, 3rd ed.; Morgan Kaufmann: San Francisco, CA, USA, 2011; p. 191. [Google Scholar]
- Mason, D.C.; Speck, R.; Devereux, B.; Schumann, G.J.P.; Neal, J.C.; Bates, P.D. Flood detection in urban areas using TerraSAR-X. Geosci. Remote Sens. 2010, 48, 882–894. [Google Scholar] [CrossRef]
- Di Martino, G.; Iodice, A.; Riccio, D.; Ruello, G. A novel approach for disaster monitoring: Fractal models and tools. IEEE Trans. Geosci. Remote Sens. 2007, 45, 1559–1570. [Google Scholar] [CrossRef]
- Keiller, N.; Samuel, G.F.; Ícaro, C.D.; de Rafael, O.W.; Javier, A.V.M.; Otávio, A.B.P.; Rodrigo, T.C.; Lin, T.L.; dos Jefersson, A.S.; da Ricardo, S.T. Data-driven flood detection using neural networks. Available online: http://ceur-ws.org/Vol-1984/Mediaeval_2017_paper_39.pdf (accessed on 9 May 2019).
- Lopez-Fuentes, L.; van de Weijer, J.; Bolanos, M.; Skinnemoen, H. Multi-modal deep learning approach for flood detection. In Proceedings of the MediaEval 2017 Workshop, Dublin, Ireland, 13–15 September 2017. [Google Scholar]
- Federal Emergency Management Agency (FEMA), Headquarters: Washington D.C., US. Available online: https://www.fema.gov/data-visualization (accessed on 8 May 2019).
- National Climatic Data Center (NCDC NOAA), Asheville, North Carolina, US. Available online: https://www.ncdc.noaa.gov/stormevents/ftp.jsp (accessed on 8 May 2019).
- Hall, M.; Eibe, F.; Geoffrey, H.; Pfahringer, B.; Reutemman, P.; Witten, I.H. The WEKA data mining software: An update. SIGKDD Explor. 2009, 11, 10–18. [Google Scholar] [CrossRef]
- The MathWorks, Inc. MATLAB and Statistics Toolbox Release 2012b; The MathWorks, Inc.: Natick, MA, USA, 2012. [Google Scholar]
- Demsar, J.; Curk, T.; Erjavec, A.; Gorup, C.; Hocevar, T.; Milutinovic, M.; Mozina, M.; Polajnar, M.; Toplak, M.; Staric, A.; et al. Orange: Data mining toolbox in python. J. Mach. Learn. Res. 2014, 14, 2349–2353. [Google Scholar]
- Sammut, C.; Webb, G.I. Encyclopedia of Machine Learning and Data Mining; Springer: Boston, MA, USA, 2011. [Google Scholar]
- Harris, D.; Harris, S. Digital Design and Computer Architecture, 2nd ed.; Elsevier: San Francisco, CA, USA, 2010; p. 129. ISBN 978-0-12-394424-5. [Google Scholar]
Figure 1.
An overall causal loop of flood pathways. Green refers to normal conditions, amber refers to caution for a probability of flooding, and red refers to a very high risk or event of flooding.
Figure 1.
An overall causal loop of flood pathways. Green refers to normal conditions, amber refers to caution for a probability of flooding, and red refers to a very high risk or event of flooding.

Figure 2.
Work flow summarising the analytical steps followed. “Data” includes both data collation and extraction.
Figure 2.
Work flow summarising the analytical steps followed. “Data” includes both data collation and extraction.

Figure 3.
A sample of input data prepared for training.

Figure 4.
Visual distribution of flood types in training data.

Figure 5.
Visual overview of the model training and testing process in Orange.

Figure 6.
Evaluation Results for Random Forest model in Weka.

Figure 7.
Visual classifier error for Random Forest model in Weka. The crosses indicate correctly classified instances and squares refer to misclassified instances.
Figure 7.
Visual classifier error for Random Forest model in Weka. The crosses indicate correctly classified instances and squares refer to misclassified instances.

Figure 8.
Evaluation Results for Lazy model in Weka.

Figure 9.
Evaluation Results for J48 model in Weka.

Figure 10.
Evaluation Results for Neural Network model in Orange.

Figure 11.
Evaluation Results for Naïve Bayes model in Weka.

Figure 12.
Evaluation Results for Logistic Regression model in Orange.


Table 1.
Description of the attributes used to build models within the ML based framework to inform flood resilience and resistance actions (Source: NCDC-NOAA [21] and FEMA [20]).
| Attributes | Description |
| Begin Date | Year, Month, Day |
| End Date | Year, Month, Day |
| Month Name | Jan, Feb, March,… |
| State | CA, AZ, TX … |
| County/Zone Name | Utah, Leon, Beaver,… |
| Injuries Direct/Indirect | Number of direct/indirect injuries |
| Deaths Direct/Indirect | Number of direct/indirect deaths |
| Weather Forecast /Flood Cause | Heavy snow/Rain, Thunderstorm, Fog/Thunderstorm, hail… |
| Days Lasted | Total number of days event lasted |
| Begin/End Location | The location where the event started (Name) |
| Begin/End Lat/Long | Begin/End Latitude and Longitude |
| Property Damage | $ |
| Crop Damage | $ |
| Class | Description |
| Event type | Flash food, Lakeshore flood, … |
Table 2.
Summary of evaluation metrics of all classification models’ performance in Orange and Weka.
Table 2.
Summary of evaluation metrics of all classification models’ performance in Orange and Weka.
| Model | RMSE | MAE | % of correctly classified instances |
| Orange software | |||
| RF | 2.06 | 0.19 | 80.49 |
| NB | 2.52 | 0.24 | 76.22 |
| ANN | 2.45 | 0.23 | 77.44 |
| LR | 5.52 | 0.73 | 27.44 |
| Weka software | |||
| Model | RMSE | MAE | % of correctly classified instances |
| RF | 0.27 | 0.13 | 79.83 |
| NB | 0.29 | 0.17 | 73.69 |
| Lazy | 0.27 | 0.13 | 79.70 |
| J48 | 0.27 | 0.14 | 79.73 |
© 2019 by the authors. Licensee MDPI, Basel, Switzerland. This article is an open access article distributed under the terms and conditions of the Creative Commons Attribution (CC BY) license (http://creativecommons.org/licenses/by/4.0/).
Share and Cite
MDPI and ACS Style
Saravi, S.; Kalawsky, R.; Joannou, D.; Rivas Casado, M.; Fu, G.; Meng, F. Use of Artificial Intelligence to Improve Resilience and Preparedness Against Adverse Flood Events. Water 2019, 11, 973. https://doi.org/10.3390/w11050973
AMA Style
Saravi S, Kalawsky R, Joannou D, Rivas Casado M, Fu G, Meng F. Use of Artificial Intelligence to Improve Resilience and Preparedness Against Adverse Flood Events. Water. 2019; 11(5):973. https://doi.org/10.3390/w11050973
Chicago/Turabian StyleSaravi, Sara, Roy Kalawsky, Demetrios Joannou, Monica Rivas Casado, Guangtao Fu, and Fanlin Meng. 2019. "Use of Artificial Intelligence to Improve Resilience and Preparedness Against Adverse Flood Events" Water 11, no. 5: 973. https://doi.org/10.3390/w11050973
Note that from the first issue of 2016, this journal uses article numbers instead of page numbers. See further details here.