Article

Assessment of the Impact of Forestry and Settlement-Forest Use of the Catchments on the Parameters of Surface Water Quality: Case Studies for Chechło Reservoir Catchment, Southern Poland

1
Department of Land Reclamation and Environmental Development, University of Agriculture in Krakow, Mickiewicza 24–28 Street, 30-059 Krakow, Poland
2
Department of Sanitary Engineering and Water Management, University of Agriculture in Krakow, Mickiewicza 24-28 Street, 30-059 Krakow, Poland
*
Author to whom correspondence should be addressed.
Water 2019, 11(5), 964; https://doi.org/10.3390/w11050964
Submission received: 25 March 2019 / Revised: 3 May 2019 / Accepted: 6 May 2019 / Published: 8 May 2019
(This article belongs to the Special Issue Water and Nutrient Balance, Flow/Loading Dynamics in Forest System)

Abstract

:
The aim of the study was to determine the impact of natural and anthropogenic factors on the values of 22 quality indicators of surface waters flowing out of two small catchments differing in physiographic parameters and land use, in particular forest cover and urbanization of the area. The research was carried out in the years 2012–2014 at four measurement-control points located on the Chechło river and the Młoszówka stream (Poland), which are the main tributaries of the retention reservoir. Basic descriptive statistics, statistical tests, as well as cluster analysis and factor analysis were used to interpret the research results. The water that outflowed from the forestry-settlement catchment of the Młoszówka stream contained higher concentrations of total phosphorus, phosphates, nitrite, and nitrate nitrogen and salinity indicators than outflow from the Chechło river. Water from the Młoszówka stream was characterized by more favourable oxygen conditions. Higher oxygen concentration in the catchment influenced a large slope of the watercourse and thus higher water velocity, which is promoted by the mixed process. In the case of the forest catchment of the Chechło river, the water quality was generally better than in the Młoszówka stream, mainly in cases of total suspended solids TSS, total phosphorus TP, phosphates PO43−, total nitrogen TN, nitrite N–NO2, nitrate N–NO3, and salinity parameters. Despite it being a short section of the river taken into the study, favourable self-purification processes like mixed, nitrification, and denitrification were observed in its water. The research shows that forest areas have a positive effect on the balance of most substances dissolved in water, and natural factors in many cases shape the quality and utility values of surface waters on an equal footing with anthropogenic factors. In the case of a large number of examined parameters and complex processes occurring in water, the interpretation of the results makes it much easier by applying multivariate statistical methods.

1. Introduction

Anthropogenic activities most often have a negative impact on the environment, including the aquatic environment. As a result of these activities, changes in the relief and soil cover take place, land is drained or flooded, soil, forests, natural ecosystems, and surface and groundwater are degraded. All these changes, resulting from direct or indirect human influence on the environment, are called anthropogenic changes, and the actions causing them are called anthropogenic factors [1,2].
The content of chemical components in surface water depends on natural and anthropogenic factors. Substances of natural origin, the sources of which are rocks, uncultivated soils, humus substances, organic matter decomposition, and clean precipitation, form a natural quality of water. Anthropogenic substances most often cause water pollution, thus changing its original natural composition [3,4]. Due to the way they are discharged into water, they can be divided into area, spot, and linear anthropogenic substances [5].
Pollution means any adverse change in the physical, chemical, or biological properties of surface waters. Pollution occurs as a result of the introduction of substances into water in quantities exceeding the harmless or natural values possible to assimilate, which reduce the utility values and the ability of water to self-purify [6,7,8,9]. In rural areas, anthropogenic changes in surface water quality are related to plant and animal production [10,11]. In addition, there are pollutants from urbanized areas, which come from the discharge of untreated or insufficiently treated wastewater [12,13,14], from rainwater flushing of various substances from properties, impervious areas and waste dumps [15,16], and are the result of emission of pollutants to the atmosphere, returning in the form of precipitation on the surface of the catchment [11].
Heavy rainfall triggers water erosion, as a result of which significant amounts of various substances are transferred from the soil to surface waters [17], including nutrient elements [18]. The amount of constituents introduced into the surface waters with suspended solids depends on the intensity of erosion, which is strictly dependent on the type of soil and vegetation cover and the intensity of land use [19,20]. Grassland is much better protected against erosion than arable land, thus improving the hydrological conditions of the catchment and reducing water pollution [21,22,23]. Forest areas play an even better protective role than grassland ecosystems, as they retain significant amounts of water in litter and soil, thus significantly reducing surface runoff and preventing erosive leaching of matter [24]. For these reasons, the use and development of the catchment area is considered to have the greatest impact on surface water quality [21,25,26].
Deterioration of water quality is mainly influenced by settlement areas and arable land, while woodland areas usually show negative correlations with most surface water quality indicators [10,27]. Forest catchments with no aggressive forms of use or catchments with high forest cover and low share of agricultural and/or settlement areas are currently treated as objects with environmental conditions similar to natural ones. In most cases, they constitute a reference point for comparison for waters flowing out of catchments subjected to stronger anthropogenic activities resulting from agricultural uses of different intensities, or caused by a significant share of settlement areas, or even urbanized catchments [28,29].
The aim of this study is to assess the influence of land cover on the quality of surface waters outflow into the Chechło retention reservoir. This objective was attempted to be reached on the basis of comparative and statistical analysis of hydrochemical data from a three-year study carried out in two small river catchments, differing in physiographic parameters and land use. A research hypothesis was assumed that due to a smaller share of urban areas and greater forest cover of the catchment, the water of Chechło river is of much better quality than the Młoszówka stream.
Our research has an important cognitive and practical significance, as it concerns river catchments located in the region of Poland that has been subject to the influence of the mining industry for many centuries, which has led to a significant degradation of the environment. Forests in this area improve not only landscape values, but can also influence the shaping of surface water properties. This is important since the basic factor for the utility function of the Chechło retention reservoir, as well as for the proper functioning of aquatic and water-dependent ecosystems, is the good quality of water, which was evaluated on the basis of the analysis of physicochemical parameters of water.

2. Materials and Methods

2.1. Descprition of the Study Catchments

The study included surface waters outflows out of two catchments—the Młoszówka stream and the Chechło river, both of which discharge to Chechło retention reservoir (Figure 1). The reservoir was established in 1944–1945 mainly for water retention for industrial plants and fire-fighting purposes. In addition, it is used to equalize outflow in the Chechło river bed, reduces the effects of flooding in the valley below impounding level, and serves as a recreational area. With a normal level of impounding, the floodplain has an area of 38.50 ha and the amount of retained water reaches 587.5 thousand m3.
The catchment area of the Chechło reservoir is located (Latitude 50°8.29″ N, Longitude 19°30.24″ E) in the north-western part of the Małopolskie Voivodeship (Poland)—in the districts of Chrzanów and Krakow (Figure 1). Several important communication routes run parallel through the catchment area, such as the A4 motorway, national road No. 79 on the Krakow-Katowice route, and the railway line connecting the Krakow and Silesian agglomerations. According to the Kondracki’s [30] division of Poland into physio-geographical regions, the catchment area of the Chechło reservoir is located in province 34 (Polish Upland), in the south-eastern part of the Silesian-Krakow Upland—subprovince 341. In geological terms, the catchment of the Chechło reservoir belongs to the Silesian-Krakow monocline, which is a large plate gently inclined towards the northeast. In its geological structure there are Tertiary, Mesozoic, and Paleozoic formations. The southern part of the plate forming the ground is intersected with leaps running from NW to SE, between which the lowered rock strata form the Krzeszowicki rift fault and Dulowska Basin.
The Chechło river originates from ponds, wetlands, and peat bogs of the Dulowska Forest. It is a right-bank tributary of the Vistula River. About halfway along the Chechło river, i.e., at the 16 + 000 km, there is a front dam of the Chechło water reservoir. In abiotic terms, it is a type 6 watercourse, i.e., it belongs to the group of upland carbonate streams with fine-grained substrate on loess and loess-like soils [31]. The route of the upper running of Chechło river, from its sources to the reservoir, is not very winding and runs from the south-east to the north-west (Figure 1). From the reservoir to the intersection with the highway, the few-meters wide riverbed of the Chechło river was strongly transformed by man by straightening its route and securing the base of the slopes with a fascine fence and as a result of the construction of a damming structure which enables the supply of fish ponds with water. Clearly more watercourses drain the right-hand side of the catchment (Figure 1). The average levelled slope of the Chechło river is 0.5% and the density of the river network is 3.11 km⋅km−2 (Table 1). From the hydrological point of view and in terms of protection of quantitative and qualitative resources of the Chechło river, attention should be paid to the presence of marshy areas and small water reservoirs in its catchment area. The Młoszówka stream currently discharges to the water reservoir, but originally it was one of the largest right-bank tributaries of the Chechło river. The water in it flows in a bed that shows little winding; in the upper part it has been paved or protected with prefabricated openwork slabs and concrete walls, while in the lower part it is turfed and locally protected with fascine fences. In the catchment of the Młoszówka stream, the river network is much less developed than in the case of the Chechło river, as its density is only 1.97 km·km−2. Clearly more watercourses are located in the lower part of the catchment, while in the upper part there is only the Młoszówka stream with a rather long dry valley. The average levelled slope of the bottom of Młoszówka is 2.5 times greater than the Chechło river and amounts to 1.2% (Table 1, Figure 1).
The Chechło reservoir catchment at the site of the dam is 42.46 km2, of which 76% of the area belongs to the catchment of the Chechło river, 20% is the basin of the Młoszówka stream, and the remaining 4% of the area is the littoral (Figure 1). The Chechło river catchment covers an area of 32.32 km2 and has an average and maximum length of 8.67 and 9.04 km. The shape indicator values allow considering the catchment as firm, medium-elongated, and strongly close to the wheel. The catchment area of the Młoszówka stream equals 8.35 km2 and is almost four times smaller than the catchment area of the Chechło river. For these reasons, other geometrical parameters are also much smaller (Table 1). The value of the elongation index (0.41) indicates the lanceolate shape of the catchment, which may theoretically influence the extension of the runoff path and thus the smoother formation of freshets.
The catchments of both of the analyzed watercourses are upland in character, with the area of the Chechło river catchment being less sculpted, and the northern part of the Młoszówka stream catchment being the most sculpted (Figure 1). The highest point in the Chechło river catchment is located on the watershed in the northern part of the catchment—Kowalikowa Mountain of height 418.4 m above sea level. The height difference is 143.4 m above sea level, the weighted average altitude is 300.9 m above sea level and the weighted average slope is 3.5%. The highest and at the same time the northernmost point on the watershed of the Młoszówka stream catchment is a hill without a name (419.2 m above sea level), situated at the foot of Ostra Mountain. The height difference of this catchment is similar, while the average weighted height is 46.5 m above sea level higher, and the weighted average slope is more than twice as high, compared to the Chechło river catchment (Table 1, Figure 1).
The soils of the Chechło reservoir catchment area are characterized by great diversity, both typologically and in terms of species. There are mineral soils of temperate (brown, lessive, and limestone soils) and dry (e.g., podzolic soils) habitats; there are marshy soils as well as organic soils at different stages of moorshification. On more than half of the area of the Chechło river catchment, mainly under the Dulowska Forest (Figure 2), poorly drained clayey sands developed into podzolic soils. In the valleys of watercourses, there are constantly or periodically over-wetted soils. These are mineral formations with grain size of medium clays, from which gley soils and fen soils were formed, organic-mineral formations in the form of muck-mineral, mucky, and peat-muddy soils, as well as organic formations in the form of shallow low peats. These soils, irrespective of their origin, belong to the medium grassland complex. In the central-southern part of the catchment, there are also lessive soils, brown leached soils and brown specific soils, black degraded soils, grey soils, and limestone soils. Depending on the moisture content and terrain, these soils belong to the wheat faulty or rye very good and good arable land complexes or form weak and very weak grassland complexes. The catchment area of the Młoszówka stream is dominated by brown specific and brown leached soils, which were formed mainly from strong and light clayey sands or loess formations. In the northern and southern part of the catchment, under large and dense forest complexes (Figure 2), podzolic soils were formed from poorly drained clayey and light clayey sands. In the lower part of the Młoszówka stream catchment there are shallow low peats and muck-mineral and mucky soils. Organic formations form marshy forest habitats or middle class grassland.
Land use and development have a significant influence on the balance and hydrologic and biogeochemical cycling in the catchment area. In this respect, it can be stated that the Chechło river catchment is forest dominated, as forests and areas of afforestation occurring mostly in a concentrated form in the central and eastern part (Dulowska Forest) occupy almost 67% of the catchment area. The second largest form of land use is grassy ecosystem occupying about 15% of the catchment area. These are both natural and anthropogenic habitats, which in some places are periodically too dry or over-wetted. Arable land occupies only 8.5% of the catchment area, with the largest area thereof in the northern, south-western, and source south-eastern part of the catchment. The built-up areas occupy 6.3% of the catchment area and are located mainly in the vicinity of asphalt roads (Table 1, Figure 2).
The catchment of the Młoszówka stream is also dominated by forests, but the forest cover of over 40% is much smaller than that of the Chechło river catchment. The forest areas are partially scattered, with the largest share in the northern and southern part of the catchment area. Grass ecosystems and arable land covering 24.3 and 14.8% of the total area respectively, are situated mainly in the central and northern part of the catchment. The built-up areas, mostly in the middle part, cover 15.1% of the area and together with the areas under the paved roads form 17.6% of the sealed catchment area (Table 1, Figure 2). In terms of land use, the catchment area of the Młoszówka stream can be considered as a mixture of forestry and settlement areas.
Compared to the Młoszówka stream, the maximum flows likely in all variants in the Chechło river are about 3.8 times higher (Table 1). Moreover, on the basis of the calculated maximum flows with a probability of 1%, it was found that the corresponding unit outflows calculated for the Chechło river catchment and the Młoszówka stream are at a very similar level and amount to about 1.02 m3∙s−1∙km−2.

2.2. Sampling and Analytical Methods

Monthly water samplings were conducted in years 2012–2014 at four measurement and control points, for which the following coding was applied (Figure 1 and Figure 2): P1–A point located on the Młoszówka stream, 150 m above the mouth of the Chechło reservoir (km 0 + 150); P2–A point located on the Chechło river, 10 m above the mouth of the reservoir (km 17 + 710); P3–A point located on the Chechło river, 820 m above the mouth of the Chechło reservoir and 200 m below a small post-mining reservoir (km 18 + 520); P4–A point located on the Chechło river, 1750 m above the mouth of the reservoir and 50 m below a bridge on the A4 highway (km 19 + 450).
During the sampling for analysis, the following parameters were measured in situ: pH with the CP-104 pH meter and water temperature, dissolved oxygen concentration (DO) and water saturation (DOsat) using a CO-411 oxygen meter. Also, in situ measurements of velocity of flow were conducted using current meter type HeGa. The following parameters were determined in the laboratory: with the gravimetric method for total suspended solids (TSS) and dissolved substances (DS); ion concentration of calcium (Ca2+), magnesium (Mg2+), sodium (Na+), potassium (K+), and chlorophyll “a” (Chl a) were determined by absorption atomic spectrometry on UNICAM SOLAR 969 spectrometer; concentration of nitrogen in ammonium (N–NH4+), nitrite (N–NO2), and nitrate form (N–NO3) as well as total phosphorus, phosphates (PO43−), and chlorides (Cl) were determined using colorimetric method using the FIAstar 5000 apparatus; concentration of sulphates (SO42−) was determined using the precipitation gravimetric method; the five-day biochemical oxygen demand (BOD5) was determined using the Winkler titration method, and the chemical oxygen demand (CODCr) and organic nitrogen (Org–N) using the titration method. The total nitrogen (TN) concentration was calculated by summing up the results of N–NH4+, N–NO2, N–NO3, and Org–N concentrations. All analytical tests were carried out in three replicates using a certified equipment.

2.3. Data Analysis

2.3.1. Basic Data Analysis

For all the analyzed water quality indicators, measured separately at each gauging location, basic descriptive statistics were determined: minimum and maximum values (ranges), arithmetic mean values, and standard deviations. The coefficient of variation (CV) values were calculated from the ratio of standard deviation and mean value. On the basis of the CV, the assessment of variation of data in the data sets was made, with four classes of variation used: small variation (0–20%), medium variation (21–40%), large variation (41–60%), and very large variation (>60%). In order to test whether the values of surface water quality parameters examined at individual locations differ significantly, a statistical test was carried out. Since most of the compared empirical data groups were found to possess no normal distributions (W Shapiro-Wilk test) or homogeneity of variance (Brown-Forsythe test), non-parametric Mann-Whitney U test designed for independent samples was used assuming a significance level α = 0.05. Using the Vollenweider and Organisation for Economic Co-operation and Development OECD classification [32], the trophic condition of the examined waters was assessed.
A detailed analysis of physiographic characteristics of the researched catchments were performed with the use of GIS geoinformatics software tools and probable flows were calculated using regional formulas.

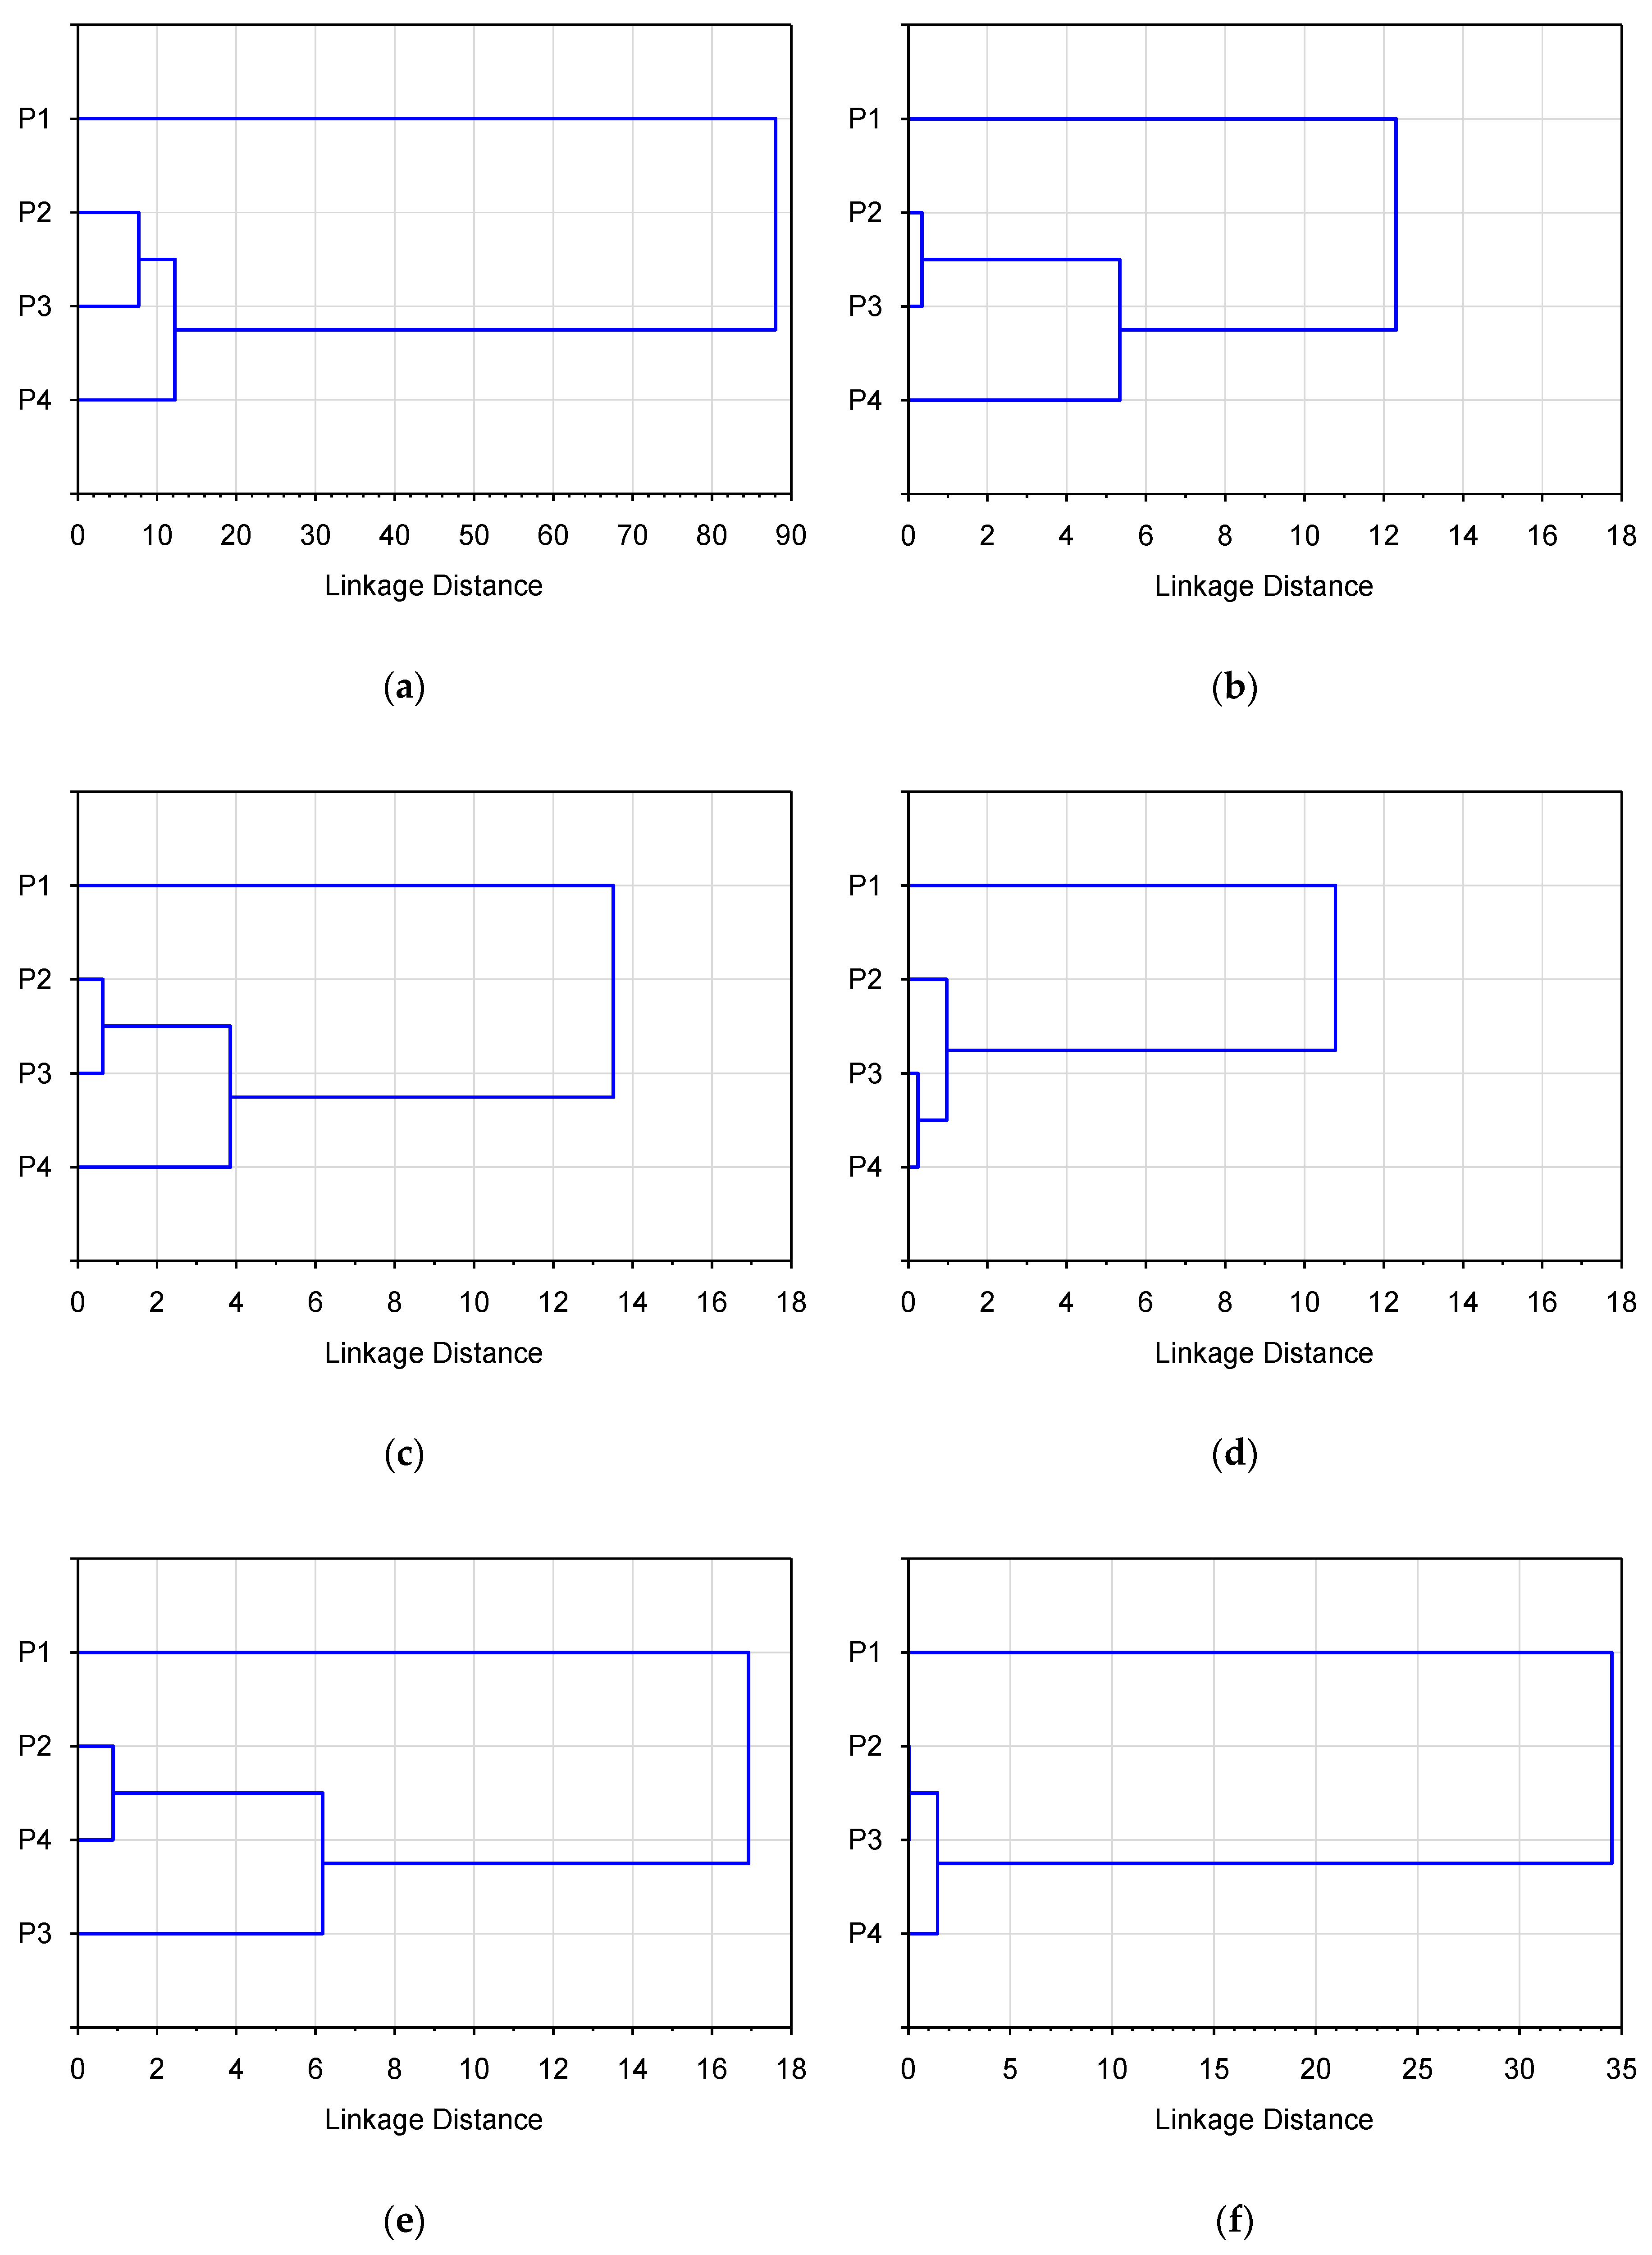
2.3.2. Cluster Analysis

With a large number of physicochemical indicators sampled in many locations, an accurate interpretation of water quality assessment results is quite difficult. In such a case, multivariate statistics can be used. One of the most frequently used is the hierarchical method of cluster analysis, in which single clusters are gradually combined by adding up smaller clusters into larger ones. The formation of clusters is a process in which the vectors of parameters are combined into cluster groups so that in each cluster the vectors are as similar as possible, and—in relation to other groups—as different as possible [33]. Cluster analysis was performed on empirical data standardized according to the following formula [34,35]:
Z i j   =   x i j x ¯ i s i
X ¯ i   =   j = 1 t X i j t
s i   =   j t ( x i j     x ¯ i ) 2 t     1
where: xij—value for the i-th object and j-th feature; x ¯ i - arithmetic mean relative to the i-th feature; si—standard deviation relative to the i-th feature.
A square Euclidean measure (metric) of the distance between the objects described by their respective features was used as a measure of similarity for calculations. This metric is often used to classify objects due to its convenient graphical interpretation and simple mathematical properties [36]. It is a geometric distance in a multivariate space, calculated on the basis of the formula:
distance   ( x ,   y )   =   i ( x i     y i ) 2
Euclidean distances were calculated on the basis of raw data and not standardized data. To estimate the distance between clusters, the Ward method [37] was used, which is based on the analysis of variance. This method seeks to minimize the sum of the squares of deviations of any two clusters that can be formed at each stage. This method is deemed as very effective, although it aims at creating small clusters. It is a commonly used technique for regionalization in hydrology, meteorology, and hydrochemistry [37,38].
Cluster analysis was performed for six variants and presented graphically in the form of dendrograms, for the following groups of indicators:
  • all examined physicochemical indicators (mentioned below),
  • physical and acidification indicators (temperature, TSS, pH),
  • oxygen indicators (DO, BOD5, CODCr),
  • phosphorus indicators (TP, PO43−),
  • nitrogen indicators (Org–N, N–NH4+, N–NO2, N–NO3),
  • salinity indicators (SO42−, Cl, Ca2+, Mg2+, Na+, K+).
As a result of the cluster analysis, a cluster hierarchy was obtained, which was presented in the form of dendrograms. The interpretation of the results obtained was based on diagrams of the trend of agglomeration of data, which, due to the limitation of volume, were not included in this study.

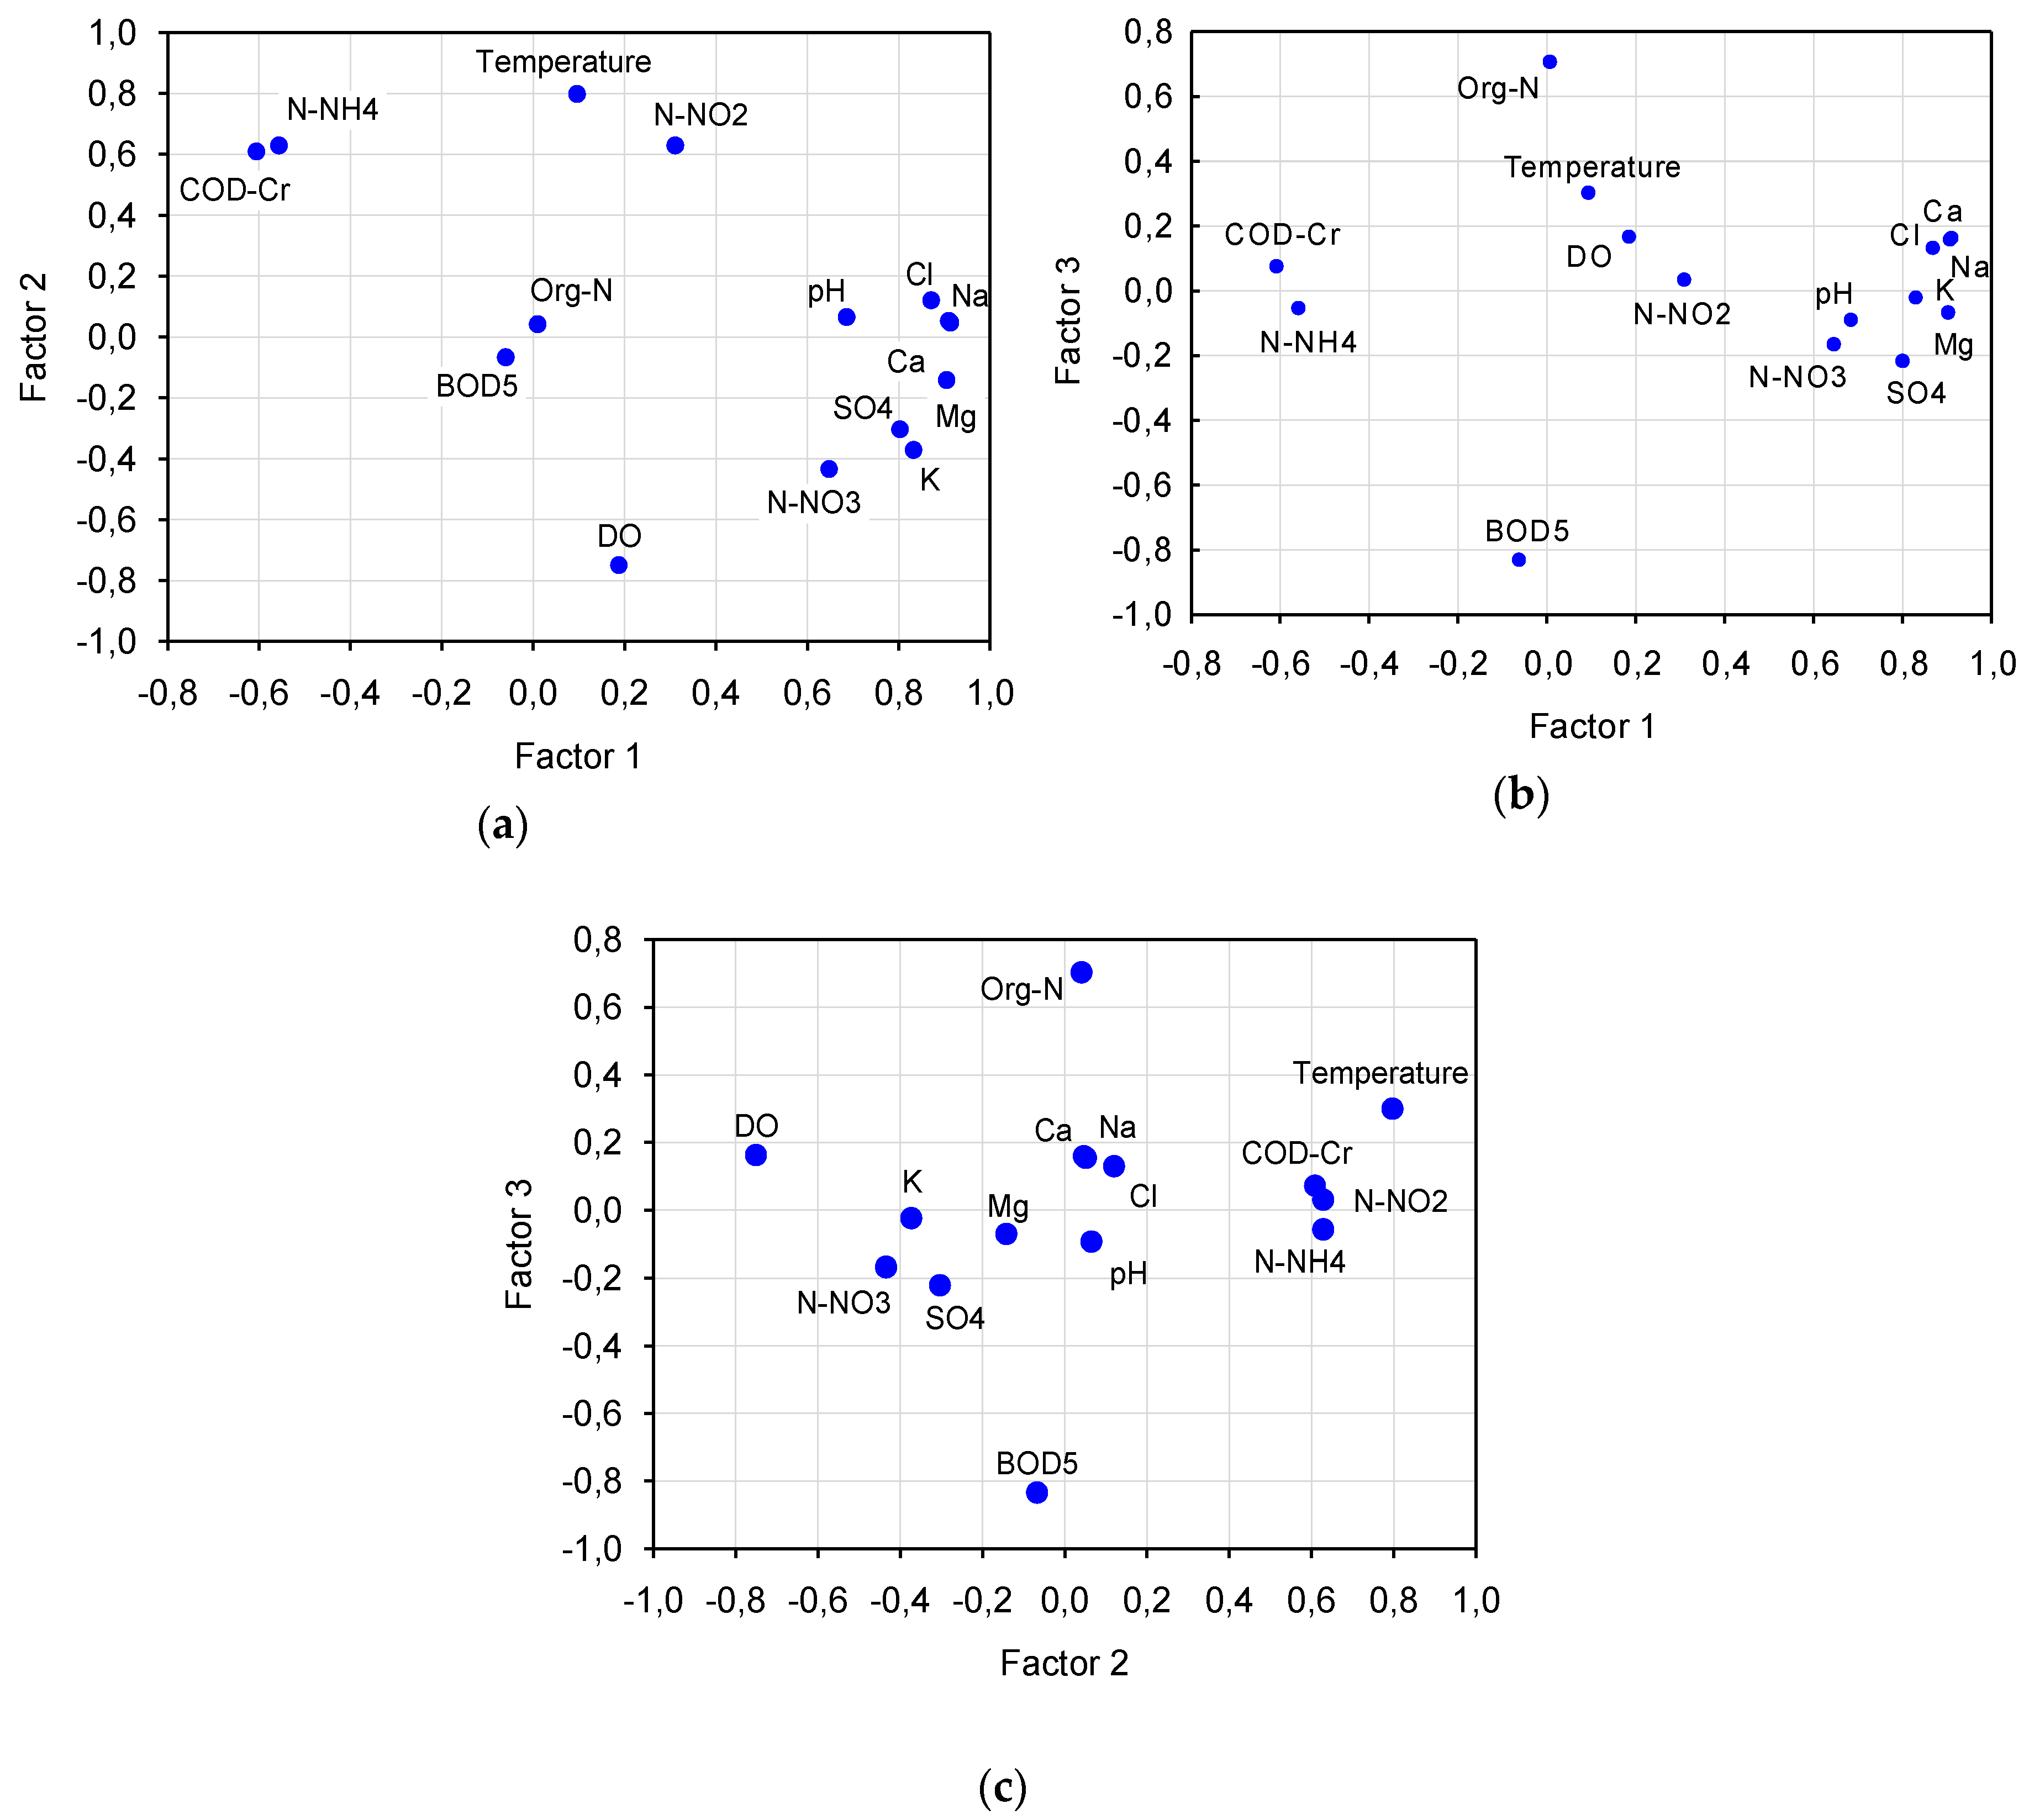
2.3.3. Factor Analysis

The purpose of factor analysis was, among others, to detect the structure and general regularities in relationships between the examined physicochemical parameters of water, to reduce the number of variables, and to describe and classify the examined variables in the separated spaces described by the new factors [35]. This analysis uses mathematical models in the form of a system of linear equations. In general, in factor analysis, variables are transformed in order to replace them by a smaller number of factors on which the tested variables are linearly dependent and can explain the correlations between them in the best possible way. Factor analysis attempts to explain the correlations between the observations in terms of the underlying factors, which are not directly observable [39]. The analysis was performed for the following water pollution parameters: water temperature, pH, dissolved oxygen, BOD5, CODCr, PO43−, TP, Org–N, N–NH4+, N–NO2, N–NO3, SO42−, Cl, Ca2+, Mg2+, Na+, and K+. Interdependent parameters, such as TSS, Osat, TN, and DS, were omitted. In the group of pollution parameters, physical, aerobic, biogenic, and mineral parameters influencing water salinity may be included. The question arises whether there are any connections and regularities between these parameters in the sampled water and whether it is possible to replace these parameters with new factors that will represent the quality of the sampled surface water.
In the first stage of the analysis, a correlation matrix between all the variables was performed, which allowed to draw preliminary conclusions as to the regularities occurring in the sample. Then, to assess the significance of the correlation matrix, Bartlett's sphericity test [40] was used to verify the null hypothesis that the correlation matrix is a unitary matrix (H0: R = I), all correlation coefficients of which are equal to zero. When assuming a null hypothesis, there is no point in performing factor analysis. However, the hypothesis can be tested using chi-square distribution statistics with p(p − 1)/2 degrees of freedom:
U   =   ( n   1   2 p   +   5 6 ) i   =   1 p l n λ i
where: p—number of variables; n—number of cases; λi—i-th eigenvalue.
In the present case, the value of U statistics was −233.113, which corresponded to a test probability below 0.0000001, meaning the assumption of a null hypothesis was rejected. Thus, it was confirmed that the analyzed correlation matrix is not a unitary matrix. In the next step, the eigenvalues informing about the hierarchy of significance of the respective factors in explaining the overall variance were determined. Based on the recommendations given by Pekey et al. [40], only those factors whose eigenvalues exceeded 1 were selected for further analysis. For a selected number of new factors (variables), factor loadings, interpreted as correlation coefficients of the individual parameters, and their corresponding new factors (variables) were calculated. Also a communality expressed as part of the variance of the variable explained by common factors was calculated. The results of the calculations are presented in graphical form, taking into account the process of rotation of the coordinate system made using the Varimax method [41].

3. Results and Discussion

The catchment areas of the Chechło river and the Młoszówka stream are characterized by high retention capacities. This is mainly due to the relatively small land gradient, the dominant northern exposure of the slopes which caused lower evaporation losses and, above all, the dominated forest land cover of the area. Taking into account the last factor, it can be concluded that both catchments have high retention capacity, as they are dominated by forests with areas of afforestation with 66.7% and 40.2% of the respective catchment area, respectively. Such a large share of forest area and their mostly concentrated distribution in the Chechło river catchment (Dulowska Forest) will, by retaining a significant amount of water, influence the levelling of outflow [42,43] and the circulation of mineral and organic components. However, it should be taken into account that in the case of long-term rain-free periods and high air temperatures, such a high forest cover may reduce groundwater resources through an increase in evapotranspiration [44]. This, in turn, may cause the occurrence of deepened and long-lasting low groundwater levels which, by transforming over time into hydrological droughts, may threaten the proper functioning of the Chechło water reservoir. From the point of view of quantitative and qualitative resources, attention should be paid to a few percent of wetlands, which may mitigate the effects of climate change [45] and reduce the amount of nutrients and sediments washed out of the catchment [46]. On the other hand, arable land located mainly in the upper part of the Młoszówka stream catchment, with relatively large slopes of the land, may contribute to the formation of erosion processes and influence the increased leaching of substances from the soils.
Assessing the impact of anthropogenic activities on hydrological regime and habitat condition, the Chechło river catchment can be considered as not at risk, as the share of urbanized areas does not exceed 10% of the catchment area [47]. Thus, the hydrological regime and geomorphological and habitat conditions may be similar to natural catchments. The Młoszówka catchment, on the other hand, can be considered at risk (with 17.6% of the impervious areas), with clear signs of degradation caused by anthropogenic activities, such as larger and more frequent runoffs changing the geometry of watercourses, unstable banks of watercourses, and deterioration of habitat quality. The catchment is also much more likely to undergo rapid freshets and deepened low waters. Unfortunately, the presence of forest areas in it is not very beneficial from the point of view of the retention role, as these areas are scattered and their largest share occurs in the lower part of the catchment area. This situation may potentially result in the largest runoffs, which occur in the headwaters of the catchment, not being sufficiently slowed down by vegetation [48]. This, in turn, can lead to larger and more violent freshets in the lower part of the catchment. The distribution of grasslands in the central part of the catchment should slightly alleviate the unfavourable conditions for the formation of freshets. In the case of the Chechło river catchment, the greatest potential for the formation of significant surface runoffs is in the northern part of the catchment. The shape of the catchment also plays a significant role in the formation of the outflow. The value of the elongation index at the level of 0.71 indicates that the shape of the Chechło river catchment is similar to a circle, which may theoretically influence the more rapid formation of freshets. In the case of the catchment of the Młoszówka stream, on the other hand, the value of the elongation factor of 0.41 proves its lanceolate shape. Theoretically, this may have an effect on the extension of the water run-off route and thus on the alleviation of freshets. However, with this catchment, a somewhat faster reaction to rainfall compared to the catchment of the Chechło river is possible. This is due to the fact that the average slope of the Młoszówka catchment area is more than twice as high, and its area and forest cover are smaller. Undoubtedly, this is also influenced by the greater share of impervious areas in the catchment of the Młoszówka stream, which results in a faster surface runoff and a more rapid outflow of water from the catchment.
Understanding the sources of supply, concentration, and circulation of matter components is essential for the assessment of pollution loads that can lead to deterioration of water quality [49]. Therefore, a detailed analysis of changes in the values of physicochemical indicators of waters outflow of the two catchments differing in physiographic parameters, including land use, was undertaken. Table 2 presents basic descriptive statistics of the examined water quality parameters, and Table 3 presents the results of statistical test carried out with the use of Mann-Whitney U test.
The sampled water in the Chechło river was warmer than in the Młoszówka stream, as shown in Table 2. The largest amount of TSS flowed out of the catchment of the Młoszówka stream, and the smallest amount thereof in the waters of the Chechło river (Table 2). The reason for this are likely to be higher slopes, lower forest cover, and higher share of soils more susceptible to erosion in the catchment of the Młoszówka stream. Similar observations were noted by Halecki et al. [18], based on research conducted in small Carpathian catchments.
Due to the enrichment of water with alkaline substances, the pH values increased systematically along the length of the examined section of Chechło river. Throughout the research period, the reaction of river waters varied from slightly acidic to slightly alkaline. A similar reaction was also found in the water of the Młoszówka stream; however, in this case, the pH values were significantly higher on α = 0.05 (Table 2 and Table 3), at some dates indicating it as strongly alkaline. This state of affairs was definitely influenced by the humus substances contained in the water that are washed away from poor and acidic forest soils located in the bed of the Chechło river catchment. Similar relationships were described in the studies of Muwamba et al. [50] in the catchment WS79, at Santee Experimental Forest in coastal South Carolina in the US.
The most favourable oxygen conditions prevailed in the Młoszówka stream; DO and DOsat (Table 2 and Table 3), whose average slope of the riverbed bottom is over twice as high as in the Chechło river, which results in a higher speed of flowing water and intensity of aeration. The biggest problem with the quality of the Chechło river waters are the organic substances contained in them, which were determined on the basis of the values of indicators indirectly informing about the level of organic pollution–BOD5 and CODCr. The basic source of organic substances is the Dulowska Forest with its organic soils, swamps, and a large amount of decomposing plant matter. It can, therefore, be concluded that in the case of the waters of the river investigated here we are dealing with a natural source of pollution by organic substances, which contain mainly humus substances, as indicated by the brown color of the water. Analyzing the values of the four oxygen parameters and organic pollution at the individual measuring-control points, it was observed that the higher the values of BOD5 and CODCr, the lower the concentrations and saturation of water with dissolved oxygen—and vice versa. Such relationships between these parameters are related to oxygen consumption in the processes of biochemical and chemical mineralization of organic substances contained in water, as confirmed by studies by Singh et al. [51] and Sotomayor et al. [52].
Forest vegetation can function as a natural filter against pollutants dumped in watersheds; hence, vegetation cover, diversity, and structure are key drivers of water quality [53,54]. Taking into account the above, the concentrations of all analyzed nutrients were generally at a medium level, while at some study dates only trace values of phosphates and nitrite nitrogen were recorded in the water of the main tributaries of the Chechło reservoir. The highest concentrations of phosphates, which usually occurred at a relatively low level either way, were found in the outflow from the catchment of the Młoszówka stream. Also in the waters of the same watercourse the highest concentrations of TP were recorded, with the difference, however, that their concentrations were quite visible, but did not differ significantly between the examined watercourses for α = 0.05 (Table 2 and Table 3). The reason for the higher content of these two biogenic parameters of pollution in the water of the Młoszówka stream should be sought in the high urbanization of the central part of its catchment and the presence of arable land. Zhao et al. [55] and Wan et al. [56] state that the settlement and agricultural land use is positively correlated with the content of nutrients in waters, in particular with phosphorus compounds. Undoubtedly, the water quality of the Chechło river is influenced by the buffer role of woodland source areas of the catchment in minimizing phosphorus pollution [57].
The waters outflow from the Młoszówka stream catchment contained significantly higher concentrations of N–NO2 and N–NO3 and lower values of N–NH4+ in comparison to the values recorded at the other measurement locations. Poorly visible decreasing tendency of concentration of most nitrogen indicators indicates slow self-purification processes of water along the Chechło river (Table 2 and Table 3). The slow rate of this process is evidenced by the low nitrate nitrogen content, which appears as a result of nitrification of organic forms of nitrogen. The situation is different in the case of the waters of the Młoszówka stream, in which higher concentrations of N–NO2 and lower concentrations of N–NH4+ were found. This indicates temporal and spatial distribution of pollution of the Miłoszówka stream waters, in which the self-purification process resulted in a significant increase in the concentration of N–NO3 at the expense of a decrease in the content of N–NH4+ (Table 2 and Table 3). The higher intensity of these favourable processes taking place in Młoszówka is related to the large amount of oxygen dissolved in water, which was also confirmed by the studies of Kowalik et al. [29], and to the reservoir located in the lower part of the catchment, which is heavily overgrown with wetland vegetation and acts as a wetland sewage treatment plant.
The most saline water flowed out of the Młoszówka stream catchment, as the values of all salinity indicators (DS, SO42−, Cl, Ca2+, Mg2+, Na+ and K+) were statistically significantly for α = 0.05, higher than in the Chechło river (Table 2 and Table 3). For these reasons, the water flowing through Młoszówka was mostly medium-hard, while the water in the Chechło river was soft. This fact mainly stems from land use and build-up of the area, i.e., greater urbanization of the catchment of the Młoszówka stream, much greater forest cover of the Chechło river catchment and quite significant differences in soil types occurring in both catchments. This is consistent with the studies described by Zhang et al. [58], in which it was found that the greatest impact on the deterioration of water quality in watercourses are in urban areas, followed by arable land, while grassland ecosystems and forest areas usually have a beneficial effect on water chemistry. Similar observations were presented in the works of Kosmowska et al. [59], De Mello et al. [60,61], Namugize et al. [62], and Wijesiri et al. [63]. For these reasons, we can speculate on greater anthropogenic activities in the Młoszówka catchment, the central part of which is heavily built-up and the concrete and paved bed of the stream runs in many places parallel to asphalt roads. In addition, above the main road between Trzebinia and Krakow there are several interceptors that drain rainwater directly running off asphalt surfaces into the Młoszówka stream, which undoubtedly results in higher salinity and, consequently, in a deterioration of water quality.
Differentiation of the measured pH values during the study period was small at all water sampling locations, which is confirmed by the coefficient of variation values within the range of 4–5%, as shown in Table 2. Low or average random variation occurred for DO, DOsat, and TP, as well as for most salinity indicators. Large differences in empirical data were recorded for temperature, CODCr and N–NH4+, and very large for the other water quality parameters. In general, the physicochemical parameters of water flowing out of the Młoszówka stream were characterized by lower random variation compared to the outflow from the Chechło river catchment (Table 2).
On the basis of hydrological measurements mean velocity between the profiles P4 and P2 was equal to 0.39 m∙s−1 and distance between profiles was equal 1740 m. Thus the approximated travel time is about 1.23 h. For the reason that water samples were collected from the Chechło river in a few-minute interval, in the order of point P4, P3, and P2, it can be concluded that the quality parameters were measured in the same water. The description of the test results presented in Table 2 are based on average values, but the relationships related to the decrease in the length of the Chechło river were also recorded in each field measurement dates. In a distance of 1740 m of the Chechło river the values of organic pollution indicators decreased: in the case of BOD5 by 11%, and CODCr by 33% of the initial value recorded in point P4. The concentration of TN and Org–N slightly increased on the tested section of the river, but this state was probably affected by biodegradation of organic compounds occurring in the self-purification process, as a result of which nitrogen-containing compounds are also formed.
There are only a few small tributaries on the examined part of the Chechło river, in which water flows periodically. Therefore, it can be concluded slightly diluting effect on the decline in the value of some pollution indicators (dilution is also an element of the water self-purification process). On the other hand, the rapid flow of water in the river causing its oxygenation increases and oxygen is used in the process of biodegradation of organic substances, and thus affects the water self-purification.
According to the trophicity criteria proposed by Vollenweider [32], average TP concentrations at all measurement gauging locations allowed the water to be classified as hypertrophic, and—due to mineral nitrogen content—as mesotrophic waters. The assessment based on TP concentrations carried out in accordance with OECD criteria [32] confirmed that the sampled waters are hypertrophic. Chlorophyll “a” concentrations indicate mesotrophy of waters flowing out of the catchments of Chechło river and the Młoszówka stream.
On the basis of the cluster analysis carried out with the Ward method for a total of 18 physicochemical parameters and separately for physical parameters and acidification, aerobic, phosphorus, nitrogen, and salinity parameters, six dendrograms were obtained showing similarity or differences in the quality of the water tested at individual measurement and gauging locations (Figure 3).
Taking into account all the examined indicators, the similarity of water quality between the locations was less noticeable than in the other analyzed variants, because the whole data aggregation process ended at an intra-cluster distance of 89, and at a distance of 12 two clusters developed (Figure 3a): the first consisting of three points located on the Chechło river (P2–P4) and the second comprising only point P1 located at the mouth of the Młoszówka stream into the water reservoir. This proves that there are large differences in the quality of water flowing in both of the sampled watercourses. In order to analyze the data in detail, a cluster analysis was carried out separately for each group of the examined physicochemical indicators.
The arrangement of clusters in the dendrogram for physical parameters and acidification (temperature, TSS and pH) indicates a very high similarity in the water quality of the Chechło river in points 2 and 3. Smaller values of the three analyzed parameters of water flowing out of the Dulowska Forest resulted in the formation of a single cluster in point P4. One-element cluster also occurred in the case of point P1 located on the Młoszówka stream, which was influenced by the highest values of all analyzed physical parameters and acidification (Figure 3b).
In the case of oxygen parameters (O2, BOD5, CODCr) at the level 2 cut-off point, three clusters were formed, including two single clusters at points P1 and P4, and one double cluster consisting of points P2 and P3 (Figure 3c). This arrangement of clusters was influenced by the highest concentrations of dissolved oxygen and the lowest CODCr values in the water of the Młoszówka stream. On the other hand, the formation of a separate cluster in point P4 is related to the self-purification processes in the Chechło river water, which led to the decomposition of organic substances and contributed to the reduction of BOD5 and CODCr values at the measurement and control points along the river—P3 and P2.
Two clusters (cut-off level 2), including one three-element cluster consisting of P2–P4 points located on the Chechło river and one-element cluster on the Młoszówka stream (Figure 3d), were formed on the dendrogram made for phosphorus indicators (TP and PO43−). Such arrangement of data aggregation is mainly caused by much higher phosphate concentrations in point P1, which is undoubtedly influenced by a large share of built-up areas in the catchment of the Młoszówka stream.
In the case of nitrogen indicators (Org–N, N–NH4+, N–NO2 and N–NO3), at the level 2 cut-off point, three clusters were formed, including two single clusters at points P1 and P3, and one double cluster consisting of points P2 and P4 (Figure 3e). This cluster arrangement resulted from the highest concentrations of N–NO2 and N–NO3 and the lowest concentrations of N–NH4+ recorded in the water of the Młoszówka stream. The separate cluster on the Chechło river at point P3 results from lower concentrations of Org–N and higher values of N–NO3, which is the result of the decomposition of organic substances in the small post-mining reservoir located upstream the measurement and control point.
The dendrogram generated on the basis of concentrations of SO42−, Cl, Ca2+, Mg2+, Na+, and K+ ions shows that the water flowing out of the Młoszówka stream catchment is much more saline than the water flowing down the Chechło river (Figure 3f). Such a cluster system is characteristic for river catchments with significantly different anthropogenic pressure, which is the case with the two tributaries of the Chechło reservoir under examination.
From the presented correlation matrix (Table 4) it is evident that there is a group of interrelated variables. It can be seen that the pH is strongly positively correlated with all salinity ions and PO43− and negatively correlated with the chemical oxygen demand (CODCr). Dissolved oxygen (DO) concentrations are strongly negatively correlated with CODCr, N–NH4+ and water temperature. CODCr values correlate strongly positively with N–NH4+ and negatively with N–NO3 as well as all salinity ions. Phosphates correlate strongly positively with Cl and Mg2+ ions, while N–NH4+ concentrations with all salinity ions and negatively with N–NO3. Nitrate nitrogen is strongly positively correlated with saline ions, which are also correlated with each other. No strong correlation was found for BOD5, Org–N, and N–NO2.
Based on the analysis of eigenvalues, four factors were identified which together explain almost 71% of the total variation of the analyzed water quality indicators. The highest variation of parameters observed in the analyzed sample is explained by the first factor −45% of variation. Another three factors explained over 32% of the variation. In subsequent analyses, the variables were further reduced and eventually three factors were adopted, for which the minimum value is 1.31 and which explain 71% of the total variation (Table 5).
On the basis of a detailed analysis of the results presented in Table 5, it can be concluded that concentrations of SO42−, Cl, Ca2+, Mg2+, Na+, and K+ have high factor loadings with the first factor, water temperature and DO with the second factor, and BOD5 and Org–N with the third factor. Three new variables can therefore be created, which will represent water salinity (factor 1), oxygen conditions (factor 2) and water pollution by organic substances (factor 3). Factors selected in this way determine to the greatest extent the quality of water flowing into the Chechło reservoir. The conducted factor analysis largely coincides with the results obtained from the cluster analysis in which it was shown that well oxygenated waters with high salinity (mineralization) flow through the Młoszówka stream, and the waters of the Chechło river contain significant amounts of organic substances.
A graphical summary of factor loadings for the analyzed water quality indicators is presented in Figure 4. Figure 4a shows that the highest factor loadings for Factor 1 occur in the case of mineral compounds. For Factor 2 a large share was found in case of water temperature, DO N–NH4+, N–NO2, and CODCr.
All these parameters represent aerobic conditions or are associated with the conversion of pollutants under aerobic conditions (N–NH4+ and N–NO2). The opposite position of temperature and DO indicates their inversely proportional relationship. In the case of factor 3 we can observe a large share of Org–N and BOD5 factor loadings (Figure 4a,b). This can be explained by the fact that BOD5 is a parameter specifying the amount of oxygen needed for the decomposition of readily decomposable organic compounds contained in water, which is closely related to the mineralization process. Since organic nitrogen compounds decompose relatively slowly, they generally do not cause an increase in BOD5 in the initial period.

4. Conclusions

The interactions between different forms of land use and water quality are difficult to estimate due to the huge number of parameters and complexity of the processes occurring in the catchment and streamwater [64,65]. In addition to these factors, there are physiographic parameters of the catchment that can positively or negatively influence the properties of surface water. These hypotheses are confirmed by the results of our research. Water outflow from the forest and settlement mixed catchment, which is characterized by higher land slopes and a high share of mineral soils, contained higher concentrations of phosphorus, phosphates, nitrite, and nitrate nitrogen as well as salinity indicators compared to the nearby forest catchment. In spite of a larger share of urbanized areas and roads, the water was characterized by more favourable oxygen conditions, which was a result of a large gradient of the bottom of the investigated watercourse and a smaller amount of organic substances subject to the process of decomposition. In terms of land cover, generally better water quality was found in the forest catchment, which confirmed the assumed research hypothesis about the beneficial effect of this type of land use on surface water quality. It should be noted, however, that water outflow from this catchment is also polluted, but, in this case, with organic substances of natural origin, i.e., from organic soils and from the decomposition of plant matter occurring in the Dulowska Forest. Despite the short section of the river under study, beneficial self-purification processes were observed in the water. The research shows that forest areas have a positive effect on the balance of most substances dissolved in water, and natural factors, in many cases, shape the quality and utility values of surface waters on an equal footing with anthropogenic factors.
The results of this study also allowed to state that in case of a large number of examined physicochemical parameters of water, the interpretation of the results for their relationships and interactions is rather difficult, justifying the use of multivariate statistical methods. Cluster analysis allows, among others, for objective determination of similarities of the examined groups of water parameters between the individual measurement and control points, while factor analysis allows to reduce the number of variables to those actually having greatest impact on the quality of surface waters [66,67].

Author Contributions

Conceptualization, A.B. and T.K.; Methodology, A.B. and T.K.; Data curation, A.B., T.K. and A.W.; Formal analysis, A.B., A.W. and A.C.; Visualization, A.B. and A.W.; Writing—original draft preparation, A.B., A.C. and A.W.; Writing—review and editing, A.B., A.W. and T.K.

Funding

This research was co-funded by CITY HALL IN TRZEBINIA.

Acknowledgments

The authors would like to thank Dean of the Faculty of Environmental Engineering and Land Surveying, University of Agriculture in Krakow, for financial support. We thank the anonymous reviewers for their constructive comments which helped to substantially improve the manuscript.

Conflicts of Interest

The authors declare no conflict of interest.

References

  1. Wardas, M.; Aleksander-Kwaterczak, U.; Jusik, S.; Hryc, B.; Zgoła, T.; Sztuka, M.; Kaczmarska, M.; Mazurek, M. An attempt to assess the impast of anthropopressure on the ecological state of urbanized watercourses of Krakow conurbation and the difficulties encountered. J. Elementol. 2010, 15, 725–743. [Google Scholar] [CrossRef]
  2. Bogdał, A.; Kowalik, T.; Ostrowski, K.; Skowron, P. Seasonal variability of physicochemical parameters of water quality on length of Uszwica river. J. Ecol. Eng. 2016, 17, 161–170. [Google Scholar] [CrossRef]
  3. Bulut, V.N.; Bayram, A.; Gundogdu, A.; Soylak, M.; Tufekci, M. Assessment of water quality parameters in the stream Galyan, Trabzon, Turkey. Environ. Monit. Assess. 2010, 165, 1–13. [Google Scholar] [CrossRef] [PubMed]
  4. Kanownik, W.; Kowalik, T.; Bogdał, A.; Ostrowski, K. Quality Categories of Stream Water Included in a Small Retention Program. Pol. J. Environ. Stud. 2013, 22, 159–165. [Google Scholar]
  5. Kiryluk, A.; Leszczyński, J.; Łukowski, A.; Miłaszewski, R.; Piekutin, J.; SIemieniuk, A.; Skorbiłowicz, E.; Skorbiłowicz, M.; Szczykowska, J.; Wiater, J.; et al. Źródła zanieczyszczeń wód powierzchniowych i wybrane metody ich oczyszczania. Budownictwo i Inżynieria Środowiska 2014, 5, 49–57. (In Polish) [Google Scholar]
  6. Liu, X.; Li, G.; Liu, Z.; Guo, W.; Gao, N. Water pollution characteristics and assessment of lower reaches in Haihe River basin. Procedia Environ. Sci. 2010, 2, 199–206. [Google Scholar] [CrossRef]
  7. Al-Shami, S.A.; Rawi, C.S.M.; Ahmad, A.H.; Hamid, S.A.; Nor, S.A.M. Influence of agricultural, industrial, and anthropogenic stresses on the distribution and diversity of macro invertebrates in Juru River basin, Penang, Malaysia. Ecotoxicol. Environ. Saf. 2011, 74, 1195–1202. [Google Scholar] [CrossRef]
  8. Policht-Latawiec, A.; Kapica, A. Influence of Hard Coal Mine on Water Quality in the Vistula River. Annu. Set Environ. Prot. Rocznik Ochrona Środowiska 2013, 15, 2640–2651. (In Polish) [Google Scholar]
  9. Mrozińska, N.; Glińska-Lewczuk, K.; Burandt, P.; Kobus, S.; Gotkiewicz, W.; Szymańska, M.; Bąkowska, M.; Obolewski, K. Water Quality as an Indicator of Stream Restoration Effects—A Case Study of the Kwacza River Restoration Project. Water 2018, 10, 1249. [Google Scholar] [CrossRef]
  10. Bahar, M.M.; Ohmori, H.; Yamamuro, M. Relationship between river water quality and land use in a small river basin running through the urbanizing area of Central Japan. Limnology 2008, 9, 19–26. [Google Scholar] [CrossRef]
  11. Bogdał, A.; Ostrowski, K. Loads of selected components supplied with precipitation and flowing away from the area of two small catchments with diversified use. Acta Sci. Pol. Formatio Circumiectus 2009, 8, 35–45. [Google Scholar]
  12. Lai, Y.C.; Tu, Y.T.; Yang, C.P.; Surampalli, R.Y.; Kao, C.M. Development of a water quality modeling system for river pollution index and suspended solid loading evaluation. J. Hydrol. 2013, 478, 89–101. [Google Scholar] [CrossRef]
  13. Hutchins, M.G. What impact might mitigation of diffuse nitrate pollution have on river water quality in a rural catchment? J. Environ. Manag. 2012, 109, 19–26. [Google Scholar] [CrossRef] [PubMed] [Green Version]
  14. Mouri, G.; Shinoda, S.; Oki, T. Assessing environmental improvement options from a water quality perspective for an urbane rural catchment. Environ. Model. Softw. 2012, 32, 16–26. [Google Scholar] [CrossRef]
  15. Bakarat, A.; El Baghdadi, M.; Meddah, R.; Rais, J.; Nadem, S.; Afdali, M. Evaluation of water quality in open channels flowing through Beni-Mellal City (Morocco). J. Water Land Dev. 2013, 19, 3–11. [Google Scholar] [CrossRef]
  16. Kowalik, T.; Bogdał, A.; Borek, Ł.; Kogut, A. The effect of treated sewage outflow from a modernized sewage treatment plant on water quality on the Breń river. J. Ecol. Eng. 2015, 16, 96–102. [Google Scholar] [CrossRef]
  17. Sakinatu, I.; Muhammad, A.A. Impact of soil erosion and degradation on water quality: A review. Geol. Ecol. Landsc. 2017, 1, 1–11. [Google Scholar] [CrossRef]
  18. Halecki, W.; Kruk, E.; Ryczek, M. Estimations of nitrate nitrogen, total phosphorus flux and suspended sediment concentration (SSC) as indicators of surface-erosion processes using an ANN (Artificial Neural Network) based on geomorphological parameters in mountainous catchments. Ecol. Indic. 2018, 91, 461–469. [Google Scholar] [CrossRef]
  19. Miller, J.D.; Schoonover, J.E.; Williard, K.W.J.; Hwang, C.R. Whole catchment land cover effects on water quality in the Lower Kaskaskia River Watershed. Water Air Soil Pollut. 2011, 221, 337–350. [Google Scholar] [CrossRef]
  20. Tu, J. Spatially varying relationships between land use and water quality across an urbanization gradient explored by geographically weighted regression. Appl. Geogr. 2011, 31, 376–392. [Google Scholar] [CrossRef]
  21. Kowalik, T.; Kanownik, W.; Bogdał, A.; Policht-Latawiec, A. Wpływ zmian użytkowania zlewni wyżynnej na kształtowanie jakości wody powierzchniowej. Rocznik Ochrona Środowiska 2014, 16, 223–238. (In Polish) [Google Scholar]
  22. Misztal, A.; Kuczera, M. Impact of land use method in a catchments area on the dynamics of the nitrogen compounds in the outflowing water. Ecol. Chem. Eng. 2010, 17, 642–649. [Google Scholar]
  23. Kanownik, W.; Kowalik, T. Variability of Water Resources Flowing Away from Small Agricultural Catchment. Pol. J. Environ. Stud. 2010, 19, 65–71. [Google Scholar]
  24. Kopacz, M.; Twardy, S. Zmiany użytkowania ziemi z zlewni Górnego Dunajca w aspekcie wybranych parametrów jakościowych wód powierzchniowych. Woda-Środowisko-Obszary Wiejskie 2006, 6, 191–202. (In Polish) [Google Scholar]
  25. Gülbaz, S.; Kazezyilmaz-Alhan, C.M. Impact of land use/cover changes on water quality and quantity in a calibrated hydrodynamic model. In Proceedings of the 10th International Congress on Advances in Civil Engineering, Middle East Technical University, Ankara, Turkey, 17–19 October 2012. [Google Scholar]
  26. Bogdał, A.; Kowalik, T. Variability of values of physicochemical water quality indices along the length of the Iwoniczanka stream. J. Ecol. Eng. 2015, 16, 168–175. [Google Scholar] [CrossRef]
  27. Zhou, T.; Wu, J.; Peng, S. Assessing the effects of landscape pattern on river water quality at multiple scales: A case study of the Dongjiang River watershed, China. Ecol. Indic. 2012, 23, 166–170. [Google Scholar] [CrossRef]
  28. Kändler, M.; Blechinger, K.; Seidler, C.; Pavlů, V.; Šanda, M.; Dostál, T.; Krása, J.; Vitvar, T.; Štich, M. Impact of land use on water quality in the upper Nisa catchment in the Czech Republic and in Germany. Sci. Total Environ. 2017, 586, 1316–1325. [Google Scholar] [CrossRef]
  29. Kowalik, T.; Bogdał, A.; Kanownik, W.; Ostrowski, K.; Rajda, W. Quality and Functional Values of Waters Flowing away from Catchments of Planned Small Retention Storage Reservoirs in the Beskid Makowski and Żywiecki Mts; The University of Agriculture in Krakow: Krakow, Poland, 2010. [Google Scholar]
  30. Kondracki, J. Geografia Regionalna Polski; Wydawnictwo Naukowe PWN: Warszawa, Poland, 2011; ISBN 9788301160227. [Google Scholar]
  31. Directive 2000/60/EC of the European Parliament and of the Council Establishing a Framework for Community Action in the Field of Water Police. Available online: https://eur-lex.europa.eu/resource.html?uri=cellar:5c835afb-2ec6-4577-bdf8-756d3d694eeb.0004.02/DOC_1&format=PDF (accessed on 7 May 2019).
  32. Chełmicki, W. Woda: Zasoby, Degradacja, Ochrona; PWN: Warszawa, Poland, 2019; ISBN 9788301135577. (In Polish) [Google Scholar]
  33. Rao, A.R.; Srinivas, V.V. Regionalization of watersheds by hybrid-cluster analysis. J. Hydrol. 2006, 318, 37–56. [Google Scholar] [CrossRef]
  34. Cupak, A. Initial results of nonhierarchical cluster methods use for low flow grouping. J. Ecol. Eng. 2017, 18, 44–50. [Google Scholar] [CrossRef]
  35. Stanisz, A. Przystępny Kurs Statystyki z Zastosowaniem STATISTICA PL na Przykładach z Medycyny. Analizy Wielowymiarowe; StatSoft: Kraków, Poland, 2007; Volume 3. (In Polish) [Google Scholar]
  36. Brzeziński, J. Wielozmiennowe Modele Matematyczne w Badaniach Psychologicznych; PWN: Warszawa, Poland, 1987. (In Polish) [Google Scholar]
  37. Cupak, A. Regionalization of catchments with use hierarchical cluster analysis methods. Teka Komisji Ochrony i Kształtowania Środowiska Przyrodniczego 2013, 10, 5–13. [Google Scholar]
  38. Cupak, A.; Wałęga, A.; Michalec, B. Cluster analysis in determination of hydrologically homogeneous regions with low flow. Acta Sci. Pol. Formatio Circumiectus 2017, 16, 53–63. [Google Scholar] [CrossRef]
  39. Yu, S.; Shang, J.; Zhao, J.; Guo, H. Factor analysis and dynamics of water quality of the Songhua River, Northeast China. Wate Air Soil Pollut. 2003, 144, 159–169. [Google Scholar] [CrossRef]
  40. Pekey, H.; Karakaş, D.; Bakoglu, M. Source apportionment of trace metals in surface waters of a polluted stream using multivariate statistical analyses. Mar. Pollut. Bull. 2004, 49, 809–818. [Google Scholar] [CrossRef]
  41. Zhang, C.; Wu, L.; Luo, Y.; Zhang, H.; Christie, P. Identifying sources of soil inorganic pollutants on a regional scale using a multivariate statistical approach: Role of pollutant migration and soil physicochemical properties. Environ. Pollut. 2008, 151, 470–476. [Google Scholar] [CrossRef] [PubMed] [Green Version]
  42. Iliopoulou, T.; Aguilar, C.; Arheimer, B.; Bermúdez, M.; Bezak, N.; Ficchì, A.; Koutsoyiannis, D.; Parajka, J.; Polo, M.J.; Thirel, G.; et al. A large sample analysis of European rivers on seasonal river flow correlation and its physical drivers. Hydrol. Earth Syst. Sci. 2019, 23, 73–919. [Google Scholar] [CrossRef]
  43. Wyżga, B.; Kundzewicz, Z.W.; Ruiz-Villanueva, V.; Zawiejska, J. Flood Generation Mechanisms and Changes in Principal Drivers. In Flood Risk in the Upper Vistula Basin, GeoPlanet: Earth and Planetary Sciences; Springer: Berlin, Germany, 2016. [Google Scholar]
  44. Maidment, D.R. Handbook of Hydrology; McGraw-Hill, Inc.: New York, NY, USA, 1993. [Google Scholar]
  45. Hume, P.E. Adapting to climate change: Is there scope for ecological Management in the face of global threat. J. Appl. Ecol. 2005, 42, 784–794. [Google Scholar] [CrossRef]
  46. Moreno-Mateos, D.; Comín, F.A.; Pedrocchi, C.; Causapé, J. Effect of Wetlands on water quality of an agricultural catchment in a semi-arid area under land use transformation. Wetlands 2009, 29, 1104–1113. [Google Scholar] [CrossRef]
  47. Wałęga, A.; Radecki-Pawlik, A.; Kaczor, G. Naturalne Sposoby Zagospodarowania wód Opadowych; The University of Agriculture in Krakow: Krakow, Poland, 2013. (In Polish) [Google Scholar]
  48. Hua, A.K. Land Use Land Cover Changes in Detection of Water Quality: A Study Based on Remote Sensing and Multivariate Statistics. J. Environ. Public Health 2017, 2017, 7515130. [Google Scholar] [CrossRef]
  49. Williams, T.M.; Amatya, D.M.; Hitchcock, D.R.; Edwards, A.E. Streamflow and nutrients from a Karst watershed with a downstream embayment: Chapel Branch Creek. J. Hydrol. Eng. 2014, 19, 428–438. [Google Scholar] [CrossRef]
  50. Muwamba, A.; Amatya, D.M.; Trettin, C.C.; Glover, J.B. Comparing nutrient export from first, second and third order watersheds in the South Carolina Atlantic coastal plain. In Headwaters to Estuaries: Advances in Watershed Science and Management, Proceedings of the Fifth Interagency Conference on Research in the Watersheds, Asheville, NC, USA, 2–5 March 2015; U.S. Department of Agriculture Forest Service, Southern Research Station: Asheville, NC, USA, 2015; pp. 82–88. [Google Scholar]
  51. Singh, K.P.; Malik, A.; Mohan, D.; Sinha, S. Multivariate statistical techniques for the evaluation of spatial and temporal variations in water quality of Gomti River (India)—A case study. Water Res. 2004, 38, 3980–3992. [Google Scholar] [CrossRef]
  52. Sotomayor, G.; Hampel, H.; Vázquez, R.F. Water quality assessment with emphasis in parameter optimization using pattern recognition methods and genetic algorithm. Water Res. 2018, 130, 353–362. [Google Scholar] [CrossRef]
  53. Rodríguez-Romero, A.J.; Rico-Sánchez, A.E.; Mendoza-Martínez, E.; Gómez-Ruiz, A.; Sedeño-Díaz, J.E.; López-López, E. Impact of Changes of Land Use on Water Quality, from Tropical Forest to Anthropogenic Occupation: A Multivariate Approach. Water 2018, 10, 1518. [Google Scholar] [CrossRef]
  54. Turner, W.R.; Brandon, K.; Brooks, T.M.; Costanza, R.; da Fonseca, G.A.B.; Portela, R. Global Conservation of Biodiversity and Ecosystem Services. BioScience 2007, 57, 868–873. [Google Scholar] [CrossRef] [Green Version]
  55. Zhao, J.; Lin, L.; Yang, K.; Liu, Q.; Qian, G. Influences of land use on water quality in a reticular river network area: A case study in Shanghai, China. Landsc. Urban Plan. 2015, 137, 20–29. [Google Scholar] [CrossRef]
  56. Wan, R.; Cai, S.; Li, H.; Yang, G.; Li, Z.; Nie, X. Inferring land use and land cover impact on stream water quality using a Bayesian hierarchical modeling approach in the Xitiaoxi River Watershed, China. J. Environ. Manag. 2014, 133, 1–11. [Google Scholar] [CrossRef]
  57. Nilsson, C.; Renöfält, B.M. Linking flow regime and water quality in rivers: A challenge to adaptive catchment management. Ecol. Soc. 2008, 13, 18. [Google Scholar] [CrossRef]
  58. Zhang, F.; Wang, J.; Wang, X. Recognizing the Relationship between Spatial Patterns in Water Quality and Land-Use/Cover Types: A Case Study of the Jinghe Oasis in Xinjiang, China. Water 2018, 10, 646. [Google Scholar] [CrossRef]
  59. Kosmowska, A.; Żelazny, M.; Małek, S.; Stańczyk, T. Impact of deforestation on water chemistry in the western Tatras and Beskid Śląski range in the Polish Carpathians. Acta Sci. Pol. Formatio Circumiectus 2018, 18, 89–99. [Google Scholar] [CrossRef]
  60. Mello, K.; Valente, R.A.; Randhir, T.O.; Dos Santos, A.C.A.; Vettorazzi, C.A. Effects of land use and land cover on water quality of low-order streams in Southeastern Brazil: Watershed versus riparian zone. Catena 2018, 167, 130–138. [Google Scholar] [CrossRef]
  61. Mello, K.; Valente, R.A.; Randhir, T.O.; Vettorazzi, C.A. Impacts of tropical forest cover on water quality in agricultural watersheds in southeastern Brazil. Ecol. Indic. 2018, 93, 1293–1301. [Google Scholar] [CrossRef]
  62. Namugize, J.N.; Jewitt, G.; Graham, M. Effects of land use and land cover changes on water quality in the uMngeniriver catchment, South Africa. Phys. Chem. Earth 2018, 105, 247–264. [Google Scholar] [CrossRef]
  63. Wijesiri, B.; Deilami, K.; Goonetilleke, A. Evaluating the relationship between temporal changes in land use and resulting water quality. Environ. Pollut. 2018, 234, 480–486. [Google Scholar] [CrossRef]
  64. Selle, B.; Schwientek, M.; Lischeid, G. Understanding processes governing water quality in catchments using principal component scores. J. Hydrol. 2013, 486, 31–38. [Google Scholar] [CrossRef]
  65. Carey, R.O.; Hochmuth, G.J.; Martinez, C.J.; Boyer, T.H.; Dukes, M.D.; Toor, G.S.; Cisar, J.L. Evaluating nutrient impacts in urban watersheds: Challenges and research opportunities. Environ. Pollut. 2013, 173, 138–149. [Google Scholar] [CrossRef]
  66. Sojka, M.; Siepak, M.; Zioła, A.; Frankowski, S.; Siepak, J. Application of multivariate statistical techniques to evaluation of water quality in the Mała Wełna River (Western Poland). Environ. Monit. Assess. 2008, 147, 159–170. [Google Scholar] [CrossRef]
  67. Wąsik, E.; Chmielowski, K.; Operacz, A. PCA as a data mining tools characterizing the work of nitrification reactors in the sewage treatment plant in Trepcza. Acta Scientiarum Polonorum Formatio Circumiectus 2017, 16, 209–222. (In Polish) [Google Scholar] [CrossRef]
Figure 1. Hydrographic map of research catchments.
Water 11 00964 g001
Figure 2. Land-use map of research catchments.
Water 11 00964 g002
Figure 3. Dendrograms (Ward’s Method—Square of Euklidean Distance) showing similarity of surface water quality examined in individual measurement-control points, taking into account the values of (a) all examined physicochemical indicators, (b) physical and acidification indicators, (c) oxygen indicators, (d) phosphorus indicators, (e) nitrogen indicators, (f) salinity indicators.
Water 11 00964 g003
Figure 4. Factor load charts between: (a) factor 1 and 2, (b) factor 1 and 3, (c) factor 2 and 3.
Water 11 00964 g004
Table 1. The basic physiographic and hydrographic parameters of the study catchments.
ParameterUnitCatchment of
Chechło RiverMłoszówka Stream
Areakm232.328.35
Average lengthkm8.676.05
Maximum lengthkm9.047.96
Average widthkm3.581.05
Circumferencekm29.8518.06
Form index0.400.13
Elongation index0.710.41
Circularity index0.460.32
Gravelius index1.481.76
Minimum elevationm a.s.l.275.0275.0
Weighted average elevationm a.s.l.300.9347.4
Maximum elevationm a.s.l.418.4419.2
Weighted average land slope%3.57.5
Average precipitation (1971–2010)mm739
Average temperature (1971–2010)°C8.3
Land use
forest and tree planting%66.740.2
arable lands%8.514.8
grassy ecosystems%14.924.3
Orchards%0.63.1
areas under standing waters%0.30.0
built-up areas%6.315.1
communication areas%2.72.5
Length of main watercourse km8.3305.398
Length of tributarieskm92.06811.064
Total lenghtkm100.39816.462
Water network densitykm⋅km−23.111.97
Average slope of the main watercourse%0.51.2
Lakeity index%0.30.0
Fragility index%5.12.4
Flow
Average annualm3⋅s−10.2720.071
Average lowm3⋅s−10.0790.019
Maximum with average return period (1/year)
200


m3⋅s−1


38.61


10.10
100m3⋅s−133.008.63
50m3⋅s−127.557.21
25m3⋅s−120.535.37
10m3⋅s−115.314.00
5m3⋅s−110.302.69
2m3⋅s−14.221.11
Table 2. Descriptive statistics of studied water quality parameters 1 at the monitoring sites during the research period.
ParametersUnitsSampling Location
P1P2P3P4
RangeMean ± SDCV
(%)
RangeMean ± SDCV
(%)
RangeMean ± SDCV
(%)
RangeMean ± SDCV
(%)
Chlaμg⋅dm−3LD 2–11.85.0 ± 5.8117LD–16.25.1 ± 7.4145LD–16.67.9 ± 7.595LD–4.71.7 ± 2.3139
Temperature°C0.3–22.511.4 ± 6.4560.0–22.612.3 ± 7.1580.0–21.312.1 ± 6.8560.0–20.911.6 ± 6.859
TSSmg⋅dm−30.1–8.73.7 ± 2.0560.3–5.32.7 ± 1.7620.9–10.72.8 ± 2.4850.1–4.21.6 ± 1.275
pHpH unit7.1–8.17.7 ± 0.346.6–7.77.3 ± 0.346.6–7.77.2 ± 0.356.4–7.67.1 ± 0.45
DOmg O2⋅dm−37.3–13.59.7 ± 1.6175.4–12.38.3 ± 1.9232.4–12.07.8 ± 2.7342.0–12.87.9 ± 2.634
DOsat%73–11089 ± 11330–11579 ± 1151928–9970 ± 192723–11173 ± 21129
BOD5mg O2⋅dm−31.0–10.03.9 ± 2.8731.0–10.04.2 ± 3.0711.0–15.04.2 ± 3.4801.2–10.04.7 ± 2.655
CODCrmg O2⋅dm−31.8–33.116.4 ± 8.04925.2–80.040.6 ± 17.04216.1–125.251.1 ± 30.66025.8–118.060.4 ± 29.749
TPmg⋅dm−30.10–0.930.26 ± 0.271050.04–0.930.20 ± 0.241170.03–0.590.17 ± 0.17970.04–0.820.16 ± 0.19123
PO43−mg⋅dm−3LD–0.0950.038 ± 0.02771LD–0.0800.020 ± 0.027134LD–0.0620.018 ± 0.023124LD–0.0890.022 ± 0.028128
TNmg⋅dm−31.06–3.822.42 ± 0.61250.97–4.921.97 ± 0.91461.02–3.761.80 ± 0.63351.23–3.741.93 ± 0.6232
Org–Nmg⋅dm−30.38–1.741.06 ± 0.38360.27–4.111.10 ± 0.89810.16–2.970.82 ± 0.64780.49–2.951.05 ± 0.6057
N–NH4+mg⋅dm−30.03–0.400.19 ± 0.10530.16–0.900.48 ± 0.22460.21–0.950.48 ± 0.20420.24–1.330.60 ± 0.3151
N–NO2mg⋅dm−3LD–0.0290.014 ± 0.00966LD–0.0190.005 ± 0.007142LD–0.0600.009 ± 0.016177LD–0.0650.008 ± 0.017205
N–NO3mg⋅dm−30.28–2.101.16 ± 0.46400.06–1.230.39 ± 0.36910.09–1.230.49 ± 0.38790.01–1.380.27 ± 0.34124
DSmg⋅dm−3360–628432 ± 6816180–296254 ± 3514148–284242 ± 3213142–314251 ± 4719
SO42−mg⋅dm−334.8–101.081.0 ± 18.62314.8–71.540.0 ± 15.13818.1–74.941.6 ± 17.74211.9–77.840.4 ± 19.147
Clmg⋅dm−336.0–95.364.7 ± 13.32128.6–54.544.8 ± 7.771729.6–60.445.4 ± 8.81927.7–46.438.1 ± 5.515
Ca2+mg⋅dm−354.9–87.473.4 ± 10.01419.7–51.236.8 ± 7.42017.4–41.434.0 ± 5.91716.1–66.939.0 ± 11.730
Mg2+mg⋅dm−36.5–10.68.1 ± 1.0132.4–5.34.3 ± 0.7172.0–5.24.2 ± 0.8191.9–5.74.1 ± 0.922
Na+mg⋅dm−326.3–45.932.5 ± 5.61711.3–25.320.3 ± 4.02011.4–28.720.9 ± 4.42110.6–20.815.6 ± 2.818
K+mg⋅dm−33.2–8.04.9 ± 1.2251.2–3.62.2 ± 0.6271.1–3.72.2 ± 0.6280.6–3.11.6 ± 0.741
1 number of samples, for each P1, P2, P3 and P4, taking during the research period was 36, 2 LD—below the limit of detection.
Table 3. Comparison of water quality parameters values between measurement-control points using non-parametrical Mann-Whitney U test.
ParameterTest Probability Values (p) in Variants
P1–P2P1–P3P1–P4P2–P3P2–P4P3–P4
Chla0.840.690.540.550.690.31
Temperature0.680.710.840.870.810.87
TSS0.350.060.05 10.870.040.02
pH0.000.000.000.350.411.00
DO0.090.100.070.840.570.94
DOsat0.020.000.010.370.460.74
BOD50.810.680.201.000.460.46
CODCr0.000.000.000.310.080.41
TP0.120.120.010.840.540.84
PO43−0.050.050.050.840.900.81
TN0.000.000.010.410.900.39
Org–N0.370.020.490.110.840.05
N–NH4+0.000.000.000.900.410.31
N–NO20.010.070.040.741.000.87
N–NO30.000.000.000.510.090.02
DS0.000.000.000.270.940.49
SO42−0.000.000.000.840.940.71
Cl0.000.000.001.000.010.02
Ca2+0.000.000.000.240.710.23
Mg2+0.000.000.000.940.310.39
Na+0.000.000.000.710.000.00
K+0.000.000.000.940.000.01
1 The statistically significant values are marked in red, for p ≤ α = 0.05.
Table 4. The correlation matrix of the analyzed variables.
ParametersTemperaturepHDOBOD5CODCrPO43−Org–NN–NH4+N–NO2N–NO3SO42−ClCa2+Mg2+Na+K+
Temperature1.0000.142−0.564 1−0.2720.3550.1490.1820.3210.324−0.384−0.2520.1920.195−0.0780.157−0.225
pH0.1421.0000.1140.108−0.4650.4650.105−0.3110.1420.2600.5740.4250.6110.6610.5100.479
DO−0.5640.1141.000−0.101−0.530−0.291−0.003−0.420−0.1920.3480.3700.0950.1550.2620.1930.364
BOD5−0.2720.108−0.1011.000−0.0170.096−0.264−0.025−0.1360.1240.107−0.204−0.1460.046−0.207−0.011
CODCr0.355−0.465−0.530−0.0171.000−0.1660.1400.6880.258−0.554−0.700−0.456−0.429−0.605−0.545−0.667
PO43−0.1490.465−0.2910.096−0.1661.000−0.098−0.0170.2580.1520.2530.4040.3460.4140.3480.190
Org–N0.1820.105−0.003−0.2640.140−0.0981.000−0.0390.049−0.068−0.144−0.0070.1490.0010.045−0.022
N–NH4+0.321−0.311−0.420−0.0250.688−0.017−0.0391.0000.303−0.616−0.524−0.374−0.521−0.602−0.446−0.740
N–NO20.3240.142−0.192−0.1360.2580.2580.0490.3031.0000.0360.0580.3000.2640.1790.3090.047
N–NO3−0.3840.2600.3480.124−0.5540.152−0.068−0.6160.0361.0000.6580.5160.5200.5900.5370.748
SO42−−0.2520.5740.3700.107−0.7000.253−0.144−0.5240.0580.6581.0000.6170.6860.7330.6640.736
Cl0.1920.4250.095−0.204−0.4560.404−0.007−0.3740.3000.5160.6171.0000.7640.6900.9490.641
Ca2+0.1950.6110.155−0.146−0.4290.3460.149−0.5210.2640.5200.6860.7641.0000.8570.7810.734
Mg2+−0.0780.6610.2620.046−0.6050.4140.001−0.6020.1790.5900.7330.6900.8571.0000.7620.815
Na+0.1570.5100.193−0.207−0.5450.3480.045−0.4460.3090.5370.6640.9490.7810.7621.0000.712
K+−0.2250.4790.364−0.011−0.6670.190−0.022−0.7400.0470.7480.7360.6410.7340.8150.7121.000
1 The statistically significant values are marked in red.
Table 5. The factor loadings for three selected factors.
ParameterFactor 1Factor 2Factor 3
Temperature0.0970.798 10.299
pH0.6870.065−0.094
DO0.188−0.7500.163
BOD5−0.060−0.066−0.834
CODCr−0.6050.6100.072
Org–N0.0100.0420.703
N–NH4+−0.5560.629−0.058
N–NO20.3120.6300.030
N–NO30.648−0.434−0.169
SO42−0.804−0.303−0.221
Cl0.8720.1200.129
Ca2+0.9100.0530.155
Mg2+0.906−0.142−0.071
Na+0.9140.0470.160
K+0.833−0.372−0.024
1 The statistically significant values are marked in red.

