Triclosan Alters Microbial Communities in Freshwater Microcosms
by
 ,
,
Alexandra Clarke
1,†, 
Daniella Azulai
1,†,
M. Elias Dueker
1,2,3,4,
Michiel Vos
5 and
Gabriel G. Perron
1,2,* 1
Department of Biology, Reem-Kayden Center for Science and Computation, Bard College, Annandale-On-Hudson, NY 12504, USA
2
Bard Center for the Study of Land, Air, and Water, Bard College, Annandale-On-Hudson, NY 12504, USA
3
Environmental and Urban Studies Program, Bard College, Annandale-On-Hudson, NY 12504, USA
4
Cary Institute of Ecosystem Studies, Millbrook, NY 12545, USA
5
European Centre for Environment and Human Health, University of Exeter Medical School, University of Exeter, Penryn Campus, Cornwall TR10 9FE, UK
*
Author to whom correspondence should be addressed.
†
These authors contributed equally.
Water 2019, 11(5), 961; https://doi.org/10.3390/w11050961
Submission received: 10 February 2019
/
Revised: 19 April 2019
/
Accepted: 28 April 2019
/
Published: 8 May 2019
(This article belongs to the Section Water Quality and Contamination)
Abstract
:The effect of triclosan on microbial communities that are found in soil and sediments is well documented. However, little is known regarding the possible effects of triclosan on microbial communities that are present in the column of freshwater streams as the antimicrobial is released from sediments or from water sewage outflow. We show that a concentration of triclosan as low as 1 ng/L decreases richness and evenness in freshwater microbial communities growing in the water column while using controlled experimental microcosms. Crucially, the decrease in evenness that was observed in the microbial communities was due to the selection of bacteria commonly associated with human activity, such as Acinetobacter, Pseudomonas, and Rhodobacter, as opposed to an increase in Cyanobacteria, as previously suggested. Finally, our results demonstrate that higher concentrations of triclosan comparable to heavily polluted environments can also impact the overall phylogenetic structure and community composition of microbial communities. Understanding the impact of triclosan on these microbial populations is crucial from a public health perspective as human populations are more often exposed to microbial communities that are present in the water column via recreative use.

1. Introduction
Triclosan, or 5-chloro-2-(2,4-dichlorophenoxy)phenol, is a synthetic antimicrobial agent that has been extensively used for more than 40 years in clinical settings, as well as in personal care products [1]. Even though the use of triclosan in hand soap is now regulated in many countries, including the United States (USA) [2], its continued use in other consumer-based products, such as toothpaste and cosmetics, ensures that triclosan is still one of the most frequent wastewater contaminants found in the environment [3]. Furthermore, given its chemical stability and low aqueous solubility, triclosan released with wastewaters can accumulate and persist in sediments, which presents an environmental risk well after its release [4]. Triclosan is so ubiquitous that it was detected in approximately 60% of tested streams in a survey of 95 rivers across the USA, with concentrations reaching up to 2.3 µg/L in surface waters and 53 ng/g sediments, or up to 1000 µg/L in wastewater effluents [1,4].
Triclosan has been linked to a range of health conditions in humans and other organisms [1]. Triclosan can cause contact dermatitis in humans [5] or an increased risk of colon cancer in exposed patients [6]. Triclosan was also isolated in the milk of breastfeeding women in countries where triclosan is regularly used [7,8], with possible effects on infants’ developing microbiomes [9]. In aquatic organisms, such as tadpoles [10], rainbow trout [11], and the Japanese rice fish [12], triclosan was shown to cause development disruptions, even causing increased mortality in zebra fish [13]. Triclosan also alters the microbiomes of exposed animals, such as zebrafish and fathead minnow [14,15], demonstrating the ability of triclosan to act as an ecological disruptor at different levels [16].
The extensive use of triclosan can also lead to the evolution and spread of bacteria that are resistant or tolerant to this chemical [17]. Triclosan concentrations as low as 0.5 ng/mL were shown to promote the evolution of resistant bacteria in experimental systems [4,18,19]. Crucially, the spread of triclosan resistance was also linked to the spread of resistance to clinical antibiotics in human pathogens [17]. For example, triclosan was shown to select the overexpression of multidrug efflux pumps in Pseudomonas aeruginosa [19] and Escherichia coli [20]. Moreover, triclosan can increase the horizontal transfer of genetic material, which further exacerbates the spread of antibiotic resistance in human pathogens [21]. Finally, triclosan can not only alter microbial communities associated with hosts [9,14,15], but also affect the composition and structure of microbial communities that are present in the environment, disrupting local ecosystem functions [16]. For example, triclosan can reduce respiration and biomass in exposed microbial populations, which slows ecosystem productivity [22,23].
Yet, the majority of research on the impacts of triclosan on environmental microbial communities is focused on sediments and soil habitats, where triclosan most readily accumulates. However, the possible effects of triclosan on the diverse microbial communities that are found in surface waters have been largely ignored. For example, whether triclosan affects microbial communities in surface water to the same extent that it perturbs communities in sediments remains to be tested. Here, we investigate the effect of triclosan on freshwater microbial communities that were sampled from the water column of a North American stream and grown in glass microcosms with or without agitation, enabling the direct comparison of different triclosan concentrations in still waters and moving waters. Using 16S rRNA deep sequencing, we measured how a range of triclosan concentrations affects the diversity and composition of microbial communities. Finally, to test whether the exposure to triclosan correlated with a possible increase in overall antimicrobial resistance in the exposed microbiomes, we used quantitative PCR to measure the abundance of integron 1 elements, an important genetic marker that is associated with the horizontal transfer of antibiotic resistance genes in pathogenic bacteria [24].
2. Materials and Methods
2.1. Water Collection & Microcosms
We sampled eight liters of freshwater (approximately 5 cm below the water surface) using 1 L sterilized glass containers from a unique site along the Saw Kill, Red Hook, NY, on September 28, 2016 (42.017350° N, 73.915528° W). The samples were collected from a fast-flowing site three days after the last rainfall to minimize the possible effect of sediment; unpublished data revealed that the number of sediments or particles in the water at this site drastically decreased 24 h after a rain episode. Within an hour, we then established sixteen experimental microcosms in 1L baffled flasks by mixing 250 mL of stream water that was randomly selected from at least two different well-mixed sampling bottles. Preliminary analyses of microbial composition at four different sites that cover a one-mile stretch of the Saw Kill established that microbial communities in surface water did not statistically differ from each other at the time of collection and behave similarly over time in experimental microcosms (Figure S1).
We supplemented four replicate microcosms with 1 ng/L, 10 ng/L, or 10,000 ng/L of triclosan (Sigma-Aldrich, St. Louis, MO, USA) and left an additional four replicates unexposed to triclosan to investigate the effect of triclosan on microbial communities. The concentrations were selected to represent a range of triclosan concentrations that are found in the environment from pristine to heavily polluted (see above). Triclosan was initially diluted in ethanol and subsequently diluted by a 10-fold factor in sterile water, before being added to our experimental treatments to attain the desired concentration, thus minimizing the possible inhibitory effect of the solvent on microbial communities below an established detection level (i.e., <0.001%) [25,26]. While it is possible that the fresh water that was sampled was already contaminated with triclosan due to environmental exposure, previous studies conducted in the Hudson River watershed showed that the triclosan level in the Hudson River estuary is low, even when it is heavily influenced by the New York City wastewater discharge [27]. More importantly, the four control microcosms that were unexposed to triclosan during our experiment served as a basis for comparison. Finally, two replicates from each treatment were placed on an orbital shaker while the other two replicates were left undisturbed on a laboratory bench to investigate whether water turbulence influenced triclosan activity. We maintained the microcosms at room temperature (21 ± 2 °C) and under natural day-night cycles for seven days. DNA was extracted from the initial water sample on Day 0, and from each of the sixteen microcosms on Day 7.
2.2. DNA Extraction and Sequencing
We extracted and purified microbial DNA from 200 mL of filtered water (0.22 µm Sterivex filter) while using the PowerWater kit from MO BIO laboratories (Mo Bio, Carlsbad, CA, USA). Microbiomes were then characterized via the targeted gene amplification of the 16S rRNA V4 region, as described elsewhere [28]. Following gel-purification, the libraries were pooled at equimolar ratios and sequenced on the MiSeq Illumina platform adapted for 250-bp paired-end reads (Wright Labs, Juniata College, Huntingdon, PA, USA). The DNA extraction controls failed to yield sequencing reads, confirming the sterility of our extraction techniques. All of the sequence reads are available at the Sequence Read Archive of the National Center for Biotechnology information (accession number PRJNA515296).
2.3. Processing and Visualization of 16S rRNA Sequence Data
The 16S rRNA sequence data were processed, aligned, and categorized with the DADA2 pipeline version 1.8 [29] using default parameters as described in [30]. The DADA2 pipeline characterizes microbial communities by identifying the unique amplicon sequence variants (ASVs) among the 16S rRNA reads [31]. In brief, forward and reverse reads are filtered for poor quality reads, replicated reads (i.e., de-replicating), likely sequencing error (i.e., de-noising), chimeric sequences, and mitochondrial DNA using defaults parameter. After building the ASV table that summarizes the abundance of each ASV in every sample, we assigned taxonomy using the ‘assignTaxonomy’ function of DADA2 that was trained against the SILVA ribosomal RNA gene database version 132. As expected, the total number of ASVs and genera did not match, since many closely related species within a genus harbor the same nucleotide sequences at the 16S rRNA V4 region, or because some bacterial species harbor multiple heterogeneous copies of the 16S rRNA gene. The latter is more frequent among extremophiles and it is minimized when only considering the V4 region [32]. A maximum likelihood phylogenetic tree was built from the multiple alignment of all ASVs while using the phangorn package version 2.1.3 [33].
Patterns of diversity within the ASV tables, only including ASVs that appeared at least three times and that were present in at least 10% of the samples, were analyzed using a modified version of the pipeline that was described in Dahan et al. [28] and implemented in R version 3.2.3 (R scripts are available upon request). Supplemental File 1 provides a mapping file linking the sample names and the relevant metadata and Supplemental File 2 provides a full description of the statistical and visualization analyses. Briefly, using phyloseq version 1.14.0 (available at https://joey711.github.io/phyloseq/), we estimated alpha diversity using richness and evenness as the Shannon diversity measurements (H’) from the ASV table that was subsampled to the lowest sampling depth of 18,477 paired-reads for each sample. The Shannon diversity index takes into account not only the total number of taxa, but also their abundance and it is considered to be a key factor in preserving the functional stability of an ecosystem [34]. We then tested whether the diversity indices changed with triclosan concentrations using mixed-models linear modeling and comparing the different statistical models with Akaike’s Information Criterion (AIC), as implemented in R’s stats package v3.2.1.
We performed Principle Coordinate Analyses (PCoA) on unweighted UniFrac distance scores to test for the differences in microbial composition among treatments, which is recommended for contrasting microbial populations that live in strongly inhibiting environments [35,36]. The statistical differences were tested using the permutational analysis of variance (PERMANOVA) of the adonis function of vegan version 2.3.2 [37]. The multivariate homogeneity of variances for each test was tested while using vegan’s package implementation of PERMDISP2 via the betadisper method [37]. We then analyzed possible changes in ASV abundance between the treatments using DESeq2’s differential abundance comparison (α = 0.01), as implemented in R [38]. Finally, even though we expected Cyanobacteria to play an important role in our study, the identification of the bacterium with 16S rRNA sequencing is poor at best. For this reason, we also repeated the above analyses with the exclusion of ASVs identified as Cyanobacteria and/or chloroplast to test whether Cyanobacteria significantly affected the trends that we observed.
2.4. qPCR of 16S rRNA and Int1 Genes
We quantified 16S rRNA and int1 gene copy numbers using quantitative real-time PCR, as described in Gaze et al. [39]. For each sample, triplicate PCR reactions using the PowerUp SYBR Green Master Mix (Applied Biosystems, Foster City, CA, USA) were cycled while using the Bio-Rad CFX96 Real-Time PCR Detection System (Bio-Rad Laboratories, Hercules, CA, USA). An internal standard curve that was constructed from a serial dilution of Escherichia coli SK4903 harboring seven 16S rRNA copies and six int1 copies was processed with each qPCR run. The relative abundance of the int1 genes was normalized to 16S rRNA copies of each sample before being analyzed via linear modeling with int1 relative abundance as the response variable and triclosan concentrations as the explanatory variable. Statistical analysis and model assumption testing were conducted in R version 3.2.3.
3. Results
3.1. Triclosan Decreases Richness and Evenness in Freshwater Microbial Communities
We characterized the microbiomes of microbial communities that were exposed to 0, 1, 10, and 10,000 ng/L triclosan under controlled laboratory conditions to investigate the effect of triclosan on freshwater microbial communities. Using 16S rRNA gene deep sequencing, we sequenced a total of 766,346 pairs of reads from sixteen samples with a median sequencing depth of 39,558 paired-reads per sample. After pre-processing, we were left with 534,702 (70.1% of initial) paired-reads. We identified a total of 1383 unique ASVs, which belonged to 30 different phyla, including Cyanobacteria (Table S1). A total of 267 different microbial genera were identified, while 672 ASVs could not be identified to the genus level (Table S1). We only kept ASVs that appeared at least three times and that were present in at least 10% of the samples to avoid biasing our results for rare taxa. Thus, we used a total of 455 ASVs for the following analyses.
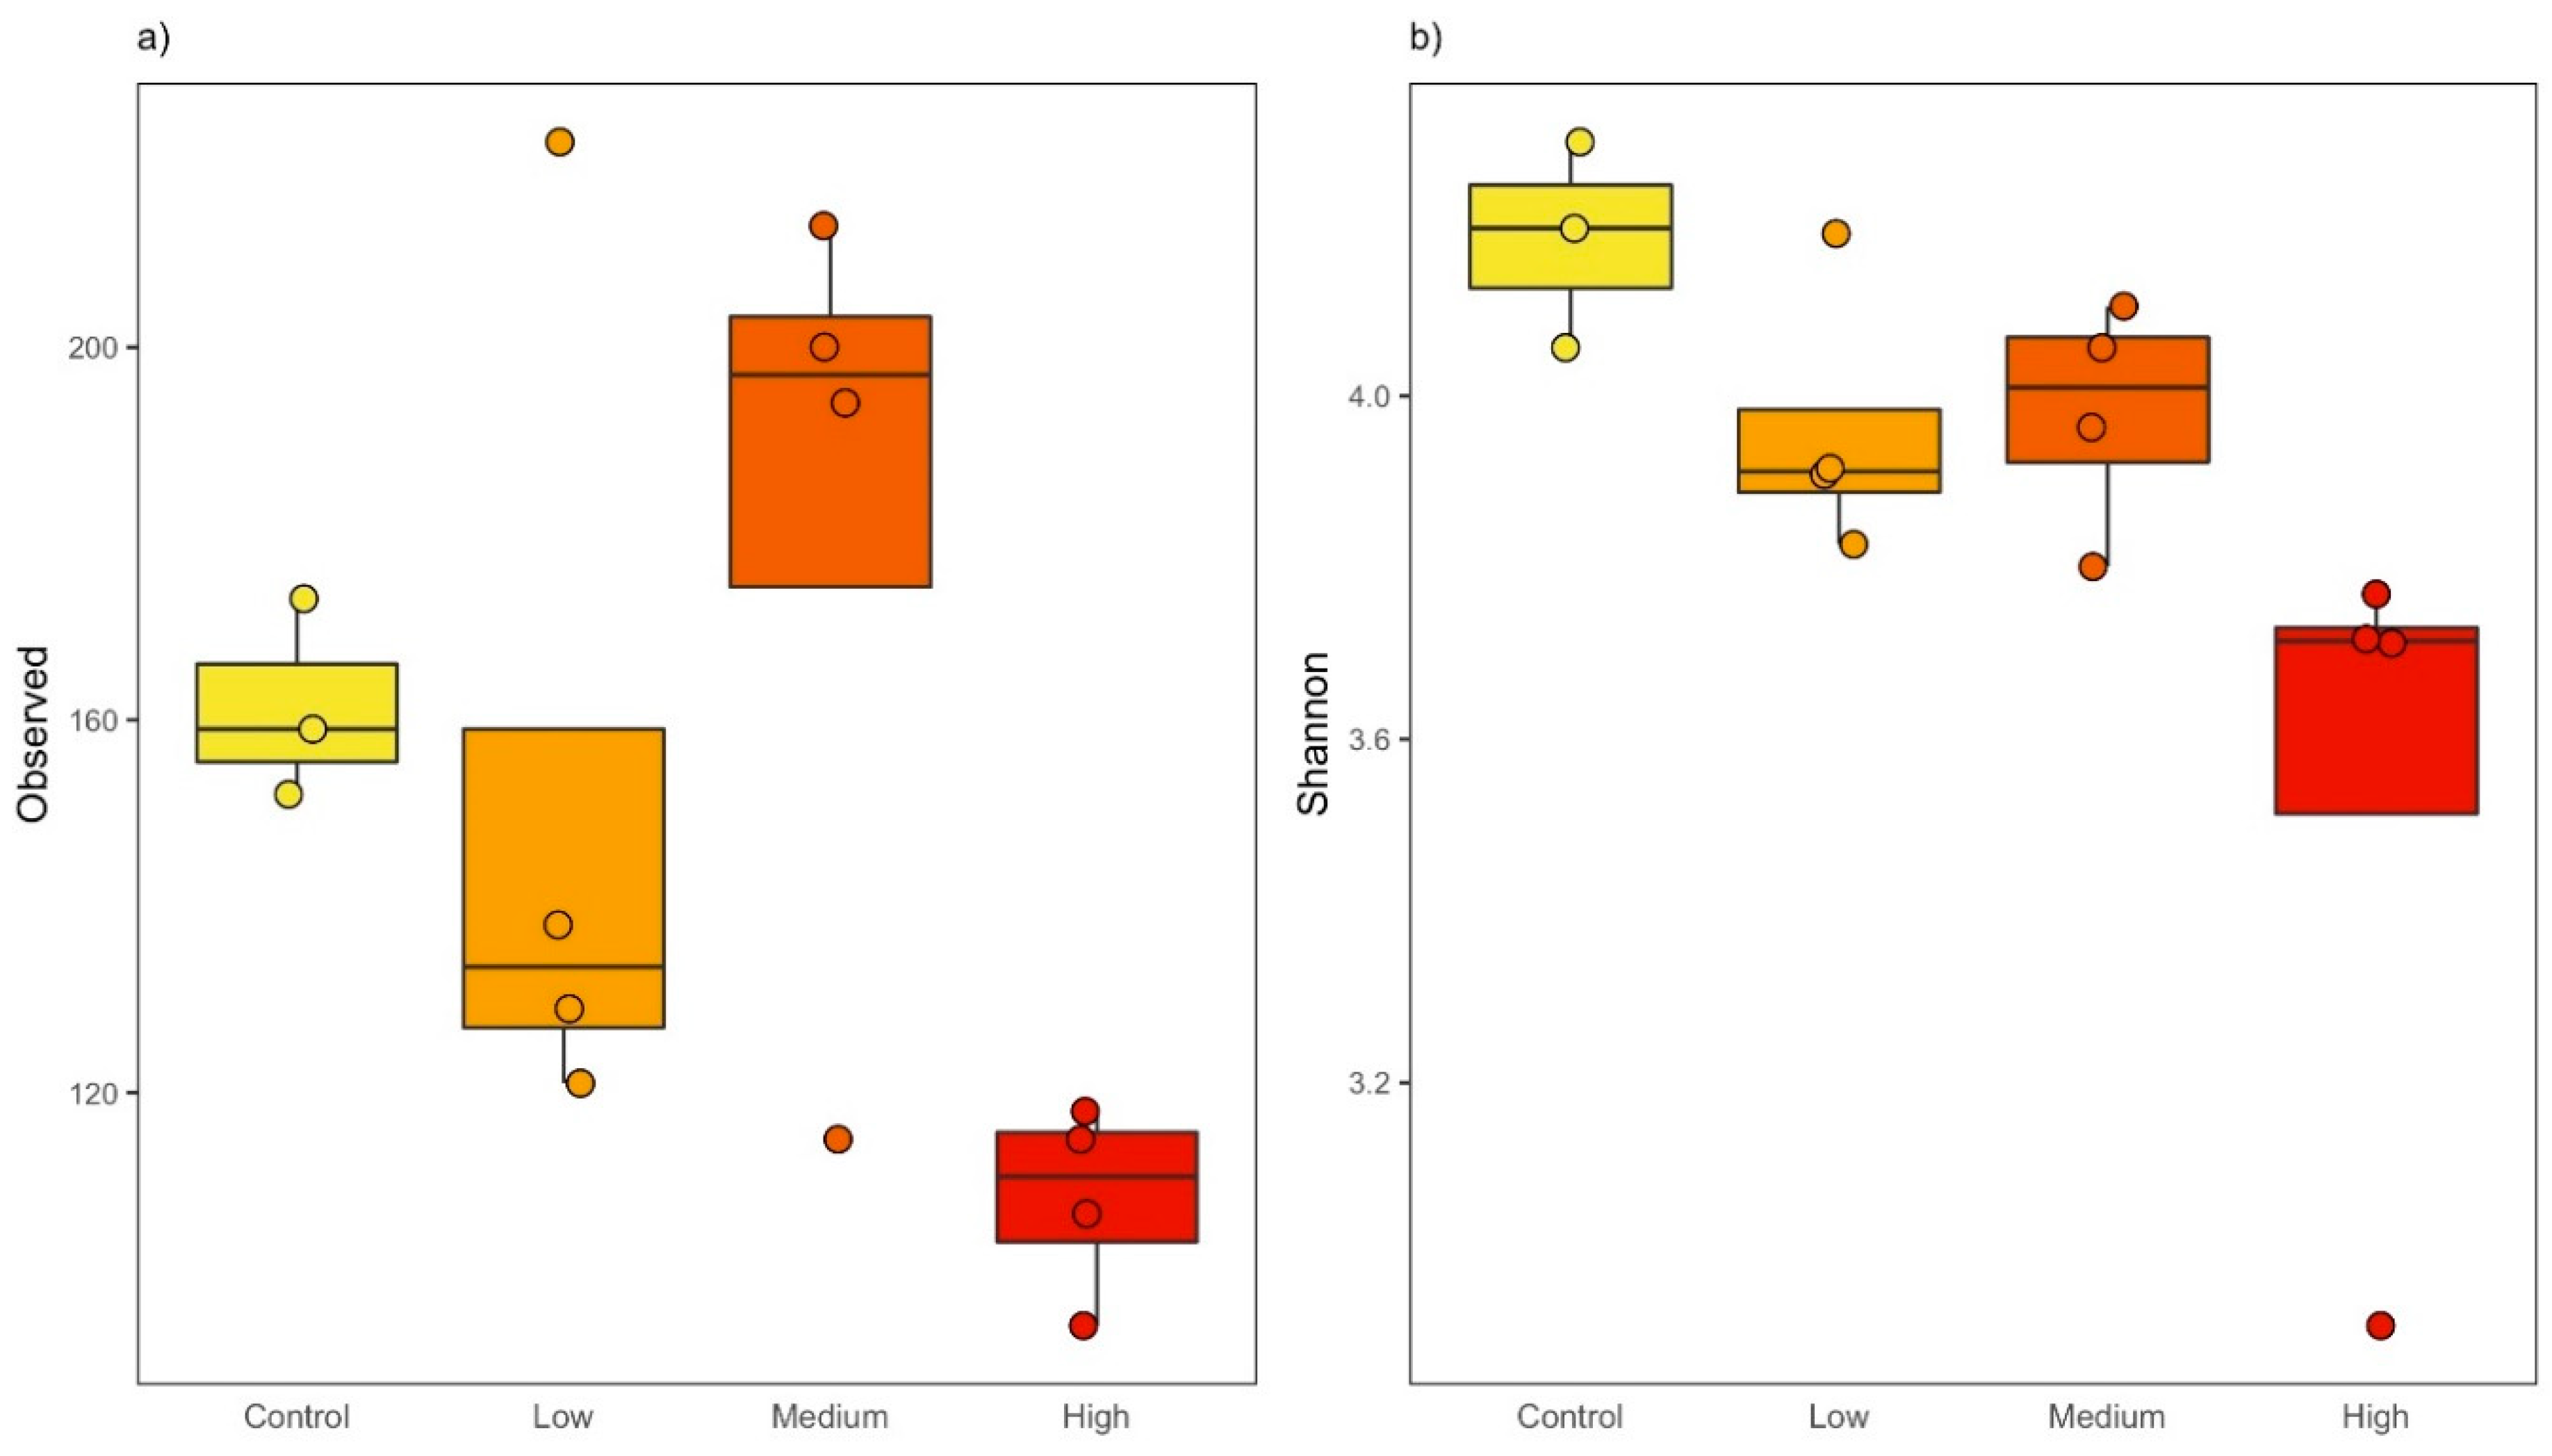
We then investigated the effect of triclosan on taxonomic diversity that is present in each microcosm. Overall, we found that triclosan negatively impacted alpha-diversity, decreasing both richness and evenness in the microbial communities that were exposed to the chemical (Table 1). More specifically, we found that the total number of observed ASVs decreased linearly as triclosan concentration increased (F(1,13) = 10.262; adj-P = 0.01; Figure 1a). We also observed a significant decrease in evenness in microbial communities that were exposed to triclosan. Evenness, here measured with the Shannon diversity index, not only considers the total number of taxa, but also their abundance and it is considered to be a key factor in preserving the functional stability of an ecosystem. Similar to richness, we found that evenness linearly decreased as the triclosan concentration increased in the microcosms (F(1,13) = 11.53; adj-P = 0.009; Figure 1b), indicating that, not only the total number of taxa decrease, but also that a smaller number of taxa represented a larger proportion of the populations that are affected by triclosan. While we observed a small increase in richness and evenness at 10 ng/L, this effect was not significant when individually considering the overall trend or each triclosan concentration.
Interestingly, the number of taxa that were observed in agitated and still microcosms throughout the experiment was very similar. In other words, we observed a similar linear decrease in richness and evenness as the triclosan concentration increased in both microcosm types (microcosm type being not statistically significant, we removed it from our model). Finally, because Cyanobacteria cannot be reliably identified using the V4 region of the16S rRNA gene (i.e., being identified as chloroplast), we repeated the above analyses without the taxon. We observed the same decreasing trends in richness and evenness under the effect of triclosan, as Cyanobacteria were not overly represented in our experimental population (Table 1; Figure S2).
3.2. Triclosan Alters Freshwater Microbial Communities
We then test whether triclosan affected the overall community structure of freshwater microbial communities by looking at the patterns of divergence between microbial communities that were exposed to triclosan. Based on unweighted UniFrac measures of beta diversity, we found that, even though microbial communities differed between the agitated and still microcosms (F(1,14) = 2.86; Perm = 9999; R2 = 0.15; P = 0.0006), triclosan significantly altered the overall microbial composition of microbial communities in both microcosm types similarly (F(3,14) = 2.177; Perm = 9999; R2 = 0.337; P = 0.00008).
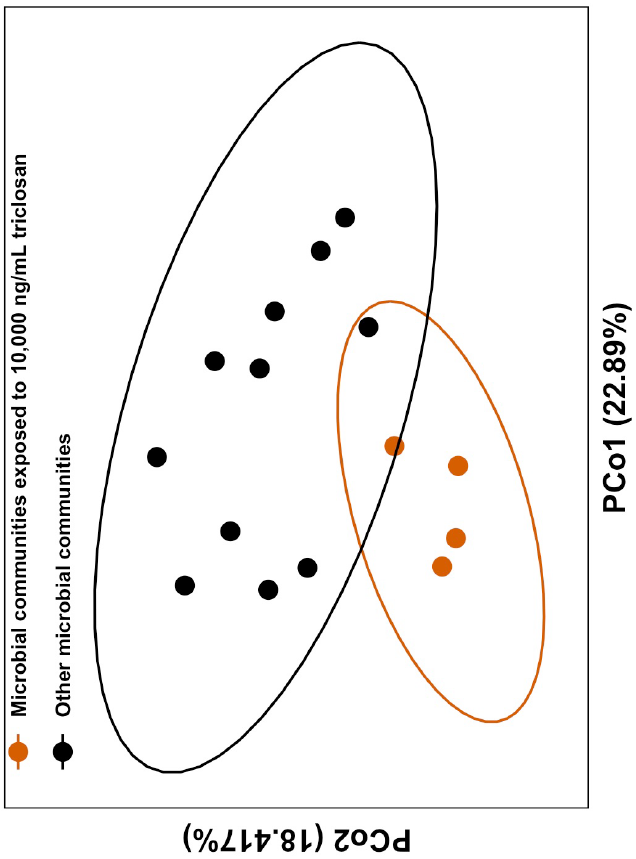
When looking at the effect of each triclosan concentration when compared to control communities, we found that only the highest concentration of triclosan significantly altered community structure after correcting for multiple testing (F(1,14) = 2.977; Perm = 9999; R2 = 0.169; adj-P = 0.0002; Figure 2a). In other words, while we found that 1 and 10 ng/L of triclosan decreased microbial diversity, we found no difference in the overall community structure between these microbial communities and that of microbiomes in the control microcosms.
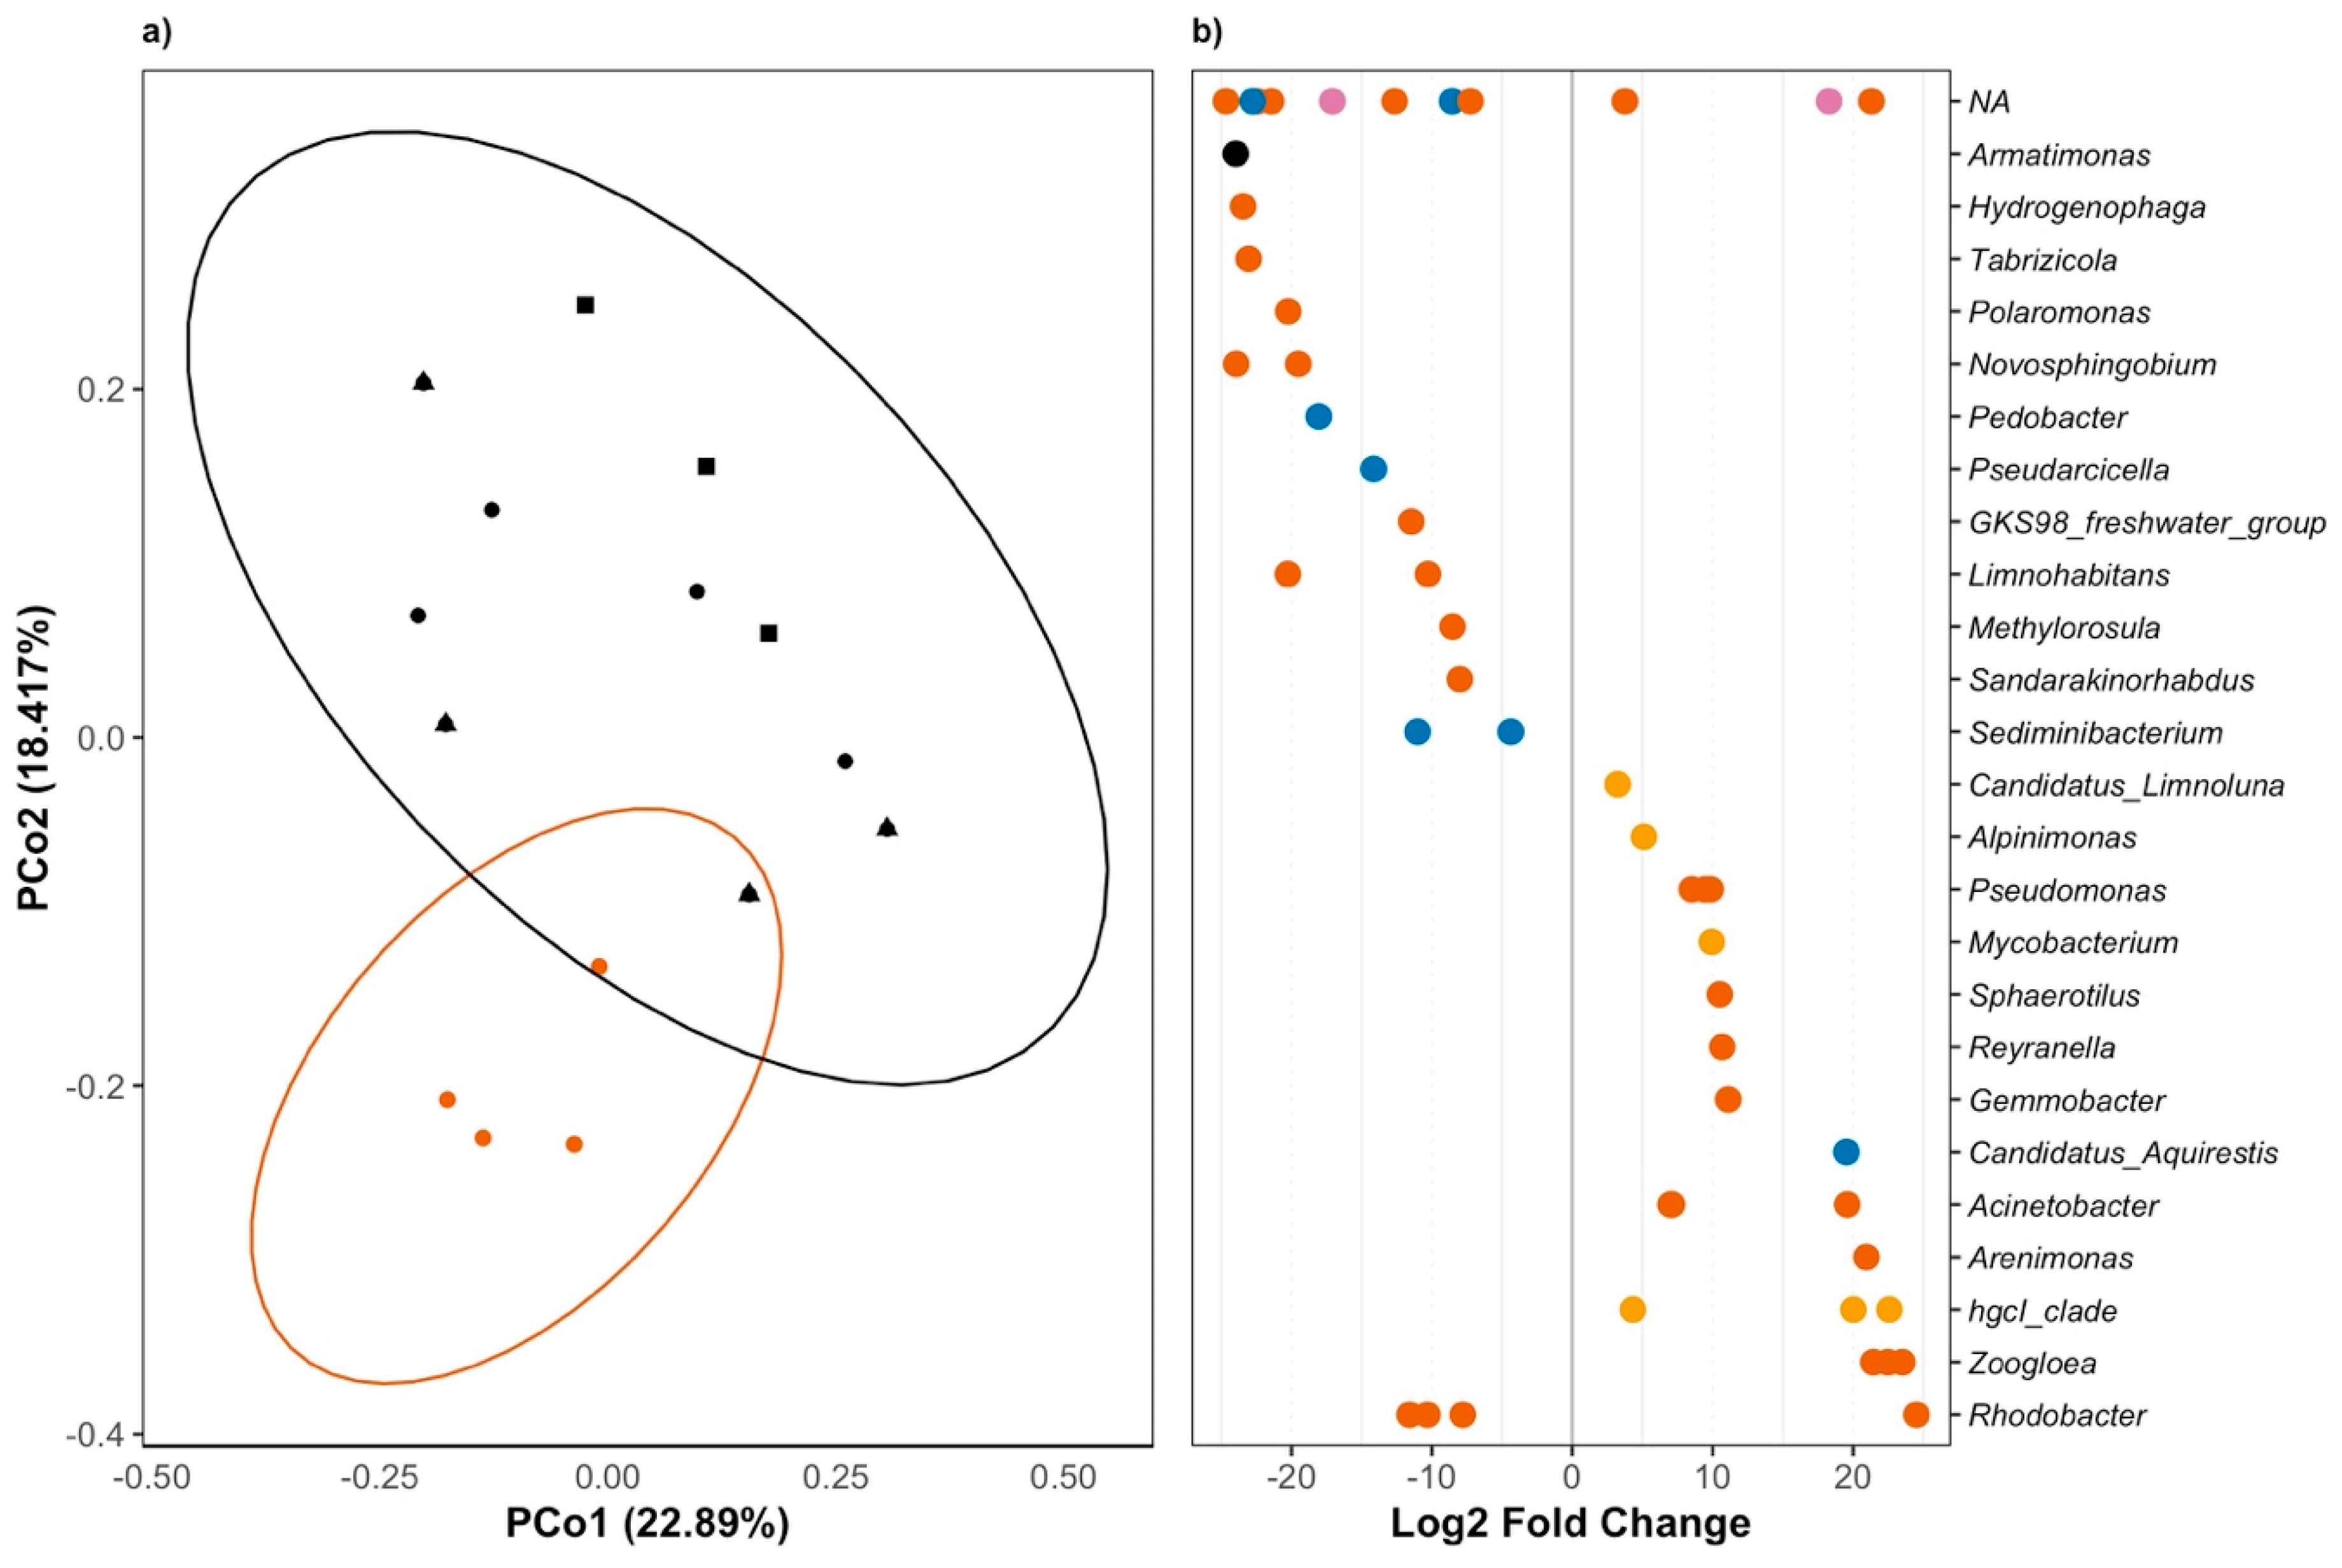
Interestingly, the only difference between agitated microcosms and still microcosms was the persistence of a small population of Verrucomicrobia in agitated water (Figure S3). Otherwise, the effect of triclosan was similar in both types of microcosm (triclosan:microcosm: F(1,14) = 1.16; Perm = 9999; R2 = 0.065; P = 0.27), which favors an overall increase of Actinobacteria in otherwise Proteobacteria-dominated communities (Figure S3). Again, the strongest effect was observed in microbial communities that were exposed to 10,000 ng/L (Figure 2B), where we observed a significant decrease in the abundance of twenty-five ASVs, including many identified as Proteobacteria and Bacteroidetes. We also found an increase of 19 ASVs, including Pseudomonas and Rhodobacter. Interestingly, while one Rhodobacter ASV increased in the presence of triclosan, three other Rhodobacter ASVs decreased in the presence of triclosan, which revealed the important variation in response to triclosan that can exist within a single genus.
We observed changes in abundance of specific taxa even though the lower triclosan concentrations did not alter overall community structure (Figure S4). Lower triclosan concentrations also selected for an increase in bacteria, such as Pseudomonas and Rhodobacter. While 10,000 ng/L favored the increase of one ASV identified as Acinetobacter, 1 and 10 ng/L enabled the selection of, respectively, four and three ASVs that were identified as Acinetobacter. Again, we repeated the above analyses after removing ASVs that were identified as Cyanobacteria and found no statistical differences between the two analyses (Figure S5). Taken together, these results show that a low concentration of triclosan can have a significant effect on microbial composition, even without impacting the overall community structure.
3.3. Triclosan Addition Does Not Increase Int1 Abundance in Freshwater Microcosms
We investigated whether triclosan would increase the abundance of integron 1, an integrase-based system linked to the horizontal gene transfer of antibiotic resistance genes because many antimicrobials are known to favor the spread of antibiotic resistance in the environment. We found that triclosan did not increase the relative abundance of int1 in any of the triclosan treatments used in this experiment, even at the highest triclosan concentration (F(3,12) = 0.551; P = 0.657), despite previous evidences suggesting that different antimicrobials can increase int1 relative abundance in microbial communities (see Section 4).
4. Discussion
The effect of triclosan on the emergence and spread of triclosan-resistant or tolerant bacteria in sediments has been well documented [17]. However, little is known about the possible effects of triclosan on microbial communities that are present in the water column as the antimicrobial gets released from sediments or from water sewage outflow. As human populations are more often exposed to microbial communities that are present in the water column via recreational use [40,41], understanding the impact of triclosan on these microbial populations is crucial from a public health perspective. Our study shows that, while larger triclosan concentrations that are comparable to those found in heavily polluted streams can alter the overall phylogenetic structure of surface water microbial communities, concentrations as low as 1 ng/L can significantly decrease microbial diversity and favor a specific type of bacteria that were previously linked to antibiotic resistance and disease.
We found that different levels of triclosan contamination can initiate specific responses in microbial populations. For example, we observed an increase in ASVs that were identified as Pseudomonas and Rhodobacter, two genera that were previously found to increase in zebrafish microbiomes impacted by triclosan [14]. In addition, while we observed two ASVs that were identified as Acinetobacter increased in abundance in communities exposed to 10,000 ng/L, we found three and four unique Acinetobacter ASVs to be enriched in the presence of 1 and 10 ng/L, respectively, demonstrating that lower concentrations of triclosan can, in fact, select for increased genetic variability within a taxon. Such an increase in genetic variability is necessary to fuel further evolution of resistance among microbial populations [42,43]. Although it is possible that the different Acinetobacter ASVs that were found in this study resulted from different 16S rRNA sequences being present in a single organism, Acinetobacter is not known to contain different 16S—or we would observe the same results at all concentrations where the genus is present. Such findings are especially important, since the genus is highly recombinogenic [35] and contains various antibiotic-resistant species pathogenic to humans or other organisms, even though we cannot confirm the pathogenicity of the bacterium while using current methodologies [44,45].
Triclosan was also reported to increase the frequency of horizontal gene transfer via conjugation [21], in addition to increasing the spread of resistance against clinical antibiotics via the co-selection between triclosan resistance genes and antibiotic resistance genes [17]. Despite this, we found that triclosan did not correlate with an increase in int1, which is an important genetic marker that is linked to the horizontal transfer of antibiotic resistance in the environment [24]. This result seems to confirm that triclosan resistance is more likely to result from inherent resistance to the antimicrobial [46], since we readily observed the selection of int1 elements in microbial communities that were exposed to streptomycin and arsenic in previous studies [28,30]; or to evolve via de novo mutation in bacterial lineages [46]; or via conjugation events not linked to int1 [17]. Further investigation will be required to see whether triclosan increases conjugation or resistance to other antibiotics in surface water similarly to what was found in sediments.
Our results also demonstrate that it is possible to study freshwater microbial populations in simple microcosms that are grown under ambient conditions and natural day-night cycles. Such experimental systems are easily repeatable and scalable to accommodate different experimental designs and experimental controls. Indeed, our results show that, even though microbial communities that are present in freshwater can change over time when grown in experimental settings (Figure S1), comparisons between experimental populations and control groups can clearly isolate the effect of specific environmental factors. For example, we found that microbial communities differ in still microcosms when compared to agitated microcosms; still microcosms enable the growth of bacteria that are associated with sediments or still water, such as Limnobacter [47] and Legionella [48]. Finally, the use of experimental control was crucial in this study to account for the possible presence of triclosan in the sampled water. To this end, we tried to minimize the possible presence of triclosan by sampling water three days after the last rainfall event (see methods for more details). In addition, the degradation of triclosan to 2,8-Dichlorobenzo-p-dioxin and other substances during the experiment could also affect how the microbial communities respond to triclosan [49,50]. Yet, the use of experimental controls growing in a similar environment enabled us to isolate the effect of a specific triclosan concentrations that were added to water samples.
While previous studies showed that triclosan can favor the growth of Cyanobacteria [4], our results demonstrate that other environmental factors may favor, or inhibit, the growth of the bacterium. Indeed, the fact that Cyanobacteria disappeared from our experimental population despite being present in the founding population and persisting in our pilot experiment (Figure S1), suggests that there might be a critical population size that is necessary for the establishment of this taxon or that certain microorganisms could inhibit Cyanobacterial growth, for instance, through biosurfactants that were produced by Pseudomonas and Bacillus [51,52].
5. Conclusions
Our results demonstrate that even small concentrations of triclosan that are readily observed in streams around the world can disrupt freshwater microbial communities. Triclosan also favored the preservation of genetic diversity within specific bacteria that are associated with disease emergence while decreasing the overall taxonomic diversity within a community. These results highlight the need to develop new methodologies to detect the presence and evolution of genetic variability within individual bacterial lineages.
Supplementary Materials
The following are available online at https://www.mdpi.com/2073-4441/11/5/961/s1, Figure S1: Establishing fresh water microbial communities in glass microcosm, Figure S2: Alpha diversity metrics in microbial communities exposed to different triclosan concentrations excluding Cyanobacteria sequences, Figure S3: Taxa composition of fresh water microbial communities exposed to triclosan, Figure S4: Changes in ASVs abundance in microbial communities affected by low concentrations of triclosan, Figure S5: The effect of triclosan on fresh water microbial communities excluding Cyanobacteria.
Author Contributions
Conceptualization, A.C., M.V., and G.G.P.; Methodology, A.C., D.A., M.E.D., and G.G.P.; Formal Analysis, A.C., D.A., and G.G.P.; Data Curation, G.G.P.; Writing—Original Draft Preparation, A.C., D.A., and G.G.P.; Writing—Review & Editing, M.E.D., M.V., and G.G.P.; Visualization, D.A., and G.G.P.; Supervision, G.G.P.; Project Administration, G.G.P.; Funding Acquisition, M.V., and G.G.P.
Funding
The work conducted in this study was supported by the Biology Department and the Bard Summer Research Institute of Bard College as well as the International Opportunity Fund from the Natural Environment Research Council of the UK (NERC: NE/K000926/1).
Acknowledgments
The authors would like to thank Maureen O’Callaghan-Scholl and Rebeca Patsey for technical assistance.
Conflicts of Interest
The authors declare that they have no competing interests.
References
- Dhillon, G.S.; Kaur, S.; Pulicharla, R.; Brar, S.K.; Cledón, M.; Verma, M.; Surampalli, R.Y. Triclosan: Current status, occurrence, environmental risks and bioaccumulation potential. Int. J. Environ. Res. Public. Health 2015, 12, 5657–5684. [Google Scholar] [CrossRef] [PubMed]
- Chattopadhyay, D. Antibacterial consumer products: How reliable are they? Resonance 2017, 22, 761–767. [Google Scholar] [CrossRef]
- Kolpin, D.W.; Furlong, E.T.; Meyer, M.T.; Thurman, E.M.; Zaugg, S.D.; Barber, L.B.; Buxton, H.T. Pharmaceuticals, hormones, and other organic wastewater contaminants in U.S. streams, 1999–2000: A national reconnaissance. Environ. Sci. Technol. 2002, 36, 1202–1211. [Google Scholar] [CrossRef] [PubMed]
- Drury, B.; Scott, J.; Rosi-Marshall, E.J.; Kelly, J.J. Triclosan exposure increases triclosan resistance and influences taxonomic composition of benthic bacterial communities. Environ. Sci. Technol. 2013, 47, 8923–8930. [Google Scholar] [CrossRef]
- Robertshaw, H.; Leppard, B. Contact dermatitis to triclosan in toothpaste. Contact Dermatitis 2007, 57, 383–384. [Google Scholar] [CrossRef]
- Yang, H.; Wang, W.; Romano, K.A.; Gu, M.; Sanidad, K.Z.; Kim, D.; Yang, J.; Schmidt, B.; Panigrahy, D.; Pei, R.; et al. A common antimicrobial additive increases colonic inflammation and colitis-associated colon tumorigenesis in mice. Sci. Transl. Med. 2018, 10, eaan4116. [Google Scholar] [CrossRef]
- Dayan, A.D. Risk assessment of triclosan [Irgasan®] in human breast milk. Food Chem. Toxicol. 2007, 45, 125–129. [Google Scholar] [CrossRef] [PubMed]
- Allmyr, M.; Adolfsson-Erici, M.; McLachlan, M.S.; Sandborgh-Englund, G. Triclosan in plasma and milk from Swedish nursing mothers and their exposure via personal care products. Sci. Total Environ. 2006, 372, 87–93. [Google Scholar] [CrossRef]
- Bever, C.S.; Rand, A.A.; Nording, M.; Taft, D.; Kalanetra, K.M.; Mills, D.A.; Breck, M.A.; Smilowitz, J.T.; German, J.B.; Hammock, B.D. Effects of triclosan in breast milk on the infant fecal microbiome. Chemosphere 2018, 203, 467–473. [Google Scholar] [CrossRef] [PubMed]
- Veldhoen, N.; Skirrow, R.C.; Osachoff, H.; Wigmore, H.; Clapson, D.J.; Gunderson, M.P.; Van Aggelen, G.; Helbing, C.C. The bactericidal agent triclosan modulates thyroid hormone-associated gene expression and disrupts postembryonic anuran development. Aquat. Toxicol. 2006, 80, 217–227. [Google Scholar] [CrossRef]
- Capkin, E.; Ozcelep, T.; Kayis, S.; Altinok, I. Antimicrobial agents, triclosan, chloroxylenol, methylisothiazolinone and borax, used in cleaning had genotoxic and histopathologic effects on rainbow trout. Chemosphere 2017, 182, 720–729. [Google Scholar] [CrossRef]
- Foran, C.M.; Bennett, E.R.; Benson, W.H. Developmental evaluation of a potential non-steroidal estrogen: Triclosan. Mar. Environ. Res. 2000, 50, 153–156. [Google Scholar] [CrossRef]
- Falisse, E.; Voisin, A.-S.; Silvestre, F. Impacts of triclosan exposure on zebrafish early-life stage: Toxicity and acclimation mechanisms. Aquat. Toxicol. 2017, 189, 97–107. [Google Scholar] [CrossRef]
- Gaulke, C.A.; Barton, C.L.; Proffitt, S.; Tanguay, R.L.; Sharpton, T.J. Triclosan Exposure Is Associated with Rapid Restructuring of the Microbiome in Adult Zebrafish. PLoS ONE 2016, 11, e0154632. [Google Scholar] [CrossRef] [PubMed]
- Narrowe, A.B.; Albuthi-Lantz, M.; Smith, E.P.; Bower, K.J.; Roane, T.M.; Vajda, A.M.; Miller, C.S. Perturbation and restoration of the fathead minnow gut microbiome after low-level triclosan exposure. Microbiome 2015, 3. [Google Scholar] [CrossRef]
- Richmond, E.K.; Grace, M.R.; Kelly, J.J.; Reisinger, A.J.; Rosi, E.J.; Walters, D.M. Pharmaceuticals and personal care products (PPCPs) are ecological disrupting compounds (EcoDC). Elem Sci Anth 2017, 5. [Google Scholar] [CrossRef]
- Carey, D.E.; McNamara, P.J. The impact of triclosan on the spread of antibiotic resistance in the environment. Front. Microbiol. 2014, 5. [Google Scholar] [CrossRef]
- Nietch, C.T.; Quinlan, E.L.; Lazorchak, J.M.; Impellitteri, C.A.; Raikow, D.; Walters, D. Effects of a chronic lower range of triclosan exposure on a stream mesocosm community. Environ. Toxicol. Chem. 2013, 32, 2874–2887. [Google Scholar] [CrossRef] [PubMed]
- Chuanchuen, R.; Beinlich, K.; Hoang, T.T.; Becher, A.; Karkhoff-Schweizer, R.R.; Schweizer, H.P. Cross-Resistance between Triclosan and Antibiotics inPseudomonas aeruginosa Is Mediated by Multidrug Efflux Pumps: Exposure of a Susceptible Mutant Strain to Triclosan Selects nfxB Mutants Overexpressing MexCD-OprJ. Antimicrob. Agents Chemother. 2001, 45, 428–432. [Google Scholar] [CrossRef] [PubMed]
- Mcmurry, L.M.; Oethinger, M.; Levy, S.B. Overexpression of marA, soxS, or acrAB produces resistance to triclosan in laboratory and clinical strains of Escherichia coli. FEMS Microbiol. Lett. 1998, 166, 305–309. [Google Scholar] [CrossRef] [PubMed]
- Jutkina, J.; Marathe, N.P.; Flach, C.-F.; Larsson, D.G.J. Antibiotics and common antibacterial biocides stimulate horizontal transfer of resistance at low concentrations. Sci. Total Environ. 2018, 616–617, 172–178. [Google Scholar] [CrossRef] [PubMed]
- Butler, E.; Whelan, M.J.; Ritz, K.; Sakrabani, R.; van Egmond, R. Effects of triclosan on soil microbial respiration. Environ. Toxicol. Chem. 2011, 30, 360–366. [Google Scholar] [CrossRef]
- Zaayman, M.; Siggins, A.; Horne, D.; Lowe, H.; Horswell, J. Investigation of triclosan contamination on microbial biomass and other soil health indicators. FEMS Microbiol. Lett. 2017, 364. [Google Scholar] [CrossRef]
- Gillings, M.R.; Gaze, W.H.; Pruden, A.; Smalla, K.; Tiedje, J.M.; Zhu, Y.-G. Using the class 1 integron-integrase gene as a proxy for anthropogenic pollution. ISME J. 2015, 9, 1269–1279. [Google Scholar] [CrossRef] [PubMed]
- Sissons, C.H.; Wong, L.; Cutress, T.W. Inhibition by ethanol of the growth of biofilm and dispersed microcosm dental plaques. Arch. Oral Biol. 1996, 41, 27–34. [Google Scholar] [CrossRef]
- Wadhwani, T.; Desai, K.; Patel, D.; Lawani, D.; Bahaley, P.; Joshi, P.; Kothari, V. Effect of various solvents on bacterial growth in context of determining MIC of various antimicrobials. Internet J. Microbiol. 2009, 7, 1–8. [Google Scholar]
- Wilson, B.; Chen, R.F.; Cantwell, M.; Gontz, A.; Zhu, J.; Olsen, C.R. The partitioning of Triclosan between aqueous and particulate bound phases in the Hudson River Estuary. Mar. Pollut. Bull. 2009, 59, 207–212. [Google Scholar] [CrossRef] [PubMed]
- Dahan, D.; Jude, B.A.; Lamendella, R.; Keesing, F.; Perron, G.G. Exposure to Arsenic Alters the Microbiome of Larval Zebrafish. Front. Microbial. 2018, 9. [Google Scholar] [CrossRef] [PubMed]
- Callahan, B.J.; McMurdie, P.J.; Rosen, M.J.; Han, A.W.; Johnson, A.J.A.; Holmes, S.P. DADA2: High-resolution sample inference from Illumina amplicon data. Nat. Methods 2016, 13, 581–583. [Google Scholar] [CrossRef] [Green Version]
- Pindling, S.; Azulai, D.; Zheng, B.; Dahan, D.; Perron, G.G. Dysbiosis and early mortality in zebrafish larvae exposed to subclinical concentrations of streptomycin. FEMS Microbiol. Lett. 2018, 365. [Google Scholar] [CrossRef]
- Callahan, B.J.; McMurdie, P.J.; Holmes, S.P. Exact sequence variants should replace operational taxonomic units in marker-gene data analysis. ISME J. 2017, 11, 2639–2643. [Google Scholar] [CrossRef] [Green Version]
- Sun, D.-L.; Jiang, X.; Wu, Q.L.; Zhou, N.-Y. Intragenomic heterogeneity of 16S rRNA genes causes overestimation of prokaryotic diversity. Appl. Environ. Microbial. 2013, 79, 5962–5969. [Google Scholar] [CrossRef]
- Schliep, K.P. Phangorn: Phylogenetic analysis in R. Bioinformatics 2011, 27, 592–593. [Google Scholar] [CrossRef]
- Wittebolle, L.; Marzorati, M.; Clement, L.; Balloi, A.; Daffonchio, D.; Heylen, K.; De Vos, P.; Verstraete, W.; Boon, N. Initial community evenness favours functionality under selective stress. Nature 2009, 458, 623–626. [Google Scholar] [CrossRef] [PubMed]
- Lozupone, C.; Knight, R. UniFrac: A new phylogenetic method for comparing microbial communities. Appl. Environ. Microbial. 2005, 71, 8228–8235. [Google Scholar] [CrossRef]
- Lozupone, C.A.; Hamady, M.; Kelley, S.T.; Knight, R. Quantitative and Qualitative β Diversity Measures Lead to Different Insights into Factors That Structure Microbial Communities. Appl. Environ. Microbiol. 2007, 73, 1576–1585. [Google Scholar] [CrossRef] [PubMed]
- Oksanen, J.; Blanchet, F.G.; Kindt, R.; Legendre, P.; Minchin, P.R.; Simpson, G.L.; Solymos, P.; Stevens, M.H.H.; Wagner, H. Package ‘vegan’. 2015. Available online: http://vegan.r-forge.r-project.org (accessed on 5 May 2019).
- McMurdie, P.J.; Holmes, S. Waste not, want not: Why rarefying microbiome data is inadmissible. PLoS Comput. Biol. 2014, 10, e1003531. [Google Scholar] [CrossRef] [PubMed]
- Gaze, W.H.; Zhang, L.; Abdouslam, N.A.; Hawkey, P.M.; Calvo-Bado, L.; Royle, J.; Brown, H.; Davis, S.; Kay, P.; Boxall, A.B.; et al. Impacts of anthropogenic activity on the ecology of class 1 integrons and integron-associated genes in the environment. ISME J. 2011, 5, 1253–1261. [Google Scholar] [CrossRef] [Green Version]
- Leonard, A.F.C.; Singer, A.; Ukoumunne, O.C.; Gaze, W.H.; Garside, R. Is it safe to go back into the water? A systematic review and meta-analysis of the risk of acquiring infections from recreational exposure to seawater. Int. J. Epidemiol. 2018, 47, 572–586. [Google Scholar] [CrossRef]
- Leonard, A.F.C.; Zhang, L.; Balfour, A.J.; Garside, R.; Gaze, W.H. Human recreational exposure to antibiotic resistant bacteria in coastal bathing waters. Environ. Int. 2015, 82, 92–100. [Google Scholar] [CrossRef] [PubMed]
- Perron, G.G.; Inglis, R.F.; Pennings, P.S.; Cobey, S. Fighting microbial drug resistance: A primer on the role of evolutionary biology in public health. Evol. Appl. 2015, 8, 211–222. [Google Scholar] [CrossRef] [PubMed]
- Perron, G.G.; Gonzalez, A.; Buckling, A. Source-sink dynamics shape the evolution of antibiotic resistance and its pleiotropic fitness cost. Proc. Biol. Sci. 2007, 274, 2351–2356. [Google Scholar] [CrossRef] [PubMed]
- Pirnay, J.-P.; Matthijs, S.; Colak, H.; Chablain, P.; Bilocq, F.; Van Eldere, J.; De Vos, D.; Zizi, M.; Triest, L.; Cornelis, P. Global Pseudomonas aeruginosa biodiversity as reflected in a Belgian river. Environ. Microbial. 2005, 7, 969–980. [Google Scholar] [CrossRef] [PubMed]
- De Vos, D.; Pirnay, J.-P.; Bilocq, F.; Jennes, S.; Verbeken, G.; Rose, T.; Keersebilck, E.; Bosmans, P.; Pieters, T.; Hing, M.; et al. Molecular Epidemiology and Clinical Impact of Acinetobacter calcoaceticus-baumannii Complex in a Belgian Burn Wound Center. PLoS ONE 2016, 11, e0156237. [Google Scholar] [CrossRef] [PubMed]
- Birošová, L.; Mikulášová, M. Development of triclosan and antibiotic resistance in Salmonella enterica serovar Typhimurium. J. Med. Microbiol. 2009, 58, 436–441. [Google Scholar] [CrossRef] [Green Version]
- Song, B.; Kerkhof, L.J.; Häggblom, M.M. Characterization of bacterial consortia capable of degrading 4-chlorobenzoate and 4-bromobenzoate under denitrifying conditions. FEMS Microbiol. Lett. 2002, 213, 183–188. [Google Scholar] [CrossRef] [PubMed] [Green Version]
- Lu, X.-M.; Lu, P.-Z. Characterization of bacterial communities in sediments receiving various wastewater effluents with high-throughput sequencing analysis. Microb. Ecol. 2014, 67, 612–623. [Google Scholar] [CrossRef] [PubMed]
- Buth, J.M.; Steen, P.O.; Sueper, C.; Blumentritt, D.; Vikesland, P.J.; Arnold, W.A.; McNeill, K. Dioxin photoproducts of triclosan and its chlorinated derivatives in sediment cores. Environ. Sci. Technol. 2010, 44, 4545–4551. [Google Scholar] [CrossRef] [PubMed]
- Aranami, K.; Readman, J.W. Photolytic degradation of triclosan in freshwater and seawater. Chemosphere 2007, 66, 1052–1056. [Google Scholar] [CrossRef] [PubMed]
- Kodani, S.; Imoto, A.; Mitsutani, A.; Murakami, M. Isolation and identification of the antialgal compound, harmane (1-methyl-β-carboline), produced by the algicidal bacterium, Pseudomonas sp. K44-1. J. Appl. Phycol. 2002, 14, 109–114. [Google Scholar] [CrossRef]
- Wright, S.J.L.; Thompson, R.J. Bacillus volatiles antagonize cyanobacteria. FEMS Microbiol. Lett. 1985, 30, 263–267. [Google Scholar] [CrossRef]
Figure 1.
Alpha diversity metrics in microbial communities exposed to different triclosan concentrations. (a) Observed amplicon sequence variants (ASVs) (F(1,13) = 10.262; adj-P = 0.014). (b) Shannon diversity (F(1,13) = 11.563; adj-P = 0.0095). All of the metrics are plotted against triclosan concentration with controls microbiomes shown in yellow, microbial communities exposed to 1.0 ng/L in orange, 10 ng/L in vermillion, and 10,000 ng/L in red, respectively. Lines represent median and hinges indicate first and third quartiles.

Figure 2.
The effect of triclosan on fresh water microbial communities. (a) Principle Coordinate Analyses (PCoA) of unweighted UniFrac scores shows significant dissimilarity between microbial communities exposed to 10,000 ng/L (shown in red circles) compared to communities exposed to 10 ng/L (black lozenges), communities exposed to 1 ng/L (black triangles), and controls communities (ADONIS; Perm = 9999; R2 = 0.169; F(1,14) = 2.97; adj-P = 0.0002). Axes show the percent variation explained by the principle components estimated from the linear correlation between taxa composition and identity in all samples. (b) Changes in ASVs abundance in the presence of 10,000 ng/L of triclosan (DESeq2; P’s < 0.01). Positive fold changes show an increase in the relative abundance of genera in the presence of 10,000 ng/L of triclosan. Genus level classification is provided where available while phyla are shown as follow: Proteobacteria in vermilion; Bacteroidetes in blue; Actinobacteria in orange; Armatimonadetes in black; and Verrucomicrobia in pink.


Table 1.
Mean (s.d.) of alpha-diversity metrics under the effect of triclosan.
| Treatment | Observed | Shannon | ||
|---|---|---|---|---|
| Full | No Chloroplast | Full | No Chloroplast | |
| Control | 161.33 (10.69) | 148.33 (9.45) | 4.18 (0.12) | 4.10 (0.12) |
| 1 ng/L | 152.50 (10.28) | 141.00 (43.49) | 3.96 (0.16) | 3.90 (0.15) |
| 10 ng/L | 180.50 (44.38) | 168.00 (39.75) | 3.98 (0.13) | 3.94 (0.13) |
| 10,000 ng/L | 108.50 (13.34) | 101.25 (10.14) | 3.53 (0.41) | 3.49 (0.42) |
© 2019 by the authors. Licensee MDPI, Basel, Switzerland. This article is an open access article distributed under the terms and conditions of the Creative Commons Attribution (CC BY) license (http://creativecommons.org/licenses/by/4.0/).
Share and Cite
MDPI and ACS Style
Clarke, A.; Azulai, D.; Dueker, M.E.; Vos, M.; Perron, G.G. Triclosan Alters Microbial Communities in Freshwater Microcosms. Water 2019, 11, 961. https://doi.org/10.3390/w11050961
AMA Style
Clarke A, Azulai D, Dueker ME, Vos M, Perron GG. Triclosan Alters Microbial Communities in Freshwater Microcosms. Water. 2019; 11(5):961. https://doi.org/10.3390/w11050961
Chicago/Turabian StyleClarke, Alexandra, Daniella Azulai, M. Elias Dueker, Michiel Vos, and Gabriel G. Perron. 2019. "Triclosan Alters Microbial Communities in Freshwater Microcosms" Water 11, no. 5: 961. https://doi.org/10.3390/w11050961
Note that from the first issue of 2016, this journal uses article numbers instead of page numbers. See further details here.