Estimation of Sediment Yield and Maximum Outflow Using the IntErO Model in the Sarada River Basin of Nepal


1
School of Environmental and Rural Science, University of New England, Armidale, NSW 2351, Australia
2
National Maize Research Program, Nepal Agricultural Research Council, P.O.B. 44209 Chitwan, Nepal
3
Geography, Faculty of Philosophy, University of Montenegro, Bojovica, 81400 Niksic, Montenegro
4
University of Donja Gorica, Donja Gorica, 81000 Podgorica, Montenegro
*
Author to whom correspondence should be addressed.
Water 2019, 11(5), 952; https://doi.org/10.3390/w11050952
Submission received: 9 April 2019
/
Revised: 29 April 2019
/
Accepted: 30 April 2019
/
Published: 7 May 2019
(This article belongs to the Section Water Resources Management, Policy and Governance)
Abstract
:Soil erosion is a severe environmental problem worldwide as it washes away the fertile topsoil and reduces agricultural production. Nepal, being a hilly country, has significant erosion disputes as well. It is important to cognise the soil erosion processes occurring in a river basin to manage the erosion severity and plan for better soil conservation programs. This paper seeks to calculate the sediment yield and maximum outflow from the Sarada river basin located in the western hills of Nepal using the computer-graphic Intensity of Erosion and Outflow (IntErO) model. Asymmetry coefficient of 0.63 was calculated, which suggests a possibility of large floods to come in the river basin in the future whereas the maximum outflow from the river basin was 1918 m³ s−1. An erosion coefficient value of 0.40 was obtained, which indicates surface erosion of medium strength prevails in the river basin. Similarly, the gross soil loss rate of 10.74 Mg ha−1 year−1 was obtained with the IntErO modeling which compares well with the soil loss from the erosion plot measurements. The IntErO model was used for the very first time to calculate soil erosion rates in the Nepalese hills and has a very good opportunity to be applied in similar river basins.
1. Introduction
Soil erosion is regarded as one of the most pervasive environmental problems affecting agricultural production and intimidating the sustainability of natural ecosystems and human societies [1,2,3]. Soil erosion threatens the sustainability of the human societies and the United Nations goals for sustainable development that must include a land degradation neutrality and restoration program as part of the Sustainable Development Goals (SDGs) [4,5]. It has been identified as one of the 10 major soil threats in the world by Food and Agriculture Organisation of the United Nations and Intergovernmental Technical Panel on Soils, Rome, Italy [6]. Due to its deleterious effects on soil fertility, vegetation, sediment runoff and likely flood menace at a place, studies on soil erosion and sediment yield are of paramount importance in the world [7]. Agriculture is the mainstay of the Nepalese economy as 65.6% of the population is actively engaged in agriculture [8] but the loss of fertile soil by erosion is hindering the agricultural development there. Owing to negative effects on the quality of life on soil and water, soil erosion through water is of great importance to the Nepalese terrains [9]. Being a mountainous country defined by rugged topography and elevation ranging from 60 m to 8848 m, erratic rainfall events mostly concentrated during monsoon, and conventional agricultural practices, Nepal is prone to several forms of soil erosion [10]. Intense rainfall events are much more likely during the pre-monsoon season; they often come with strong winds and hailstorms too [11]. Before the monsoon begins, croplands are ploughed repeatedly leaving the lands bare without vegetation, which further aggravates the soil loss [12]. Variation in the landscape, uneven rainfall distribution throughout the country, long-term land use land cover changes, and different population pressure across the nation result in varying rates of soil loss.
Erosion starts with the detachment of soil particles followed by their transport and deposition. The dimension and amount of soil sediments carried increase with the increase in velocity and transport capacity of the overland flow, whereas a decrease in the transport capacity will result in deposition of the sediments [13,14]. Precise understanding and computation of soil loss at the watershed scale are essential to address numerous environmental issues brought by the soil sediments collected and transported out of the river basins [7]. Soil loss and sediment supply are important issues nowadays, with more research undertaken to develop better soil erosion models that can better predict soil loss at watershed and basin levels [14]. This will identify the key hot spots of soil erosion at a place so that conservation activities can be targeted to achieve better results. Although being two of the most accepted and widely used soil erosion models, Universal Soil Loss Equation (USLE) and Revised Universal Soil Loss Equation (RUSLE) do not provide information on sediment delivery to river courses [15]; they only calculate long-term soil loss at a place, so alternative erosion models that can predict sediment yield and maximum outflow at a watershed scale is a must [13]. To quantify the intensity of soil erosion and maximum outflow at the basin outlet, a number of soil erosion models have been developed worldwide [16,17,18]. The Intensity of Erosion and Outflow (IntErO) model [19] is employed here to calculate the soil erosion rate and maximum outflow because of its simplicity and its ability to handle large datasets.
This paper, thus, aims to predict soil erosion intensity and maximum outflow from the Sarada river basin of Nepal using the IntErO model. The river basin is unique as it encompasses a variety of land use and provides a range of environmental and biological functions. However, the erosion rates have increased through the years; the ultimate effects seen in the form of reduced agricultural productivity in the study area. Thus, it is urgent to calculate the intensity of soil erosion at the basin outlet in the study area so that immediate soil and water conservation activities could be imposed to alleviate the problem. In combination with other soil erosion models, the IntErO model can be used to understand the erosion severity in similar river basins throughout the world. To our knowledge, the IntErO model has been implemented for the very first time in South Asia to calculate the sediment yield, and the findings of this study would be beneficial to the land use planners for a better understanding of the soil erosion severity and to implement proper soil and water conservation policies.
2. Materials and Methods
2.1. Study Area and Data
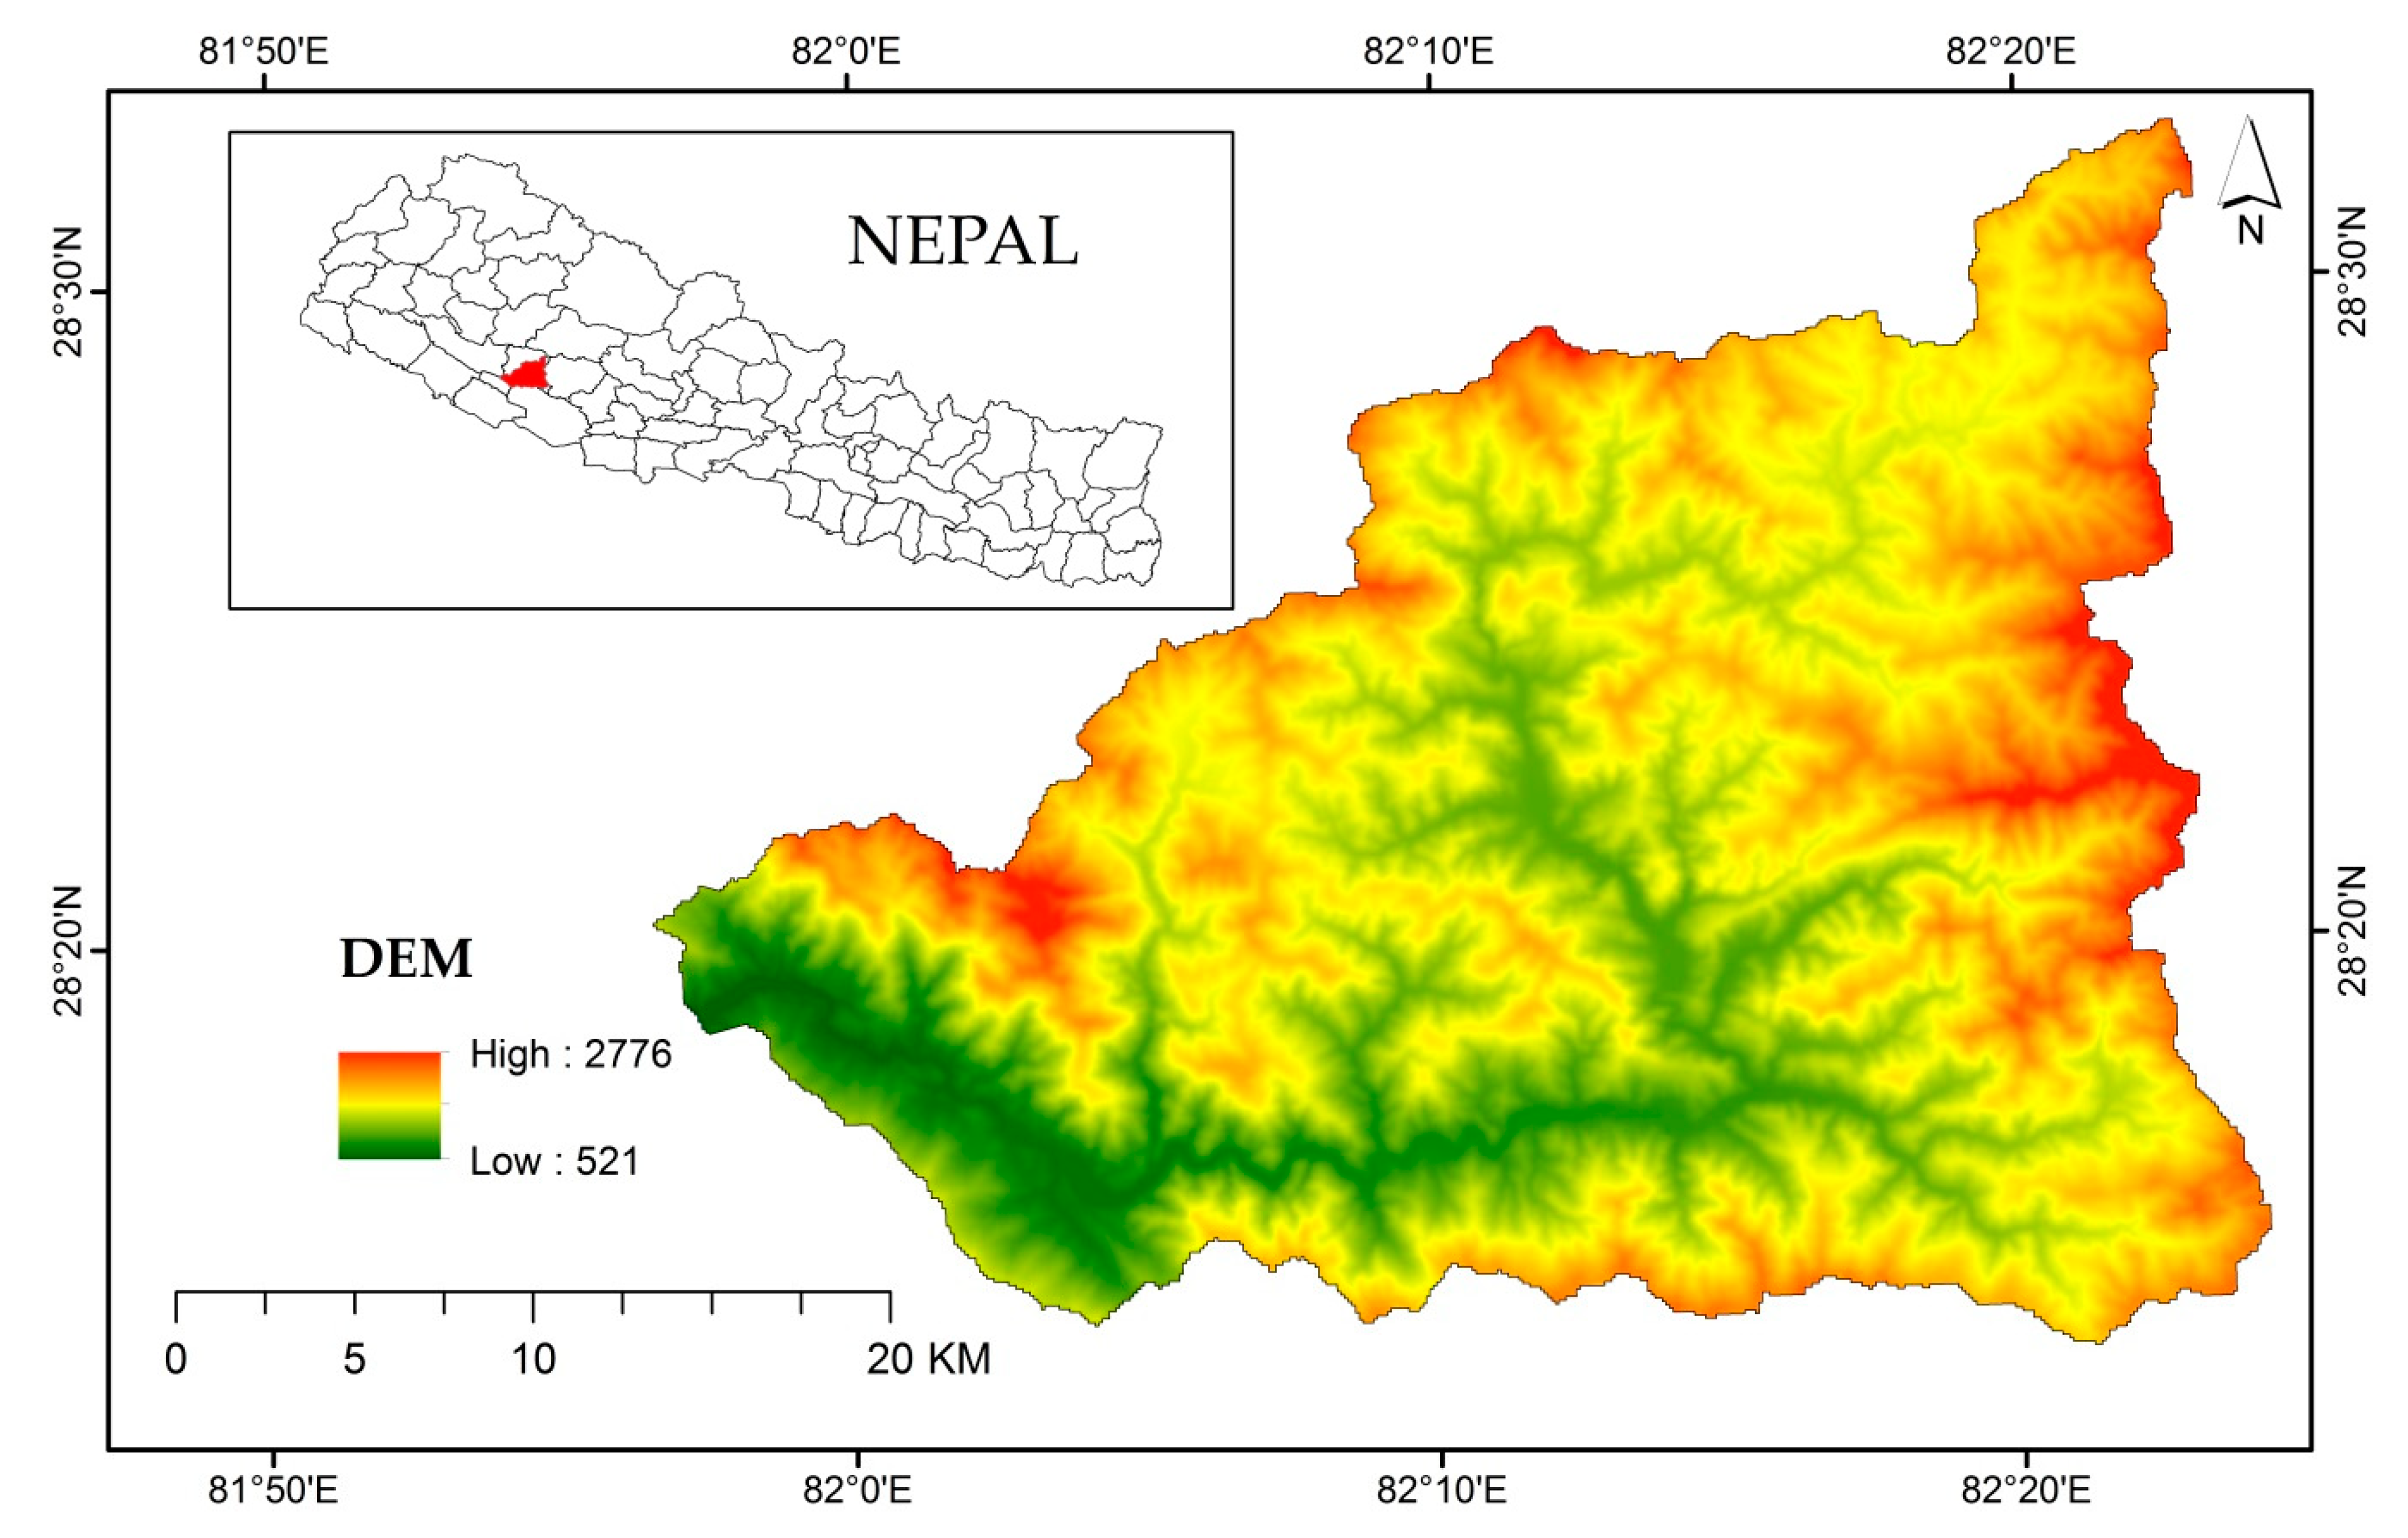
The study area covers Sarada river basin, located at 28°13’45” and 28°32’21” north latitudes and 81°56’33” and 82°24’13” east longitudes (Figure 1). The total area covered by the river basin is 872 km2 and encompasses four out of five physiographic regions of Nepal; Terai Plains (521–700 m), Siwalik Hills (700–1500 m), Middle Mountains (1500–2700 m), and High Mountains (2700–2776 m). Elevation of the study area ranges from 521 m in the south to 2776 m in the North and covers four districts of western Nepal, namely Salyan, Rolpa, Dang, and Surkhet. The length of the watershed, O, is 208.16 km and natural length of the main watercourse, Lv, is 64.39 km.
Data sources used were the rainfall and temperature data from the Department of Hydrology and Meteorology, Nepal; geological map of Nepal from International Centre for Integrated Mountain Development [20]; and the land use map prepared by Chalise and Kumar [21]; whereas secondary soil data as pedological map were acquired through the National Land Use Project of Ministry of Land Management, Cooperatives and Poverty Alleviation, Nepal.
2.2. Soil Erosion Model
A number of soil erosion models have been developed and tested at worldwide scale. Some of these are Chemical Runoff and Erosion from Agricultural Management Systems (CREAMS) [22], Areal Nonpoint Source Watershed Environment Response Simulation (ANSWERS) [23], Agricultural Nonpoint Source Pollution Model (AGNPS) [24], Water Erosion Prediction Project (WEPP) [25], USLE [26,27], Modified Universal Soil Loss Equation [28], and RUSLE [29]. Similarly, Sediment Delivery Ratio (SDR) [30,31], Transport Limiting Sediment Delivery (TLSD) [23,32], Unit Stream Power Erosion and Deposition model (USPED) [33], and Sediment Distributed Delivery (SEDD) [34] have been used to model the sediment removal, transportation, and outflow. Employing soil erosion models to estimate the soil erosion severity at a place is gaining popularity nowadays as field-based erosion studies are tedious, costly, and take a considerable amount of time. Instead, soil erosion models can assess the soil loss within a short time, provided data are available handy. We calculated the soil loss of the study area using the IntErO and RUSLE model, and then compared those with real soil loss observations.
2.2.1. IntErO Model
The IntErO model uses the Erosion Potential Method (EPM) in its algorithm background. The IntErO, an upgrading of the River Basins [35] and the Surface and Distance Measuring [36] programs, is simple in handling and can be used to calculate a large number of data with the processing of 25 input parameters in receiving 22 result parameters (coefficient of the river basin form, A; coefficient of the watershed development, m; average river basin width, B; (A) symmetry of the river basin, a; density of the river network of the basin, G; coefficient of the river basin tortuousness, K; average river basin altitude, Hsr; average elevation difference of the river basin, D; average river basin decline, Isr; the height of the local erosion base of the river basin, Hleb; coefficient of the erosion energy of the river basin’s relief, Er; coefficient of the region’s permeability, S1; coefficient of the vegetation cover, S2; analytical presentation of the water retention in inflow, W; energetic potential of water flow during torrent rains, 2gDF½; maximal outflow from the river basin, Qmax; temperature coefficient of the region, T; coefficient of the river basin erosion, Z; production of erosion material in the river basin, Wyear; coefficient of the deposit retention, Ru; real soil losses, Gyear; and real soil losses per km−2, Gyear km−2). The model considers six factors related to lithology (rocks permeability in percent: fp, permeable; fpp semipermeable, fo, low permeability) and soil type (erodibility coefficient Y), topographic and relief data (I coefficient), monthly mean and annual precipitation (P coefficient), temperatures annual averages (t coefficient), land cover data (Xa coefficient), and the state of erosion patterns and development of the watercourse network (ϕ coefficient). Each of these coefficients requires a thorough evaluation in several steps: Data acquisition, analysis, adaptation, and their integration into the equations of the model.
The annual volume of soil detached due to soil erosion (Wyear) was calculated by the following equation:
where Wyear is the total annual erosion (m3 year−1), T is the temperature coefficient, Hyear is average annual rainfall (mm), Z is the erosion coefficient, and F is watershed area (km2). T is calculated using the equation, T = √ (t/10 + 0.1), where t is the mean annual temperature (°C).
Wyear = T × Hyear × π × √ (Z3) × F
The Z coefficient, which describes the intensity of the erosion process, can be classified according to the degree of erosion (Table 1).
The Z coefficient is calculated using the following equation:
where Xa is the coefficient of soil protection and is non-dimensional parameter in relation with the vegetation cover and catchment’s land use and it varies from 0.05 to 1. The values of this parameter are obtained by adaptation of the land use map of the Sarada river basin to the Erosion Potential Method guidelines and according to existing values in previous studies [38,39,40,41]. Thus, values of the coefficient Xa have been attributed to each unit of land use (Table 2).
Z = Y × Xa (ϕ + √ Isr)
Y is the coefficient of soil erodibility. It depends on the pedological and lithological characteristics of the watershed and indicates the resistance of soils to erosion. The values of this non-dimensional factor can be determined either by laboratory experimentation or by field measurements [36,41] and usually ranges from 0.25 to 2. In this study, we used the soil map data and the geological map of the study area to evaluate the Y factor. Subsequently, coefficient values were assigned to each soil type based on the EPM guidelines and previous studies [39,40,41,42,43,44]. In the Table 2, we present the Y values attributed to each soil type in the Sarada river basin.
ϕ is a coefficient that depends on the active erosion and degree of extension of the forms of linear erosion and mass movements. It is a factor without dimensional unit with values ranging from 0.1 to 1 [19,37,45]. In our study area, this parameter is evaluated based on the erosion pattern map of the Sarada river basin, and each type of erosion form has taken on a value of ϕ according to the guidelines of the EPM method [39,40,41]. In calculating Z, Y, Xa, and φ, the weighted average value was used to calculate the mean value from the all the polygons with various values.
Isr is the average basin slope of the study area expressed in percentage. This parameter is extracted from the DEM of 30 m × 30 m.
The total volume of sediment produced in the different areas of the watershed does not fully reach downstream. A portion is redeposited in streams or other areas of the basin; therefore, it is essential to calculate the specific real sediment production (Gyear) in m3 km−2 year−1 by the following equation:
Gyear = Wyear × Ru
The sediment delivery ratio was calculated using the following equation:
where O, D, and Lv are the perimeter, average difference of elevation, and length of the river basins, respectively.
Ru = √(O × D)/[0.25 ×(Lv + 10)]
The maximum outflow, Qmax, was calculated using the following formula [19]:
where A is river basin shape coefficient and is computed by A = 0.095 × O/Lv; S1 is the coefficient of water permeability of the area calculated from the equation S1 = 0.4 × fp + 0.7 × fpp + 1.0 × fo; fp, fpp, and fo are the parts of the river basin that consist rocks of high, medium, and low permeability, respectively; S2 is vegetation cover coefficient computed from the equation S2 = 0.6 × fs + 0.8 × ft + 1.0 × fg; fs, ft, and fg are the parts of the river basin under forest (fs), grass, meadows, pastureland and orchards (ft), and bare land, plough land, and soils without grass vegetation (fg); W is analytical expression of inflowing water retention and is presented by the equation W = hb (15 − 22 × hb − 0.3 × √Lv); hb is torrential rain volume in meters, g is acceleration due to gravity (m s−2), D is mean height difference of the basin in meters, and F is basin area in km2.
Qmax = A × S1 × S2 × W × √(2 × g × D × F)
2.2.2. RUSLE Model
RUSLE calculates the soil loss by a river basin using the following equation given by Renard et al. [46]:
where E is the estimated average soil erosion (Mg ha−1 year−1), R is the rainfall factor (MJ mm ha−1 h−1 year−1), K is the soil erodibility factor (t ha h ha−1 MJ−1 mm−1), LS are the combined slope length and slope steepness factors (dimensionless), C is the cover management factor (dimensionless), and P is the support practice factor (dimensionless).
E = R × K × LS × C × P
R factor computes the effect of rainfall impact on soil erosion [47]. Average annual rainfall data collected from 40 meteorological stations around the study area were interpolated using the kriging tool in ArcGIS to prepare rainfall and R factor map using Equation (7) [48]. The kriging tool was used because it calculates the best un-biased predictor of values at non-sampled areas [49,50].
where r is annual rainfall in mm.
R = 38.5 + 0.35r
The K factor represents the soil susceptibility to detachment and erosion caused by the forces of rainfall and runoff water [15]. K values were assigned to soil textural classes as described by Ligonja and Shrestha [51] and Wall et al. [52].
The slope length (L) and steepness (S) factors, also called the topographic factors, represent the effects of slope length and steepness on soil erosion, respectively. The following equations were used to calculate the L factor [26] and S factor [53]:
where cell size = grid cell size (20 m for this study), m = 0.2 to 0.5 (0.2 for slopes less than 1%, 0.3 for 1–3%, 0.4 for 3–4.5%, and 0.5 for slopes exceeding 4.5%);
where s is the slope in per cent.
L = (Cell size/22.13)m
S = 0.0138 + 0.0097 s + 0.00138 s2
The C factor represents the impacts of cropping and related management practices on the erosion severity of a place [29,54], whereas the P factor is defined as the ratio of soil loss with particular support practice to the loss with row cultivation upslope and downslope [26]. The C and P values were assigned as per the land uses [26,55,56] (Table 3).
Soil erosion experimental plots with the maize planting were also established in the same river basin to compare the soil erosion rates computed from both IntErO and RUSLE modeling. The experimental trial was conducted in 2017 and 2018 with a randomized complete block design with a combination of treatments using tillage and mulch with maize plantation and bare fields.
3. Results
3.1. Physio-Geographical and Climate Characteristics
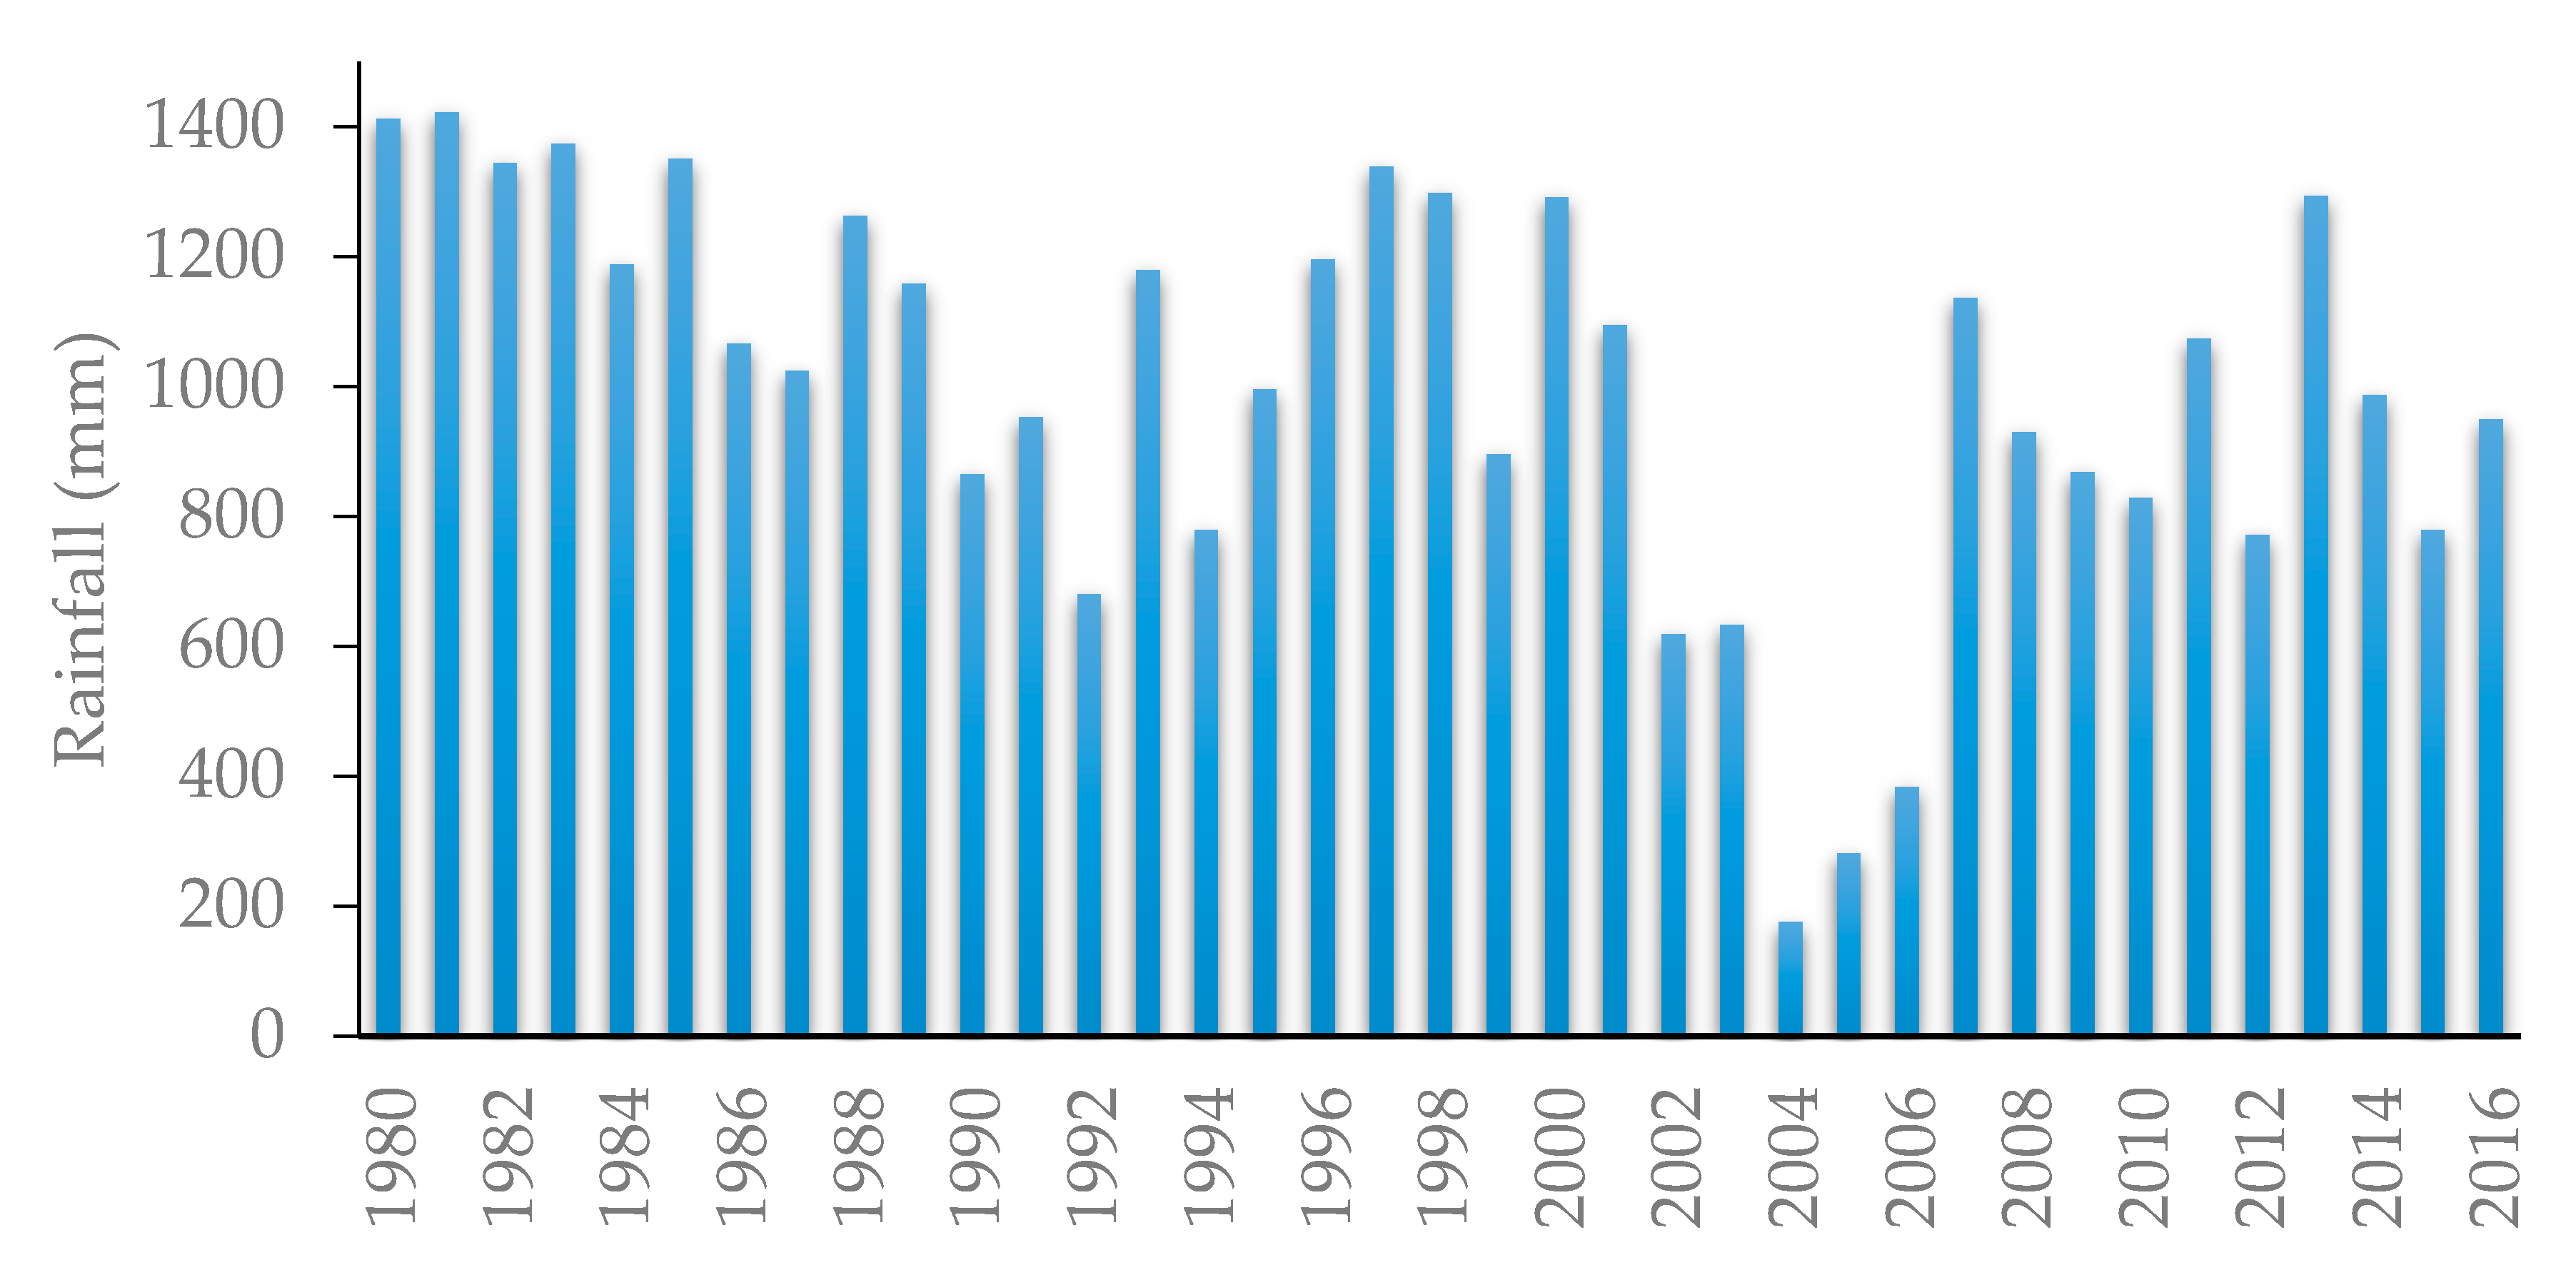
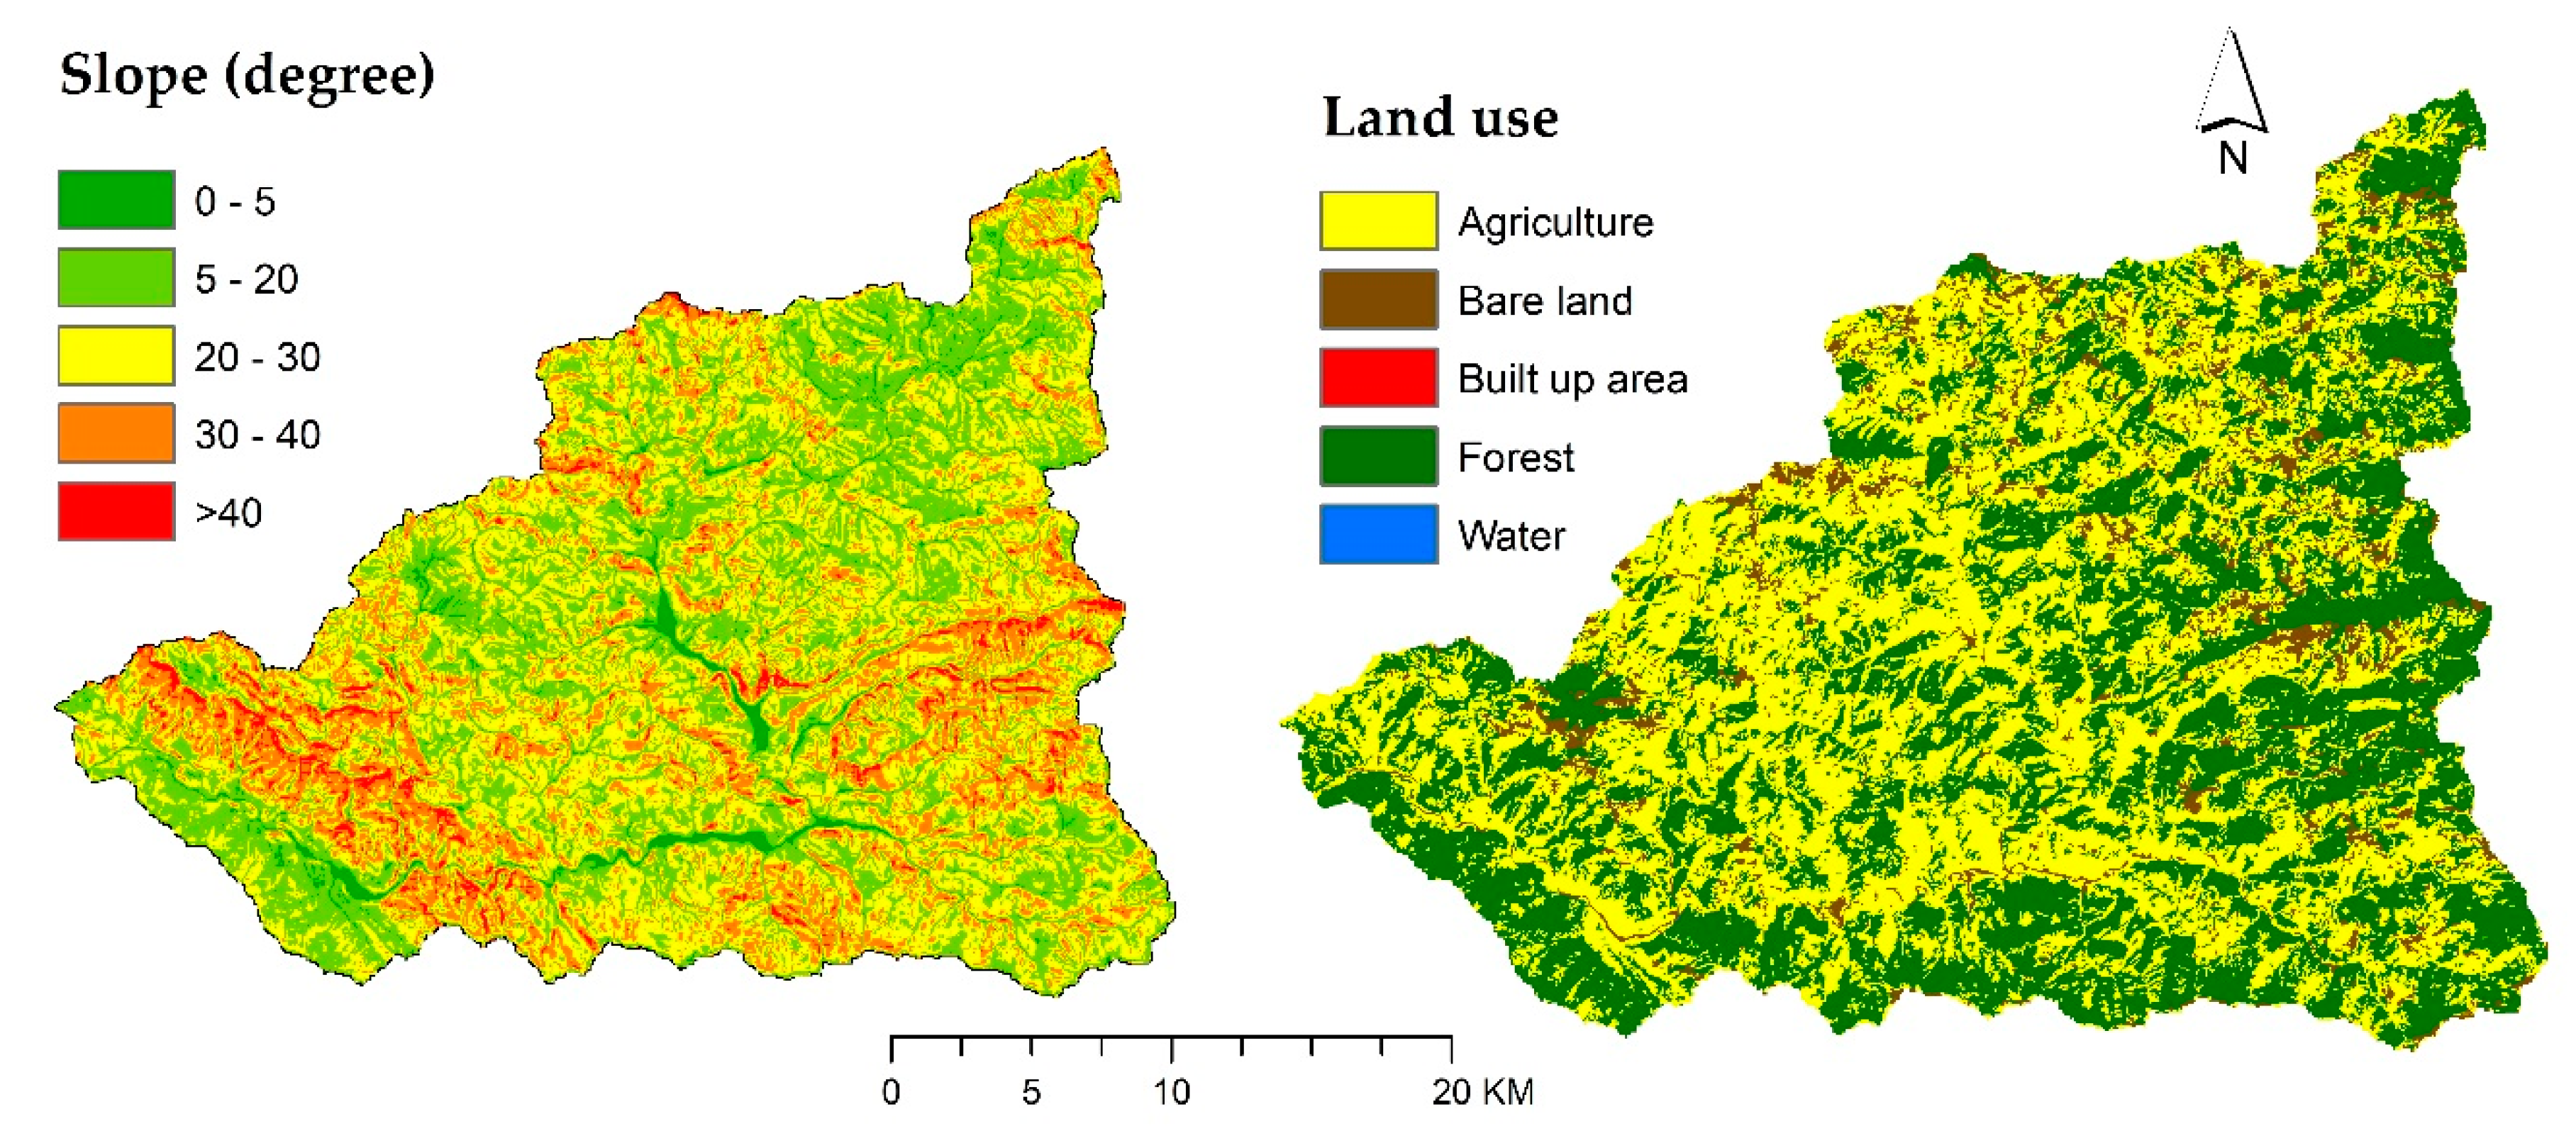
Average annual rainfall recorded for the Sarada river basin is approximately 1000 mm with 90% of annual rainfall concentrated during monsoon between June to September [57]. A decrease in the annual rainfall has been experienced in the study area since 1980; the year 2004 received 175 mm of rainfall (lowest) and the year 1981 received 1420 mm of rainfall (highest) (Figure 2). Sarada river basin is part of the Babai river basin which is basically a hilly terrain. The slope varies from 0 to 61.89 degrees, the average being 22.56 degrees (Figure 3). The river basin has tropical monsoon climate; average maximum and minimum temperature are recorded as 31 °C and 14 °C during summer and winter, respectively.
3.2. The Geology and Soils
The geological structure of the terrain in terms of permeability and erodibility of rocks was taken into account in this research. The Lakharpata formation, Ranimatta formation, and Kushma formation were the dominant geological classes in the study area covering nearly 77% of the study area (Table 4) [20].
Limestone, schist, slate, phyllite, quartzite, sandstone, dolostone, shale, and carbonates were the major rocks found in the study area [58]. While looking at the water permeability, poorly permeable rocks (class fo) dominates the study area (62%), whereas the semipermeable rocks (class fpp) covers the rest. Major soil types present in the study area are the Inceptisols and Entisols with Ochric and Umbric surface horizons.
3.3. Vegetation and Land Use
Agriculture and forests are the dominant land use types occupying nearly 93% of the study area (Figure 3). Other land use land cover present in the study area are bare land, built up area, and water bodies, covering 6.6%, 0.01%, and 0.001% of the study area, respectively. The major crops grown are rice, maize, and millet.
3.4. Modeling Soil Loss with the IntErO
The computer-graphic IntErO model was used to calculate the sediment yield and maximum outflow from the Sarada river basin. Data inputs and results are presented in Table 5.
The coefficient of the river basin form, A was calculated as 0.63; coefficient of the watershed development, m, 0.62 and average river basin width, B, 15.2 km. Asymmetry coefficient (a) of the river basin was calculated as 0.63 which indicates the possibility of large flood waves to come in the future and the G coefficient of 0.26 suggests there is a low density of hydrographic network [59]. Maximum outflow from the river basin, Qmax, for the current state of land was estimated to be 1917.8 m³ s−1.
The Z coefficient, estimated as 0.40, indicates the river basin belongs to III destruction category and the strength of the erosion process is medium, and according to the erosion type, it is surface erosion [60]. Production of erosion material in the river basin, Wyear, was calculated as 936,430.65 m3 year−1; coefficient of deposit retention/sediment delivery ratio, Ru, 0.37 whereas real soil losses were found to be 397.21 m3 km−2 year−1, which indicates the river basin falls in V category and is a region of very weak erosion [60].
3.5. Modeling Soil Loss with RUSLE
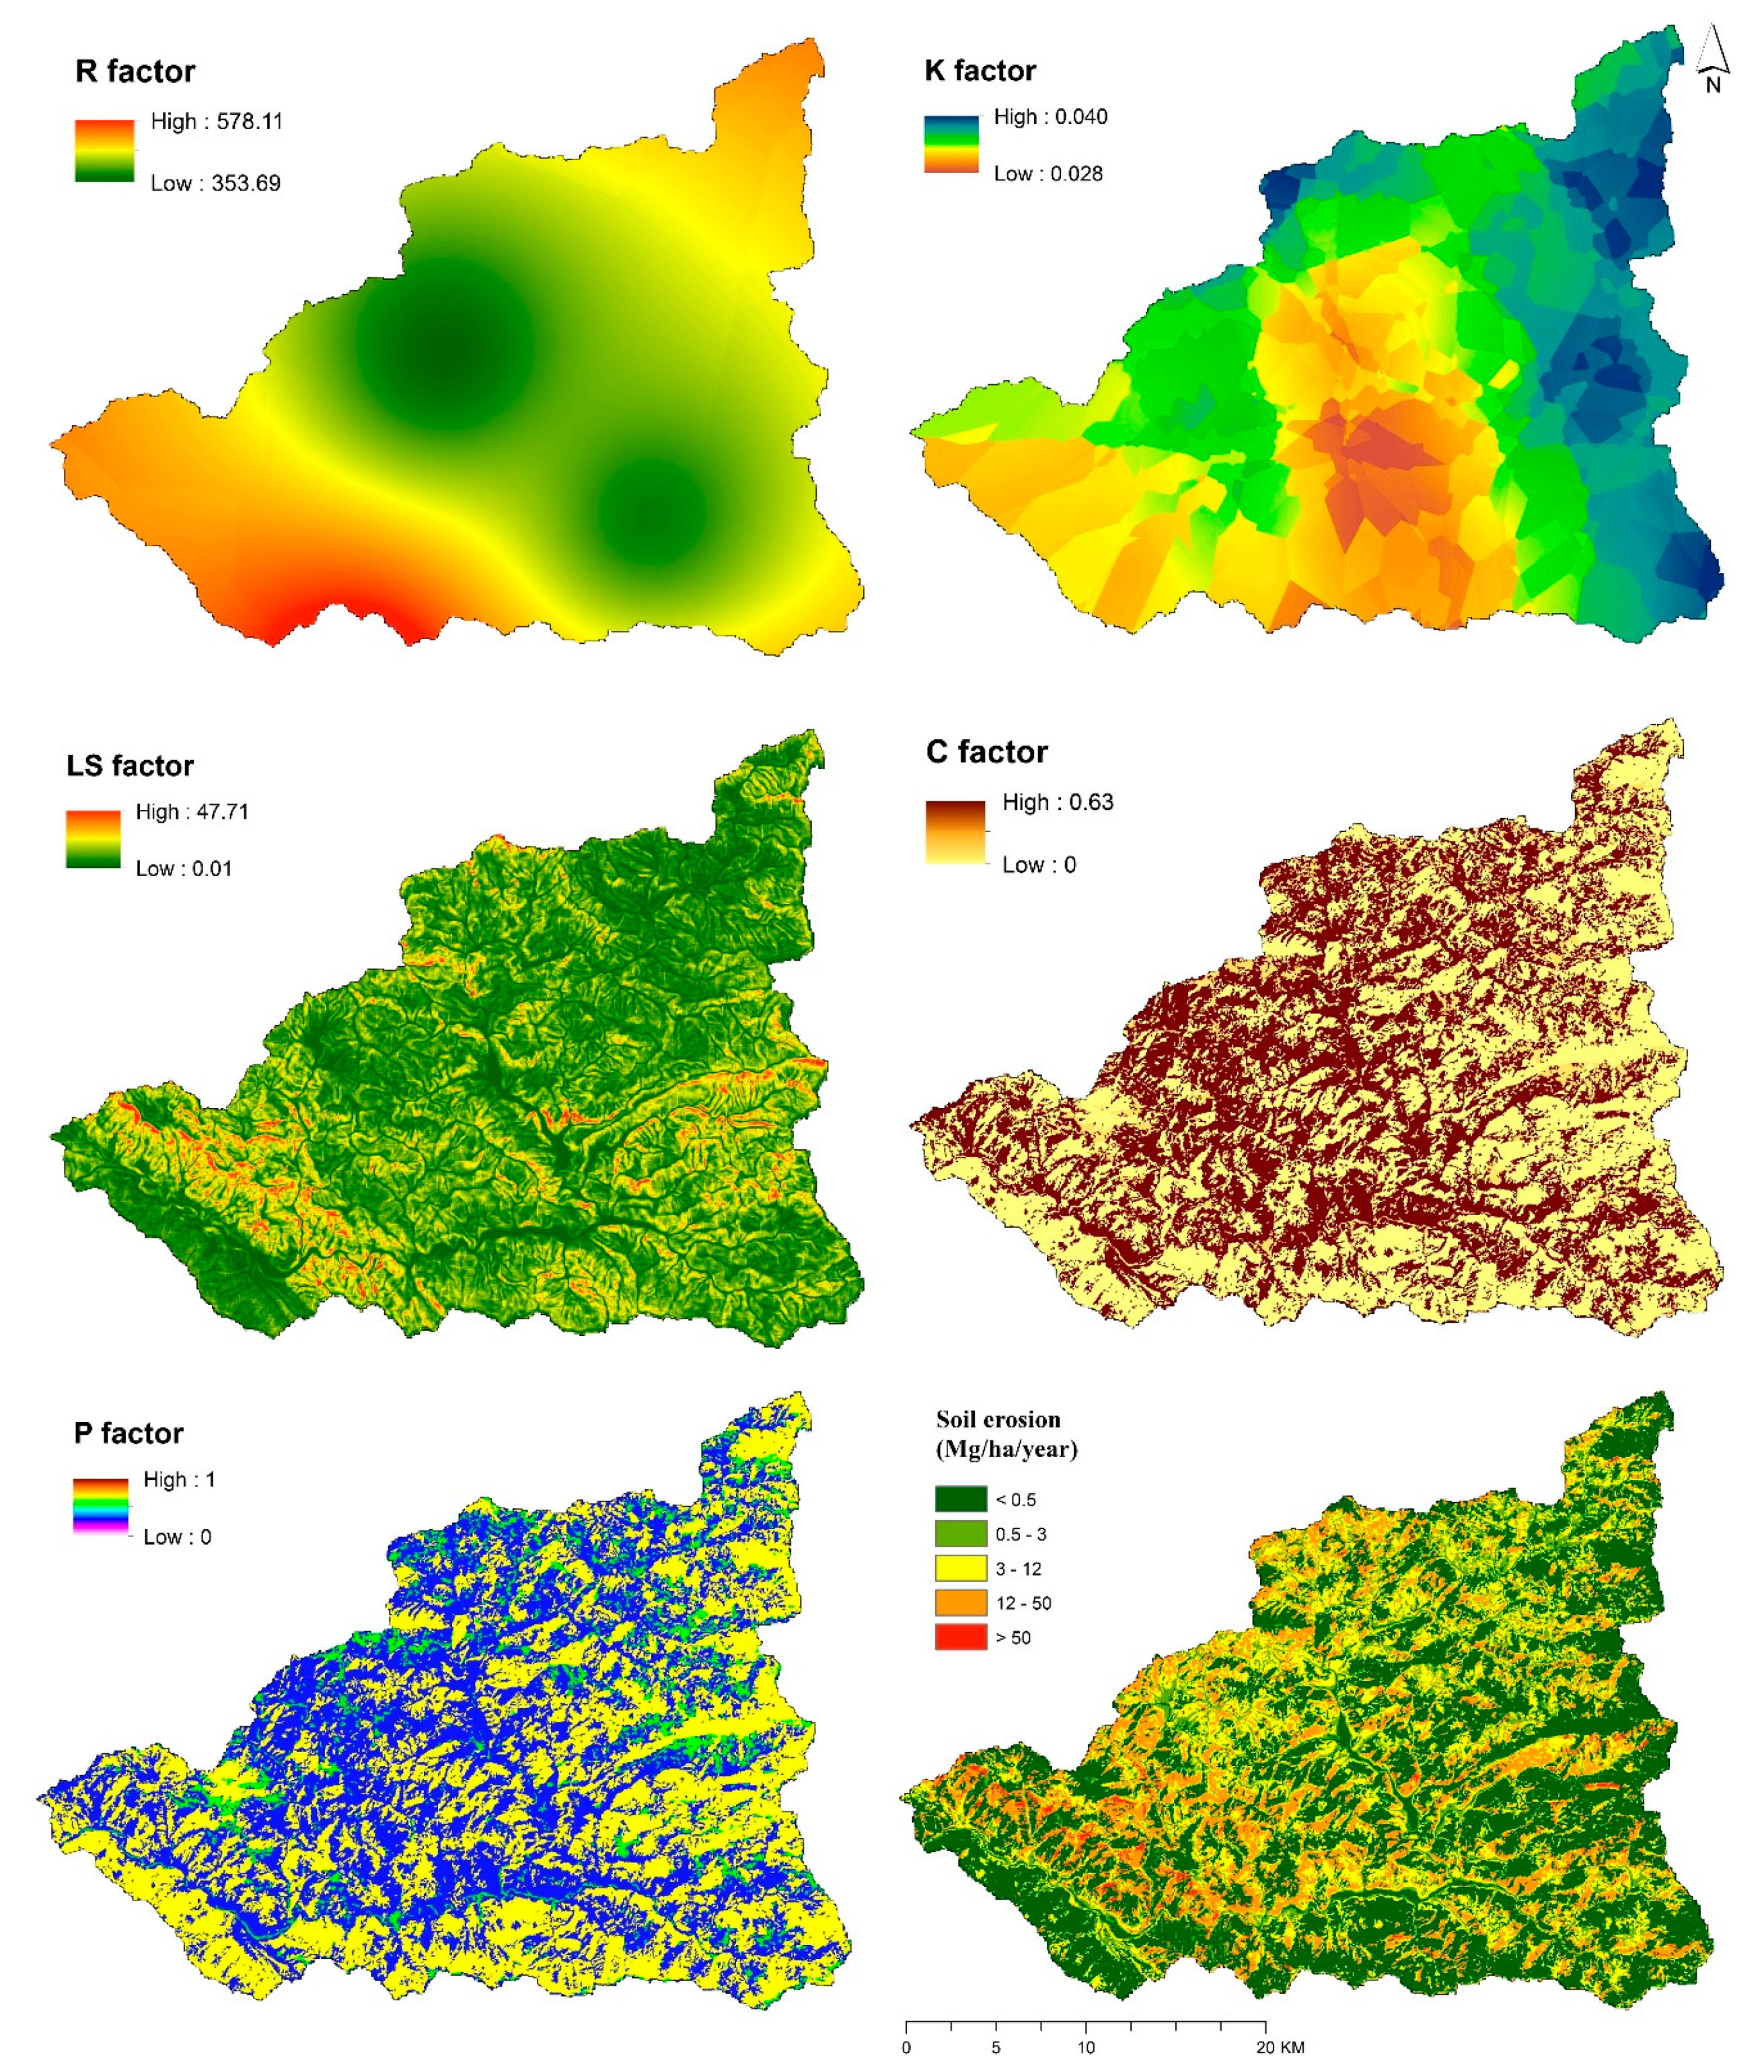
Spatial distribution maps of R, K, LS, C, and P factors and soil erosion are presented in Figure 4. The average soil erosion rate of 6.42 Mg ha−1 year−1 was observed in the study area with the RUSLE model.
4. Discussion
Being a spatially explicit model is the biggest advantage of the RUSLE whereas the IntErO calculates sediment yield collectively for the whole basin. Where the RUSLE model is more focused with the calculation of soil loss only, the IntErO also computes maximum outflow from the river basin, asymmetry of the river basin and coefficients of river basin form, watershed development, river basin tortuousness, region’s permeability, and vegetation cover; these parameters are also of paramount importance in determining the soil loss of a landscape. A major advantage of IntErO over RUSLE is it calculates both the sediment delivery ratio and sediment yield but RUSLE does not. RUSLE only calculates gross soil erosion rates which may or may not include soil that is lost from the river basin as not all the erosion materials generated get lost from the basin but sediment yield measured by the IntErO is the actual volume of soil leaving the river basin.
Although both models use similar datasets to compute soil erosion intensity, such as the rainfall data, soil data, elevation data, and land use map, however, there is a difference in the methodology of how these data are utilized in both the models. The soil loss rate of 1074 m3 km−2 year−1 was obtained with the IntErO modeling, which is equivalent to 10.74 Mg ha−1 year−1. The RUSLE and the erosion plots (2017–2018), however, computed erosion rates of 6.42 and 9.5 Mg ha−1 year−1, respectively. Looking at these figures, soil erosion estimates from IntErO is closer to the actual soil loss as compared to the RUSLE, which confirms that the IntErO is effective in estimating the erosion severity in the Nepal Himalayas. The RUSLE model primarily calculates the soil erosion by rill and inter-rill erosion and discards the contribution of other geomorphological processes such as mega-rill, gully, bank and channel erosion, and landslides to soil loss [61]. This may be the reason why the RUSLE is underestimating the soil loss in the area as compared to the IntErO and erosion plots. However, RUSLE computes soil erosion for a relatively long period of time, so comparing soil loss from two season erosion plot experiment may not be convincing; therefore, these erosion rates have to be verified with real soil loss observations from long-term erosion plot measurements to have a better estimate of soil loss in the area. Erosion plots, here, include both the maize planting and bare fields, and erosion estimates were the average of the soil loss from them. Measured erosion rates were also within the range of the other studies conducted in different parts of Nepal [54,62,63,64,65,66].
The data generated in our research are similar to other research carried out in similar mountainous terrain where the soil erosion processes are activated by the steep slopes and human use [67,68]. The research developed by Rodrigo-Comino et al. [69] demonstrates that the soil erosion rates are highly dependent on the agriculture use such as vineyards. But, also in grasslands, the soil erosion rates are dominated by the type of herbs such as Antoneli et al. [70] demonstrated in Brazil, or in the forest of Slovenia at watershed scale [71]. In the mountainous areas of the Himalayas, we found that there are some strategies to control the soil losses, such as the intercropping of rainfed maize-wheat rotations. It is agriculture that is the key management aspect to control the soil losses and this is clear in many crops: Olive [72], vineyards [69], and citrus [73,74] and this is confirmed by the quick reduction in the soil losses after the land abandonment [75] as a consequence of recovery of the vegetation, which is the key factor of the soil erosion [76].
5. Conclusions
This study estimated the sediment yield and maximum outflow from the Sarada river basin using the rainfall, temperature, soil, and land use and geology data. Many factors have contributed to the growth of erosion processes in the Sarada river basin. River basin’s characteristics in terms of geometry, topography, and hydrology had significant impacts on soil erosion in the study area. Geological composition of rocks and their permeability, types of land use land cover, and the level of the torrential rains were also equally important. The soil erosion rate of 10.74 Mg ha−1 year−1 indicates that the river basin is in a degraded state and needs urgent soil conservation measures to be adopted in the area.
Calculation of soil loss rate and maximum outflow through IntErO model seems to be the best alternative for other field-based sediment yield estimation as they take substantial efforts and much time to get similar results. For a larger watershed, this is not even possible [66]. The model, after calibration and validation, can also be applied to similar river basins of Nepal. This study also confirms the effectiveness of the IntErO model in assessing the soil loss in a South Asian country outside of the Balkan Peninsula. The outcomes from this study can help policymakers in building better soil and water conservation guidelines to protect the soils of the river basin.
Author Contributions
Conceptualization, D.C., L.K., V.S., and G.S.; methodology, D.C., formal analysis, D.C., resources, D.C. and V.S., writing—original draft preparation, D.C., writing—review and editing, D.C., L.K., V.S., and G.S.
Funding
This research received no external funding.
Acknowledgments
We would like to thank the International Centre for Integrated Mountainous Development, and Department of Hydrology and Meteorology, Nepal for providing us with the geology map and weather data, respectively. We are grateful to the Ministry of Science, Montenegro for covering the publication cost. Anonymous reviewers and editors whose input helped to improve the scientific quality of this paper are also deeply acknowledged.
Conflicts of Interest
The authors declare no conflict of interest.
References
- Novara, A.; Pisciotta, A.; Minacapilli, M.; Maltese, A.; Capodici, F.; Cerdà, A.; Gristina, L. The impact of soil erosion on soil fertility and vine vigor. A multidisciplinary approach based on field, laboratory and remote sensing approaches. Sci. Total Environ. 2018, 622, 474–480. [Google Scholar] [CrossRef] [PubMed] [Green Version]
- Gholami, L.; Batista, P.; Behzadfar, A.; Darvishan, A.; Behzadfar, M. Application of IntErO model for soil loss estimation case study: S7-1 Watershed of Shirindareh river basin, Iran. In Proceedings of the VII International Scientific Agriculture Symposium, “Agrosym 2016”, Jahorina, Bosnia and Herzegovina, 6–9 October 2016; pp. 2169–2177. [Google Scholar]
- Darvishan, A.K.; Derivandi, M.; Aliramee, R.; Khorsand, M.; Spalevic, V.; Gholami, L.; Vujacic, D. Efficiency of IntErO Model to Predict Soil Erosion Intensity and Sediment Yield in Khamsan Representative Watershed (West of Iran). AGROFOR 2018, 3. [Google Scholar] [CrossRef]
- Keesstra, S.; Mol, G.; de Leeuw, J.; Okx, J.; Molenaar, C.; de Cleen, M.; Visser, S. Soil-related sustainable development goals: Four concepts to make land degradation neutrality and restoration work. Land 2018, 7, 133. [Google Scholar] [CrossRef]
- Keesstra, S.D.; Bouma, J.; Wallinga, J.; Tittonell, P.; Smith, P.; Cerdà, A.; Montanarella, L.; Quinton, J.N.; Pachepsky, Y.; Van Der Putten, W.H.; et al. The significance of soils and soil science towards realization of the United Nations sustainable development goals. Soil 2016, 2, 111–128. [Google Scholar] [CrossRef]
- Food and Agriculture Organization. Status of the World‘s Soil Resources (SWSR)—Main Report; Food and Agriculture Organization of the United Nations and Intergovernmental Technical Panel on Soils: Rome, Italy, 2015. [Google Scholar]
- Spalevic, V.; Lakicevic, M.; Radanovic, D.; Billi, P.; Barovic, G.; Vujacic, D.; Sestras, P.; Darvishan, A.K. Ecological-Economic (Eco-Eco) Modelling in the River Basins of Mountainous Regions: Impact of Land Cover Changes on Sediment Yield in the Velicka Rijeka, Montenegro. Not. Bot. Horti Agrobot. Cluj-Napoca 2017, 45, 602–610. [Google Scholar] [CrossRef]
- Ministry of Agricultural Development. Statistical Information on Nepalese Agriculture 2012/2013; Agri-Business Promotion and Statistics Division, Statistics Section: Kathmandu, Nepal, 2013.
- Upadhayay, H.R.; Smith, H.G.; Griepentrog, M.; Bodé, S.; Bajracharya, R.M.; Blake, W.; Cornelis, W.; Boeckx, P. Community managed forests dominate the catchment sediment cascade in the mid-hills of Nepal: A compound-specific stable isotope analysis. Sci. Total Environ. 2018, 637, 306–317. [Google Scholar] [CrossRef]
- Chalise, D.; Kumar, L.; Kristiansen, P. Land Degradation by Soil Erosion in Nepal: A Review. Soil Syst. 2019, 3, 12. [Google Scholar] [CrossRef]
- Atreya, K.; Sharma, S.; Bajracharya, R.M.; Rajbhandari, N.P. Applications of reduced tillage in hills of central Nepal. Soil Tillage Res. 2006, 88, 16–29. [Google Scholar] [CrossRef]
- Atreya, K.; Sharma, S.; Bajracharya, R.M.; Rajbhandari, N.P. Developing a sustainable agro-system for central Nepal using reduced tillage and straw mulching. J. Environ. Manag. 2008, 88, 547–555. [Google Scholar] [CrossRef]
- Thomas, J.; Joseph, S.; Thrivikramji, K. Assessment of soil erosion in a tropical mountain river basin of the southern Western Ghats, India using RUSLE and GIS. Geosci. Front. 2018, 9, 893–906. [Google Scholar] [CrossRef]
- Jain, M.K.; Das, D. Estimation of sediment yield and areas of soil erosion and deposition for watershed prioritization using GIS and remote sensing. Water Resour. Manag. 2010, 24, 2091–2112. [Google Scholar] [CrossRef]
- Batista, P.V.G.; Silva, M.L.N.; Silva, B.P.C.; Curi, N.; Bueno, I.T.; Júnior, F.W.A.; Davies, J.; Quinton, J. Modelling spatially distributed soil losses and sediment yield in the upper Grande River Basin-Brazil. Catena 2017, 157, 139–150. [Google Scholar] [CrossRef]
- Van Eck, C.M.; Nunes, J.P.; Vieira, D.C.; Keesstra, S.; Keizer, J.J. Physically-Based Modelling of the Post-Fire Runoff Response of a Forest Catchment in Central Portugal: Using Field versus Remote Sensing Based Estimates of Vegetation Recovery. Land Degrad. Dev. 2016, 27, 1535–1544. [Google Scholar] [CrossRef]
- Masselink, R.; Temme, A.J.A.M.; Giménez, R.; Casalí, J.; Keesstra, S.D. Assessing hillslope-channel connectivity in an agricultural catchment using rare-earth oxide tracers and random forests models. Cuadernos de Investigación Geográfica 2017, 43, 19–39. [Google Scholar] [CrossRef]
- Vaezi, A.R.; Abbasi, M.; Bussi, G.; Keesstra, S. Modeling sediment yield in semi-arid pasture micro-catchments, NW Iran. Land Degrad. Dev. 2017, 28, 1274–1286. [Google Scholar] [CrossRef]
- Spalevic, V. Impact of Land Use on Runoff and Soil Erosion in Polimlje. Ph.D. Thesis, Faculty of Agriculture of the University of Belgrade, Belgrade, Serbia, 2011. [Google Scholar]
- International Centre for Integrated Mountain Development. Geology of Nepal; ICIMOD: Kathmandu, Nepal, 2007. [Google Scholar]
- Chalise, D.; Kumar, L. Land Use Change Impacts on Soil Erosion Dynamics in Western Nepal; University of New England: Armidale, Australia, 2018. [Google Scholar]
- Knisel, W.G. CREAMS: A Field Scale Model for Chemicals, Runoff, and Erosion from Agricultural Management Systems; Conservation Research Report (USA); Dept. of Agriculture: Washington, DC, USA, 1980.
- Beasley, D.B.; Huggins, L.F.; Monke, E.J. ANSWERS: A model for watershed planning. Trans. ASAE 1980, 23, 938–944. [Google Scholar] [CrossRef]
- Young, R.; Onstad, C.; Bosch, D.; Anderson, W. AGNPS, Agricultural Non-Point-Source Pollution Model: A Watershed Analysis Tool; Conservation Research Report 35; US Dept. of Agriculture: Washington, DC, USA, 1987.
- Nearing, M.A.; Foster, G.R.; Lane, L.J.; Finkner, S.C. A process-based soil erosion model for USDA-Water Erosion Prediction Project technology. Trans. ASAE 1989, 32, 1587–1593. [Google Scholar] [CrossRef]
- Wischmeier, W.H.; Smith, D.D. Predicting rainfall erosion losses-a guide to conservation planning. In Predicting Rainfall Erosion Losses-A Guide to Conservation Planning; USDA, Science and Education Administration: Hyattsville, MD, USA, 1978. [Google Scholar]
- Wischmeier, W.H.; Smith, D.D. Predicting Rainfall-Erosion Losses from Cropland East of the Rocky Mountains: Guide for Selection of Practices for Soil and Water Conservation; Agricultural Research Service, US Department of Agriculture: Washington, DC, USA, 1965; Volume 282.
- Williams, J. Sediment routing for agricultural watersheds. J. Am. Water Resour. Assoc. 1975, 11, 965–974. [Google Scholar] [CrossRef]
- Renard, K.G.; Foster, G.R.; Weesies, G.A.; Porter, J.P. RUSLE: Revised universal soil loss equation. J. Soil Water Conserv. 1991, 46, 30–33. [Google Scholar]
- Walling, D. Erosion and sediment yield research—Some recent perspectives. J. Hydrol. 1988, 100, 113–141. [Google Scholar] [CrossRef]
- Ferro, V.; Porto, P.; Tusa, G. Testing a distributed approach for modelling sediment delivery. Hydrol. Sci. J. 1998, 43, 425–442. [Google Scholar] [CrossRef] [Green Version]
- Carson, M.A.; Kirkby, M.J. Hillslope form and process. Science 1972, 178, 1083–1084. [Google Scholar]
- Mitasova, H.; Hofierka, J.; Zlocha, M.; Iverson, L.R. Modelling topographic potential for erosion and deposition using GIS. Int. J. Geograph. Inf. Syst. 1996, 10, 629–641. [Google Scholar] [CrossRef] [Green Version]
- Zhao, G.; Kondolf, G.M.; Mu, X.; Han, M.; He, Z.; Rubin, Z.; Wang, F.; Gao, P.; Sun, W. Sediment yield reduction associated with land use changes and check dams in a catchment of the Loess Plateau, China. Catena 2017, 148, 126–137. [Google Scholar] [CrossRef]
- Spalevic, V. Application of Computer-Graphic Methods in the Studies of Draining out and Intensities of Ground Erosion in the Berane Valley; Faculty of Agriculture of the University of Belgrade: Belgrade, Serbia, 1999. [Google Scholar]
- Spalevic, V.; Dlabac, A.; Jovovic, Z.; Rakocevic, J.; Radunovic, M.; Spalevic, B.; Fustic, B. The “Surface and distance Measuring“ Program. Acta Agric. Serbica 1999, 4, 63–71. [Google Scholar]
- Gavrilovic, S. Inzenjering o Bujicnim Tokovima i Eroziji; Izgradnja: Beograd, Serbia, 1972. [Google Scholar]
- Spalevic, V.; Curovic, M.; Uzen, N.; Simunic, I.; Vukelic-Shutoska, M. Calculation of soil erosion intensity and runoff in the river basin of Ljesnica, Northeast of Montenegro. In Proceedings of the 24th International Scientific-Expert Conference on Agriculture and Food Industry, Sarajevo, Bosnia and Herzegovina, 25–28 September 2013. [Google Scholar]
- Milanesi, L.; Pilotti, M.; CleriCi, A.; GavriloviC, Z. Application of an improved version of the erosion potential method in alpine areas. Ital. J. Eng. Geol. Environ. 2015, 1, 17–30. [Google Scholar]
- Noori, H.; Siadatmousavi, S.M.; Mojaradi, B. Assessment of sediment yield using RS and GIS at two sub-basins of Dez Watershed, Iran. Int. Soil Water Conserv. Res. 2016, 4, 199–206. [Google Scholar] [CrossRef] [Green Version]
- Efthimiou, N.; Lykoudi, E. Soil erosion estimation using the EPM model. Bull. Geol. Soc. Greece 2016, 50, 305–314. [Google Scholar] [CrossRef]
- Tatjana, K. EPM for Soil Loss Estimation in Different Geomorphologic Conditions and Data Conversion by Using GIS. Master’s Thesis, Mediterranean Agronomic Institute of Chania, Hania, Greece, 2014. [Google Scholar]
- Dragičević, N.; Whyatt, D.; Davies, G.; Karleuša, B.; Ožanić, N. Erosion model sensitivity to Land cover inputs: Case study of the Dubračina catchment, Croatia. In Proceedings of the GIS Research UK 22nd Annual Conference GISRUK 2014, Scotland, UK, 16–18 April 2014. [Google Scholar]
- Haghizadeh, A. Forecasting sediment with erosion potential method with emphasis on land use changes at basin. Electr. J. Geotech. Eng. 2009, 14, 1–12. [Google Scholar]
- Dragičević, N.; Karleuša, B.; Ožanić, N. Erosion potential method (Gavrilović method) sensitivity analysis. Soil Water Res. 2017, 12, 51–59. [Google Scholar] [CrossRef]
- Renard, K.; Foster, G.; Weesies, G.; McCool, D.; Yoder, D. Predicting Soil Erosion by Water: A Guide to Conservation Planning with the Revised Universal Soil Loss Equation (RUSLE); Handbook 703; Food and Agriculture Organization of the United States: Washington, DC, USA, 1997. [Google Scholar]
- Xu, Y.-Q.; Shao, X.-M.; Kong, X.-B.; Peng, J.; Cai, Y.-L. Adapting the RUSLE and GIS to model soil erosion risk in a mountains karst watershed, Guizhou Province, China. Environ. Monit. Assess. 2008, 141, 275–286. [Google Scholar] [CrossRef]
- Harper, D. Improving the accuracy of the universal soil loss equation in Thailand. In Proceedings of the Fifth International Conservation Conferences, Bangkok, Thailand, 18–29 January 1988. [Google Scholar]
- Panday, D.; Maharjan, B.; Chalise, D.; Shrestha, R.K.; Twanabasu, B. Digital soil mapping in the Bara district of Nepal using kriging tool in ArcGIS. PLoS ONE 2018, 13, e0206350. [Google Scholar] [CrossRef]
- Panday, D.; Ojha, R.B.; Chalise, D.; Das, S.; Twanabasu, B. Spatial variability of soil properties under different land use in the dang district of Nepal. Cogent Food Agric. 2019. [Google Scholar] [CrossRef]
- Ligonja, P.; Shrestha, R. Soil erosion assessment in kondoa eroded area in Tanzania using universal soil loss equation, geographic information systems and socioeconomic approach. Land Degrad. Dev. 2015, 26, 367–379. [Google Scholar] [CrossRef]
- Wall, G.; Coote, D.; Pringle, E.; Shelton, I. RUSLEFAC—Revised Universal Soil loss Equation for Application in Canada: A Handbook for Estimating Soil Loss from Water Erosion in Canada; Contribution No. AAFC/AAC2244E; Research Branch, Agriculture and Agri-Food Canada: Ottawa, ON, Canada, 2002; Volume 117. [Google Scholar]
- Šurda, P.; Šimonides, I.; Antal, J. A determination of area of potential erosion by geographic information systems. J. Environ. Eng. Landsc. Manag. 2007, 15, 144–152. [Google Scholar] [CrossRef]
- Chalise, D.; Kumar, L.; Shriwastav, C.P.; Lamichhane, S. Spatial assessment of soil erosion in a hilly watershed of Western Nepal. Environ. Earth Sci. 2018, 77, 685. [Google Scholar] [CrossRef]
- Jain, S.K.; Kumar, S.; Varghese, J. Estimation of soil erosion for a Himalayan watershed using GIS technique. Water Resour. Manag. 2001, 15, 41–54. [Google Scholar] [CrossRef]
- Jung, H.; Jeon, S.; Lee, D. Development of soil water erosion module using GIS and RUSLE. In Proceedings of the 9th Asia-Pacific Integrated Model (AIM) International Workshop, Tsukuba, Japan, 12–13 March 2004; pp. 12–13. [Google Scholar]
- Ministry of Forests and Soil Conservation. Adaptation for Smallholders in Hilly Areas Project; GIS Based Assessment of Sarada Watershed Salyan; Ministry of Forests and Soil Conservation: Kathmandu, Nepal, 2017. [Google Scholar]
- Ojha, T.P. Magnetostratigraphy, Topography and Geology of the Nepal Himalaya: A GIS and Paleomagnetic Approach; The University of Arizona: Tucson, AZ, USA, 2009. [Google Scholar]
- Spalevic, V.; Hübl, J.; Hasenauer, H.; Curovic, M. Calculation of soil erosion intensity in the Bosnjak Watershed, Polimlje River Basin, Montenegro. In Proceedings of the 5th International Symposium “Agrosym“, Jahorina, Bosnia and Herzegovina, 23–26 October 2014; pp. 730–738. [Google Scholar]
- Spalevic, V.; Radanovic, D.; Behzadfar, M.; Djekovic, V.; Andjelkovic, A.; Milosevic, N. Calculation of the sediment yield of the Trebacka Rijeka, Polimlje, Montenegro. Agric. For. 2014, 60, 259–272. [Google Scholar]
- Borrelli, P.; Märker, M.; Panagos, P.; Schütt, B. Modeling soil erosion and river sediment yield for an intermountain drainage basin of the Central Apennines, Italy. Catena 2014, 114, 45–58. [Google Scholar] [CrossRef]
- Jha, M.K.; Paudel, R.C. Erosion predictions by empirical models in a mountainous watershed in Nepal. J. Spat. Hydrol. 2010, 10, 89–102. [Google Scholar]
- Mandal, U.K. Geo-information-Based Soil Erosion Modeling for Sustainable Agriculture Development in Khadokhola Watershed, Nepal. In Land Cover Change and Its Eco-environmental Responses in Nepal; Springer: Berlin, Germany, 2017; pp. 223–241. [Google Scholar]
- Nayak, T.; Jaiswal, R.; Galkate, R.; Thomas, T. Impact Assessment of Alternate Land Cover and Management Practices on Soil Erosion: A Case Study. In Hydrologic Modeling; Springer: Berlin, Germany, 2018; pp. 211–223. [Google Scholar]
- Uddin, K.; Abdul Matin, M.; Maharjan, S. Assessment of Land Cover Change and Its Impact on Changes in Soil Erosion Risk in Nepal. Sustainability 2018, 10, 4715. [Google Scholar] [CrossRef]
- Uddin, K.; Murthy, M.; Wahid, S.M.; Matin, M.A. Estimation of soil erosion dynamics in the Koshi basin using GIS and remote sensing to assess priority areas for conservation. PLoS ONE 2016, 11, e0150494. [Google Scholar] [CrossRef]
- Gardner, R.A.M.; Gerrard, A.J. Runoff and soil erosion on cultivated rainfed terraces in the Middle Hills of Nepal. Appl. Geogr. 2003, 23, 23–45. [Google Scholar] [CrossRef]
- Gabet, E.J.; Burbank, D.W.; Pratt-Sitaula, B.; Putkonen, J.; Bookhagen, B. Modern erosion rates in the High Himalayas of Nepal. Earth Planet. Sci. Lett. 2008, 267, 482–494. [Google Scholar] [CrossRef]
- Rodrigo-Comino, J.; Keesstra, S.; Cerdà, A. Soil Erosion as an Environmental Concern in Vineyards: The Case Study of Celler del Roure, Eastern Spain, by Means of Rainfall Simulation Experiments. Beverages 2018, 4, 31. [Google Scholar] [CrossRef]
- Antoneli, V.; Rebinski, E.; Bednarz, J.; Rodrigo-Comino, J.; Keesstra, S.; Cerdà, A.; Pulido Fernández, M. Soil erosion induced by the introduction of new pasture species in a faxinal farm of Southern Brazil. Geosciences 2018, 8, 166. [Google Scholar] [CrossRef]
- Keesstra, S.; Temme, A.; Schoorl, J.; Visser, S. Evaluating the hydrological component of the new catchment-scale sediment delivery model LAPSUS-D. Geomorphology 2014, 212, 97–107. [Google Scholar] [CrossRef]
- Rodrigo-Comino, J.; Taguas, E.; Seeger, M.; Ries, J.B. Quantification of soil and water losses in an extensive olive orchard catchment in Southern Spain. J. Hydrol. 2018, 556, 749–758. [Google Scholar] [CrossRef]
- Kumar, S. Effect of different vegetation systems on soil erosion and soil nutrients in red soil region of southeastern China. Pedosphere 2003, 13, 121–128. [Google Scholar]
- Liu, Y.; Tao, Y.; Wan, K.; Zhang, G.; Liu, D.; Xiong, G.; Chen, F. Runoff and nutrient losses in citrus orchards on sloping land subjected to different surface mulching practices in the Danjiangkou Reservoir area of China. Agric. Water Manag. 2012, 110, 34–40. [Google Scholar] [CrossRef]
- Cerdà, A.; Rodrigo-Comino, J.; Novara, A.; Brevik, E.C.; Vaezi, A.R.; Pulido, M.; Giménez-Morera, A.; Keesstra, S.D. Long-term impact of rainfed agricultural land abandonment on soil erosion in the Western Mediterranean basin. Prog. Phys. Geogr. 2018, 42, 202–219. [Google Scholar] [CrossRef]
- Feng, T.; Wei, W.; Chen, L.; Rodrigo-Comino, J.; Die, C.; Feng, X.; Ren, K.; Brevik, E.C.; Yu, Y. Assessment of the impact of different vegetation patterns on soil erosion processes on semiarid loess slopes. Earth Surf. Process. Landf. 2018, 43, 1860–1870. [Google Scholar] [CrossRef]
Figure 1.
Study area with the Digital Elevation Model (DEM).

Figure 2.
Variation in rainfall over the years in the Sarada river basin, Nepal.

Figure 3.
Slope and land use map of the Sarada river basin.

Figure 4.
Spatial distribution of the R, K, LS, C, and P factors and soil erosion (Mg ha−1 year−1).


| Erosion Process Intensity | Prevailing Erosion Type | Z | Mean Value Z |
|---|---|---|---|
| Excessive | Deep Mixed Surface | 1.51 1.21–1.50 1.01–1.20 | 1.25 |
| Strong | Deep Mixed Surface | 0.91–1 0.81–0.90 0.71–0.80 | 0.85 |
| Medium | Deep Mixed Surface | 0.61–0.70 0.51–0.60 0.41–0.50 | 0.55 |
| Low | Deep Mixed Surface | 0.31–0.40 0.25–0.30 0.20–0.24 | 0.30 |
| Very low | Deep Mixed Surface | 0.01–0.19 | 0.10 |
Table 2.
Values of the factors used in the intensity of erosion and outflow (IntErO)/EPM method [19,37].
| Coefficient of Soil Cover | Xa Value |
| Areas without vegetal cover (Bare land, building area, water) | 0.8–0.9 |
| Crop fields, meadows, grasslands | 0.6–0.8 |
| Built-up areas and crops, degraded “matorral shrublands” | 0.4–0.6 |
| Arboricultural lands, Clear “matorral shrublands” | 0.2–0.4 |
| Reforested areas, dense forests, dense “matorral shrublands” | 0.05–0.2 |
| Coefficient of Soil Resistance | Y Value |
| Marls, clays, poorly consolidated yellow sands and rocks with little resistance | 1.3–1.7 |
| Weak rock, fine clayey pelites with microbereccia beds, recent quaternary scree | 1–1.3 |
| Rock with moderate erosion resistance, limestone formations, fluvial terraces | 0.6–1 |
| Hard rock, sandstone of the Numidian nappe | 0.5–0.6 |
| Coefficient of Type and Extent of Erosion | ϕ Value |
| Deep ravines, landslides, badlands areas and bank undercutting | 0.8–0.9 |
| Sheet erosion, less than 50% of the catchment area with rill and gullies erosion | 0.6–0.7 |
| 20% of the area attacked by surface erosion, minor slips in stream channels | 0.3–0.5 |
| Land surface without visible erosion, mostly crop fields | 0.1–0.2 |
Table 3.
C and P values for different land use land cover.
| LULC | C Value | P Value |
|---|---|---|
| Agriculture | 0.63 | 0.5 |
| Bare land | 0.09 | 0.7 |
| Built up area | 0.09 | 1 |
| Forest | 0.003 | 0.8 |
| Water bodies | 0 | 0 |
Table 4.
Major geological units and their distribution in the study area.
| Geological Class | Major Rocks Present | Area | |
|---|---|---|---|
| km2 | % | ||
| Kalikot formation | Limestone, schist, gneiss | 2.18 | 0.25 |
| Kushma formation | Quartzite, chlorotic phyllite | 240.49 | 27.59 |
| Lakharpata formation | Dolostone and limestone in the lower part; limestone, shale and phyllite in the middle part and limestone, dolostone and few quartzites in the upper part | 216.43 | 24.83 |
| Lower siwalik | Sandstone, siltstone and mudstone | 55.28 | 6.34 |
| Melpani formation | Ferruginous quartzites, sandstones, dark shales, few limestones, conglomerates | 8.04 | 0.92 |
| Ranimata formation | Phyllite with thin beds of quartzite | 227.54 | 26.10 |
| Sangram formation | Orthoquartzite in the lower part and shale, few limestones and orthoquartzite in the upper part | 25.47 | 2.92 |
| Siuri formation | Augen gneiss, schists and quartzites | 8.94 | 1.03 |
| Suntar formation | Sandstones and shales | 30.62 | 3.51 |
| Surbang formation | Carbonates | 4.66 | 0.53 |
| Swat formation | Dark grey shales and limestones | 0.95 | 0.11 |
| Syangja formation | Quartzite, shale, slate, dolostone, few limestones | 0.41 | 0.05 |
| Ulleri formation | Augen Gneiss | 50.62 | 5.81 |
| Upper Siwalik | Conglomerate, boulder beds, sand and silt beds | 0.02 | 0.001 |
| Total | 871.64 | 100 | |
Table 5.
IntErO report for the Sarada river basin.
| Input Data | Abbreviation | Value | Unit |
|---|---|---|---|
| River basin area | F | 871.64 | km2 |
| The length of the watershed | O | 208.16 | km |
| Natural length of the main watercourse | Lv | 64.39 | km |
| The shortest distance between the fountainhead and mouth | Lm | 25.88 | km |
| The total length of the main watercourse with tributaries of I and II class | ΣL | 227.78 | km |
| River basin length measured by a series of parallel lines | Lb | 57.35 | km |
| The area of the bigger river basin part | Fv | 574.04 | km2 |
| The area of the smaller river basin part | Fm | 297.58 | km2 |
| Altitude of the first contour line | h0 | 600 | m |
| Equidistance | Δh | 600 | m |
| The lowest river basin elevation | Hmin | 521 | m |
| The highest river basin elevation | Hmax | 2776 | m |
| A part of the river basin consisted of a very permeable product from rocks | fp | 0 | |
| A part of the river basin area consisted of medium permeable rocks | fpp | 0.38 | |
| A part of the river basin consisted of poor water permeability rocks | fo | 0.62 | |
| A part of the river basin under forests | fs | 0.45 | |
| A part of the river basin under grass, meadows, pastures, and orchards | ft | 0 | |
| A part of the river basin under bare land, plough-land, and ground without grass vegetation | fg | 0.55 | |
| The volume of the torrent rain | hb | 102.95 | mm |
| Incidence | Up | 100 | years |
| Average annual air temperature | t0 | 16.85 | °C |
| Average annual precipitation | Hyear | 995.98 | mm |
| Types of soil products and related types | Y | 1 | |
| River basin planning, coefficient of the river basin planning | Xa | 0.52 | |
| Numeral equivalents of the visible and clearly exposed erosion process | ϕ | 0.15 | |
| Results | |||
| Coefficient of the river basin form | A | 0.63 | |
| Coefficient of the watershed development | m | 0.62 | |
| Average river basin width | B | 15.2 | km |
| (A)symmetry of the river basin | a | 0.63 | |
| Density of the river network of the basin | G | 0.26 | |
| Coefficient of the river basin tortuousness | K | 2.49 | |
| Average river basin altitude | Hsr | 1429.46 | m |
| Average elevation difference of the river basin | D | 908.46 | m |
| Average river basin decline | Isr | 41.16 | % |
| The height of the local erosion base of the river basin | Hleb | 2255 | m |
| Coefficient of the erosion energy of the river basin’s relief | Er | 132.1 | |
| Coefficient of the region’s permeability | S1 | 0.89 | |
| Coefficient of the vegetation cover | S2 | 0.82 | |
| Analytical presentation of the water retention in inflow | W | 1.06 | m |
| Energetic potential of water flow during torrent rains | 2gDF½ | 3941.54 | m km s |
| Maximal outflow from the river basin | Qmax | 1917.8 | m³ s−1 |
| Temperature coefficient of the region | T | 1.34 | |
| Coefficient of the river basin erosion | Z | 0.40 | |
| Production of erosion material in the river basin | Wyear | 936,430.65 | m³ year−1 |
| Coefficient of the deposit retention | Ru | 0.37 | |
| Real soil losses | Gyear | 346,212.39 | m³ year−1 |
| Real soil losses per km2 | Gyear/km2 | 397.21 | m3 km−2 year−1 |
© 2019 by the authors. Licensee MDPI, Basel, Switzerland. This article is an open access article distributed under the terms and conditions of the Creative Commons Attribution (CC BY) license (http://creativecommons.org/licenses/by/4.0/).
Share and Cite
MDPI and ACS Style
Chalise, D.; Kumar, L.; Spalevic, V.; Skataric, G. Estimation of Sediment Yield and Maximum Outflow Using the IntErO Model in the Sarada River Basin of Nepal. Water 2019, 11, 952. https://doi.org/10.3390/w11050952
AMA Style
Chalise D, Kumar L, Spalevic V, Skataric G. Estimation of Sediment Yield and Maximum Outflow Using the IntErO Model in the Sarada River Basin of Nepal. Water. 2019; 11(5):952. https://doi.org/10.3390/w11050952
Chicago/Turabian StyleChalise, Devraj, Lalit Kumar, Velibor Spalevic, and Goran Skataric. 2019. "Estimation of Sediment Yield and Maximum Outflow Using the IntErO Model in the Sarada River Basin of Nepal" Water 11, no. 5: 952. https://doi.org/10.3390/w11050952
Note that from the first issue of 2016, this journal uses article numbers instead of page numbers. See further details here.