Formulation and Implementation of Short-Term Optimal Reservoir Operation Schemes Integrated with Operation Rules

School of Renewable Energy, North China Electric Power University, Beijing 102206, China
*
Author to whom correspondence should be addressed.
Water 2019, 11(5), 944; https://doi.org/10.3390/w11050944
Submission received: 12 April 2019
/
Revised: 29 April 2019
/
Accepted: 30 April 2019
/
Published: 5 May 2019
(This article belongs to the Section Hydrology)
Abstract
:To narrow the gap between theoretical research and practical application of short-term optimal reservoir power generation operation under uncertain conditions, a comprehensive study is conducted on the formulation, evaluation, and implementation of operation schemes throughout the entire procedure of optimal operation. Firstly, the three implementation modes of the optimal operation scheme are assessed with the post-evaluation method. After the optimal implementation mode is determined, the formulation and implementation of optimal operation schemes are improved by combining the advantages of conventional and optimal operation and using the concept of warning water level in operation rules. Finally, the Xiaoxuan Reservoir is taken as an example for simulation calculation under different operating conditions. The results show that the operation model integrated with operation rules has both the security of conventional operation and the profitability of optimal operation. The accordingly-formulated optimal operation schemes, when implemented with the output control mode, can provide valuable guidance for the actual operation of hydropower stations.
1. Introduction
Optimal reservoir operation refers to an operation mode that uses optimization methods to formulate reservoir operation strategies [1]. Under the guidance of this operation approach, the practical short-term operation procedure of a reservoir can be generally described as follows: choose an optimization criterion to develop a corresponding objective function, and establish an optimal operation model given input data and constraints [2]; use optimization algorithms to solve the model and obtain the reservoir operation strategy that makes the objective function reach its extremum, namely the optimal operation scheme [3]; implement the scheme and obtain the reservoir’s actual operation process. Compared with conventional operation, optimal operation can effectively enhance power generation benefits without increasing the running cost of hydropower stations, so it is a hot research issue. Ji et al. [4] established the maximum overall generated power model for Jinguan cascade hydropower stations on the Yalong River considering water flow hysteresis, and using the MSDP (multi-stage dynamic programming) method, obtained the global optimal solution with high accuracy, which significantly improved the operation benefits of the cascade hydropower stations. Hossain et al. [5] put forward the artificial bee-colony algorithm to solve the optimal reservoir operation model and demonstrated the algorithm’s advantages by comparing it with PSO (particle swarm optimization) and GA (genetic algorithm). Fu et al. [6] comprehensively assessed the optimal reservoir operation schemes in terms of flood control, power generation, and downstream ecological water demand, and provided an important reference for the decision making in reservoir operation.
However, most of the existing studies focus on the formulation of optimal operation schemes (i.e., establishing and solving the optimal operation model), while the implementation of these schemes is often neglected. Scheme formulation tends to adopt deterministic scheduling to find the optimal scheme where the reservoir inflow process is known [7]. Nevertheless, due to the uncertainty of future inflow and the existence of forecast errors, when the scheme formulated based on the previous day’s predicted inflow is implemented the next day, the actual application effect may be different from the expected situation [8]. If the reservoir operates in accordance with this scheme, the power generation benefits may be fewer [9], and the risk of beyond-limit water level may arise when the forecast error is considerable [10]. Additionally, the assessment of optimal operation schemes is mostly pre-evaluation (i.e., evaluate scheme before it is implemented) and the indicators are calculated based on forecast inflow, which cannot reflect the scheme’s actual risk and benefit after implementation. Consequently, the optimal scheme by pre-evaluation might not be the best in actual operation [11]. To sum up, because of inflow uncertainty and prediction errors, there is a gap between theoretical research of optimal reservoir operation and practical application whose effect is sometimes unsatisfactory.
To address such problems, in this paper a comprehensive study is conducted on the formulation, evaluation, and implementation of optimal reservoir operation schemes. Firstly, the ergodic combination method is employed to compare and analyze the three implementation modes of optimal operation schemes, and the best mode is selected through post-evaluation. Secondly, to overcome the shortcomings of the best implementation mode, a maximum generated power model integrated with operation rules is developed based on the concept of warning water level, and the process of formulating the optimal operation scheme is improved. Finally, taking the Xiaoxuan Reservoir as an example, the validity and practicability of the model are verified, providing effective guidance for the actual short-term optimal reservoir operation. It should be noted that the maximum generated power model integrated with operation rules is based on a specific scheme implementation mode, so in this paper two scenarios of one case are set up for analysis. The former is to select the best of the three implementation modes, while the latter is to prove the effectiveness and applicability of the improved model.
2. Comparative Analysis of the Three Implementation Modes of Optimal Operation Scheme
The implementation of the optimal operation schemes is based on scheme formulation. Here we first elaborate on the traditional formulation process of optimal operation schemes, whereas the improved process will be introduced in Section 3. Generally, the formulation of optimal operation schemes belongs to the category of “water to electricity” (i.e., to seek the reservoir operation process that makes the objective function reach its extremum given the reservoir’s status and the predicted inflow), which is divided into two parts: model development and model solution [12]. In reality, the Xiaoxuan hydropower station does not adopt the pricing strategy of peak-valley electricity price and its daily electricity price is a fixed value. In this paper, without considering the factor of electricity price, a maximum generated power model [13] is established, whose objective function and constraints are shown in Equation (1).
where E is the generated electricity of a hydropower station throughout an operation cycle; T the number of periods in the operation cycle; Nt the average hydropower output in period t; Δt the length of one period; the average outflow for power generation in period t; Ht the average water head in period t; Nt ( Ht) the function of hydropower output, obtained by calculation of in-plant economic operation; Zt the reservoir water level at the beginning of period t; Zmax, Zmin the bound of the reservoir water level; Vt the reservoir water storage at the beginning of period t; It the average inflow in period t; Qt the average outflow in period t; Nmax, Nmin the bound of the hydropower output; Zend the controlled reservoir water level at the end of the operation cycle; Qmax, Qmin the bound of the reservoir outflow; the demanded downstream ecological flow.
Use DP (dynamic programming) [14] to solve the above model and obtain the optimal operation scheme Ω. Given the predicted reservoir inflow, Ω corresponds with the optimal reservoir operation process which includes the water level process , the reservoir outflow process and the hydropower output process , as shown in Equation (2).
Correspondingly there are three modes of implementing the optimal operation scheme Ω: water level control, outflow control, and output control, whose qualitative analysis is in Section 2.1 and quantitative analysis in Section 2.2 and Section 2.3.
2.1. Implementation Mode of Optimal Operation Scheme
2.1.1. Water Level Control Mode
The water level control mode refers to keeping the actual reservoir water level process consistent with by proper control of the reservoir outflow. When this mode is used for actual operation, the reservoir water level is strictly controlled to be neither too high nor too low, which can effectively lower the risk of beyond-limit water level and facilitate the safe and stable operation of the reservoir. Nonetheless, this mode has the following demerits.
Difficulty in Accurate Implementation
In general, the AGC (automatic gain control) system of a hydropower station is unable to automatically control the generator sets so that the reservoir water level is the exact value as required at any moment. Hence with unknown reservoir inflow, it is a conundrum to maintain a smooth outflow so that the reservoir water level is exactly the specified value at the end of each period. Besides, due to a technical limitation in water level measurement, at present, the highest accuracy of water level control is only 1 cm. For a large reservoir, the change of water level within a period may be minor (less than 1 cm), which toughens the accurate control of the water level.
Water Level Deviation or Discarded Water
If the actual reservoir inflow is smaller than the predicted value, the reservoir may not be able to store water to the specified level at the end of each period even if it stops discharging water, which is a phenomenon called water level deviation. On the contrary, if the actual inflow is greater than predicted, the reservoir water level may still be higher than specified at the end of each period even if all generator sets run at full capacity. If the reservoir operation is controlled strictly by the water level at the end of each period, there will be discarded water. Here, this kind of “water actively discarded before the reservoir water level reaches its upper limit” is referred to as the first-type discarded water.
Low Power Generation Efficiency
Letting the generator sets run in the high-efficiency zone is one of the prerequisites for the economic operation of a hydropower station [15]. The in-plant economic operation is already considered in the optimal operation model. Therefore the generator sets will run in the high-efficiency zone after they are assigned output tasks from the optimal operation scheme. However, under the water level control mode, the output process of the hydropower station may be inconsistent with and thereby the generator sets may run outside the high-efficiency zone, which will lower the overall power generation efficiency of the hydropower station.
2.1.2. Outflow Control Mode
The outflow control mode means keeping the actual reservoir outflow process consistent with . If the reservoir water level is about to break the upper or lower limit, however, the reservoir water level must be controlled within the limits, allowing the actual outflow to be different from what is specified in the optimal operation scheme. This mode has the following shortcomings.
Beyond-Limit Water Level
With large actual inflow, the reservoir water level may approach its upper limit if the reservoir discharges water according to . To prevent over-limit water level, the reservoir must begin to discard water. Here, this kind of “water passively discarded lest the water level should exceed its upper limit” is called the second-type discarded water, which adversely affects the safe and economic operation of reservoirs and hydropower stations. On the contrary, if the actual inflow is small, the reservoir water level may approach its lower limit, prompting the reservoir to reduce or even stop its outflow, which will undermine its power generation and downstream ecology.
It should be noted that under the outflow control mode, when the reservoir water level is about to exceed its upper (or lower) limit, measures like discarding water (or reducing outflow) should be taken, otherwise the water level will definitely exceed its limit. Accordingly, this situation where “unconventional measures are taken so that the reservoir water level approaches but not exceeds its boundary” still falls into the scope of beyond-limit water level.
The First-Type Discarded Water or Low Power Generation Efficiency
Unlike the water level control mode, under the outflow control mode, the water level discrepancy may cause the generator sets’ dynamic characteristics to change. If the actual inflow is too large, the reservoir water level will be relatively high, and the water consumption rate will drop. As a result, it becomes impossible to reasonably distribute the flow that could have been sufficient for one generator set to run at full capacity: allocate it to one generator set and the first-type discarded water will be produced; allocate it to two sets and their power generation efficiency will be low. One way or the other, the economic operation of the hydropower station will be compromised.
2.1.3. Output Control Mode
The output control mode means keeping the actual hydropower output process consistent with . If the reservoir water level goes beyond the upper or lower limit, however, the reservoir operation must be controlled within the water level limit, allowing the actual power output to be different from what is specified in the optimal operation scheme. Of course, if the predicted reservoir inflow is large and there is already discarded water in the operation scheme, the output control mode should take this portion of discarded water into account. With high power generation efficiency, this mode is conducive to the stable operation of power grids but still bears the following drawbacks.
Beyond-Limit Water Level
The reason is similar to that discussed in the outflow control mode.
Output Obstruction
If the actual reservoir inflow is small and the water level is low, the expected output of generator sets will be less than that specified in the optimal operation scheme, and output obstruction may happen. In a certain period, if the optimal operation scheme arranges one generator set to run at full capacity, then in reality two sets are needed to run to meet the output requirement, and the power generation efficiency will be low; if all sets are arranged to be fully loaded, then the hydropower station cannot complete the output task.
2.2. Post-Evaluation of Implementation Modes of Optimal Operation Scheme
In this paper, the post-evaluation method is used to make a comparative analysis of the above three implementation modes. Post-evaluation means evaluating the effect of schemes after they are implemented [16]. This evaluation method can better reflect the actual application effect of the scheme under each implementation mode, providing a valuable reference for selecting the optimal implementation mode.
2.2.1. Evaluation Index System
In this paper, the evaluation index system is developed from the facets of the economy, safety, and stability of hydropower station operation.
Power Generation Benefits
Power generation benefit is an important indicator of the economic operation of hydropower stations. It consists of both the generated power during the operation cycle and the energy storage at the end of the cycle [17], which can be calculated by Equation (3). When the initial energy storage is fixed, the final energy storage can be indirectly represented by the increment of energy storage from the operation cycle [18].
where B is the total power generation benefits; Bin the power generation benefits in the operation cycle; Bafter the future power generation benefits; λ the energy efficiency coefficient of a hydropower station, which represents the amount of power that can be generated from per unit of water in the reservoir.
Risk Rate of Beyond-Limit Water Level
The risk rate of beyond-limit water level is an essential indicator of the safe and stable operation of a reservoir. It is composed of the risk rates of water level exceeding the upper and the lower limits, which can be calculated by Equation (4). It should be noted that under the water level control mode, even if the reservoir water level reaches the upper (or lower) limit, it is due to the implementation of the optimal operation scheme. So there will be no risk of beyond-limit water level, and the water discarded in this circumstance is categorized as the first-type discarded water.
where R is the risk rate of beyond-limit water level; , the risk rate of water level exceeding the upper or the lower limit; , the function of water level exceeding the upper or the lower limit in period t.
Discarded Water Quantity
Discarded water includes the first and the second types of discarded water, both of which influence the economic benefits of a hydropower station, and the latter also affects the safety and stability of reservoir operation. Thus the quantity of discarded water is indicative of both the profitability and the safety of hydropower station operation, which can be calculated by Equation (5).
where L is the discarded water quantity; La1, La2 the first-type or the second-type discarded water quantity; , the flow rate of the first-type or the second-type discarded water in period t.
2.2.2. Evaluation Procedure
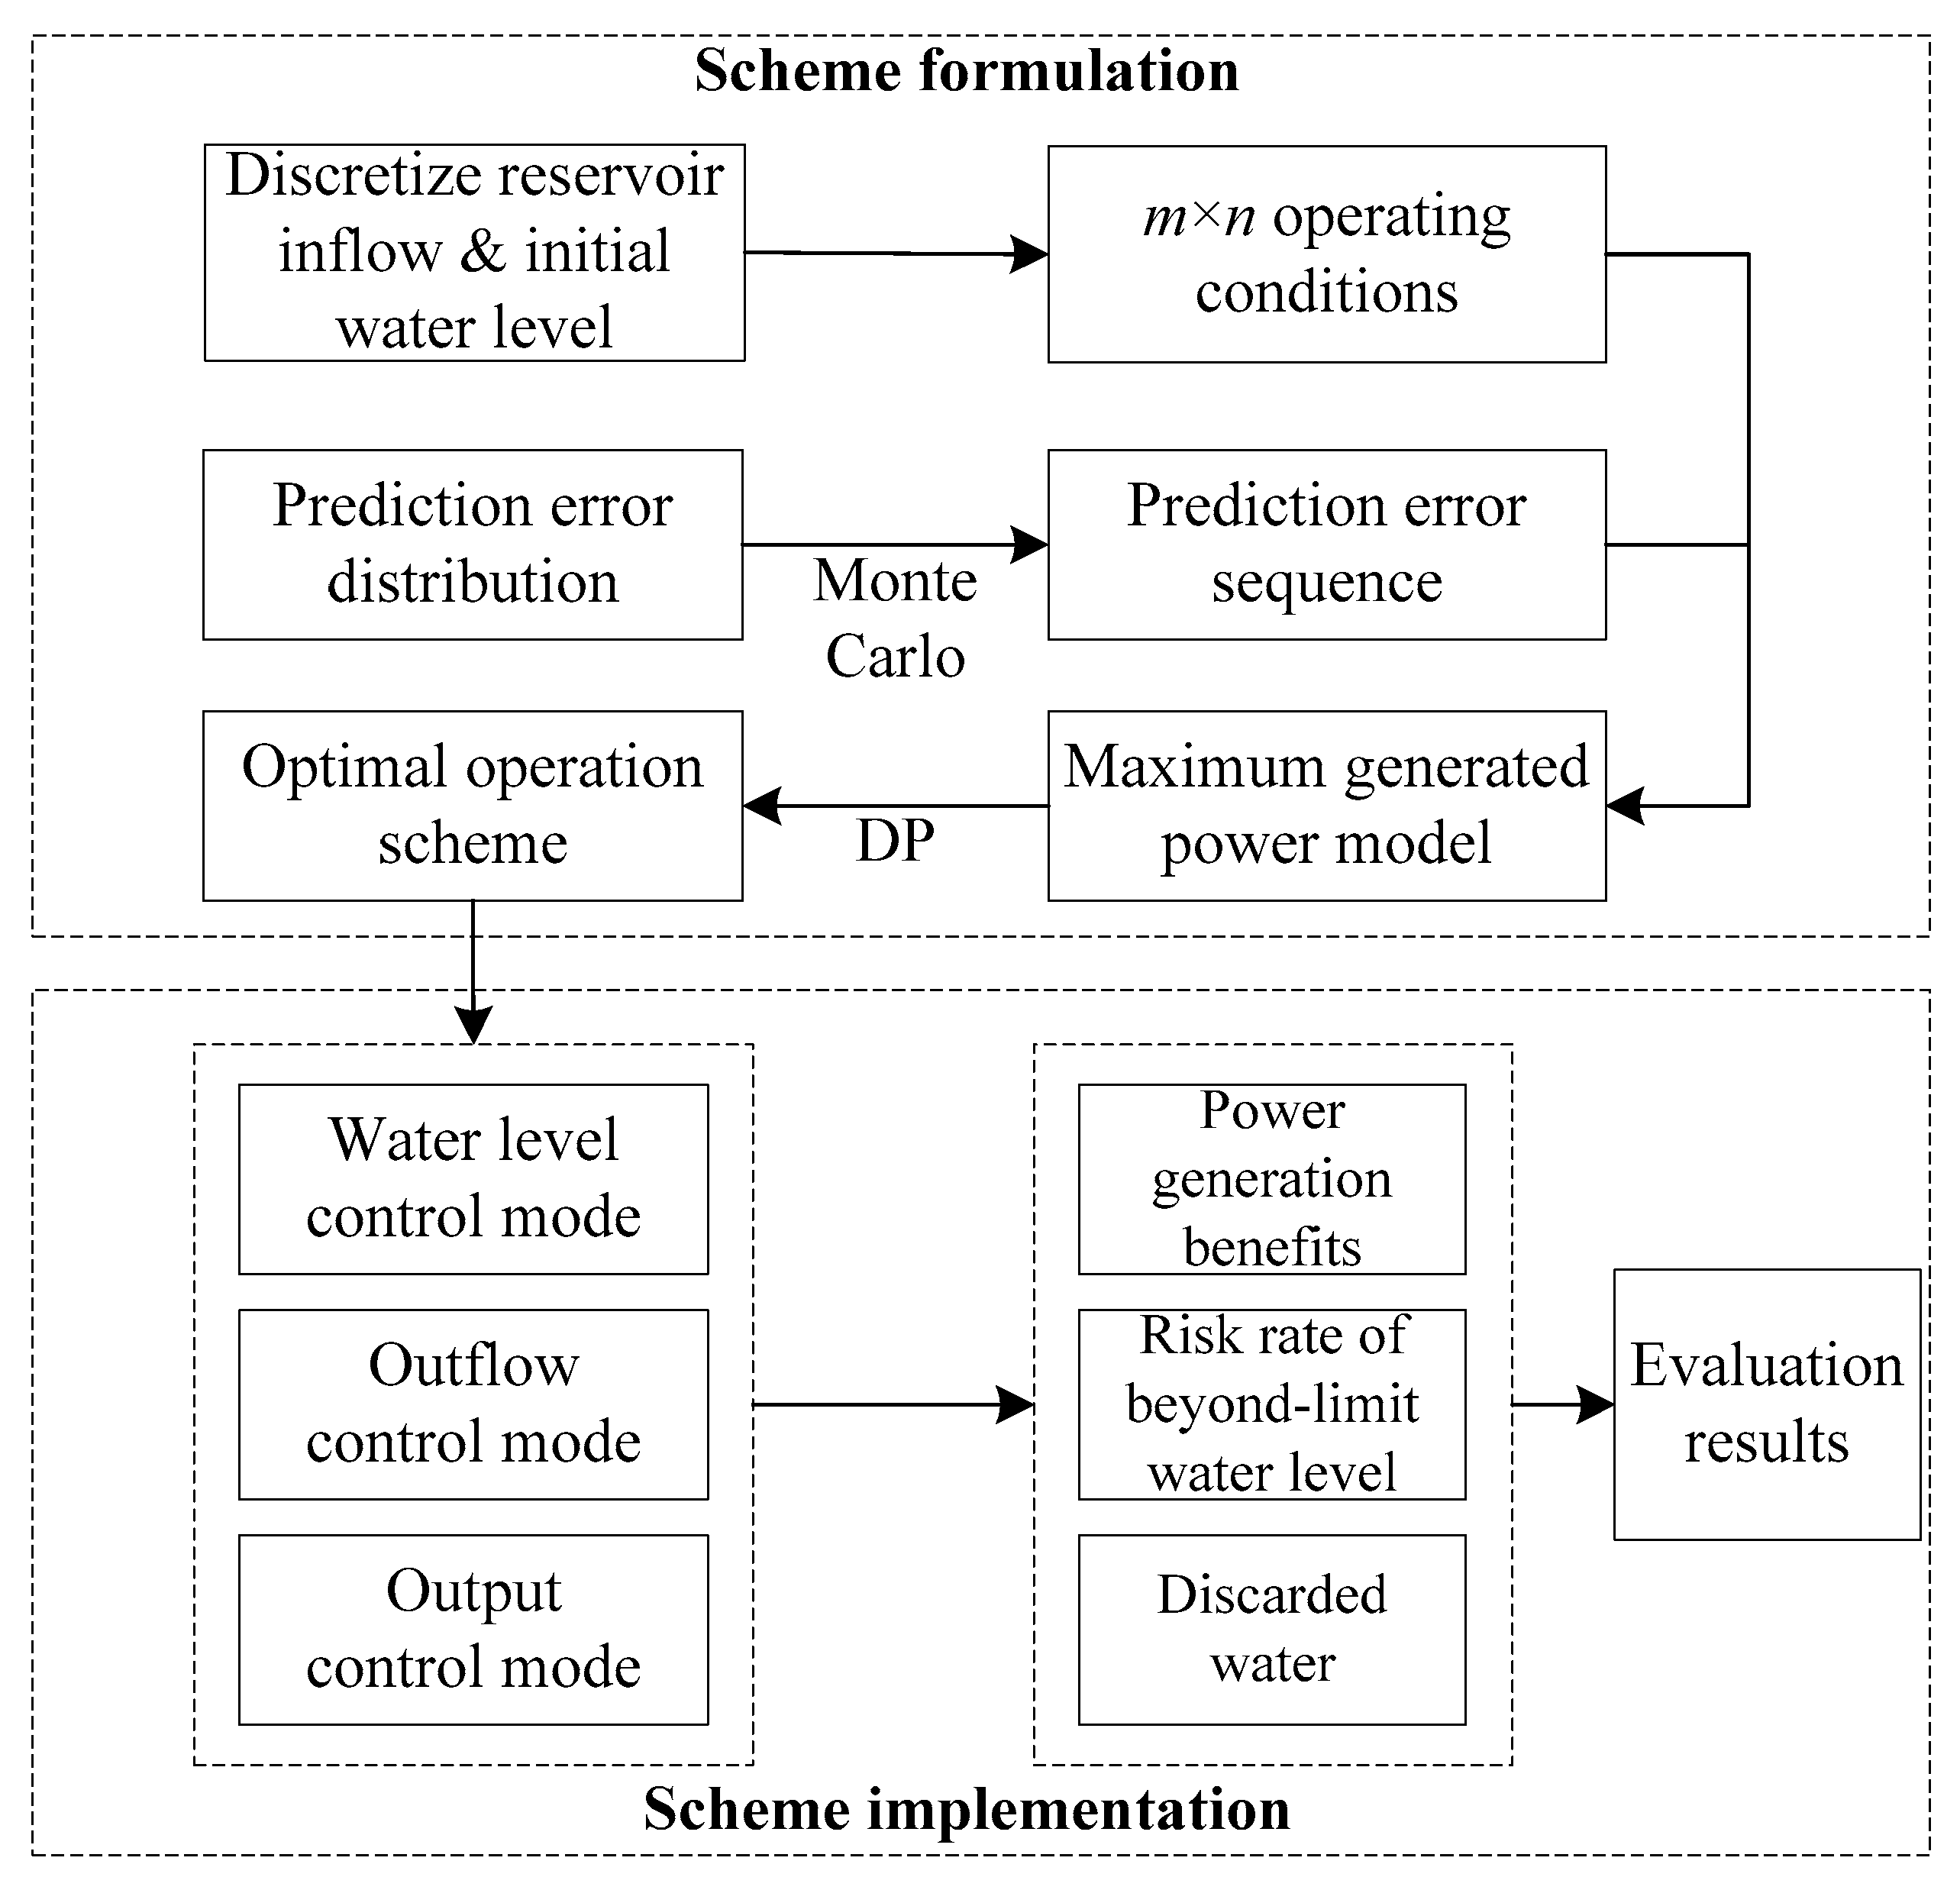
To increase the representativeness of the evaluation results, the simulative calculation of the scheme implementation process is conducted under all sorts of operating conditions. Reservoir inflow and water level are the key variables that determine an operating condition. In the simulation of operating conditions, for convenience reservoir inflow is assumed to stay unchanged throughout the entire operation cycle, and the initial water level represents the overall variation of water level during the cycle. Plus, as the prediction error of inflow causes the different application effects of different implementation modes, it is used as an additional variable. The evaluation procedure is detailed as follows and the calculation process is shown in Figure 1.
- Discretize the reservoir inflow I within its range [Imin, Imax] and get m discrete points; similarly, discretize the initial water level Z1 within its boundary [Zmin, Zmax] and get n discrete points. Combine the two sets of discrete points and obtain m × n operating conditions.
- Based on historical data, use the maximum entropy method [19] to fit the distribution of the inflow prediction error and obtain the maximum entropy distribution function. For a certain operating condition, use the Monte Carlo method [20] to randomly simulate a T-length sequence of prediction errors, and combine it with the actual inflow sequence to produce the predicted inflow sequence which is input to the foregoing maximum generated power model. Use DP to obtain the optimal operation scheme. Repeat this step until the optimal schemes for all operating conditions are formulated.
- With the actual inflow process, implement the optimal operation scheme under the water level control mode, the outflow control mode and the output control mode. Work out the index values of the three modes under all operating conditions, and obtain the evaluation results by comparative analysis.
2.3. Case Study: The 1st Scenario
The Du River stretches across China’s Shaanxi and Hubei Provinces with a total length of 354 km and a basin area of 1.25 × 10⁴ km2. The Xiaoxuan Reservoir lies in the upstream of the Du River in Zhushan County, Hubei Province, whose normal water level is 264 m, dead water level 261.3 m, regulating storage capacity 6.78 × 10⁶ m3 and average inflow 163 m3/s. The installed capacity of the Xiaoxuan Hydropower Station is 50 MW and the average annual generated energy is 1.494 × 10⁸ kW·h. In this paper, the operation cycle is one day long with 96 periods, each of which lasts 15 minutes. To make the initial reservoir water level better represent the overall variation of water level during the cycle, the final water level is set to be the same as the initial value.
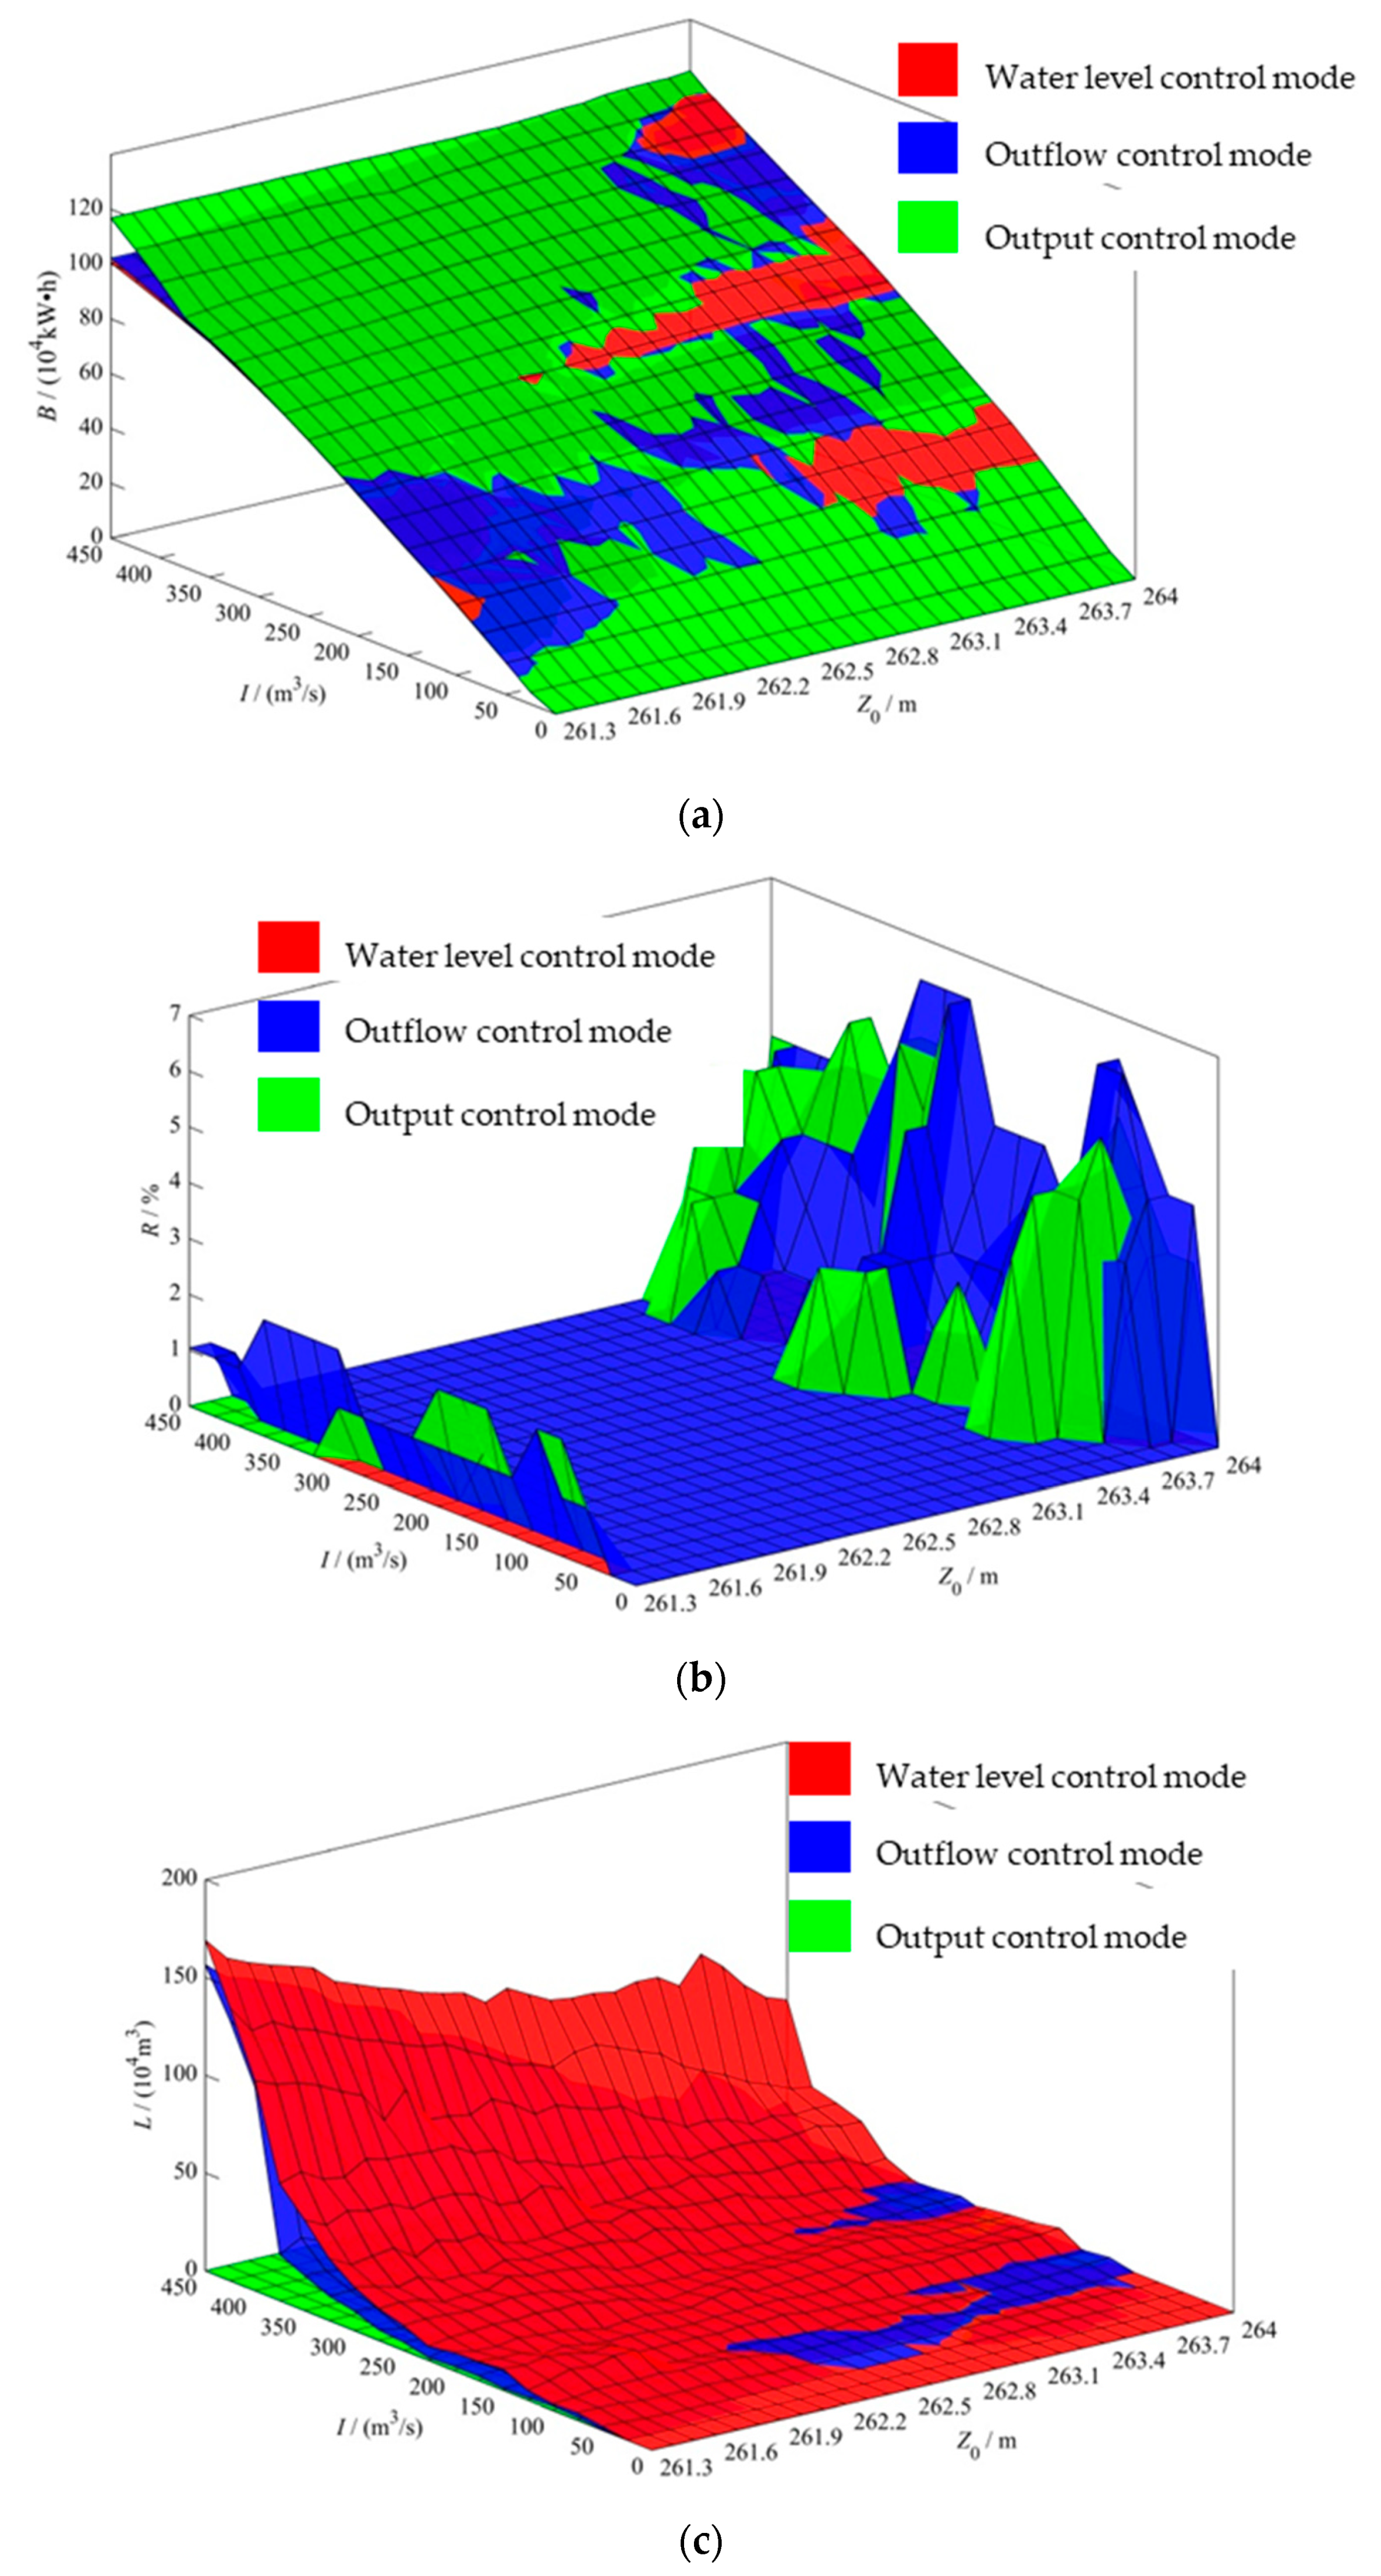
Except for flood-season regulation, the natural inflow of the Xiaoxuan Reservoir is within [0, 450] m3/s. This range is discretized at intervals of 25 m3/s and 19 discrete points are obtained. The initial water level of the Xiaoxuan Reservoir is between its dead water level and normal water level. The range [261.3, 264.0] m is discretized at intervals of 0.1 m and 28 discrete points are obtained. The two sets of discrete points are combined together and 532 operating conditions are obtained. According to historical data statistics, the maximum entropy function of the inflow prediction error distribution is shown in Equation (6), where x is the prediction error of the Xiaoxuan Reservoir inflow. The prediction error is added into each operating condition to generate the predicted inflow process, which is input to the maximum generated power model to work out the optimal operation scheme. Then, the scheme is implemented under the three modes and the corresponding evaluation indices are calculated. The above procedure is repeated 20 times and the average value of each index is obtained. The results are shown in Figure 2.
Figure 2a is a comparison of power generation benefits. Overall the green surface is the highest, followed by the blue one, and the red one comes last. Further calculation suggests that the average power generation benefits of the output control mode are greater than those of the other two modes (1.42% than the water level control mode and 1.12% than the outflow control mode). The reason is that under this mode the output process of the Xiaoxuan Hydropower Station is consistent with the optimal operation scheme, in which the in-plant economic operation is already considered and thereby the generator sets run in the high-efficiency zone. Hence the higher utilization rate of water resources increases the power generation benefits of the hydropower station.
Figure 2b is a comparison of the risk rate of beyond-limit water level. The red surface is the lowest (zero in height), which indicates that such a risk does not exist under the water level control mode (when the inflow is zero, the Xiaoxuan Hydropower Station halts production all day and the reservoir water level remains unchanged, so even if the initial water level is 261.3 m or 264 m there is no risk). The outflow and output control modes, however, carry such a risk under the operating conditions of reservoir water level being [261.3, 261.4] and [263.3, 264.0]. The blue surface is almost as high as the green one, meaning that their overall risk rates are roughly the same. In addition, the risk rate of beyond-upper-limit water level is greater than that of beyond-lower-limit water level. It is because, in the optimal operation scheme, whose objective is to maximize power output, the reservoir water level is relatively high to elevate the productive head of the hydropower station and thus boost the generated power per unit of water use. At a high water level, the upper limit will be easily exceeded if the actual inflow is large, while at a low water level the beyond-lower-limit risk will be minor even if the actual inflow is small.
Figure 2c is a comparison of discarded water quantity. It can be seen that when the inflow increases from 400 m3/s to 450 m3/s, there is a surge in discarded water quantity because the Xiaoxuan hydropower station cannot completely utilize the inflow water quantity, which leads to a sharp decrease in power generation benefits. Among the three control modes, the red surface is much higher than the other two surfaces, with the green one at the bottom. In other words, under most operating conditions, the water level control mode produces the largest amount of discarded water, followed by the outflow control mode and then the output control mode. It can be explained by the following reasons. Under the water level control mode, if the actual inflow is too large, there may still be discarded water even when the generator sets run at full capacity, and this situation will intensify with the increase of the excessive inflow. Under the outflow control mode, to avoid the beyond-upper-limit risk as the water level keeps rising, the reservoir may produce the second-type discarded water (which is not as planned). Also, there may be the first-type discarded water as the actual dynamic characteristics of the generator sets deviate from the optimal operation scheme. By contrast, the output control mode produces the least discarded water because on the one hand, the outflow process is derived from the output process and there is no extra first-type discarded water except for that originally in the operation scheme; on the other hand, only under extreme conditions will the beyond-limit risk arise and the second-type discarded water be produced.
In summary, the water level control mode has the lowest risk rate of beyond-limit water level, the poorest power generation benefits and the largest quantity of discarded water, which is against the efficient and economic operation of hydropower stations and therefore not recommended in actual operation. Between the outflow control mode and the output control mode, there is little difference in the beyond-limit risk rate, but the latter produces less discarded water and higher power generation benefits. To balance the risk and benefit, the output control mode is recommended as the optimal implementation mode in actual operation.
3. Formulation of the Optimal Operation Scheme Integrated with Operation Rules
Although the output control mode has the best overall application effect, it still bears the risk of beyond-limit water level and the second-type discarded water. As a remedy, this paper draws on the long-term experience of the operation staff, incorporates the concept of warning water level from operation rules into the optimal operation model, and puts forth a new model integrated with operation rules. Without compromising benefits, a more secure operation scheme is formulated to compensate for the shortcomings of the output control mode. Here the Xiaoxuan Reservoir is used as an example.
3.1. Operation Rules
The Xiaoxuan Reservoir has a small storage capacity and weak regulation ability. A difference of only 10 m3/s between its outflow and inflow can change the reservoir water level by 1.5 cm/h, which toughens the operation work. For one thing, a large inflow is too much for the Xiaoxuan’s generator sets to harness and will make the reservoir water level soar to the upper limit, after which discarded water will ensue. On the other hand, if the inflow is small, the outflow needs to be at least 16.7 m3/s to meet the downstream ecological demand. However, to avoid low power generation efficiency at a small flow rate the reservoir usually runs only one generator set at full capacity. In this case, the reservoir water level will drop rapidly to the point where the lower limit is reached and water becomes unavailable.
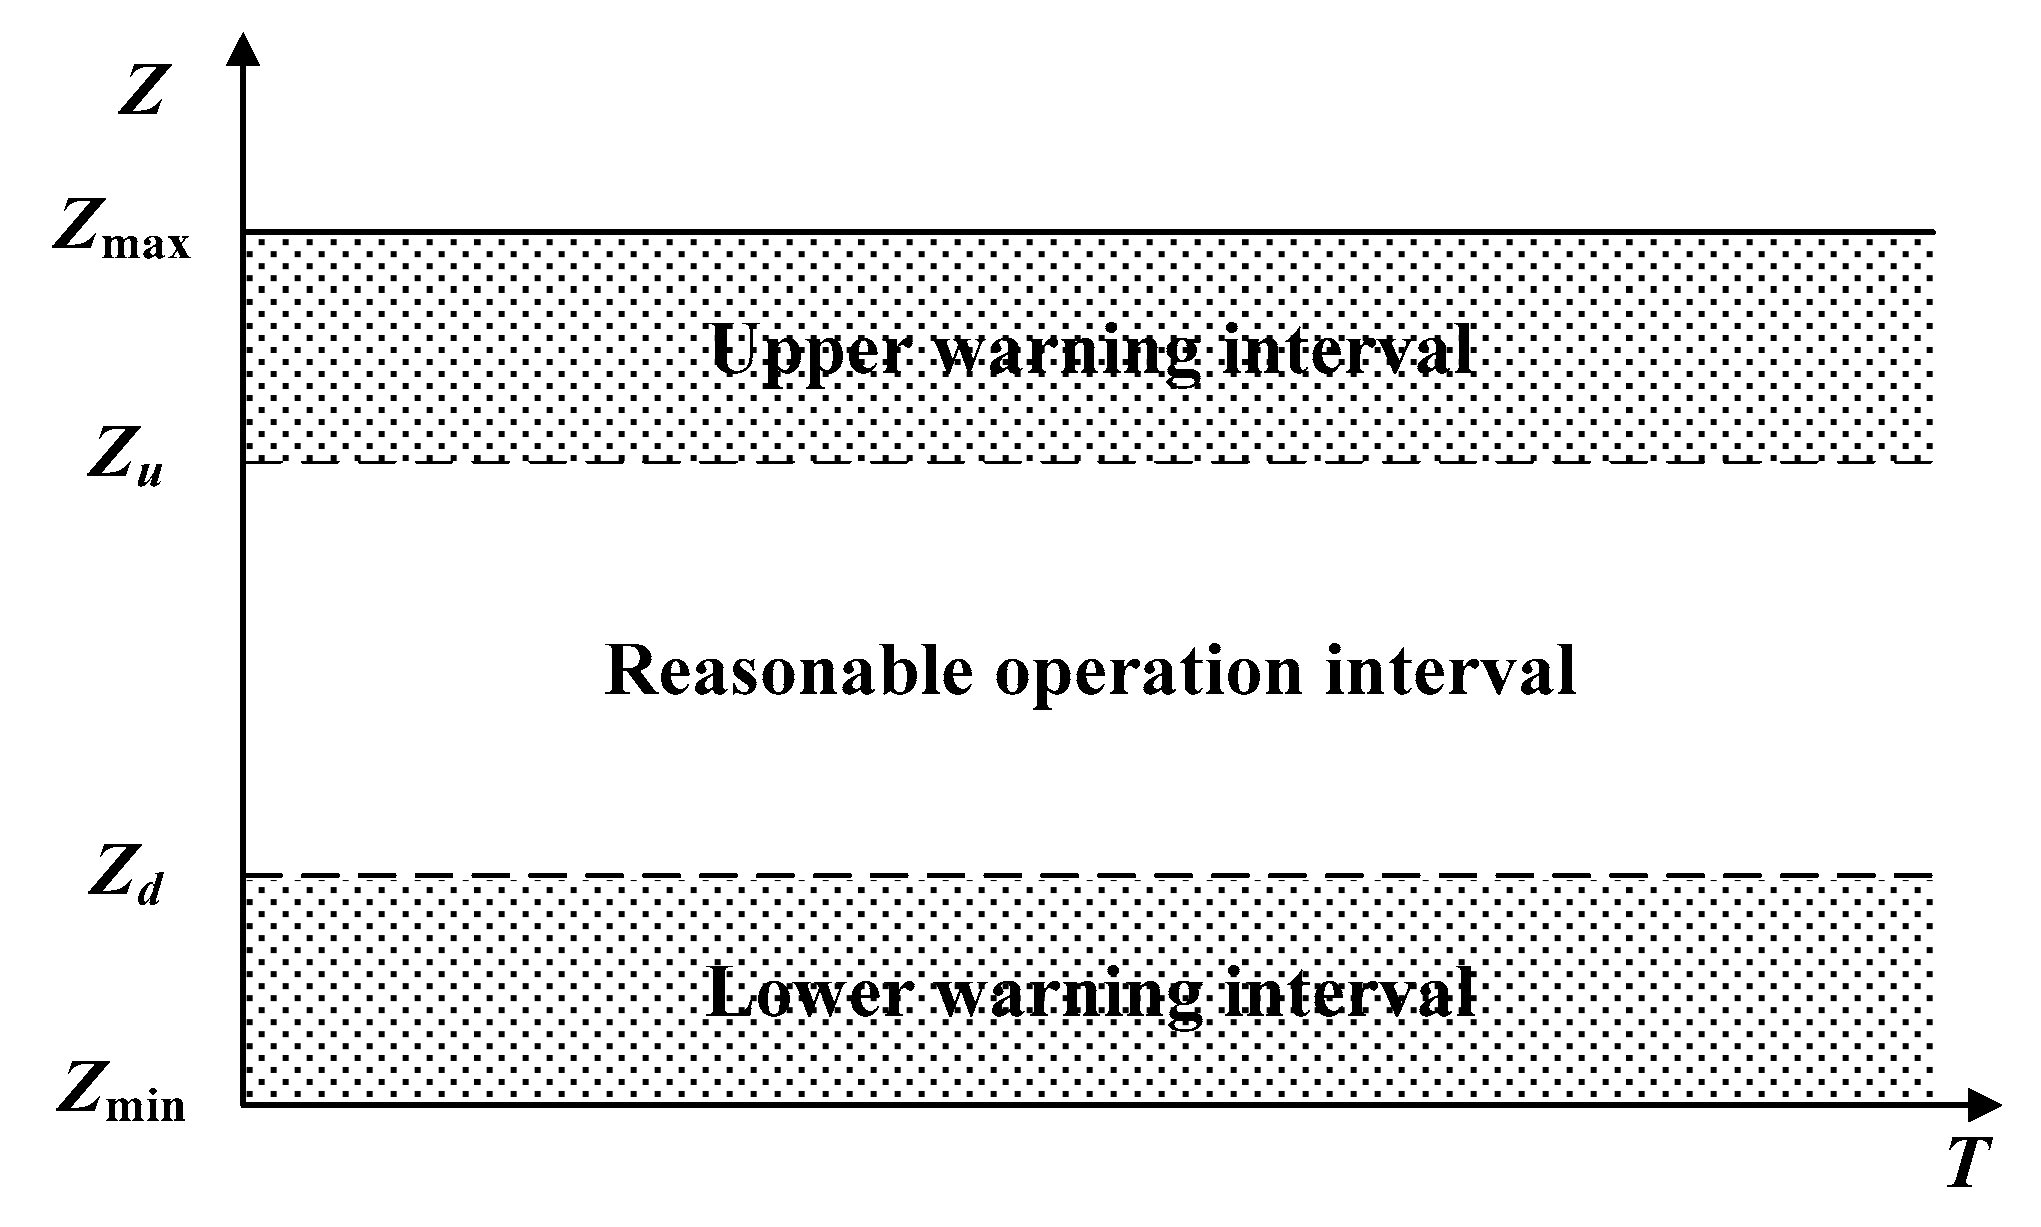
Through long-term practice, the operation staff have amassed abundant experience and made some rules: based on operation experience, an upper warning water level Zu and a lower warning water level Zd are determined, the area between which is called the reasonable operation interval, as shown in Figure 3. If the reservoir water is above the upper warning level, then all generator sets should run at full capacity to lower the water level as much as possible; if the water level is within the reasonable operation interval, then control the number of running generator sets and run them in the high-efficiency zone, keeping the water level basically unchanged; if the reservoir water is below the lower warning level, then the reservoir should discharge 16.7 m3/s of outflow.
3.2. Maximum Generated Power Model Integrated with Operation Rules
In the foregoing traditional maximum generated power model, the feasible region of the Xiaoxuan Reservoir water level is between the upper and lower limits, where all the discrete points are independent of subjective preference. The optimal water level process determined by this model may lean close to the upper (or lower) limit. Applying this optimal operation scheme is likely to trigger the risk of beyond-limit water level. In contrast, the operation rules set the warning water levels and contain the reservoir water level within the reasonable operation interval, which can significantly reduce the beyond-limit risk and the discarded water quantity while keeping the high efficiency of generator sets. Therefore improvement is made to develop the maximum generated power model integrated with operation rules, by adding the constraint of reasonable operation interval of water level into the original feasible region. When the reservoir water level exceeds the upper or lower warning water level, the objective function will be altered by the penalty function shown in Equation (7).
where P is the penalty term and W the penalty coefficient.
The improved model splits the feasible region of the original optimization problem. Those discrete points of water level outside the reasonable operation interval, though within the feasible region, correspond to high risks. Therefore, the optimal solution of the model will generally stay out of the upper or lower warning interval unless the inflow is continually too large or too small. By this means some reservoir storage capacity is reserved for all kinds of possible future inflow, which can greatly reduce the risk of beyond-limit water level and make the model more suitable for actual production. However, if the inflow prediction error is too large, the optimal operation scheme integrated with operation rules may still create the risk of beyond-limit water level, in which the operation rules should be used for real-time correction: if the reservoir water exceeds the warning level, the optimal operation scheme should be replaced with the normal operation rules.
3.3. Case Study: The 2nd Scenario
Three typical operating conditions of the Xiaoxuan Reservoir are selected for case study, as shown in Table 1. In the first condition, the actual inflow is nearly the same as the predicted value and the initial water level is within the reasonable operation interval (the upper warning level: 263.5 m, the lower warning level: 261.8 m). The second condition has larger-than-predicted actual inflow and higher initial water level, whereas it is the opposite in the third condition. These three conditions are common in actual operation, yet they correspond to different situations. The 1st condition is relatively safe for the Xiaoxuan Reservoir, while the 2nd and the 3rd conditions (water level approximates to the limits and the error of predicted inflow is large) may easily incur the risk of beyond-limit water level. For each condition, both the traditional and the improved maximum generated power models are established and solved by DP to obtain the traditional optimal operation scheme and the optimal operation scheme integrated with operation rules (hereinafter referred to as the traditional scheme and the integrated scheme respectively), which are then implemented under the output control mode.
3.3.1. The 1st Operating Condition
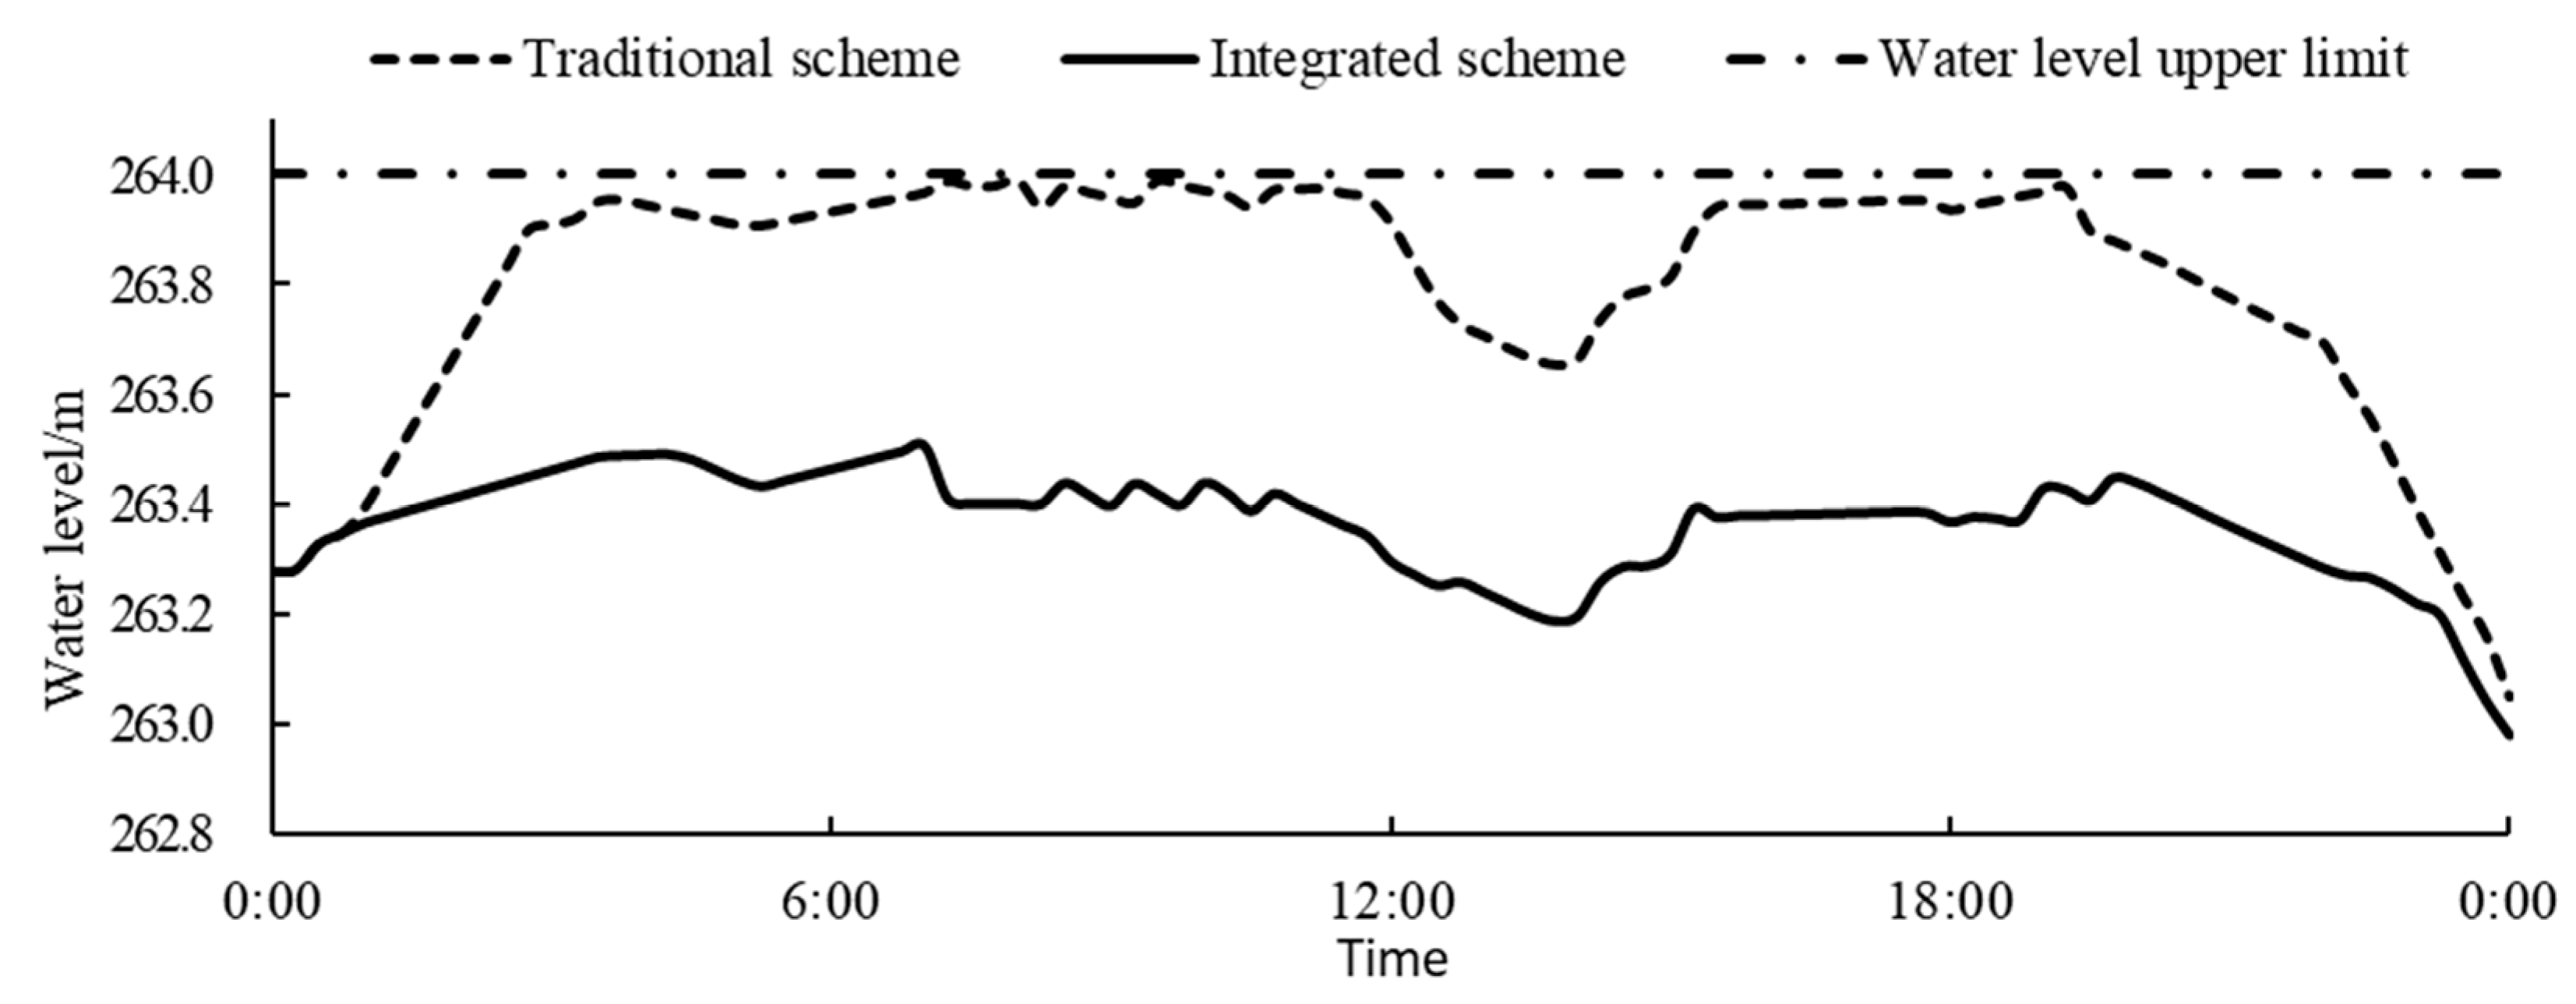
The calculation results of the first operating condition are shown in Table 2 and Figure 4. When the initial water level is moderate and the predicted inflow is accurate, no matter which operation scheme is adopted, there is no risk of beyond-limit water level and thus zero discarded water. Due to the prediction error, it cannot be ensured that the final water level is consistent with the specified value as the scheme is implemented. In consequence, the two types of schemes have different final reservoir water levels, i.e., different amounts of hydropower that can be generated in the future. Therefore, when calculating the evaluation index of power generation benefits, not only the output within the operation cycle but also the future power generation benefits should be considered, which validates Equation (3). Table 2 demonstrates that the traditional scheme yields slightly higher power generation benefits than the integrated scheme, owing to operation at a higher water level as can be seen from Figure 4. Even with high prediction accuracy, the traditional scheme is risky in that the water level is very close to the upper limit, which may entail the beyond-limit risk once the actual inflow grows too large.
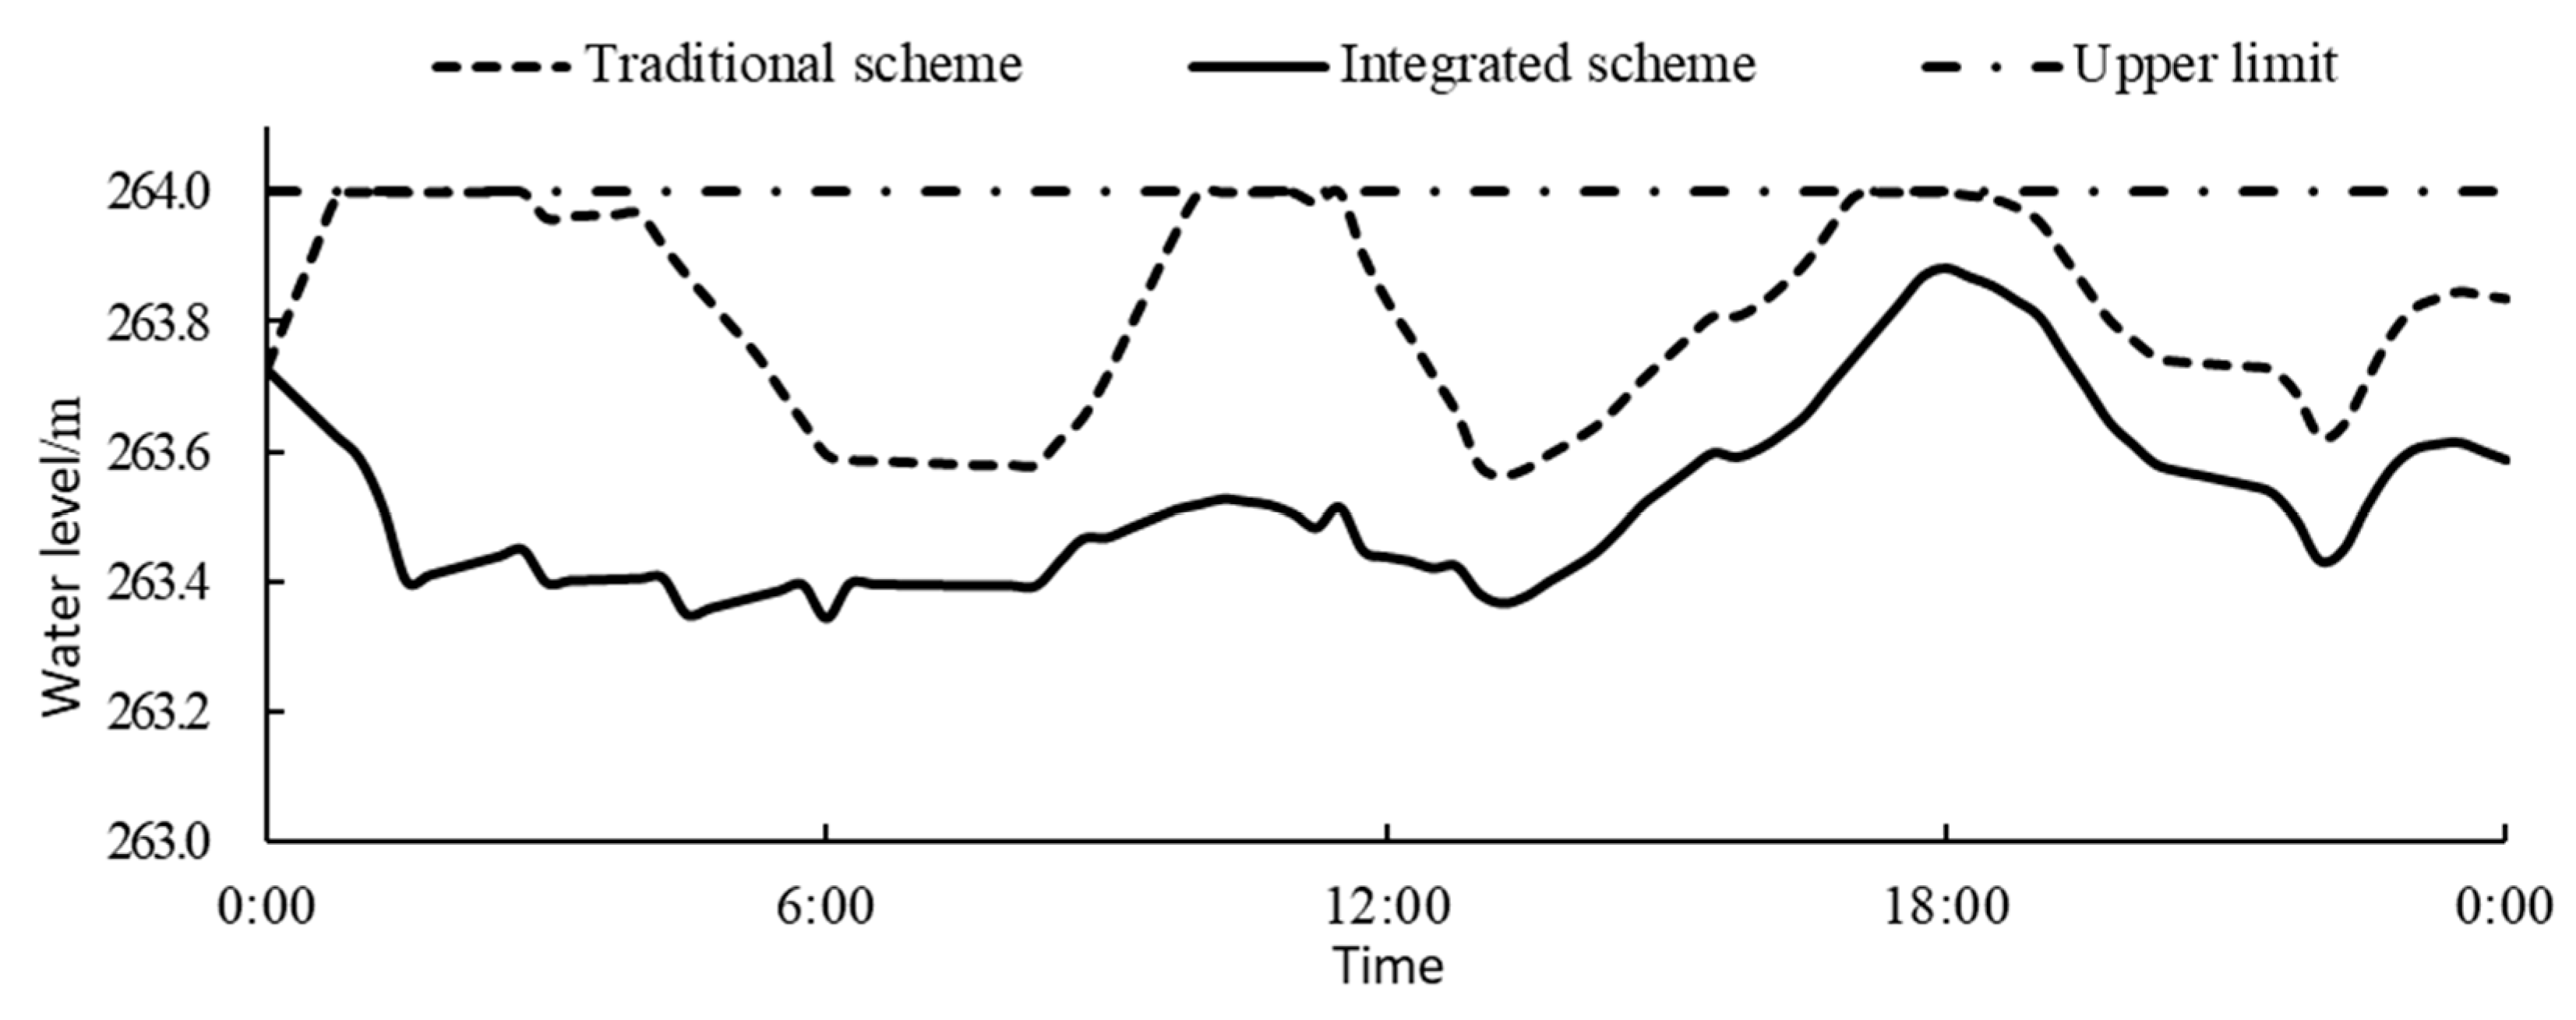
3.3.2. The 2nd Operating Condition
The calculation results of the second operating condition are shown in Table 3 and Figure 5. Given a relatively high initial water level and large inflow, in the traditional scheme, the water level exceeds the upper limit three times, which undermines the safe and stable operation of the reservoir and causes some second-type discarded water. On account of the benefit loss from discarded water, the traditional scheme produces lower power generation benefits even with a higher water level than the integrated scheme. By comparison, the integrated scheme operates the reservoir around the upper warning water level in the first half of the day, where the productive head is relatively low, but 0.5 m of storage capacity is reserved. In the second half of the day when the inflow increases sharply, the reservoir can absorb this surge of water and convert it into electric energy, which leads to fewer losses from discarded water and thus higher power generation benefits than the traditional scheme.
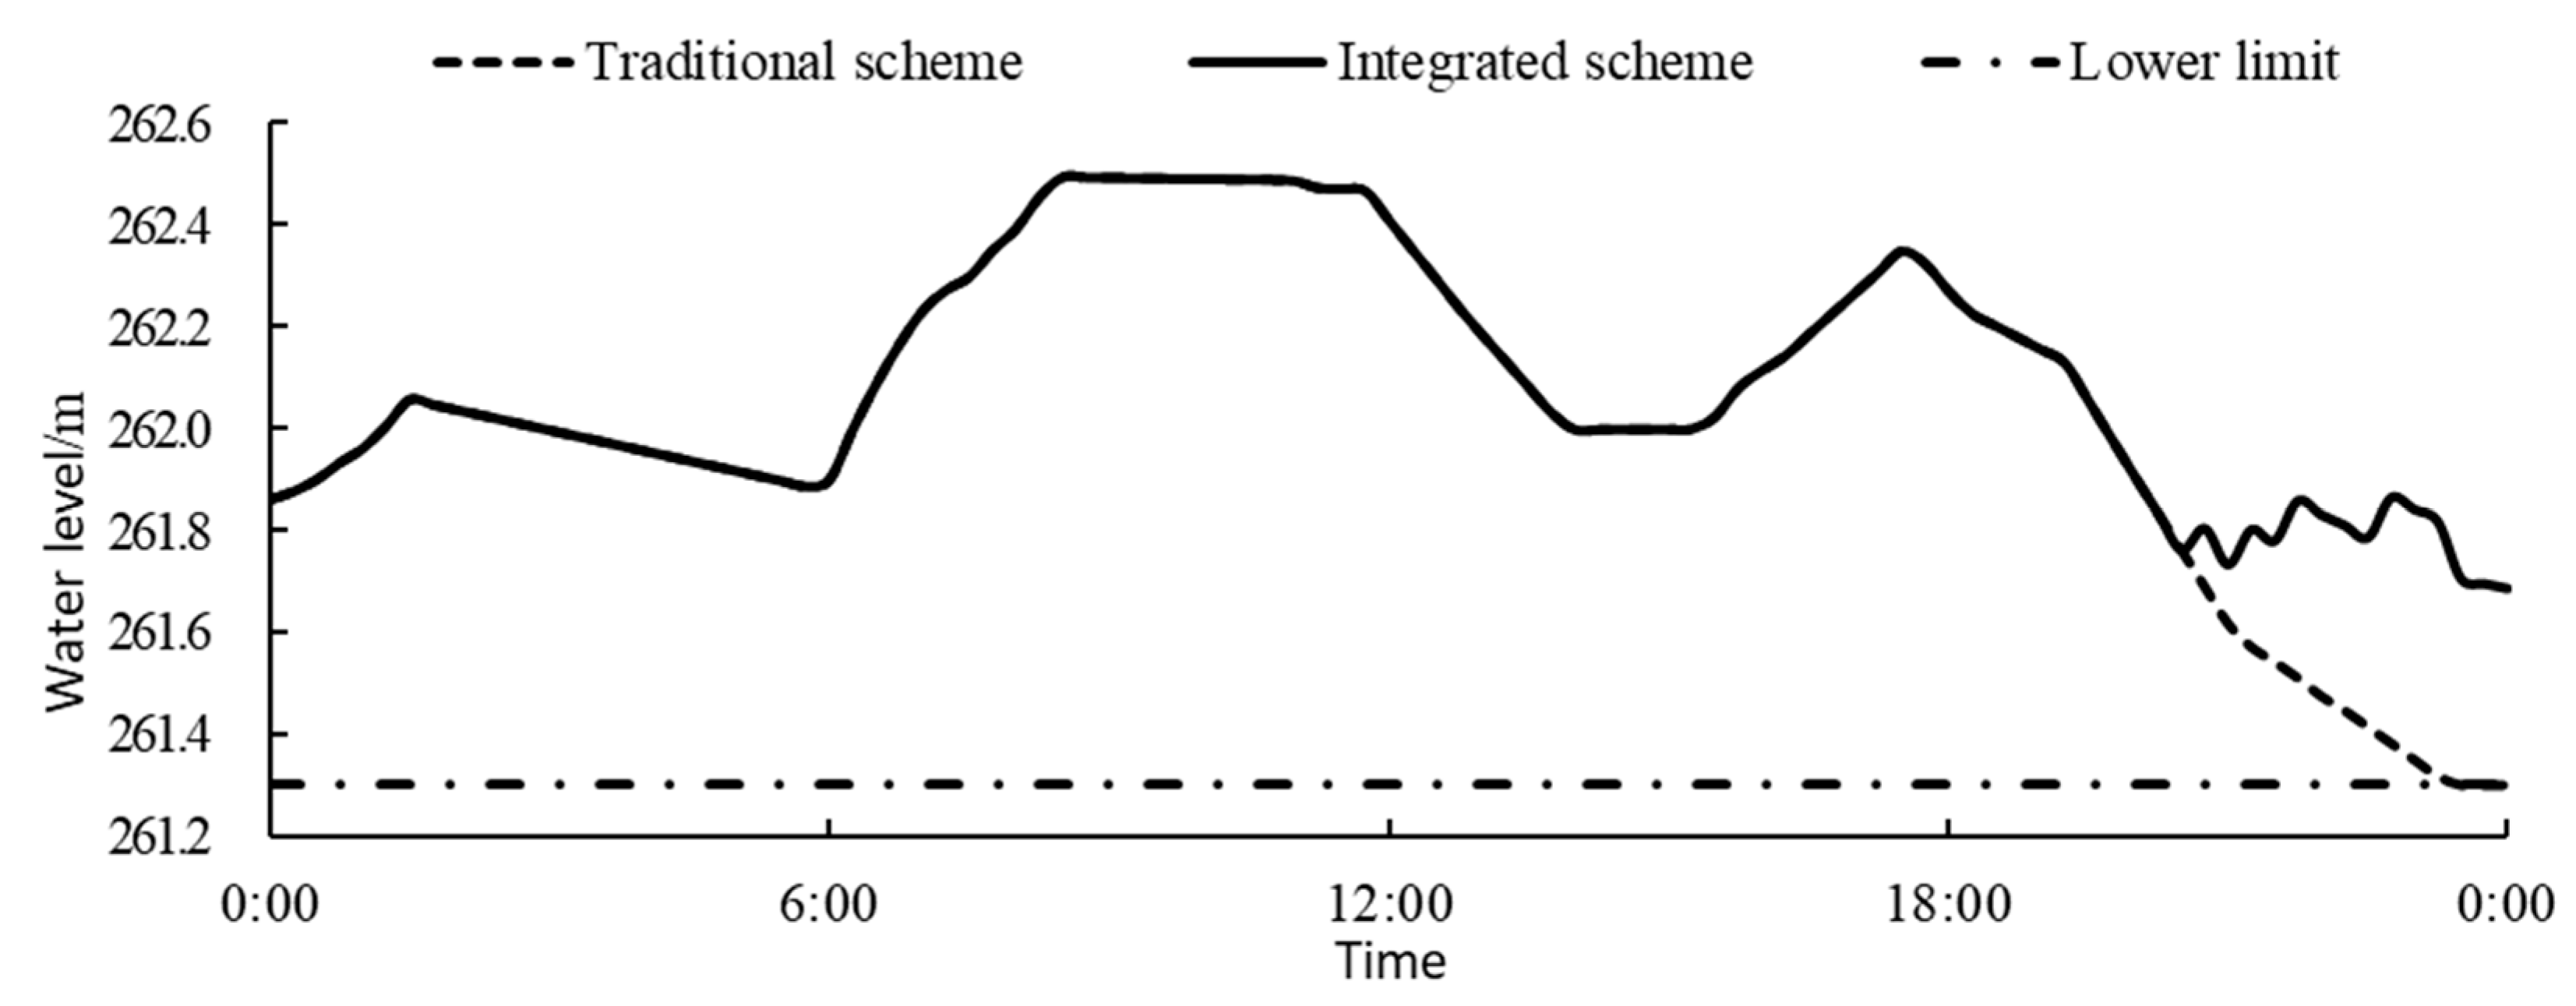
3.3.3. The 3rd Operating Condition
The calculation results of the third operating condition are shown in Table 4 and Figure 6. When the predicted inflow is too large, in the traditional scheme the overall power output is too high. The reservoir water level may be lower than expected (especially when it is already low at the beginning) and easily fall below the lower limit. As is shown in Figure 6, between 23:30 and 24:00 the reservoir water level in the traditional scheme is below the lower limit, which cannot meet the demand of ecological flow and may bring about damage to the downstream ecological environment. Besides, due to the lack of water in these two periods, the generator sets are forced to shut down, which severely disrupts the power generation process and results in lower benefits. In the integrated scheme, the water level before 20:30 is the same as the traditional scheme. At 20:30, the water level is at 261.76 m, which is below the lower warning level. Afterward, the integrated scheme is revised by the operation rules to reduce the power output, which effectively prevents the water level from exceeding the lower limit and enhances the power generation benefits.
3.3.4. Result Discussions
By analyzing the calculation results of the above three operating conditions, it can be seen that due to the lack of warning water level constraint in the traditional optimal operation model, Xiaoxuan’s water level corresponding to the traditional scheme is often near the upper and lower limits. With errors in predicting the reservoir inflow, this scheme is prone to create the risk of beyond-limit water level, thus producing discarded water or damaging the downstream ecological water supply. In contrast, the integrated scheme which considers the constraint of warning water level interval reserves 0.5 m of storage capacity for operation. In this way, even if the actual inflow is greatly different from the predicted value, the reserved storage capacity can be used to deal with adverse situations. Therefore, the integrated scheme can ensure a safer and more stable operation, substantially reducing the risk of beyond-limit water level. When it comes to the power generation benefits, the integrated scheme is far better than the traditional scheme in the 2nd and the 3rd conditions. Although the traditional scheme produces slightly higher power generation benefits than the integrated scheme in the 1st condition, it is at the cost of the possible risk of over-limit water level and hence not recommended. In summary, balancing the risks and benefits of the Xiaoxuan Reservoir operation, the integrated scheme is more advantageous over the traditional one.
4. Conclusions
In this paper, research is conducted on the formulation and implementation of short-term optimal reservoir operation schemes. First, the traits of the three implementation modes of operation schemes (water level control, outflow control, and output control) are qualitatively analyzed and an evaluation index system is developed to assess the three modes with the method. After the optimal implementation mode is determined, operation experience is used to improve the optimal operation model, making it more suitable for optimal reservoir operation under the influence of uncertain factors. Through the case study of the Xiaoxuan Reservoir, the following conclusions can be drawn.
- Compared with the water level control mode and the outflow control mode, the output control mode has the advantages of less discarded water and more power generation benefits with acceptable risk rate of beyond-limit water level, making it more suitable for the actual production of the Xiaoxuan Hydropower Station. Therefore, from the perspective of risk-benefit balance, it is recommended that the Xiaoxuan Reservoir adopt the output control mode in practical operation.
- With the setup of warning water levels, the optimal operation model integrated with operation rules combines the advantages of both conventional and optimal operation. Accordingly, the formulated operation scheme, along with the output control mode, significantly reduces the risk rate of beyond-limit water level and discarded water while maintaining the power generation benefits, which can effectively guide the safe and economic operation of the reservoir.
Author Contributions
Conceptualization, Y.Z. and C.J.; data curation, J.W.; formal analysis, H.Y.; methodology, H.Y.; supervision, C.J.; validation, C.J.; writing—original draft, Y.Z., J.W., and H.Y.; writing—review and editing, Y.Z. and J.W.
Funding
This research received no external funding.
Acknowledgments
This study was financially supported by National Natural Science Foundation of China (51709105), the 13th Five-Year National Key Program of China (2016YFC0402208), the Fundamental Research Funds for the Central Universities (2019MS031). The authors are grateful to the anonymous reviewers for their comments and valuable suggestions.
Conflicts of Interest
The authors declare no conflict of interest.
References
- Ma, L.; Wang, H.; Lu, B.; Qi, C. Application of Strongly Constrained Space Particle Swarm Optimization to Optimal Operation of a Reservoir System. Sustainability 2018, 10, 4445. [Google Scholar] [CrossRef]
- Xu, B.; Zhong, P.; Stanko, Z.; Zhao, Y.; Yeh, W.W.G. A multiobjective short-term optimal operation model for a cascade system of reservoirs considering the impact on long-term energy production. Water Resour. Res. 2015, 51, 3353–3369. [Google Scholar] [CrossRef] [Green Version]
- Ge, X.; Zhang, L.; Shu, J.; Xu, N. Short-term hydropower optimal scheduling considering the optimization of water time delay. Electr. Power Syst. Res. 2014, 110, 188–197. [Google Scholar] [CrossRef]
- Ji, C.; Li, C.; Wang, B.; Liu, M.; Wang, L. Multi-Stage Dynamic Programming Method for Short-Term Cascade Reservoirs Optimal Operation with Flow Attenuation. Water Resour. Manag. 2017, 31, 4571–4586. [Google Scholar] [CrossRef]
- Hossain, M.S.; El-Shafie, A.; Mahzabin, M.S.; Zawawi, M.H. System performances analysis of reservoir optimization–simulation model in application of artificial bee colony algorithm. Neural Comput. Appl. 2018, 30, 2101–2112. [Google Scholar] [CrossRef]
- Fu, X.; Liu, Q.; Wu, S. Risk assessment approach for reservoir operation performance. J. Hydraul. Eng. 2012, 43, 987–990. [Google Scholar]
- Ahmadi, A.; Karamouz, M.; Moridi, A. Robust Methods for Identifying Optimal Reservoir Operation Strategies Using Deterministic and Stochastic Formulations. Water Resour. Manag. 2010, 24, 2527–2552. [Google Scholar] [CrossRef]
- Karami, F.; Dariane, A.B. Many-Objective Multi-Scenario Algorithm for Optimal Reservoir Operation Under Future Uncertainties. Water Resour. Manag. 2018, 32, 3887–3902. [Google Scholar] [CrossRef]
- Zhou, T. Research of Reservoirs and Hydropower Stations Optimal Operation and Benefit Evaluation. Ph.D. Thesis, North China Electric Power University, Beijing, China, 2014. [Google Scholar]
- Ji, C.; Li, R.; Tian, K.; Zhang, Y.; Li, C. A coupling model of load adjustment for cascade hydropower stations based on inflow uncertainty: A case study of Jinping-guandi cascade hydropower stations. J. Hydraul. Eng. 2017, 48, 1–12. [Google Scholar]
- Yu, Y.; Wang, C.; Wang, P.; Hou, J.; Qian, J. Assessment of multi-objective reservoir operation in the middle and lower Yangtze River based on a flow regime influenced by the Three Gorges Project. Ecol. Inform. 2017, 38, 115–125. [Google Scholar] [CrossRef]
- Chen, D.; Li, R.; Chen, Q.; Cai, D. Deriving Optimal Daily Reservoir Operation Scheme with Consideration of Downstream Ecological Hydrograph Through A Time-Nested Approach. Water Resour. Manag. 2015, 29, 3371–3386. [Google Scholar] [CrossRef]
- Fu, X.; Li, A.; Wang, L.; Ji, C. Short-term scheduling of cascade reservoirs using an immune algorithm-based particle swarm optimization. Comput. Math. Appl. 2011, 62, 2463–2471. [Google Scholar] [CrossRef] [Green Version]
- Raso, L.; Malaterre, P.; Bader, J. Effective Streamflow Process Modeling for Optimal Reservoir Operation Using Stochastic Dual Dynamic Programming. J. Water Res. Plan. Man. 2017, 143, 4017003. [Google Scholar] [CrossRef]
- Ji, C.; Yu, H.; Wu, J.; Yan, X.; Li, R. Research on Cascade Reservoirs’ Short-Term Optimal Operation under the Effect of Reverse Regulation. Water 2018, 10, 808. [Google Scholar] [CrossRef]
- Wang, M.; Niu, D. Research on project post-evaluation of wind power based on improved ANP and fuzzy comprehensive evaluation model of trapezoid subordinate function improved by interval number. Renew. Energy 2019, 132, 255–265. [Google Scholar] [CrossRef]
- Wang, J. Short-term generation scheduling model of Fujian hydro system. Energ. Convers. Manag. 2009, 50, 1085–1094. [Google Scholar] [CrossRef]
- Ji, C.; Yu, H.; Yan, X.; Wei, X.; Li, J. Improved model of maximum energy storage increment based on progressive approximation. J. Hydroelectr. Eng. 2019, 38, 47–56. [Google Scholar]
- Zhang, Y.; You, J.; Ji, C.; Zhao, Y. Risk Analysis Method for Flood Control Operation of Cascade Reservoirs Considering Prediction Error. In AER-Advances in Engineering Research, Proceedings of the 3rd Annual International Conference on Sustainable Development, Tianjin, China, 14–16 July 2017; Haur, L., Tsang, Y., Dzikuc, M., Aziz, H., Psomopoulos, C., Eds.; Atlantis Press: Paris, France, 2017. [Google Scholar] [Green Version]
- Motevalli, M.; Zadbar, A.; Elyasi, E.; Jalaal, M. Using Monte-Carlo approach for analysis of quantitative and qualitative operation of reservoirs system with regard to the inflow uncertainty. J. Afr. Earth Sci. 2015, 105, 1–16. [Google Scholar] [CrossRef]
Figure 1.
Calculation flow chart.

Figure 2.
Calculation results of simulative operation. (a) Power generation benefits; (b) Risk rate of beyond-limit water level; (c) Discarded water.
Figure 2.
Calculation results of simulative operation. (a) Power generation benefits; (b) Risk rate of beyond-limit water level; (c) Discarded water.

Figure 3.
Schematic diagram of the reasonable operation interval of water level.

Figure 4.
Water level variation of each scheme in the 1st operating condition.

Figure 5.
Water level variation of each scheme in the 2nd operating condition.

Figure 6.
Water level variation of each scheme in the 3rd operating condition.


Table 1.
Information about each operating condition.
| Operating Condition | Daily Inflow of the Xiaoxuan Reservoir | Daily Initial Water Level/m | ||
|---|---|---|---|---|
| Predicted Value/(m3/s) | Actual Value/(m3/s) | Relative Error/% | ||
| 1st | 272.43 | 275.45 | −1.10 | 263.28 |
| 2nd | 348.91 | 383.62 | −9.05 | 263.73 |
| 3rd | 150.26 | 130.08 | 15.52 | 261.86 |
Table 2.
Calculation results of the 1st operating condition.
| Operation Scheme | Calculation Results | Evaluation Index | ||||
|---|---|---|---|---|---|---|
| Generated Power/104 kW·h | Reservoir Inflow Quantity/104 m3 | Reservoir Outflow Quantity/104 m3 | Power Generation Benefits/104 kW·h | Risk Rate of Beyond-Limit Water Level/% | Discarded Water Quantity/104 m3 | |
| (1) | (2) | (3) | (4) 1 | (5) | (6) | |
| Traditional scheme | 78.34 | 2379.87 | 2439.17 | 76.51 | 0 | 0 |
| Integrated scheme | 77.84 | 2379.87 | 2457.13 | 75.46 | 0 | 0 |
1 (4) = (1) + λ × [(2) − (3)], for the Xiaoxuan Hydropower Station λ = 0.0308 kW·h.
Table 3.
Calculation results of the 2nd operating condition.
| Operation Scheme | Calculation Results | Evaluation Index | ||||
|---|---|---|---|---|---|---|
| Generated Power/104 kW·h | Reservoir Inflow Quantity/104 m3 | Reservoir Outflow Quantity/104 m3 | Power Generation Benefits/104 kW·h | Risk Rate of Beyond-Limit Water Level % | Discarded Water Quantity/104 m3 | |
| (1) | (2) | (3) | (4) 1 | (5) | (6) | |
| Traditional scheme | 93.84 | 3314.45 | 3286.17 | 94.71 | 18.75 | 130.90 |
| Integrated scheme | 98.28 | 3314.45 | 3350.65 | 97.17 | 0 | 0 |
1 (4) = (1) + λ × [(2) − (3)], for the Xiaoxuan Hydropower Station λ = 0.0308 kW·h.
Table 4.
Calculation results of the 3rd operating condition.
| Operation Scheme | Calculation Results | Evaluation Index | ||||
|---|---|---|---|---|---|---|
| Generated Power/104 kW·h | Reservoir Inflow Quantity/104 m3 | Reservoir Outflow Quantity/104 m3 | Power Generation Benefits/104 kW·h | Risk Rate of Beyond-Limit Water Level/% | Discarded Water Quantity/104 m3 | |
| (1) | (2) | (3) | (4) 1 | (5) | (6) | |
| Traditional scheme | 36.66 | 1123.86 | 1259.38 | 32.49 | 3.125 | 0 |
| Integrated scheme | 34.49 | 1123.86 | 1166.16 | 33.19 | 0 | 0 |
1 (4) = (1) + λ × [(2) − (3)], for the Xiaoxuan Hydropower Station λ = 0.0308 kW·h.
© 2019 by the authors. Licensee MDPI, Basel, Switzerland. This article is an open access article distributed under the terms and conditions of the Creative Commons Attribution (CC BY) license (http://creativecommons.org/licenses/by/4.0/).
Share and Cite
MDPI and ACS Style
Zhang, Y.; Wu, J.; Yu, H.; Ji, C. Formulation and Implementation of Short-Term Optimal Reservoir Operation Schemes Integrated with Operation Rules. Water 2019, 11, 944. https://doi.org/10.3390/w11050944
AMA Style
Zhang Y, Wu J, Yu H, Ji C. Formulation and Implementation of Short-Term Optimal Reservoir Operation Schemes Integrated with Operation Rules. Water. 2019; 11(5):944. https://doi.org/10.3390/w11050944
Chicago/Turabian StyleZhang, Yanke, Jiajie Wu, Hongjie Yu, and Changming Ji. 2019. "Formulation and Implementation of Short-Term Optimal Reservoir Operation Schemes Integrated with Operation Rules" Water 11, no. 5: 944. https://doi.org/10.3390/w11050944
Note that from the first issue of 2016, this journal uses article numbers instead of page numbers. See further details here.