1. Introduction
Over time, sewer networks present limitations in terms of carrying out the purpose to which they were assigned at the time of their construction. Unfortunately, their drainage capacity is limited to a few historic rainfall events or storms. Rainfalls with greater intensities may produce floods. For example, the total damage associated with floods in Spain between the years 1971 and 2017 reached 6 billion euros. This amount is more than 60% of the total amount of damages paid by insurance companies [
1]. Flooding in urban areas has become increasingly common for different reasons. Kordana [
2] categorizes the factors affecting the capacities of sewer networks as political, economic, social, technological, legal or environmental. Anthropogenic factors, linked to excessive urbanization, are partly responsible; some other reasons are related to climate change [
3]. Extreme rainfalls events are important parameters affecting various natural and socio-economic systems. The evolution of rainfall also affects the efficiency of drainage networks. Starzec et al. [
4] suggest that omitting the evolution of storms can led to undersizing the network. Mailhot and Duchesne [
5] suggest that the probability of the occurrence of intense rainfall will increase in the future due to the effects of greenhouse gases. Gulizia and Camilloni [
6] made a comparison among different global climate models which had been applied to South America. These models showed that an increase of up to 36% in rainfall events is expected in some regions. Ma et al. [
7] studied the effects and frequency of flash floods in China. They arrived at the conclusion that flash floods are still the main cause of deaths in flood disasters. This situation is becoming alarming, since it is to be expected that urban drainage networks designed for past conditions will not function effectively in the future [
8]. It should be noted that climate change is suspected as the cause of floods due to its effects on rainfall intensity and frequency.
However, not only climate change affects drainage and sewer networks performance; aging, structural collapses and exfiltration (leaking) might affect them too [
5]. Moselhi et al. [
9] presented a methodology based on neural networks to automatically detect and classify defects in drainage networks pipes. The aim of their methodology was to implement appropriate actions to upgrade the network.
Managers and others responsible for the operation of drainage networks must implement effective measures to ensure that infrastructure will be ready for these changes [
8]. Several options are available for these managers: Real Time Control (RTC), reparation or rehabilitation. Driessen et al. [
10] define five different complementary approaches to improve the resilience of hydraulic infrastructure: prevention, defense, mitigation, preparation and recovery. Among these strategies, the most traditional is flood defense, based on the idea of “
keep water away from people”. However, these traditional methods have shown limitations, since they cannot guarantee the cost-benefit effectiveness of the proposed solution.
Over the years, several studies on pipe replacement have been carried out to achieve optimal rehabilitations of defective sewer networks in order to prevent floods and environmental threat while minimizing investments costs. Reyna et al. [
11] have proposed some solutions to the challenges which are encountered in the process of finding new strategies for sewer network rehabilitation methodologies which seek to maintain the cost-effectiveness. Abraham et al. [
12] proposed an integrated management methodology considering Markovian probability-based models combined with deterministic models to predict structural failures in sewer networks. Based on these models, they proposed a priority rehabilitation plan which would reduce investment costs. The methodology first discretizes the network in small systems which are identified based on their structural characteristics. However, all these approaches become ineffective when the effects of climate change are taken into account.
Traditionally, the design of urban drainage systems is based on statistical analyses of past events. Keeping in mind that an increase in the intensity and frequency of extreme rainfall events will most probably result in more frequent flooding, Mailhot and Duchesne [
5] proposed a revision of the design criteria of urban drainage infrastructure which takes into account uncertainties related to climate change. Gaudio et al. [
1] proposed a combined methodology for the hydraulic rehabilitation of urban drainage networks. In contrast to traditional methods, they concluded that not only intensity, but also rainfall volume, influence the hydraulic design. They combined the observed rainfall data and synthetic hyetographs to deduce critical hydraulic conditions in terms of overflow volumes rather than rainfall volumes. All these studies conclude that rainfall volumes might be even more important than rainfall intensities as a design criterion.
During the last decade, a new trend in drainage network rehabilitation has been developed and implemented: the Best Management Practices (BMP). BMPs consist of reducing flooding at low cost using source controls and other devices to increase infiltration and reduce runoff. Some interesting studies have been carried out to popularize the technique. Sebti et al. [
13] developed an optimization model based on Linear Programming for the optimal selection and placement of structural measures. They considered four types of structural BMPs: retention pond, green roofs, infiltration tranches and vegetated depressions. They tried to minimize the total cost of BMPs, limiting the combined sewer overflow as a constraint. Zahmatkesh et al. [
14] used a global climate model (CMIP5) to generate rainfall scenarios that were used as the input for hydraulic analyses. As a result, the impact of climate change on the Bronx River watershed (New York City) was analyzed. Considering the impact of climate change on watershed runoff, the potential for Low-Impact Development (LID) controls to mitigate the effects was investigated. Stormwater runoff and LID controls were modeled using the Storm Water Management Model (SWMM) [
15]. The results obtained by Mora et al. [
16] showed that green roofs are efficient for small to moderate rainfalls, but that their implementation could prevent the flooding due to extreme rainfall events.
As stated by Driessen et al. [
10], any strategy which seeks to reduce floods has some costs. Ugarelli and Di Federico [
17] presented a cost-based methodology for drainage networks service level upgrading. This approach unifies both upgrading actions and damage costs, that is, costs associated with the risk of failure. A comparison between maintenance costs, renovation costs and rehabilitation costs was first performed in order to select the optimal course of action taking into account economical and engineering factors. Ngamalieu-Nengoue et al. [
18] performed an analysis of costs related to pipe renewal and the installation of detention storm tank. They presented an optimization methodology to obtain the best solutions for drainage network rehabilitation linking SWMM as the hydraulic solver and Genetic Algorithm as the optimization model. The methodology makes it possible to define the pipes that should be changed and the places in which detention tanks should be installed. In this process, floods were considered unacceptable, and solutions had to ensure that no such event could occur.
Floods produce damages, and these damages have costs. Exact flood damage costs cannot be known until the capacity of the drainage network is exceeded. However, several studies have shown that flood damage costs depend on the area where flooding occurs and on the depth of the water. Lee and Kim [
19] demonstrated that flooding volume in urban areas was not linearly proportional to flooding damage. There are two ways to represent flood cost damages [
20]: (i) proportional to the flood volume at nodes, and (ii) proportional to the level of flooding. In the latter case, the flooding area in each node must be defined. The study concluded that flooding costs are a function of the water level reached. Both approaches were confirmed by Lee and Kim [
19], who pointed out that flooding damage is different from flooding volume, because each subarea has different components.
Facing this growing risk, urban drainage management is moving towards a flood risk management approach related to city resilience, that is, the capacity to continue functioning even under hazardous conditions. Fadel et al. [
21] presented a risk-based method for introducing protection measures. The standard approach uses comparisons of damage costs with and without measures as a decision-making tool. These authors include the concept of risk with an associated probability. They applied this methodology to different rainfall scenarios ranging from 2 to 200 years of return period, and to three protection scenarios: no measure, land zoning and levee. The results showed that land zoning, i.e., an adaptation measure was a better solution than levees i.e., a structural measure. They concluded their study by recommending the use of flood costs for their risk assessment, as it proved its cost-effectivity.
Due to their unpredictable nature, flood damage costs cannot be harmonized with construction costs. Investments on sewer network adaptation are made, but damages associated with floods depend on the probability of their occurrence. These costs are different in nature, and a multi objective optimization algorithm is advisable to establish a relationship between both functions.
The incorporation of detention tanks in drainage networks might be considered as a form of implementation of BMP. This practice is becoming popular and is being implemented in the design of sewer networks to avoid floods and the contamination of receiving water bodies. The use of detention tanks has increased over the last decade [
22]. Detention tank volumes are calculated depending of rainfall levels. Starzec [
23] proposed a method to determine the required volume of these devices as a function of the time to the maximum flow, instead of using rainfall duration. Pochwat and Słyś [
24] proposed the use of artificial neural networks as a tool for the estimation of the duration of rainfall events. Other authors [
18,
25] use heuristic methods to determine the optimal size of detention tanks.
At first, in-line detention tanks were used to control pollution in both storm and waste water networks. De Martino et al. [
26] compared three different configurations of these tanks using efficiency in pollutant removal as ranking criteria. Andrés-Doménech et al. [
27] studied the resilience of storm water detention tank efficiency levels with respect to changes in rainfall forcing. Wang et al. [
28] proposed a rehabilitation methodology connecting SWMM to a multi-objective framework to find optimal locations for storage tank installation, thereby showing that storage tanks reduce not only TSS, but also flooding. Cunha et al. [
29] showed that the location, dimensions and flow control capabilities of storage tanks strongly affect their efficiency. In the work of Cunha et al., only storage tanks were implemented as a strategy for flood reduction; Simulated Annealing was used as the optimization model. As an alternative solution, Dziopak [
30] or Słyś [
31] proposed the use of control devices, allowing storage in the channel themselves.
Hence, in previous works, some actions were taken and optimized to eliminate the effects of floods. Concretely, Cunha et al. [
29] used orifices as a hydraulic control in storage tanks, while Iglesias-Rey [
20] combined storage tanks with increasing sewer transport capacities. Both works were done using evolutionary algorithms with a single objective optimization model. In this paper, a novel multi-objective approach combining not only pipe renewal but also storm tank size and location is developed. Furthermore, the model takes into account the economic effects of floods. Consequently, this paper is a worthwhile contribution because, as discussed previously, no previously published works have combined these three items.
Since the damage associated with flooding depends on the probability of rainfall, a multi-objective approach is assumed. Two different cost functions will be defined: investment costs for pipes and tanks, and damage costs associated with the flood itself. A multi-objective optimization algorithm was built linking an adapted Non-dominated Sorting Genetic Algorithm (NSGA-II) [
32] with a SWMM programmer toolkit [
33] to perform the rehabilitation of drainage networks by combining the use of pipe substitutions and the installation of storage tanks. Flooding damages are quantified in term of money based on the water level of the flood. As a result, a set of Pareto fronts were obtained relating both types of costs. These solutions can be used by network managers to make decisions concerning the rehabilitation plans and investments within the context of budget limitations.
Finally, as a study, this methodology will be applied to the E-Chicó area of Bogotá, Colombia.
3. Case Study
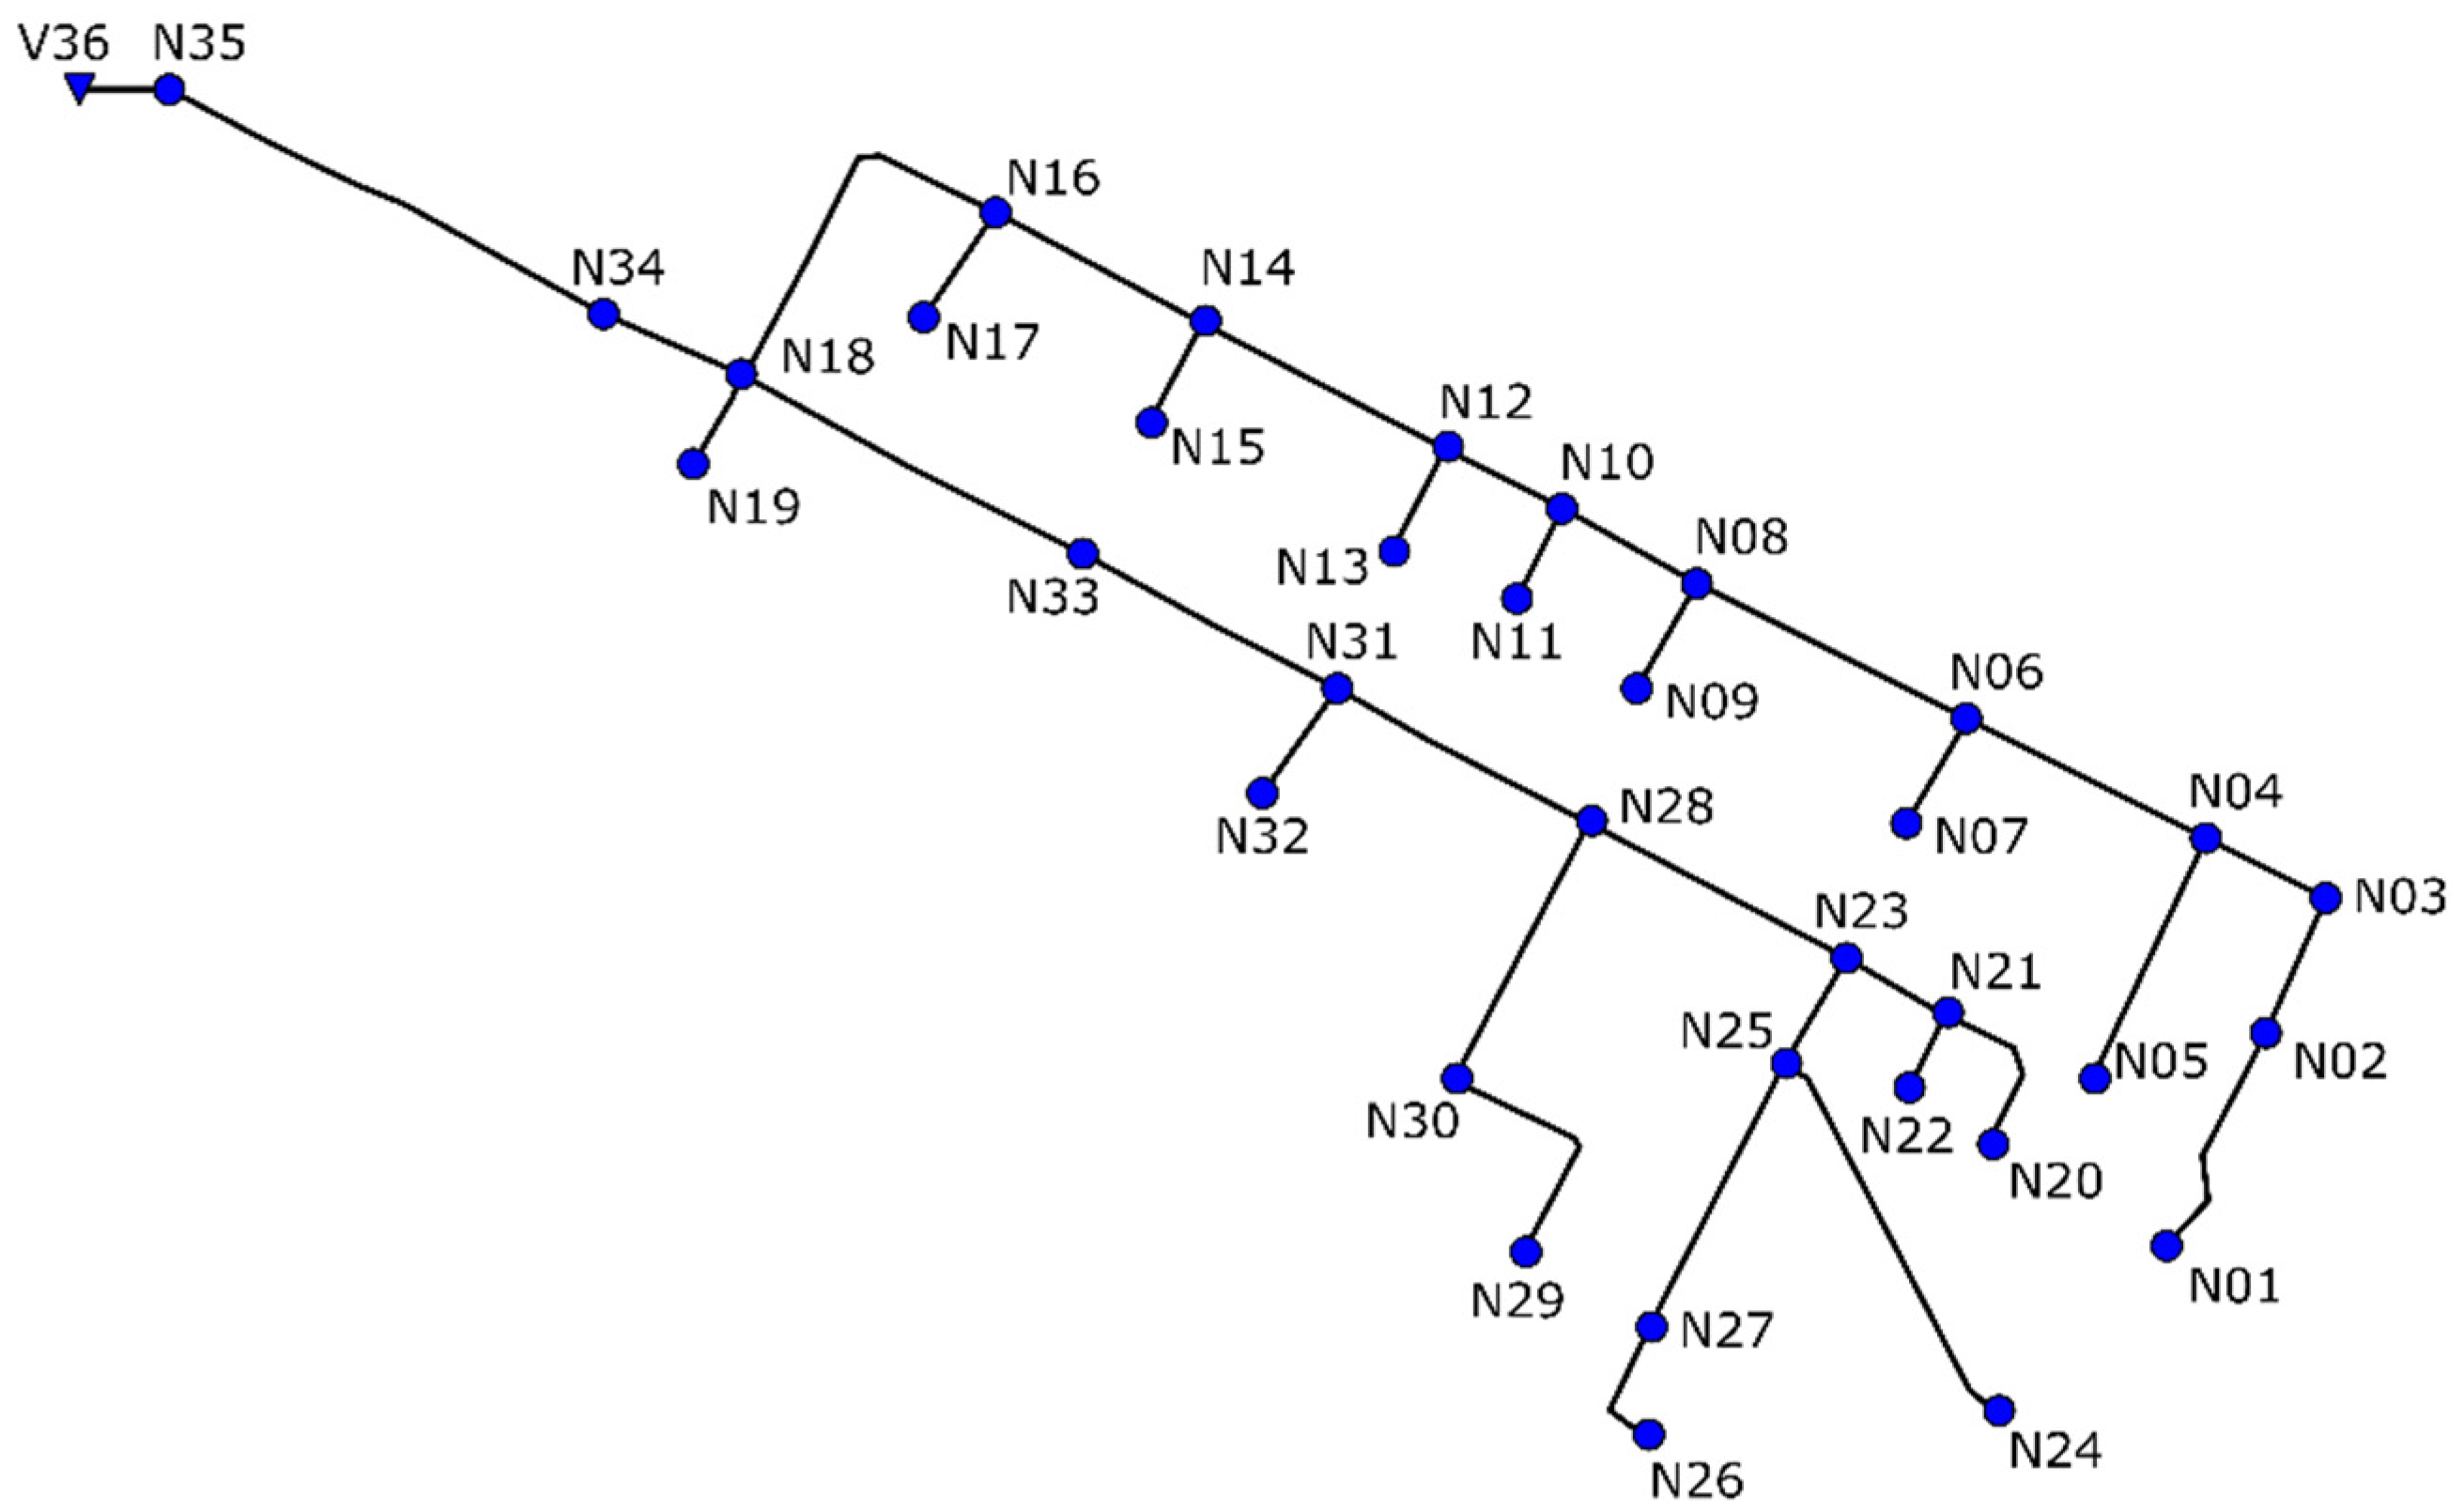
In order to test the methodology mentioned above, a sub-catchment of the drainage network of Bogotá city, Colombia, was used. The proposed algorithm was applied to the rehabilitation of drainage or sewer networks through the substitution of pipes and the installation of storage tanks. The part of the drainage network studied is generically known as E-Chicó district. E-Chicó is divided into 35 hydrological sub-catchments expanded over a surface of 51 ha. The network is composed of 35 circular conduits with diameters varying from 300 to 1400 mm, and 35 connecting nodes. The total length of the network is around 5000 m. The network works completely by gravity, since the terrain profile is favorable to the drainage of rainwater. The height difference between the highest and the lowest points is 39.28 m.
Figure 3 shows the E-Chicó drainage network. The complete description of the network used as a case study can be found as
supplementary material of this article.
For diagnostic and further evaluation of possible solutions, a design storm was used based on the intensity–duration–frequency (IDF) curve for a return period of ten years. The IDF curve was obtained after the application of a climate change scenario [
6]. Then, a design storm was calculated using the alternating block method with a time interval of 5 min and a minimum duration of 10 min. Both, the IDF curve (left) and the design storm (right) are presented in
Figure 4.
The cost functions used for the case study were based on real data, according to Ngamalieu-Nengoue et al. [
18]. Equations (3)–(5) will become, respectively:
A first simulation provided the behavior of the network without any intervention. In this preliminary analysis, the network presented a flooding total volume of 3832 m3, which represents 17.6% of the generated runoff (21,766 m3). Using the damage function described in Equation (5), it was calculated that this flood would cost 5.24 million euros. Furthermore, more than 30% of the nodes showed flooding (11 out of 35 nodes). In summary, the preliminary analysis of the network shows that it is unable to drain the selected project rain. Therefore, the E-Chicó drainage network was considered adequate as a model to which the multi-objective optimization NSGA-II rehabilitation drainage networks could be applied.
Three different rehabilitation scenarios were performed depending on the selection of the decision variables:
Scenario 1 (35C). All the conduits were selected as suitable for rehabilitation.
Scenario 2 (35T). All the nodes were selected as possible locations for the installation of storage tanks.
Scenario 3 (35C + 35T). A combination of Scenarios 1 and 2. All the conduits and all the nodes were selected as decision variables.
For all 3 scenarios, the crossover probability was fixed at 80%, while the mutation coefficients were calculated as the inverse of the number of decision variables, as suggested by [
36].
4. Results
For every scenario, 10 different population sizes and six different values for the number of iterations were used. Apart from the results of the solutions in the Pareto fronts, some other indexes were gathered to assess the algorithm. The simulation time varied from 1–15 days, depending on the scenario and the selection of the parameters. For example, the rehabilitation of the whole network, corresponding to the Scenario 3 (35T + 35C) with a population size of 1000 individuals and a maximum number of generations 15,000, provided results after 15 days. Next, the results of these simulations are presented.
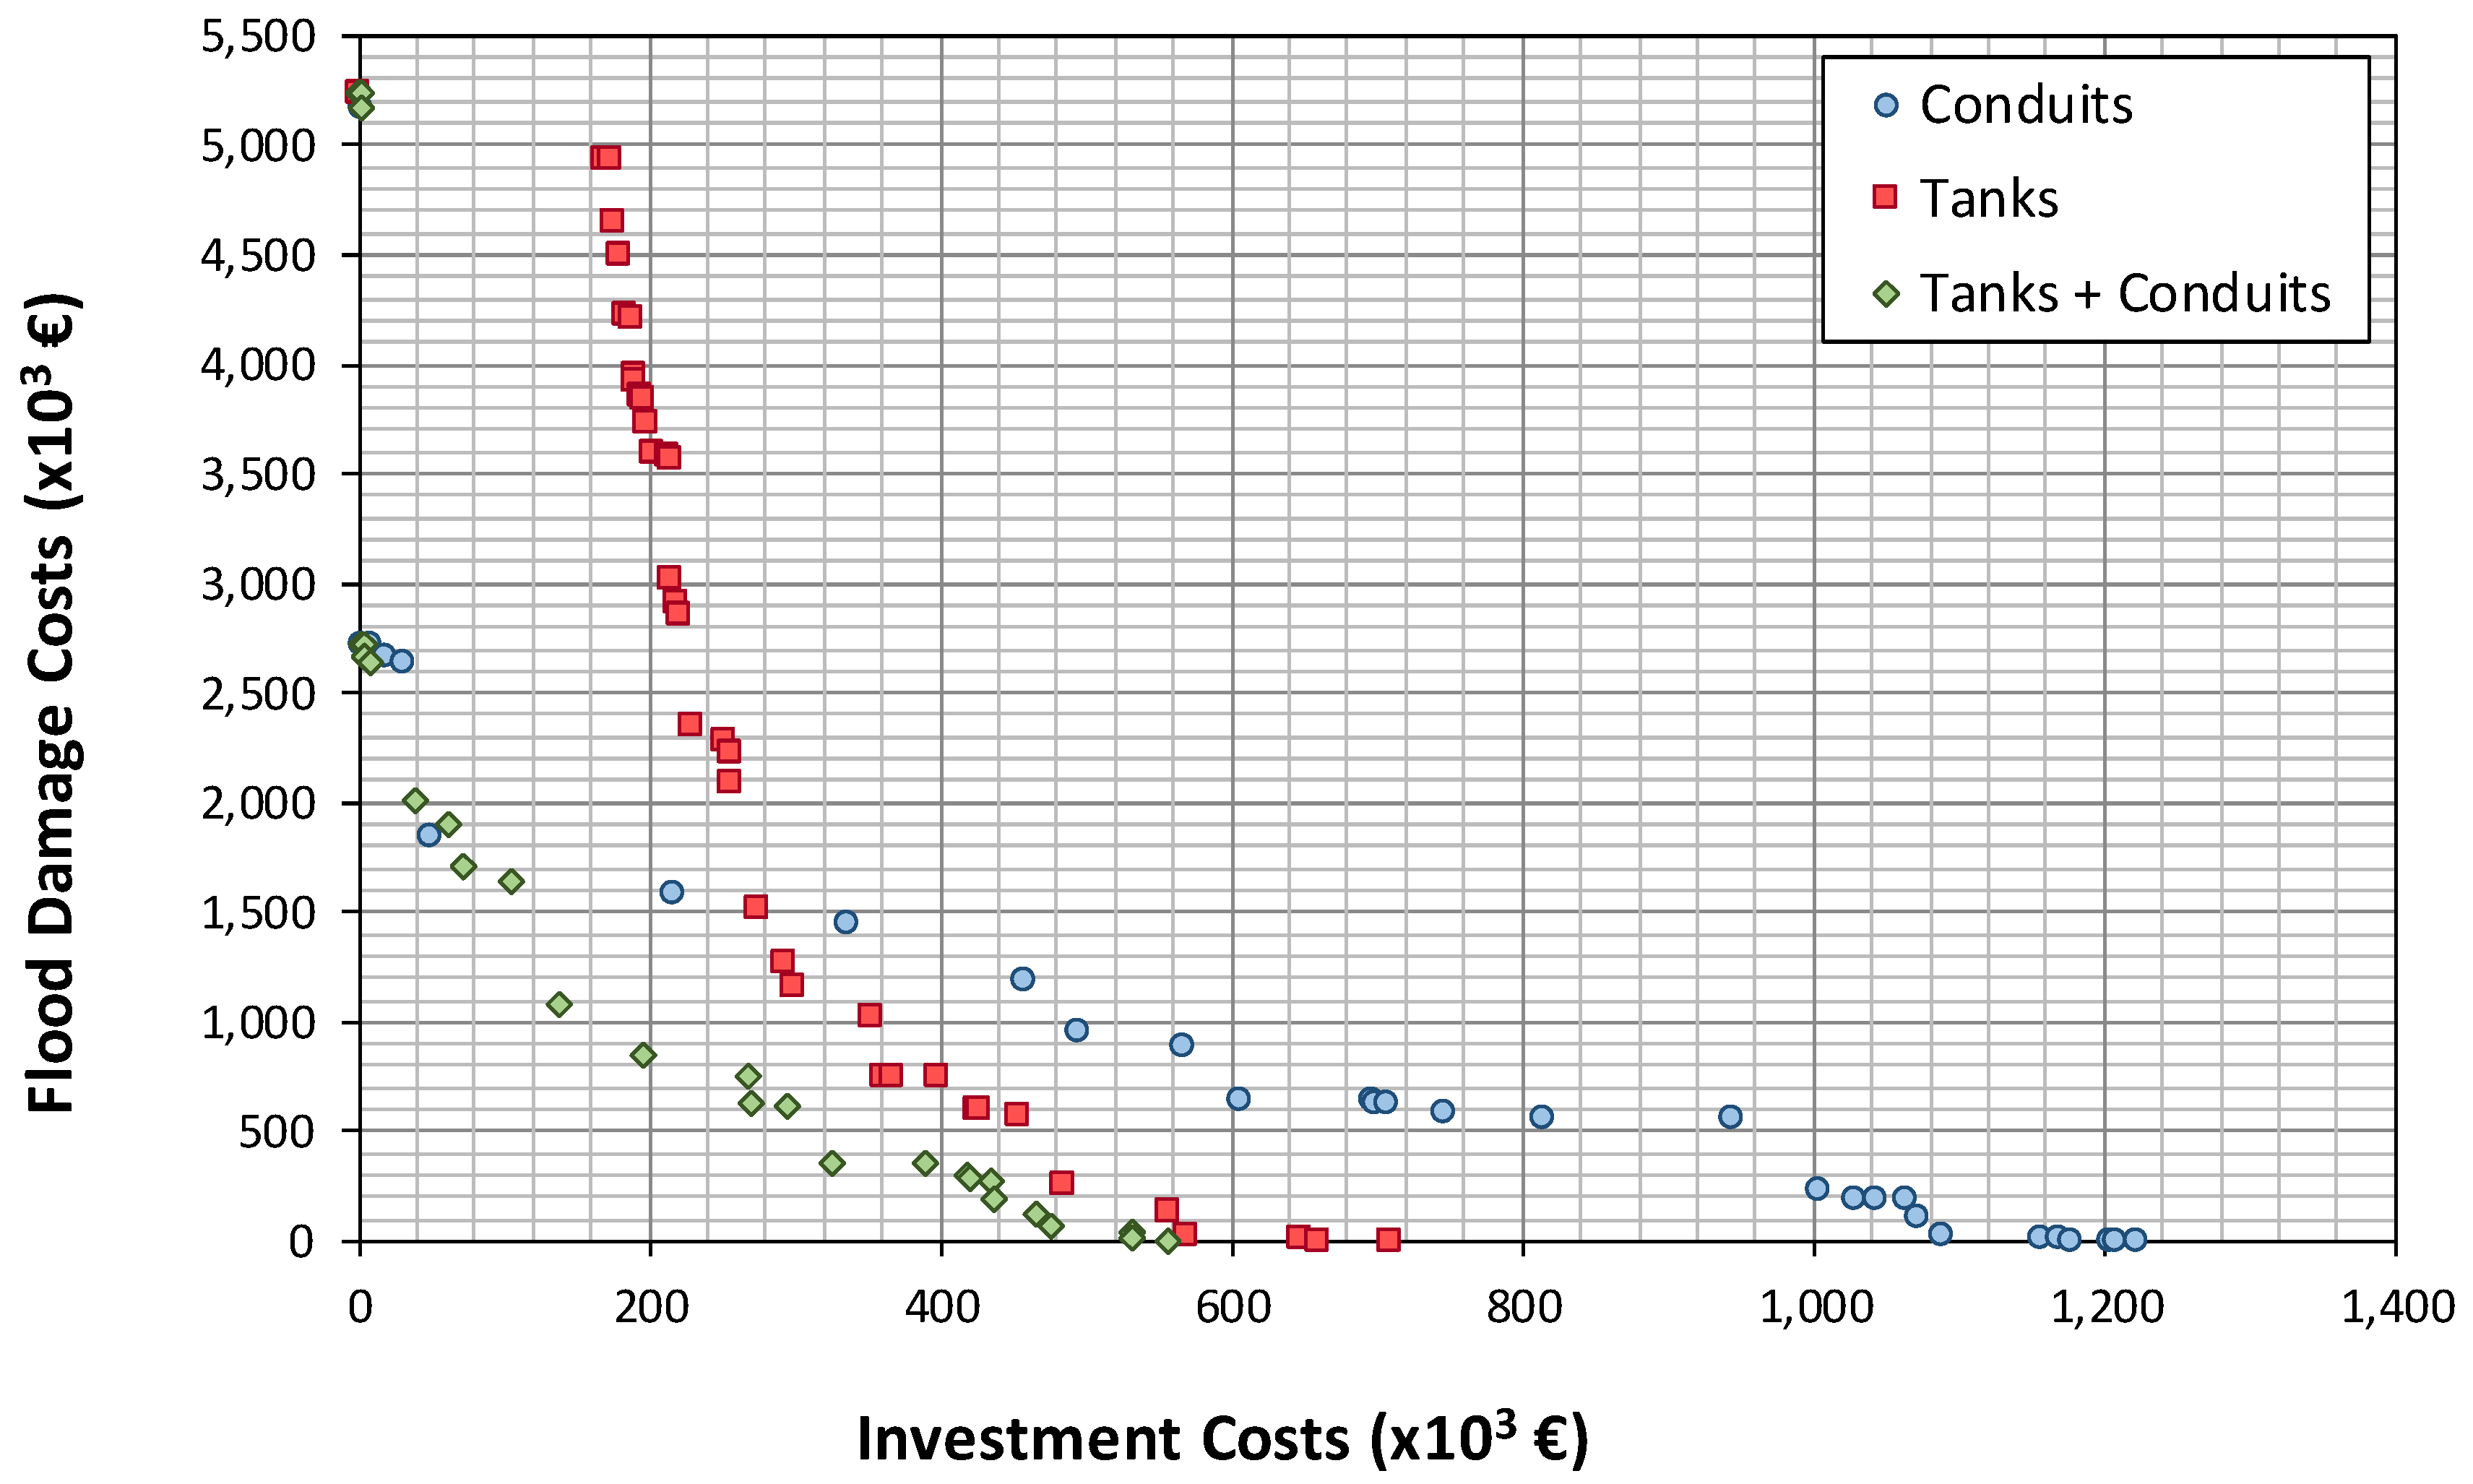
Figure 5 represents the results obtained for the 3 different scenarios presented above, that is, the substitution of pipes (35C), the installation of storage tanks in some locations (35T), and the combination of both alternatives (pipes substitution and storage tanks installation, 35T + 35C). These simulations were performed with a population size of 200 individuals and number of generations of 10,000 for all scenarios.
Figure 5 also shows that Scenario 3 presents better results than Scenarios 1 and 2; even though this combined scenario represents a bigger problem (70 decision variables versus 35 of Scenarios 1 and 2), the combination of the two different strategies led to better results.
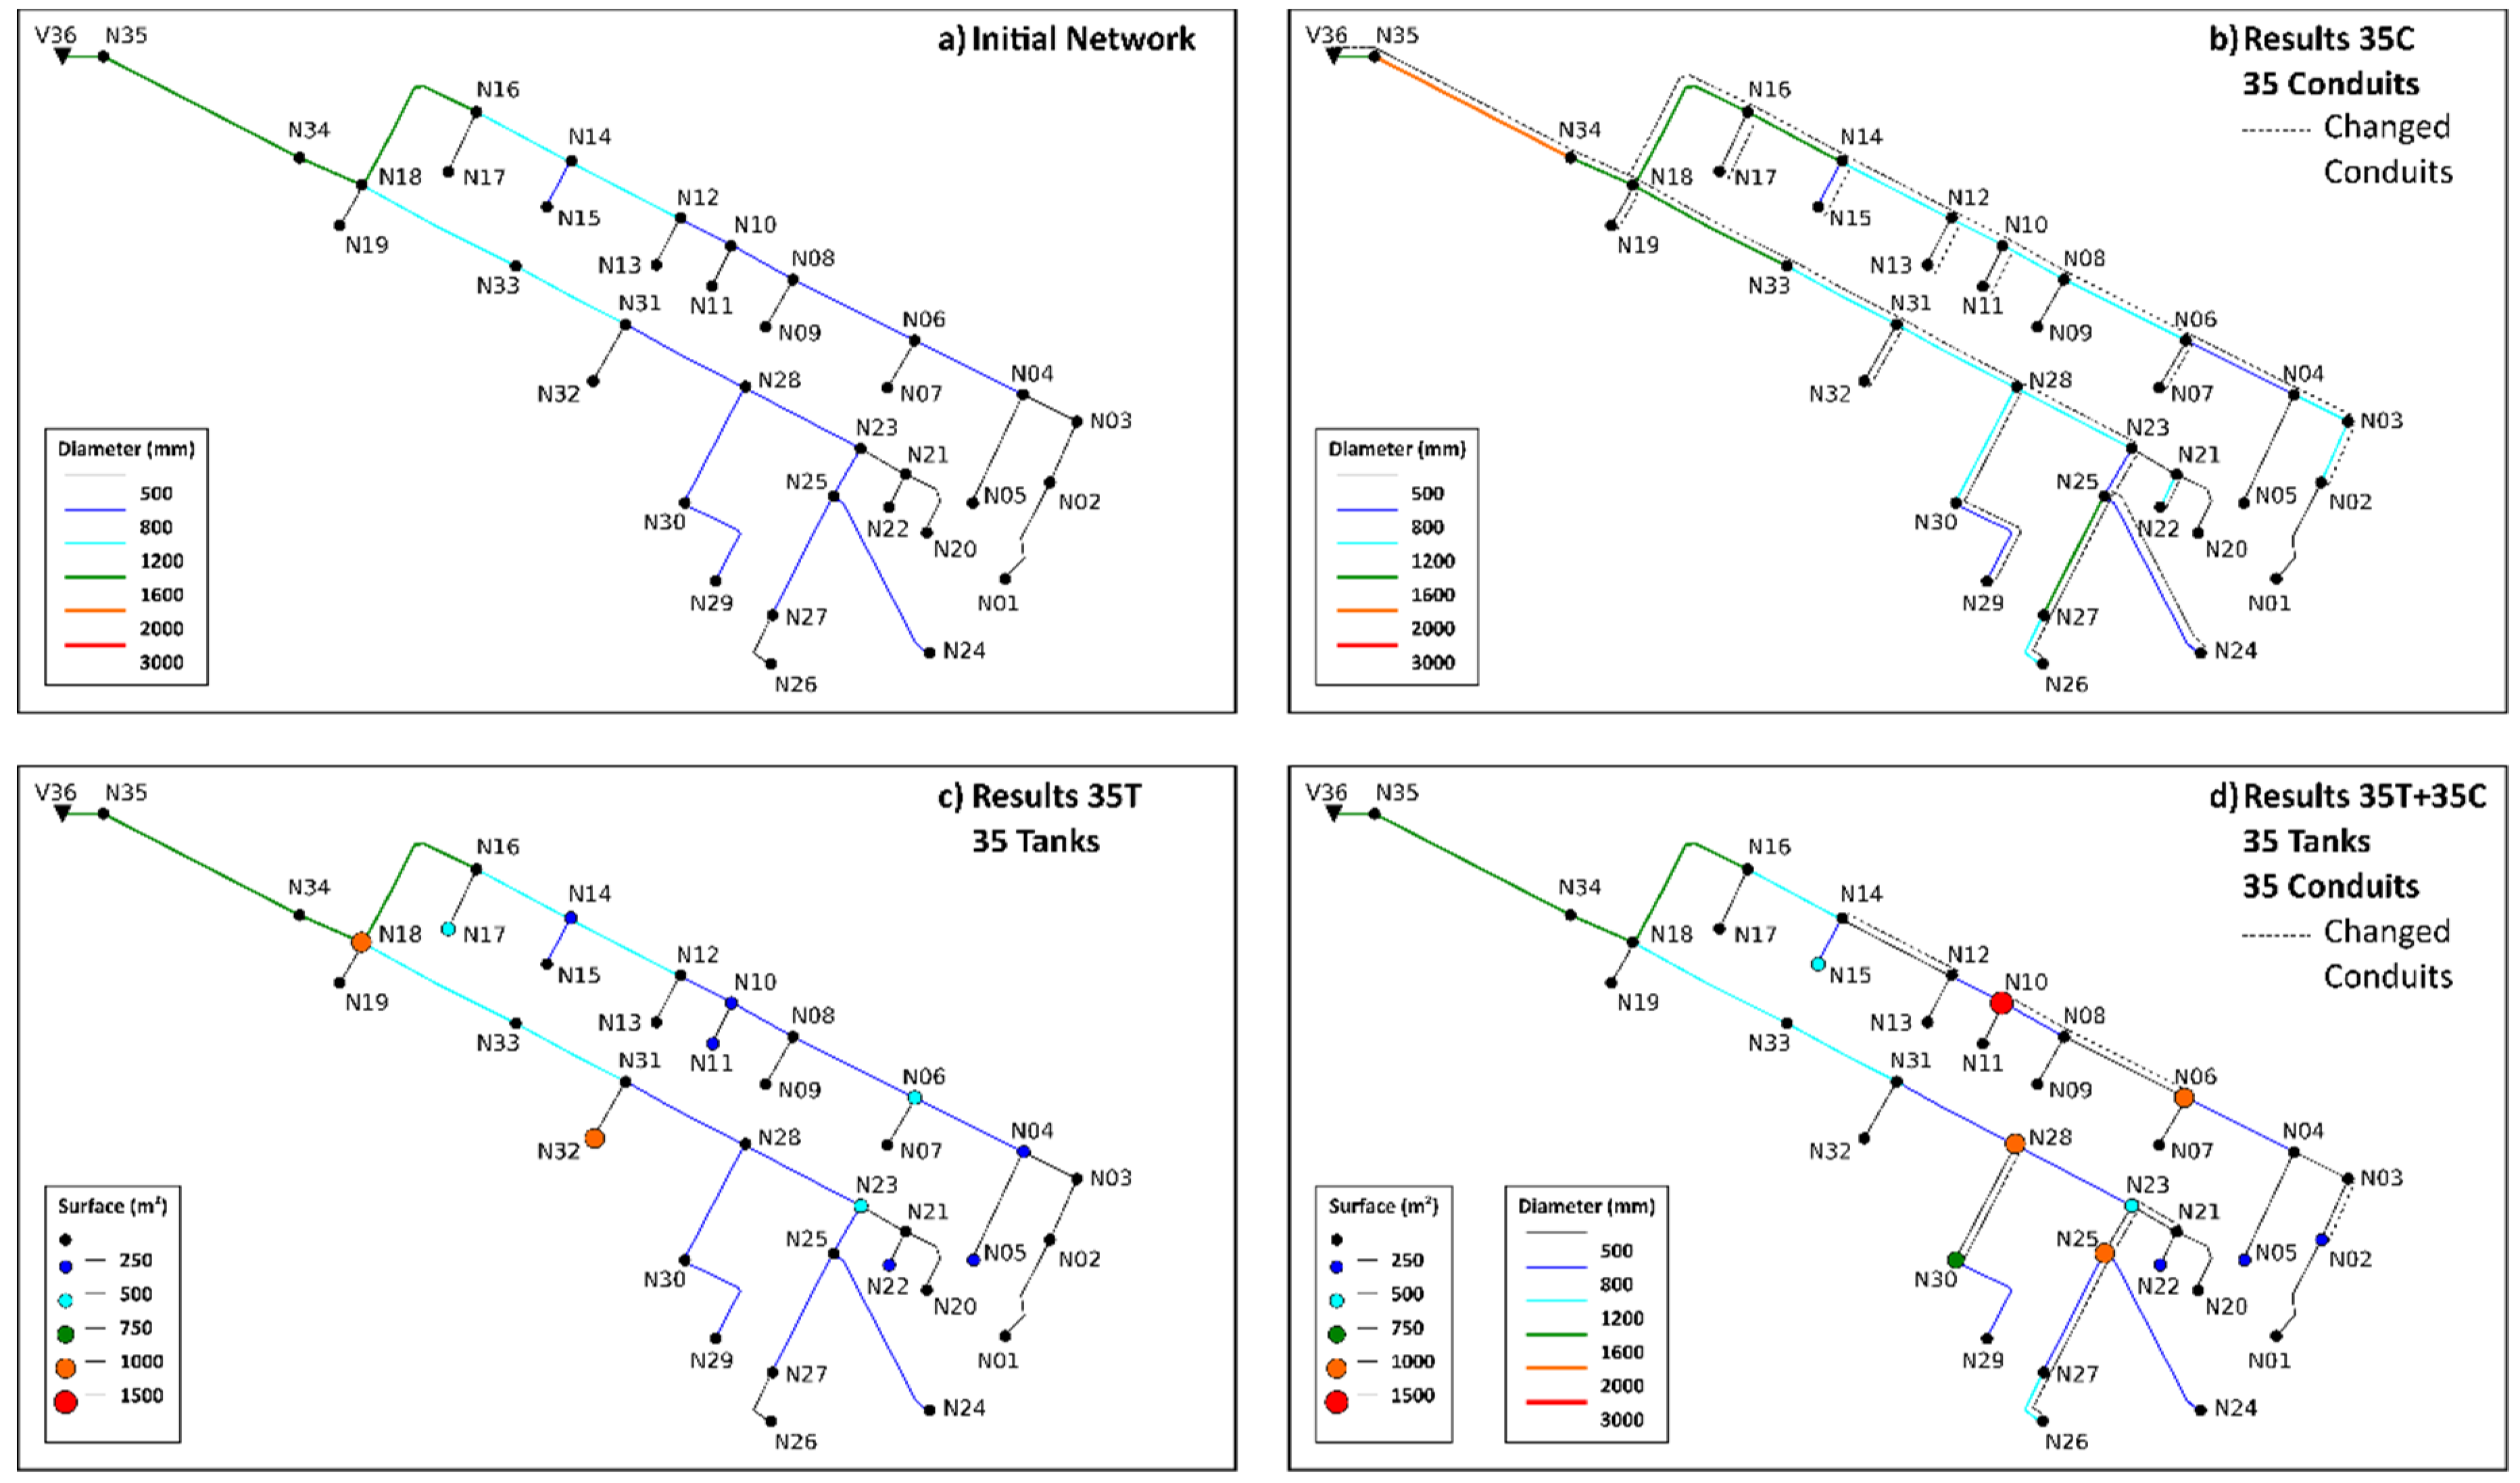
The NSGA-II presents a set of feasible solutions instead of a single one. This way, the decision about the best solution depends on several factors, i.e., budget availability, risk level, administrative regulations, etc. This is the reason why the multi-objective algorithm was selected. As an example, the solution for the case of unlimited budget availability is presented. If there are no investment limitations, the solution will look for a scenario with no flooding. This scenario corresponds to the horizontal axis of
Figure 5. The solution for zero flooding needs an investment of either 1,213,453€ in pipe renewal or 719,366€ in storage units. In accordance with the methodology presented in this paper, the problem can be solved with a joint investment of 517,559€. Solutions in terms of the volume of detention tanks and the diameters of pipes are shown in
Figure 6. Pipes marked with dashed lines represent changed pipes with respect to the original network.
The solution to Scenario 3 shows that some pipes connected to downwards tanks have a reduced diameter, meaning that those pipes act as a hydraulic control device. This confirms what was stated by Starzec et al. [
4], and opens up the possibility of including hydraulic controls in the optimization process.
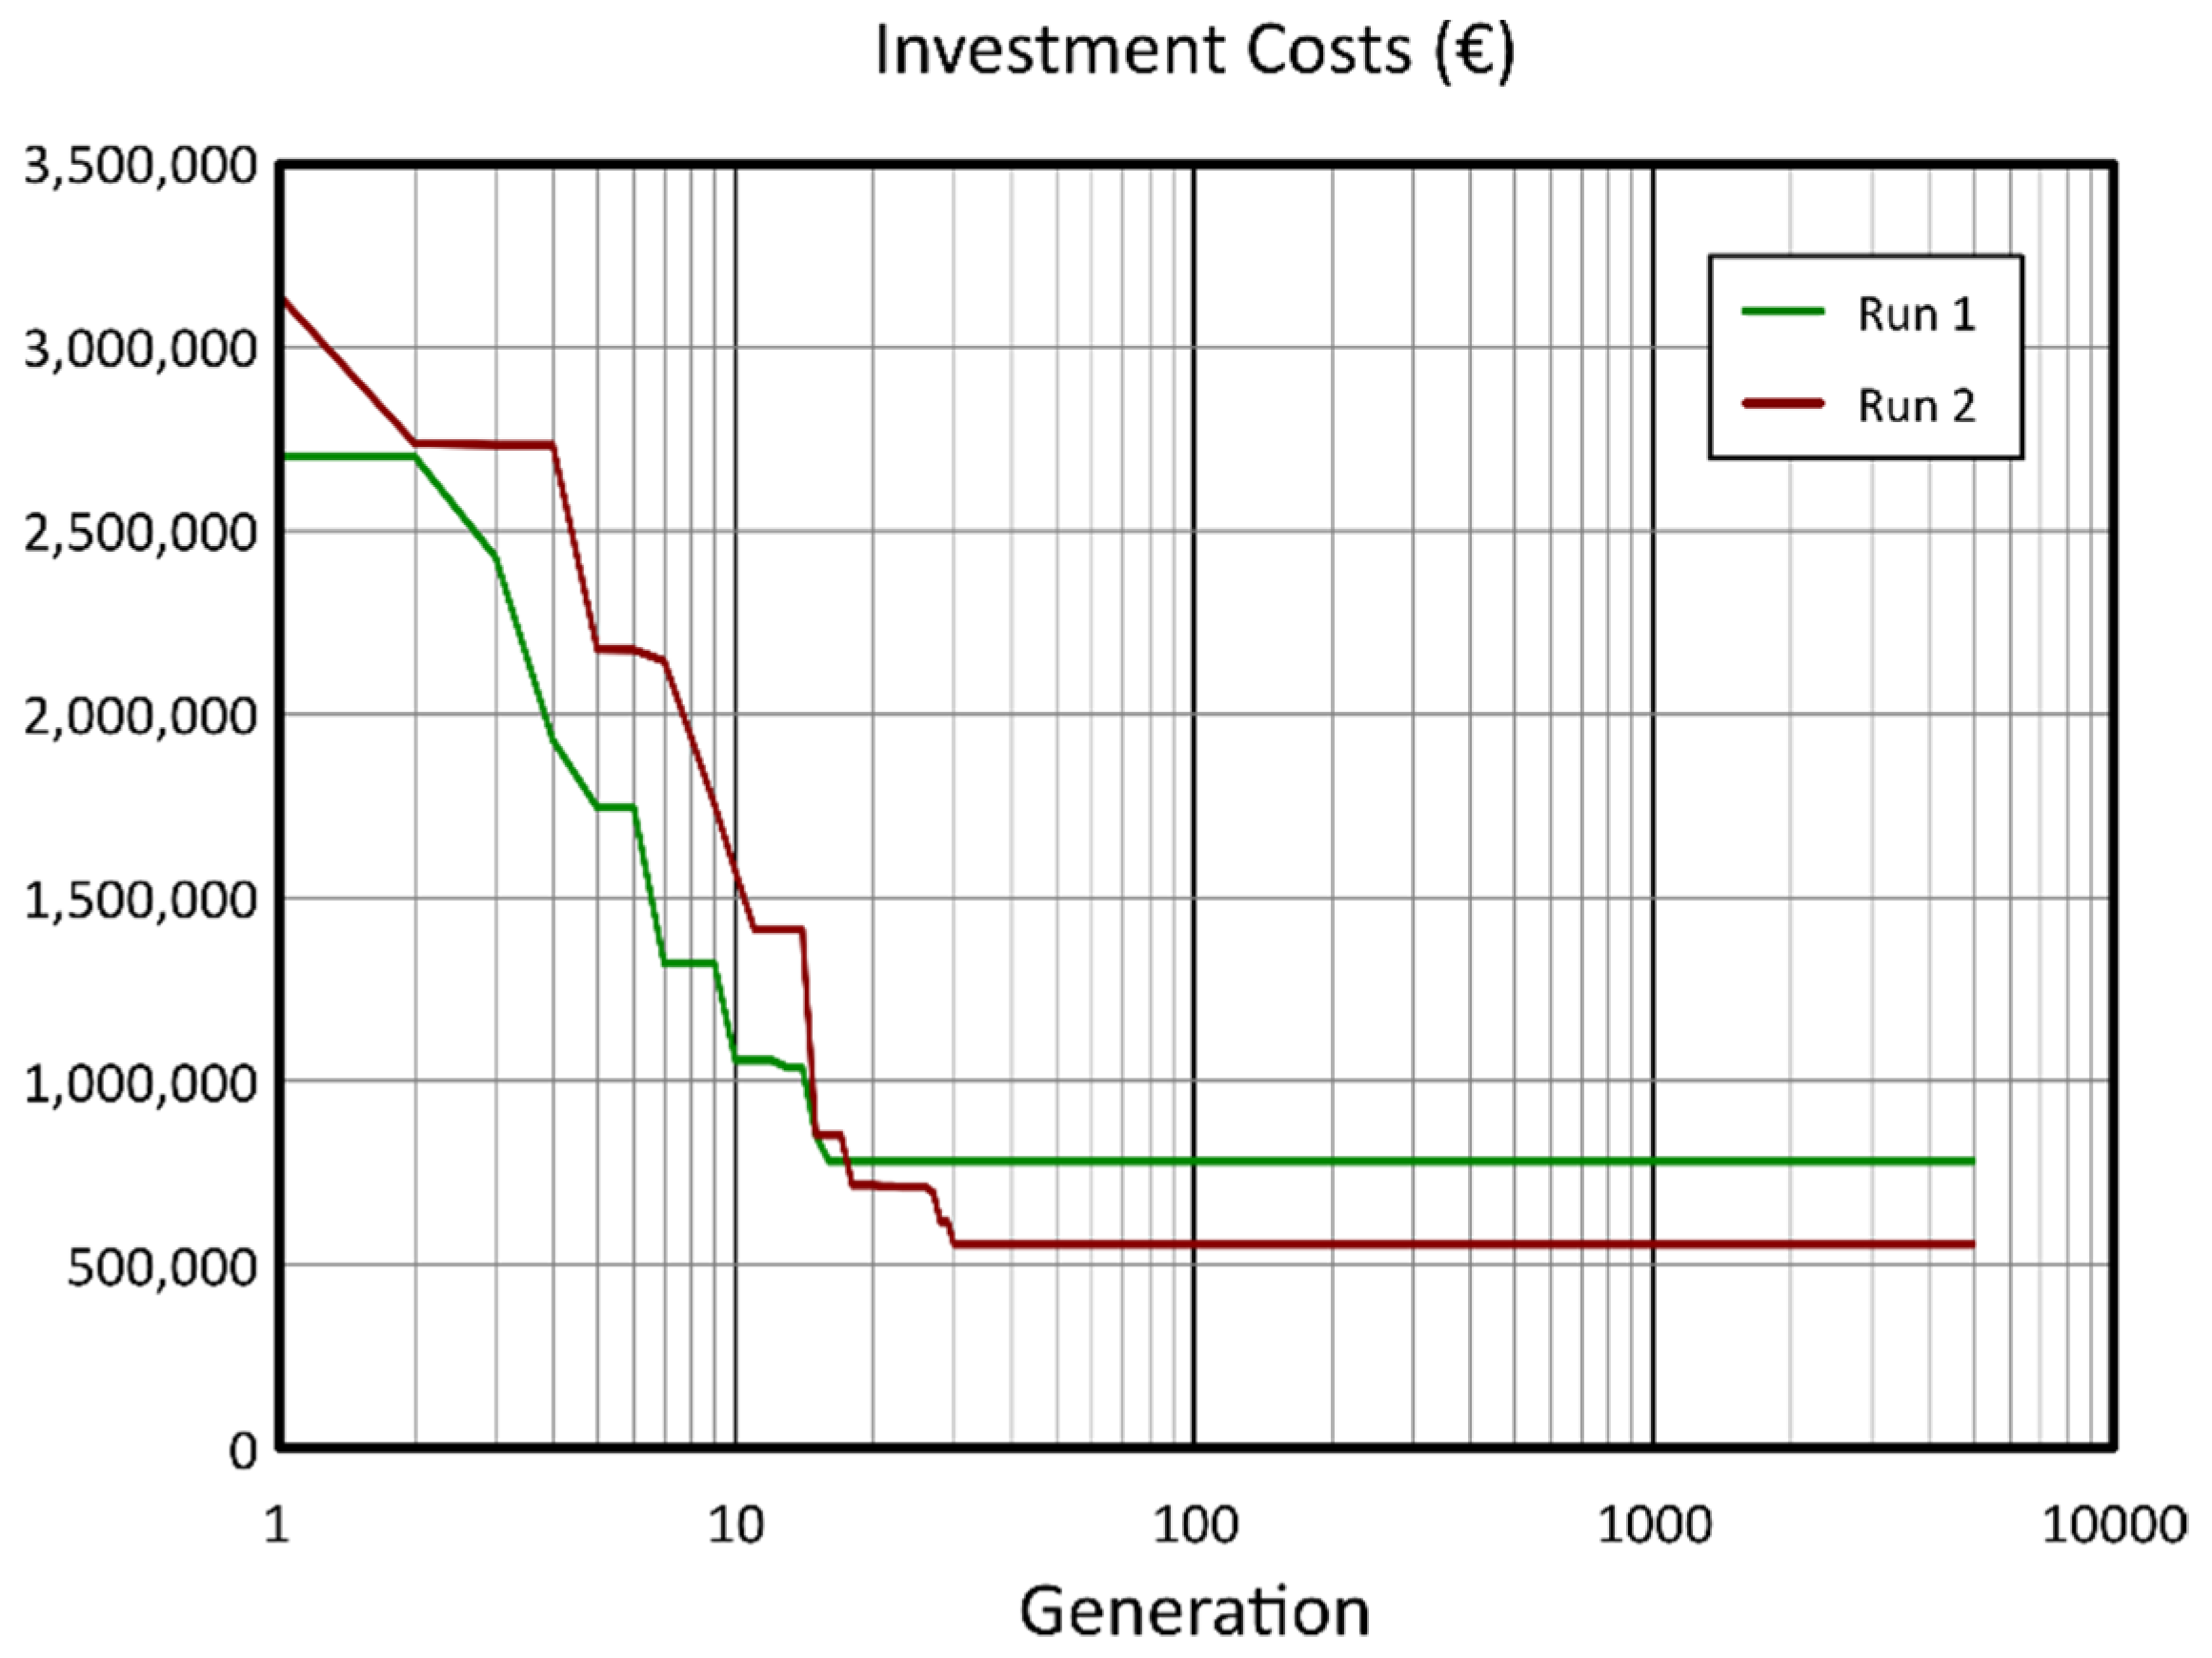
In this figure, all scenarios provide the same damage costs for no investment. This is due to a slight modification in the algorithm. The initial population was not entirely random, since two additional individuals were added: the zero-investment and the maximum investment (which causes zero flood damage cost) solutions. The zero-investment solution cannot be improved, and hence, is present in every solution. In contrast, the maximum investment cost was simulated assuming that all the pipes were renewed using the maximum available diameter (2000 mm for this case) and that the tanks would have the maximum area. This solution might be improved during the simulation. As an example,
Figure 7 shows the evolution of this zero-damage solution as the simulation progresses under two different simulations. It can be observed that the solution for zero flooding quickly become unchanged (after 20 to 50 generations). A stopping criterion based on the evolution of this parameter was tested, but the results suggested that this stopping criterion could be discarded.
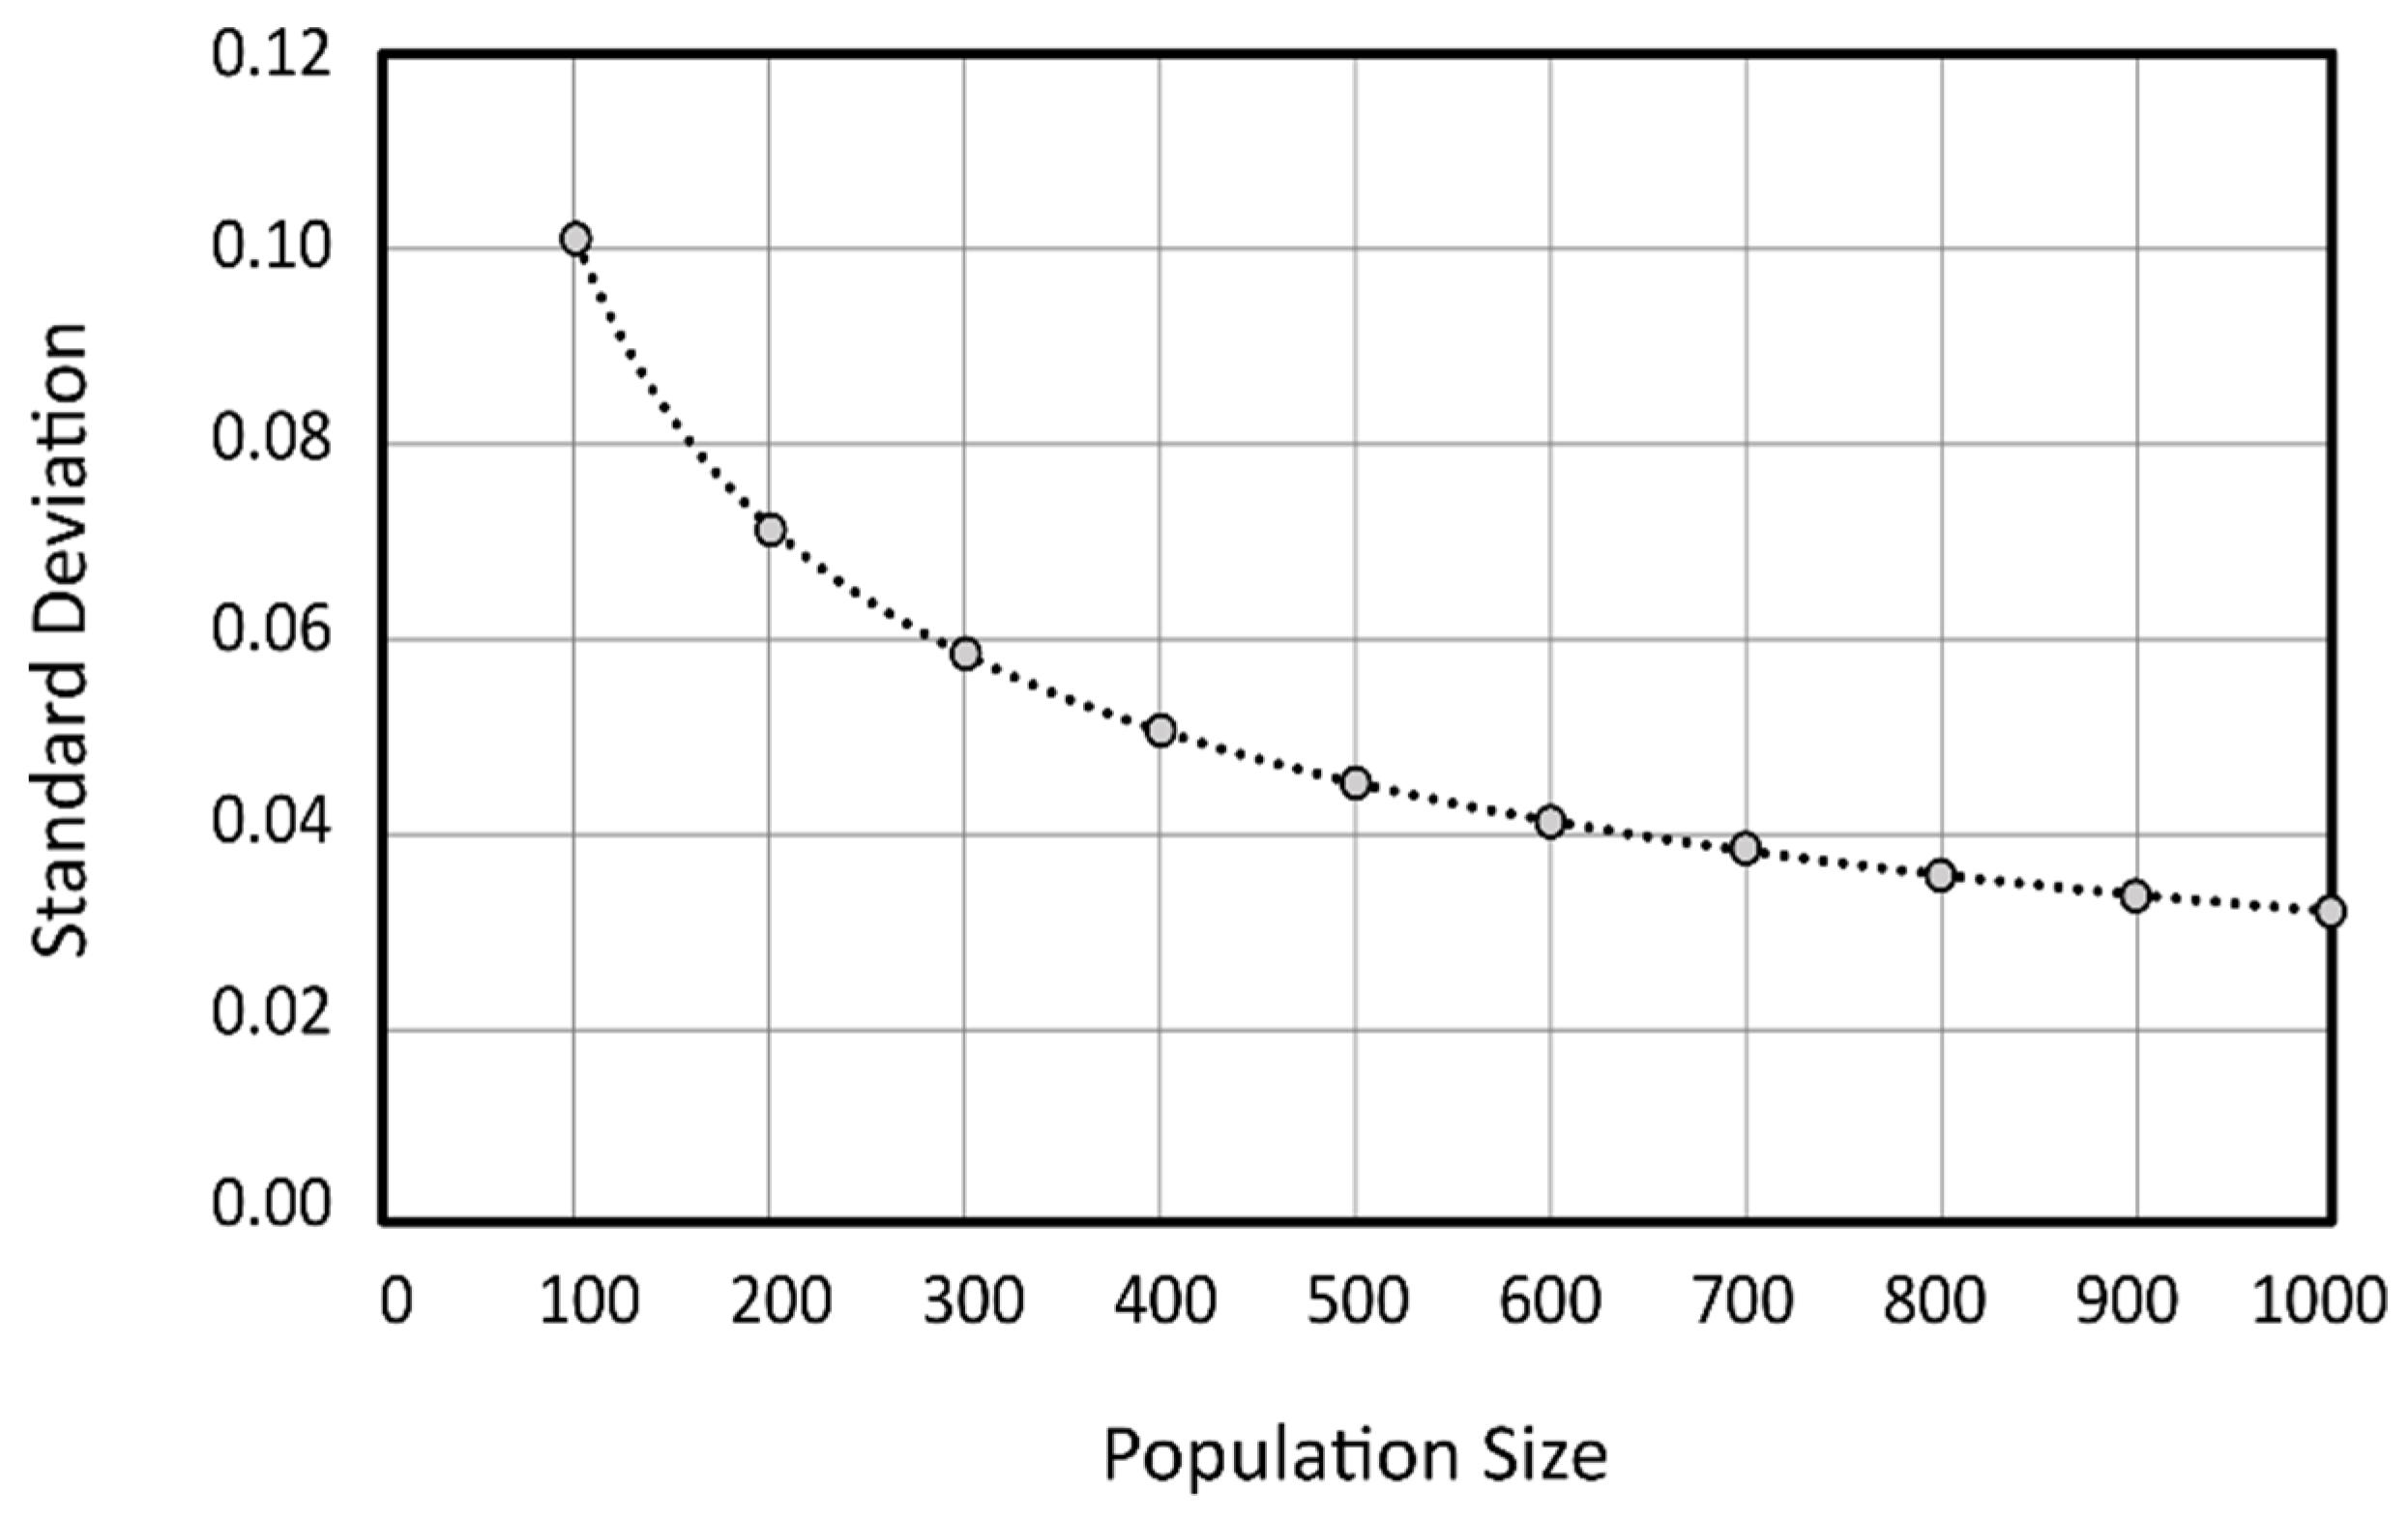
Another indicator used to evaluate the solution was the standard deviation of the crowding distance in the first Pareto front. The dependence of this parameter with the population size was also studied.
Figure 8 shows that there is a strong dependency between both parameters. In fact, this figure shows that this relation might be represented by a power function with an extremely high correlation. This relation makes it possible to determine the minimum population for a desired distribution of individuals in the Pareto front.
Finally, some other relationships were studied. As expected, the evolution of the minimal investment costs to eliminate floods with a given population size concludes that the results are better when the number of generations increases. This conclusion was also reached by other researchers [
37].
5. Conclusions
A multi-objective optimization algorithm based on NSGA-II for drainage network rehabilitation has been presented as a tool to help managers of drainage networks, or any other decision makers, to establish rehabilitation plans of their networks. Budget limitations are considered, and a set of solutions is provided, as opposed to just one, allowing decisions to be made based upon the objectives to be achieved and the available budget. The tool was tested on the network of E-Chico (Colombia) and the results obtained are in accordance with those of some previous studies. An EPA-SWMM hydraulic engine was used as the solver for the hydraulic conditions of the network.
The first conclusion obtained after this work was that the combined use of pipe rehabilitation and detention tanks improved the performance of the network in comparison to any strategy used separately.
The use of damage functions to evaluate the effect of flooding makes it possible to compare investment and damages, even though the first comprises expenses that depend on the probability of the occurrence of rainfall.
The capacity of the optimization tool to provide better results was also tested, and it stands out that, depending on the rehabilitation configuration, the population size must be large (greater than 500 individuals). Even though this conclusion was expected, the use of a medium population size was enough to achieve acceptable solutions in some cases. The computational effort needed to solve the case study indicates that some additional studies must be done which seek to reduce the size of the problem.
Different stopping criteria were used. The total number of generations or an objective value in the standard deviation of the crowding distance in the first Pareto front showed better performance than the evolution of the investment cost needed to avoid flooding.
The main conclusion of this paper is that the combination of the renewal of pipes and the installation of storage units can reduce the risk for sewer network utilities vis-à-vis eventual rainfall increases due to climate change. The results for the combined solution show that some of the conduits are substituted for smaller ones. This fact implies some type of flow control based on hydraulic principles.
The results obtained in the Pareto front consist of a set of feasible solutions that will help decision makers select the best option. However, there is no optimal solution; any model must be chosen in accordance with some criteria or rules, i.e., budget availability, risk evaluation, design criteria, etc.
The results of this paper open up a wide field for future investigation, including working with three different scenarios (separating investment costs on tanks from investments on pipe rehabilitation). On the one hand, the combination of tanks and pipes which conform with a hydraulic control device for flooding is a topic that should be studied. On the other, flood analysis requires great computational effort. In this sense, additional research must be done to reduce the size of the problem.

 ,
, 


