Effect of Water Table Depth on Soybean Water Use, Growth, and Yield Parameters
by
 , , and
Yavuz F. Fidantemiz
1, 
Xinhua Jia
1,
Aaron L.M. Daigh
2,
Harlene Hatterman-Valenti
3,
Dean D. Steele
1,
Ali R. Niaghi
1 and
Halis Simsek
1,*
1
Department of Agricultural and Biosystems Engineering, North Dakota State University, Fargo, ND 58108-6050, USA
2
Department of Soil Science, North Dakota State University, Fargo, ND 58108-6050, USA
3
Department of Plant Science, North Dakota State University, Fargo, ND 58108-6050, USA
*
Author to whom correspondence should be addressed.
Water 2019, 11(5), 931; https://doi.org/10.3390/w11050931
Submission received: 2 April 2019
/
Revised: 22 April 2019
/
Accepted: 26 April 2019
/
Published: 2 May 2019
(This article belongs to the Special Issue Innovative Water Management and Reuse)
Abstract
:Water table contribution to plant water use is a significant element in improving water use efficiency (WUE) for agricultural water management. In this study, lysimeter experiments were conducted in a controlled greenhouse environment to investigate the response of soybean water uptake and growth parameters under four different water table depths (WTD) (30, 50, 70, and 90 cm). Soybean crop water use, WUE, and root distribution under the different WTD were examined. For 30, 50, 70, and 90 cm of WTD treatments, the average water table contributions were 89, 83, 79, and 72%; the grain yields were 15.1, 10.5, 14.1, and 17.2 g/lys.; and the WUEs were 0.22, 0.18, 0.25, and 0.31 g/lys./cm, respectively. Further analysis of the root mass and proportional distribution among the different soil layers illustrated that the lysimeters with 70 and 90 cm WTD had greater root mass with higher root distribution at 40–75 cm of the soil layer. The results indicated that 70 and 90 cm of constant WTD can yield higher grain yield and biomasses with greater WUE and better root distribution than the irrigated or shallow WTD treatments.
1. Introduction
The world population is growing dramatically, and water scarcity is becoming a challenge throughout the world, to the extent that nearly 40% of the population experience water shortage. Moreover, the rate of water consumption increases at twice the rate of the world population growth. Urbanization, industrialization, and environmental pollution are some of the major reasons for water shortages in which water can no longer be considered as an infinite source [1,2].
Since a significant portion of the world’s water resources are used for agricultural production, well-managed agricultural water resources and improved water use efficiency (WUE) provides opportunities to conserve limited water resources [3]. Water use for agricultural purposes accounts for more than 80% of all water withdrawals in arid and semi-arid regions such as Asia and Africa [1]. The water use in agriculture is considerably higher than the combination of industrial and municipal sectors. Hence, improving WUE in agriculture could be an effective way to save water.
To address the potential water crisis that may occur in the future, new water management techniques and strategies are required for agriculture. Improved understanding of water table contributions to crop water use may improve agricultural water management [4,5]. Water table contribution to plant water use can be a significant element in crop production by reducing drainage and surface irrigation water volumes, and by enhancing crop water uptake from water table [6]. Thus, water table contributions to crop growth have gained attention recently, with research in controlled environments (i.e., laboratories and greenhouses) using weighed lysimeters and in the field using controlled drainage practices [5,7,8,9].
When an optimal water table depth is maintained for a crop, the water table can be considered as accessible water source to support the crop water requirement. Hence, the higher performance of the crop can be obtained with a lower amount and frequency of surface irrigation. Besides, the optimum water table depth can supply the necessary respiration and aeration for plant roots [10]. Most of the irrigation scheduling programs assume that the water table is too deep and only surface irrigation water is required to meet the plant water demand [11]. However, shallow water table can be a water source that helps to decrease the need for irrigation water [12,13]. Several researches showed that the water table can contribute to crop production through capillary rise and provide sufficient moisture for the crop root zone [6,14,15]. Meyer et al. [16] investigated the effect of soil type on soybean water use from shallow water table, and they found that 24% and 6.5% of the contribution to soybean water use in loam and clay loam soils was supplied from the water table, respectively. They found the soybean root length to be two times denser in the loam soil compared to the clay loam soil. Luo et al. [17] reported that 75% of the wheat water requirements could be met from a water table depths (WTD) of 100 cm, but that contributions from water table decreased with increasing WTD from 30 to 90 cm. This showed an inverse relationship between WTD and water table contribution.
Kahlown and Ashraf [5] used a lysimeter to determine the water table contribution to plant water use for six different crops. The highest water table contributions were observed at the shallowest water table depth, in which the contribution of the water table for each crop varied with the water table depth. They observed that the water table contribution decreased gradually with the increase in water table depth. Among the six crops, wheat and sunflower showed more tolerance and increased performance than the maize and sorghum due to the contribution of the shallow water table. Under deficit irrigation conditions, 40% of the crop water requirement for wheat in a shallow water table condition was obtained from water table sources, even though the salinity limited the total crop water uptake. Hence, it was concluded that a shallow water table could be considered as a supplementary water source for wheat crops [13].
Research has been conducted to quantify the contribution of water table for crop water use and to determine crop yield and biomass variations related to different water table depths (WTD) during the growing season. Many of these studies were conducted to determine effects of different variables such as crop variety, soil type, salinity level, and presence of irrigation and drainage systems on water table contribution to crop water use [5,7]. Kahlown and Ashraf [5] showed that under various WTD ranging from 50 to 300 cm, the water table contribution reached a maximum level for all crops when it was maintained at the shallowest depth. Similarly, depending on the growth stages of the crop, different evapotranspiration rates were observed for each crop. The goal of the current study was to quantify and evaluate the effects of various WTD on soybean grain yield performance. To achieve this goal, lysimeters were used to: (1) quantify soybean water use and WUE, and (2) assess soybean growth, yield parameters, and root distributions under different WTD treatments. As of the author’s knowledge, there is no study conducted in a greenhouse environment to determine the effect of different water table depths on the soybean crop yield and growth parameters.
2. Materials and Methods
2.1. Experimental Design
The experiment was conducted in a climate-controlled greenhouse located at North Dakota State University, Fargo, ND, USA. Thirty lysimeters that were made of Schedule-40 PVC material with a diameter of 152.8 mm, wall thickness of 5 mm, and height of 127 cm were used to apply different WTD and irrigation. From thirty lysimeters, six lysimeter were used as control treatments (Tcontrol) and received irrigation from the soil surface without water table control. For irrigation application, 50% of the total available water was considered as a readily available moisture in the soil profile [15]. The remaining 24 lysimeters were randomly divided into four treatments with six replicates (R1 through R6) to test the contribution of the controlled 30 (T30), 50 (T50), 70 (T70), and 90 cm (T90) WTD to crop production, with no irrigation. The depths in the lysimeters were measured from the top of the lysimeters. The end of each lysimeter was enclosed by a cap and sealed to hold the water and soil. Tap water was used in this study for both the irrigated (Tcontrol) and non-irrigated WTD treatments. The different treatments were randomly placed in a row of each replicate to reduce the associated errors.
To control the WTD at non-irrigated treatments, water was fed from the bottom of the lysimeters using the Mariotte bottle method to supply a constant rate of flow to the lysimeters and to maintain the designed WTD at 30, 50, 70, and 90 cm, respectively. The volume of the Mariotte bottles were 8 L with a working volume of 6 L, which were placed on adjustable shelves. A total of 24 Mariotte bottles were used for those 24 lysimeters and the height of each shelf was adjusted for the desired level based on the targeted water table depth for each lysimeter. The water volume in the Mariotte bottles was measured periodically every 15 days and the measured volume difference were considered as the portion of crop water use in the soil column. The water reduction in the Mariotte bottles were replenished back when the water level was low. The volume of water for each replenishment in the Mariotte bottles was measured and recorded. Total losses from the Mariotte bottles were calculated to determine each treatment water table contribution to plant water use.
All of the lysimeters were packed using bulk soils collected from an agricultural field near Fergus Falls, MN. The physical properties of the soil are presented in Table 1 [18]. The soil texture was classified as a loam soil based on the USDA/FAO texture classification system. The soil was air-dried and sieved through 2 mm screen before packing the lysimeters. Soil compaction was observed in the lysimeters during the preliminary experiments. Therefore, the textural characteristics of the soil were altered by adding 300 g of sand to each 1 kg of soil. The soil texture and distribution in the lysimeters from bottom to top was designed as 12 cm gravel, 12 cm sand, and 96 cm loam soil (Figure 1). All the lysimeters were packed uniformly.
2.2. Soybean Planting and Harvesting
At the beginning of the experiment, the water tables were fixed at top of each lysimeter for preparing proper soil moisture conditions for seedling bed. Then, lysimeters were freely drained for 36 h from the bottom so that soils remained near field capacity (soil water content at 1/3 bar) for germination. North Dakota Bison soybean variety (RFP-279) that is a conventional type crop released by the North Dakota Agricultural Experiment Station in 2016 was used in this study. Eight seeds were planted at 4 cm depth, as stated by Kandel [18], in each lysimeter on 1 March. Once the seedlings emerged, three healthy plants were kept in each lysimeter and the rest were removed from the lysimeters. The plants were sprayed weekly with beneficial nematodes for thrips control. Additionally, several chemicals including Botanigard Maxx (on 5 April), Azatin O (on 16 April), and Mainspring (on 7 May) were applied in order to inhibit growth of aphids, thrips, and spider mites, respectively in the greenhouse during the study period. According to visual observations, all plants did not reach harvesting stage at the same time; therefore, the harvesting time was different among the treatments in the experiment and was harvested between 5 July and 22 July. Plants shoot were not removed from the lysimeters until they reached their full maturity stages [18].
2.3. Analytical Methods
For the irrigation treatment (Tcontrol), in order to determine the timing of irrigation and the amount of water needed for the irrigation, three soil water potential sensors (TEROS-21, METER Group, Inc., Pullman, WA, USA) were placed in the lysimeters at 15, 45, and 75 cm depths from the soil surface. Sensors were placed horizontally to provide an appropriate hydraulic contact with the surrounding soil. Data was recorded using Em50G datalogger with 10-min intervals (METER Groups, Inc., Pullman, WA, USA). To determine soil field capacity and permanent wilting point (soil water content at 1500 kPa), the soil release curve needed to be developed. To develop wet range (0 to 100 kPa) of the soil water release curve, HYPROP (Version 10/2011, UMS GmbH, München, Germany) was used. To complete the soil release curve, dry range (−100 to 1500 kPa) was predicted through traditional constrained van Genuchten–Mualem model [19] by HYPROP-FIT software (METER Group, Inc., Pullman, WA, USA). Once the soil water retention curve was determined, the calculated amount of water was added to the soil in order to reach field capacity. Since all the lysimeters were packed in the same condition, all the replications of the irrigation treatments were irrigated using the same amount of water according to data collected from the Tcontrol lysimeter equipped with sensors.
A humidity and air-temperature sensor (VP-4, METER Groups, Inc., Pullman, WA, USA) was positioned at the middle of the greenhouse, and an ETgage model E atmometer (C&M Meteorological Supply, Colorado Springs, CO, USA) connected to the datalogger was set up in the middle of the lysimeters to measure daily reference evapotranspiration (ET0) data from 1 March (seedling) to 4 July (end of experiment). Soybean crop water use was calculated for each of the selected lysimeter according to soil water balance equation as follow [20]:
where, P is precipitation (mm), I is irrigation (mm), Cr is capillary rise (mm), R is runoff (mm), Dp is deep percolation (mm), ET is evapotranspiration (mm), and ∆S is the change in storage in the soil profile (mm). Since the experiment was carried out in a controlled environment, irrigation, precipitation, runoff, and deep percolation did not occur in the lysimeters. Considering the controlled environment, the soil water balance equation can be simplified as:
where, S1 and S2 are the water storages in the soil profile. At the beginning of the study, the initial moisture conditions of the lysimeters were determined by using soil water potential sensors and soil moisture release curve. The amount of water that stored in the lysimeters at the beginning of the experiments (the initial condition) were approximately 360 and 175 mm for different WTD treatments (T30, T50, T70, and T90) and control treatment (Tcontrol), respectively. Since 15 lysimeters out of 30 lysimeters were projected to use for another experiment, only 15 lysimeters (three replications from each treatment) were selected and cut vertically to determine the final soil water content (SWC) in the soil profile.
(∆S) = (P + I + Cr) − (R + Dp + ET)
ET= Cr + S1 − S2
Based on the developed soil water release curve, 50% of the total available water was considered as the threshold for the readily available water in the soil profile to apply the irrigation to Tcontrol Treatments. The depth (d, cm) of the required irrigation was determined using Equation (3) [21]:
where, Fci denotes field capacity of the layer in percent by weight, Mbi is current water content of the layer in percent by weight, Asi denotes apparent specific gravity (bulk density, Mg cm−3), Di denotes the depth of each layer (cm), and n is the number of layers.
At the end of the experiment (after harvesting the soybean), the plant root sampling was carried out to determine root dry mass of each treatment. Rather than taking out the whole roots from the soil profile of selected 15 lysimeters, roots in the three depth intervals (0–20, 20–40, and 40–75 cm) from the top of the lysimeter were extracted. Sampling depth interval was changed from 20 to 35 cm just for the third layers because capillary roots in the third layers were easily disrupted during the extracting process. Each soil layer was placed over a screen and soil cores were gently washed out. Root mass was determined after 24–48 h of air drying. Dry roots were weighed using a standard analytical balance.
2.4. Statistical Analysis
Statistical analysis was performed using a randomized complete block design with six replications (blocks) to design the arrangement of the lysimeters in the greenhouse. One-way analysis of variance (ANOVA) with P ≤ 0.05 was conducted to interpret the study of the possible effects of different WTD on soybean growth and yield parameters, including crop water use, plant height, seed weight, pod weight, total biomass, root-shoot ratio, and root distribution obtained from R Studio statistical computing and graphics software (R Core Team, Version R-3.6.0, Vienna, Austria). When the F test for treatments was significant (P ≤ 0.05), mean separation tests on treatments were conducted using Tukey HSD (honestly significant difference) to test comparisons at the P ≤ 0.05 probability level.
3. Results and Discussions
3.1. Water Table Contribution
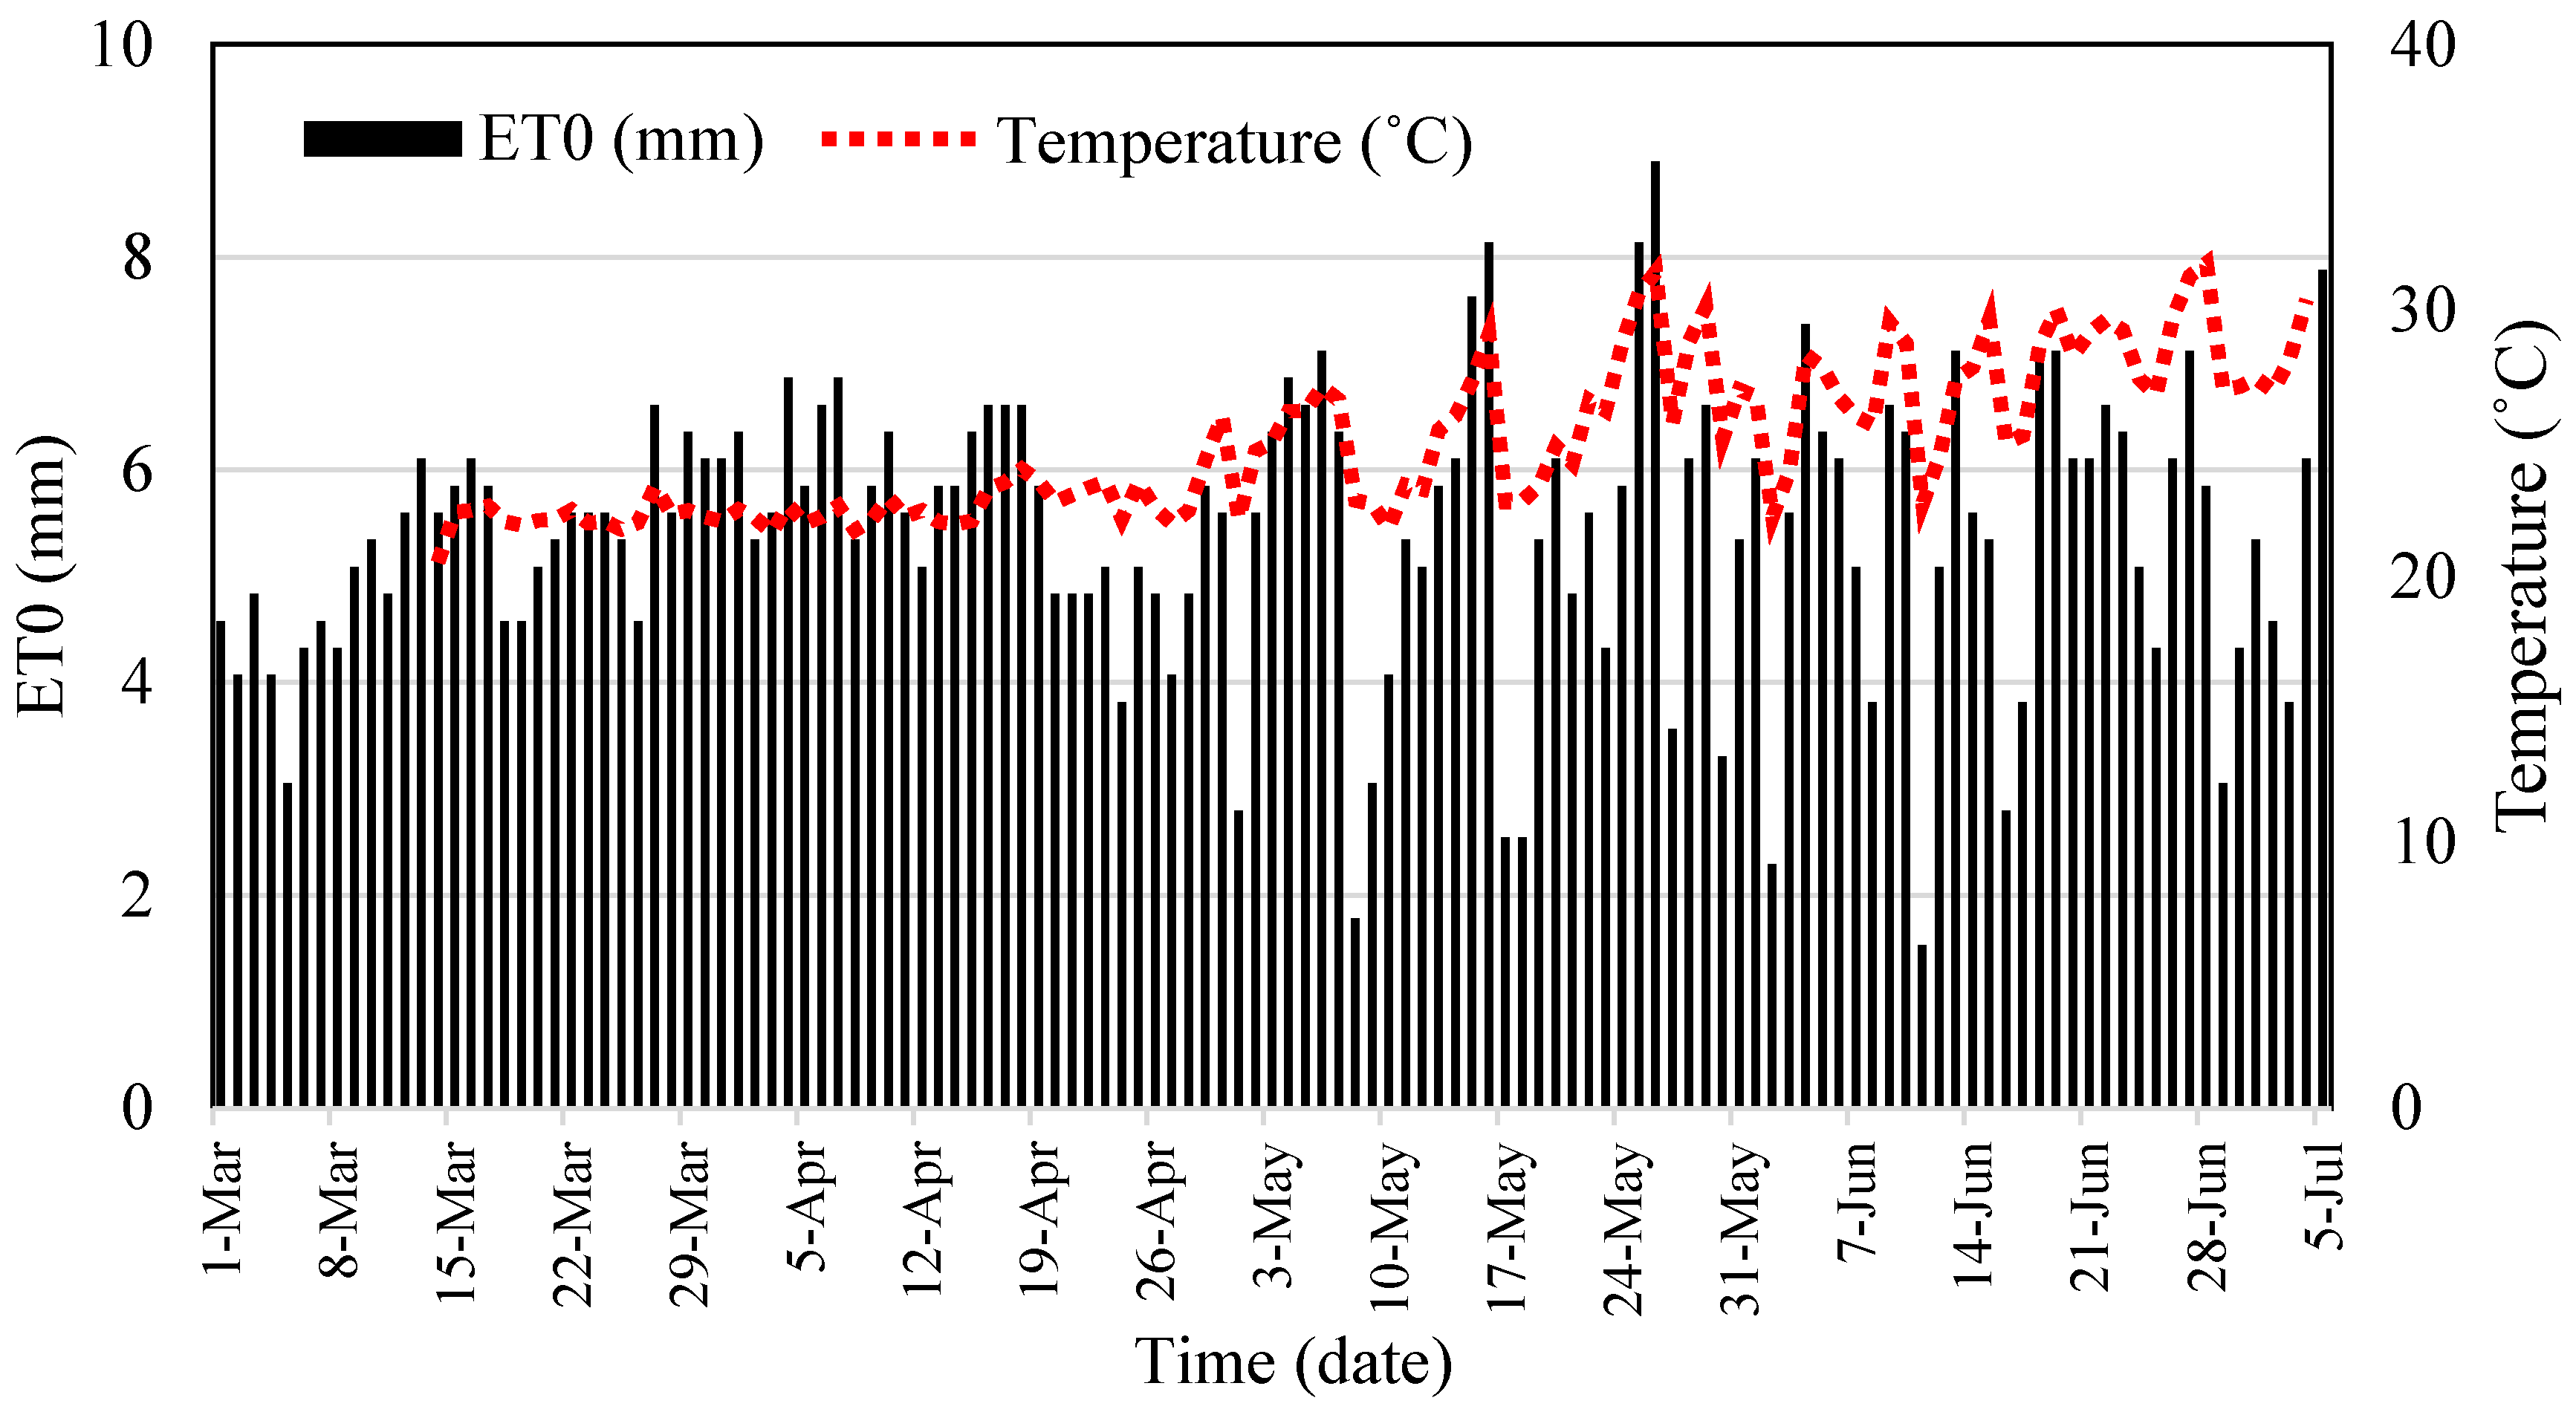
The average temperature in the greenhouse was 25 ± 5 °C in March and April and fluctuated more in May, June, and July because of high ambient temperatures (Figure 2). Daily ETo rates for the growing period were recorded using ETgage and total (cumulative) ETo was measured as 687 mm during the soybean growing season (1 March–4 July). Figure 2 shows that the ETo followed the greenhouse temperature and higher temperature created the higher ETo.
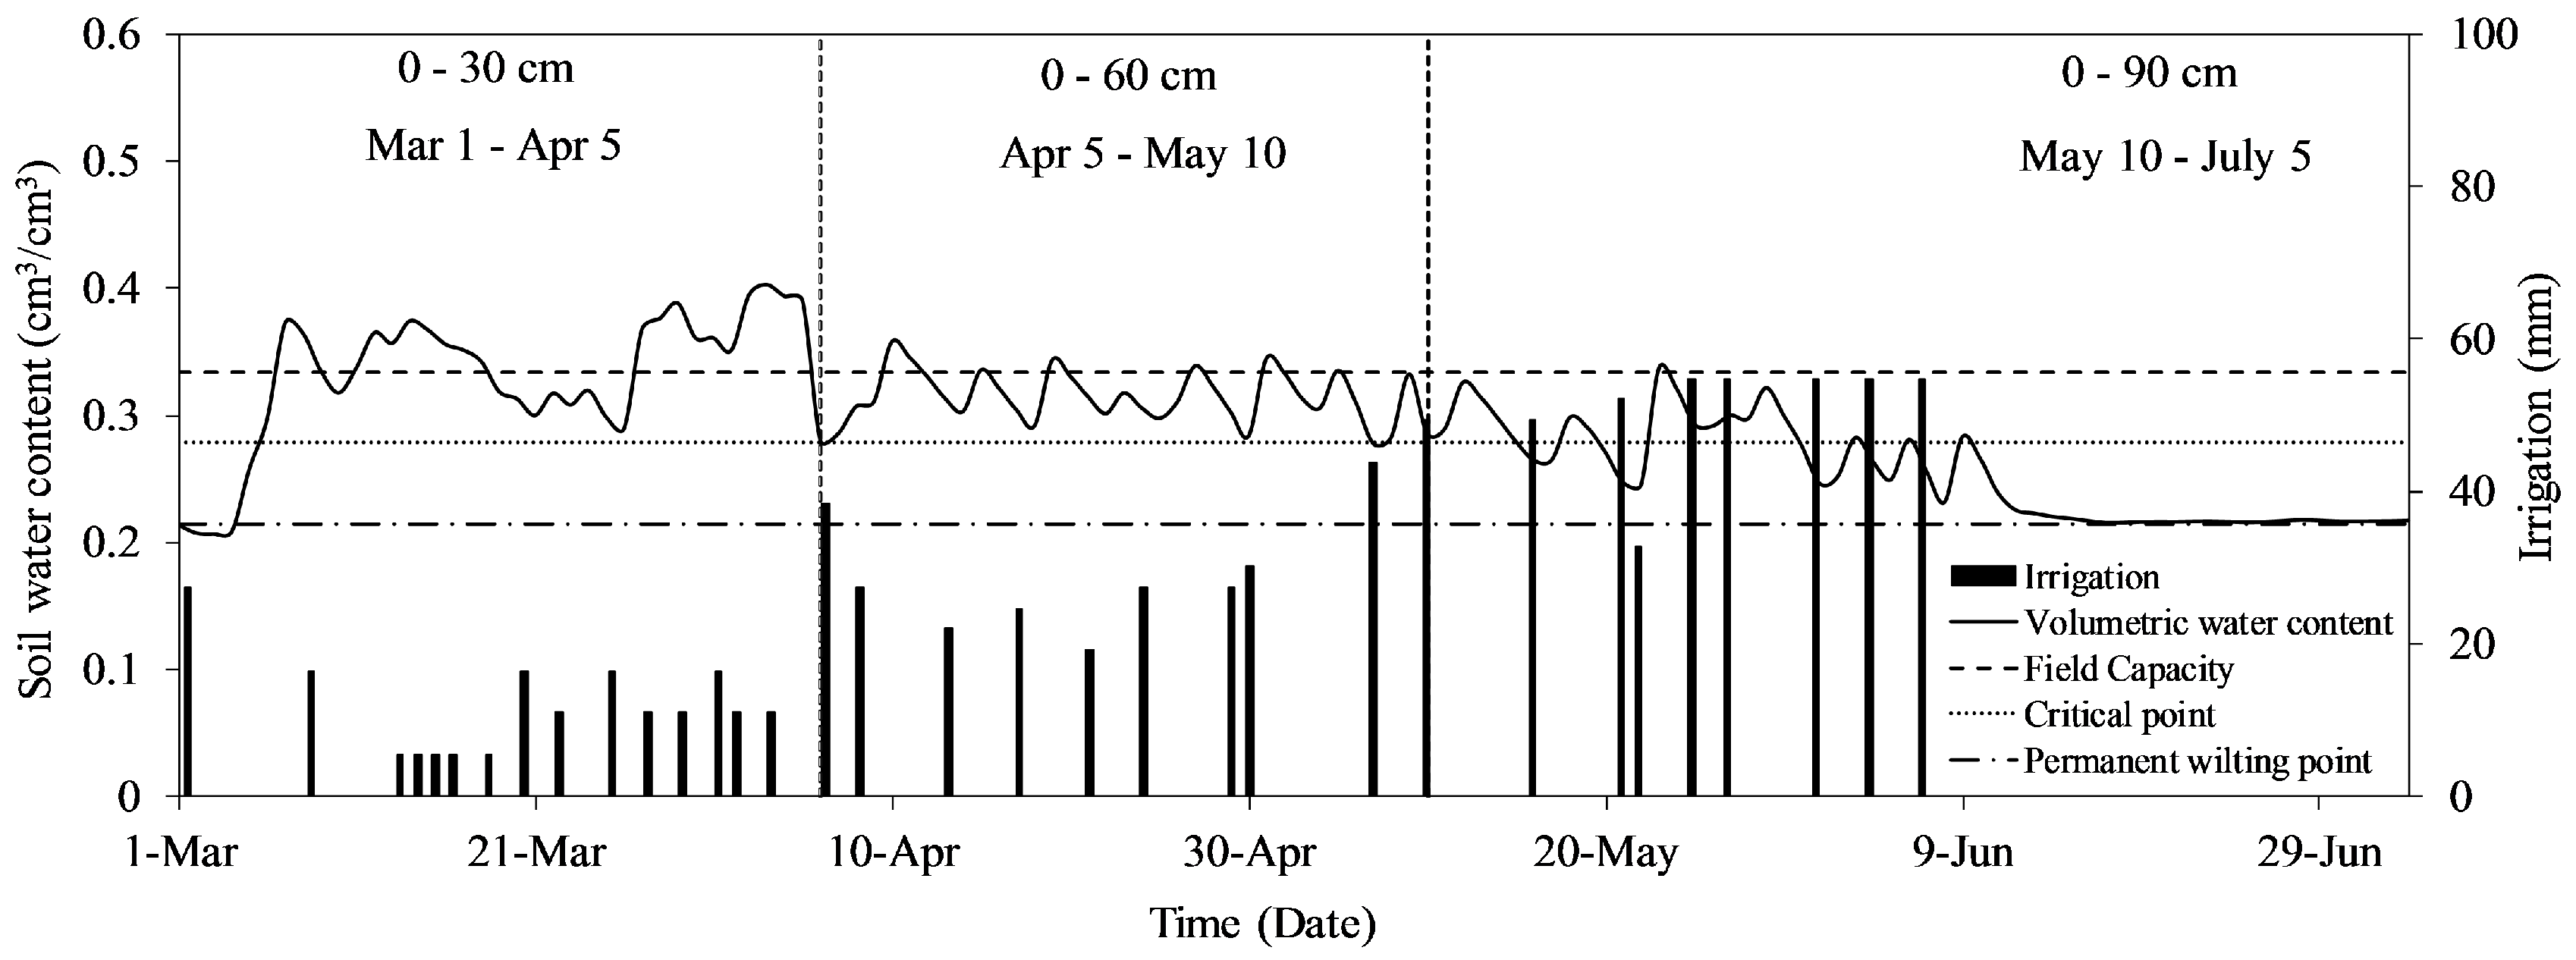
The Tcontrol was designed to keep SWC between field capacity and readily available water in order to keep plants in an ideal condition [22]. The crop water requirements were considered at the rooting depth of 30 cm between 1 March and 5 April, 60 cm between 5 April and 10 May, and 90 cm for the rest of the growing period. Figure 3 shows soil moisture distribution throughout the growing period, and time and amount of applied irrigation in Tcontrol.
For the control experiments, available SWC in the root zone was always maintained between field capacity and readily available water and it never exceeded 50% of the total available water level until 20 May. However, once the 60–90 cm soil profile was included in the irrigation scheduling, the available soil moisture level seemed to exceed 50% of the total available water level. The SWC fluctuated between readily available water and permanent wilting point after 30 May. The growing period for field soybeans is indicated to be 123 days [18]. Since the current experiment was conducted in the greenhouse, it was assumed to be harvested before the field conditions, so that harvest date was planned for last week of June and according to this decision, irrigation was terminated on 7 June. However, plants in the greenhouse were not ready for harvesting until 5 July according to visual observations. Because of the delay in harvest, stress conditions occurred during the last growing period for Tcontrol. After termination of irrigation on 7 June, water content was constant at permanent wilting point. Kahlown and Ashraf [5] pointed out that the highest soybean yield was obtained when optimum environmental and irrigation conditions were provided throughout the growing period. Foroud et al. [23] reported that significant yield loss was found with soybean due to water deficiency during the seeding stage (R6). In current study, low yield and biomass of the irrigated treatment could be explained from moisture stress, which occurred after the last irrigation application. On the other hand, by considering the 60 cm depth for irrigation scheduling, SWC was mostly above the readily available water level so that stress conditions did not occur as much in the 0–90 cm soil profile.
To determine the total ETc, same amount of irrigation was applied to all Tcontrol replications. Results from the soil water balance equation indicated that the sum of soybean crop water use (ETc) varied from 856 to 886 mm, with an average value of 873 mm for Tcontrol (Table 2). For non-irrigated treatments, SWC was calculated using the data obtained from the soil water potential sensors placed in the lysimeters and found to be 360 mm in the 90 cm soil profile (Table 2). It was assumed that the difference of SWC among the lysimeters was minimal and all had the same initial conditions.
The ETc was measured in the lysimeters and showed that the ETc was influenced by WTD (Table 2). Compared total measured ETc of the treatments with different WTD, the highest ETc occurred for T30. Total measured ETc in deeper WTD were less than that of measured at 30 cm depth. The difference of measured ETc between 70 and 90 cm depths were less than the difference between 30 and 50, and 50 and 70 cm depths. Thus, the water table contribution and total measured ETc decreased with increasing WTD from 30 to 90 cm that showed an inverse relationship between WTD and the water table contribution.
3.2. Growth and Yield Parameters
According to the Tukey HSD test, statistical differences were observed for soybean growth and yield parameters between different WTD. These significant differences were indicated with letters in Table 3. For 30, 50, 70, and 90 cm of WTD, the highest to lowest proportion of average water table contributions to soybean crop were determined as 89%, 83%, 79%, and 72%. These results showed that the depth of water table is the main determinant factor for crop water use. Thus, higher water use efficiency was observed for 90 cm water table depth because of the lower crop water use, and higher obtained biomass with grain yield and biomass water use efficiency of 0.31 and 0.61 g/lysi./cm, respectively.
Similar findings have been reported for other crops showed that the water table could contribute 61% of cotton evapotranspiration when the water table was maintained at 91 cm depth [24].
Ayars et al. [3] reported that the contribution of water table reached 40% for cotton crop when the average WTD was maintained at less than 2 m depth. Luo and Sophocleous [25] found that 75% of wheat water requirements could be supplied from water table depth at 1 m. Table 3 shows the measured and obtained growth and yield parameters for soybean during the study period at different treatments.
According to the obtained result (Table 3), different WTD did not influence soybean plant height, pod weight or total biomass. However, obtained seed weight per plant at T90 was significantly higher than that of Tcontrol. The highest mean plant height was observed as 50.1 cm for Tcontrol, while the lowest mean plant height was measured as 48.8 cm for T90. Thus, negative correlation between the mean plant height and WTD was obtained. The highest and lowest seed weights were found at T90 and Tcontrol with 7.00 and 3.91 g/plant, respectively. Seed weights at T50, T70, and T90 were 6%, 6%, and 12% higher than that of T30, T50, and T70, respectively. Water stress in the seeding stage of irrigated lysimeters (Tcontrol) was likely the reason for low grain yields. [22] stated that seed filling, along with seed enlargement stage, are known to be the most susceptible periods of soybean growth and that moisture stress in R5 stage resulted in around 30% seed yield reduction. Similar results were found for pod weight since the correlation coefficient between grain yield and pod weight was 0.98. Results indicated a linear correlation between total biomass and seed weight. The highest and lowest total biomass was observed at T50 as 14.8 g and Tcontrol as 9.8 g. The lowest soybean total biomass at the Tcontrol was likely caused by the water stress in the late growing season. A linear trend was particularly observed between WTD treatments.
3.3. Water Use Efficiency (WUE)
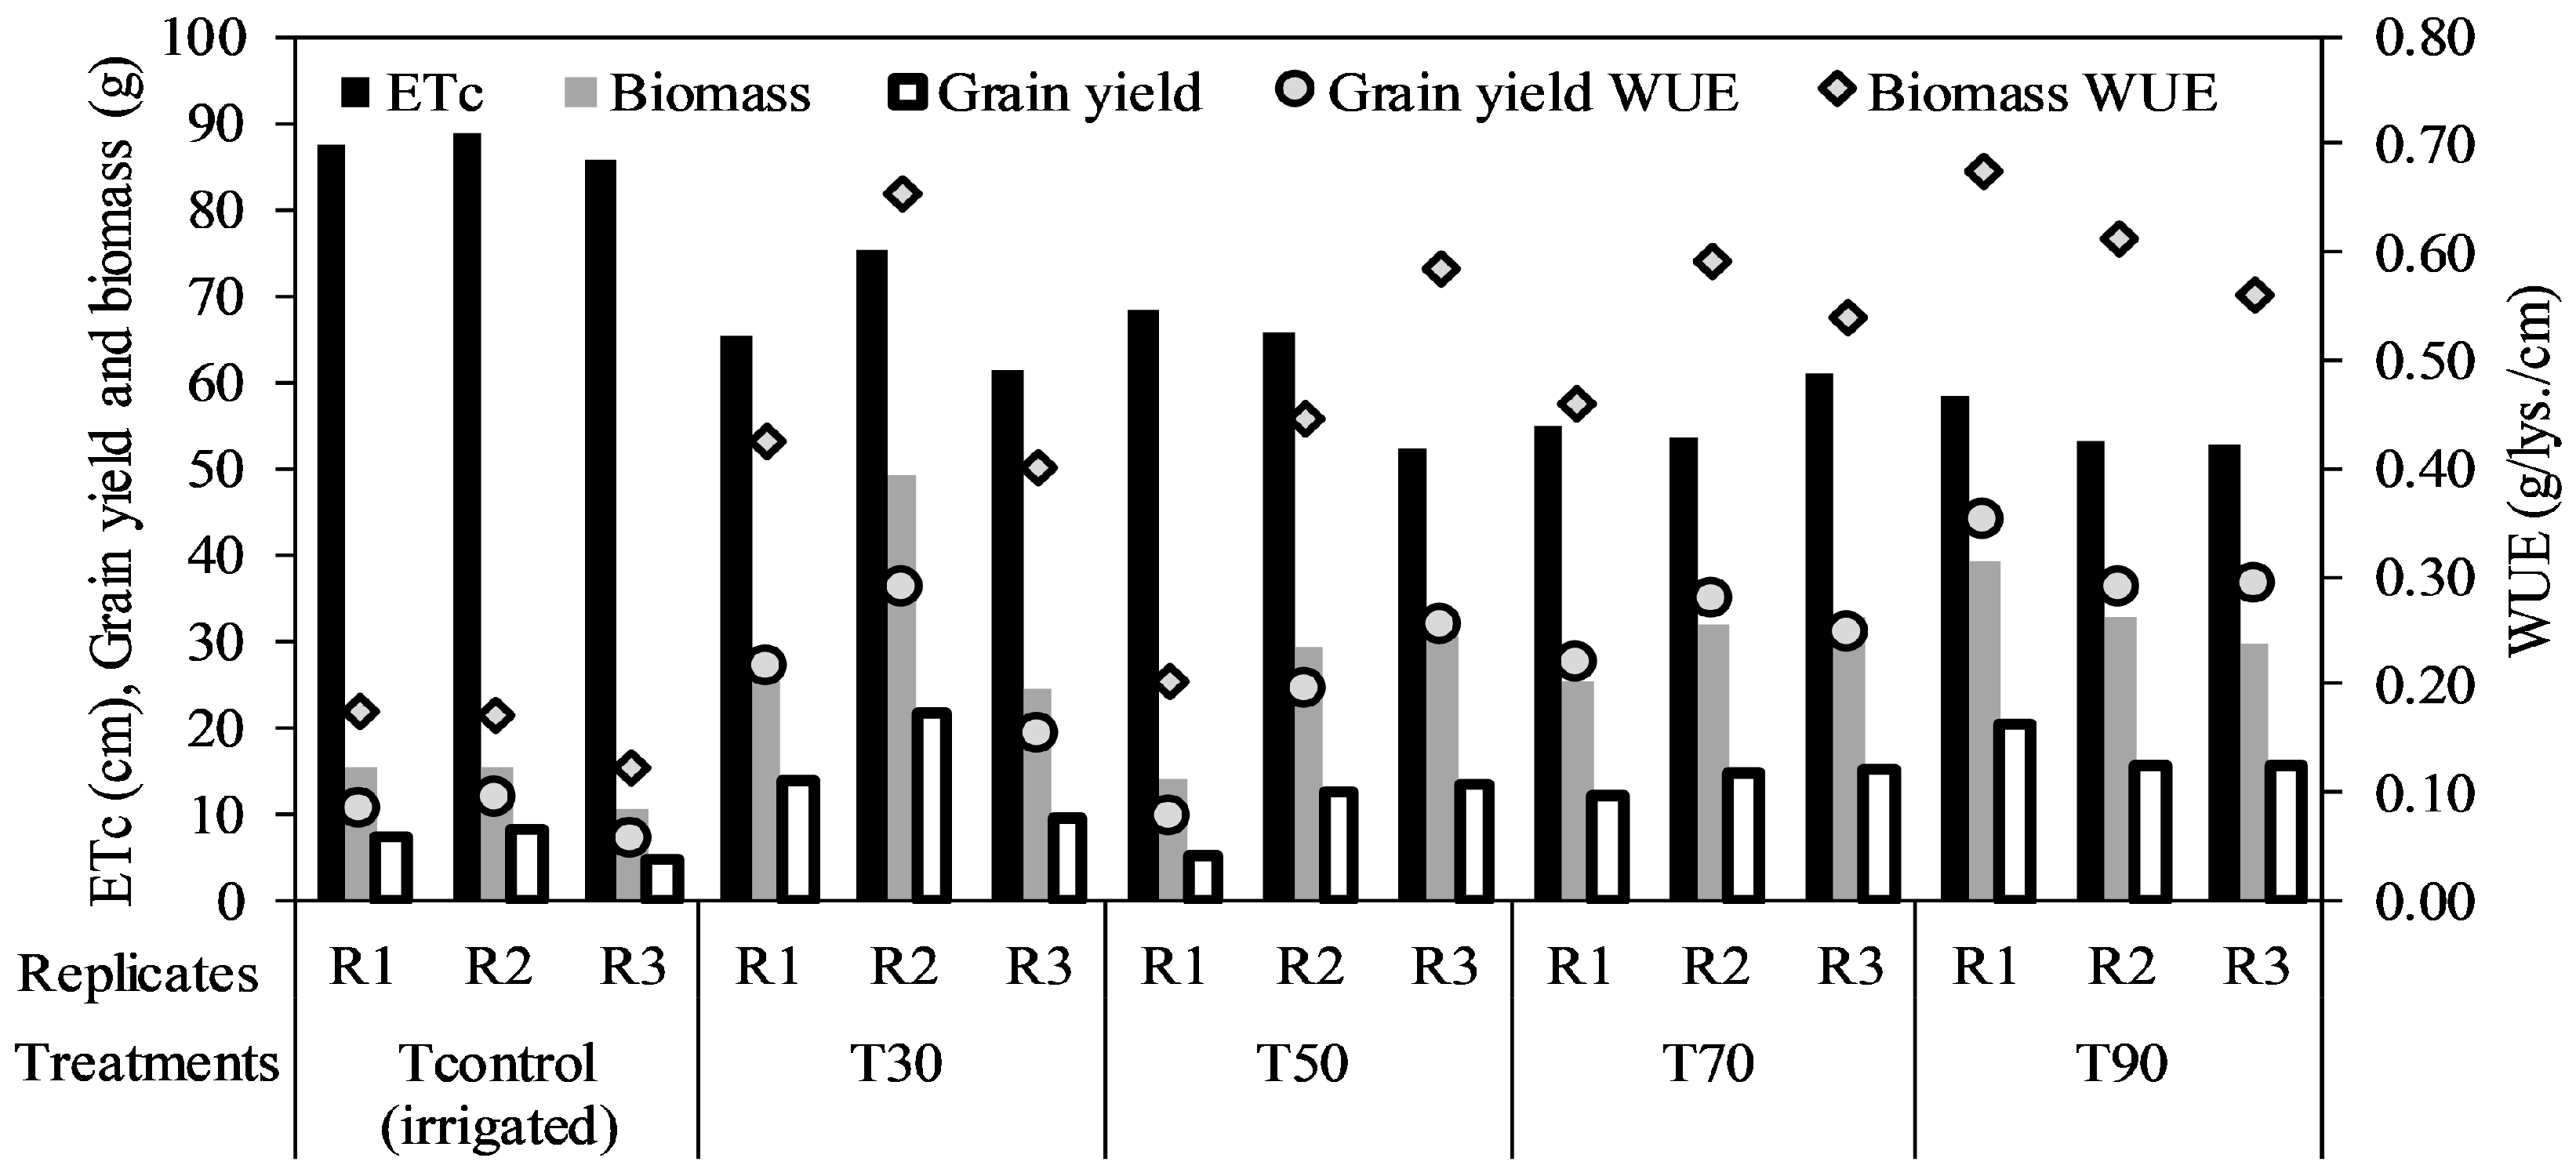
WUE was calculated based on total biomass (harvested total dry matter) and total grain yield (harvested seed weight) by dividing them to the measured ETc. Figure 4 shows the measured ETc for different treatments and replications among with the obtained grain yield, grain yield WUE and biomass WUE for each lysimeter.
According to Table 4, similar trend was observed for the average total biomass WUE and average grain yield WUE in response to different WTD. The total biomass WUE of soybean gradually increased with increasing WTD. The average total biomass WUE for T90 was found to be the highest with 0.062 g/lys./mm compared to the other treatments. In agreement with the obtained results, Mueller et al. [26] found an increasing WUE with deeper WTD. In addition, the intervals of 60–80, 80–130, and 70–110 cm WTD have been reported to have the highest biomass WUE for winter wheat and maize, alfalfa, and red clover, respectively [26].
The relationship between total biomass and grain yield WUE showed that the biomass and grain yield WUE have linear relationship. The relationship showed that all replicates with 90 cm of water table depth gained the highest biomass and grain yield WUE than the other treatments. All other treatments showed higher fluctuation in term of biomass and grain yield WUE and the lowest value obtained for Tcontrol.
3.4. Dry Root Mass
The average total root mass of Tcontrol in the soil profile was obtained as 6.17 g, which was the lowest among all treatments and significantly lower than that for T70 and T90 treatments (Table 5). For 0–20 cm soil depth (first layer), Tcontrol showed the highest measured root mass among the all treatments with 4.37 g which was the highest measured root mass of Tcontrol compared to the other soil layers. Due to the applied irrigation, the amount of accessible water in the surface layers were higher than that for the deeper layer. Thus, the 0–20 cm and 20–40 cm soil layer of Tcontrol was expected to have higher density and root mass compared to the 40–75 cm soil layer. In terms of percentage, approximately 71% and 90% of measured root mass for Tcontrol was observed at 0–20 and 0–40 cm layers of the soil profile, respectively. The average measured and percentage of root mass for different depths of the soil profile for different water table depths and controlled treatment are summarized in Table 5.
According to Table 5, T30 had the greatest root mass at the 0–20 cm layer with an average mass of 3.53 g, which was not significantly different from the root mass at 20–40 and 40–75 cm layers. Proportional root mass of the three soil layers at T30 treatment was 41%, 26%, and 33%, for 0–20, 20–40, and 40–75 cm of soil layers, respectively. Mean total root mass of T30 in the soil profile was 8.67 g, which was similar to the mean total root mass of T50.
In contrast to Tcontrol and the T30 cm treatments, the greatest portion of root mass for the T50 cm WTD treatment was concentrated in the third layer (40–75 cm soil depth) where it meets with the water table (Table 5). Mean root mass of first, second, and third layers averaged 2.4, 1.7, and 4.8 g, respectively. Proportional root mass of three soil layers was accounted for 27%, 19%, and 54%, respectively. In terms of total mass, there was no difference between the Tcontrol, T30, and T50 treatments.
Even though total root mass continued to increase as WTD increases, T70 and T90 treatments resulted in similar root mass development (Table 5). The proportion of root mass distribution for T70 and T90 treatments in first, second, and third layers were similar, with greater root mass in the 40–75 cm layer compared to root masses of the shallower layers. Results suggested that stress occurred in the upper layers, stimulating roots to develop at deeper layers, and resulted in root development near the water table. Comparatively, very low dry root mass was found at the first and second layers of the T70 and T90 treatments, most probably because the plants’ roots did not spend energy to increase root density in the upper two layers. Similar findings were reported by Imada et al. [27] with higher fine-root length just above the deeper WTD versus the upper layers.
4. Conclusions
In a lysimeter experiment at the controlled greenhouse environment, the parameters of soybean growth, yield, crop water use, water use efficiency, and root mass distributions in response to surface irrigation and different water table depths (30, 50, 70, and 90 cm) were investigated. The measured crop evapotranspiration values during the soybean growing season (1 March–4 July) showed that the highest (873 mm) and the lowest (548 mm) values were produced in the irrigation and 90 cm water table depth treatments, respectively.
The ND Bison Soybean (RFP-279) variety as a planted crop in all lysimeters was found to be tolerant to the shallow water table in a vegetative growth period since there was no statistical difference among the treatments with various water table depths. However, the seed weight and total biomass of the treatments with constant water table depths were higher than the irrigated treatment. The deepest water table depth illustrated the highest biomass and seed weight compared to the other treatments. The roots response to the different water table depths were strongly indicated a relationship between root development and water table depth. The linear relationship was observed between the water table depth and the root distribution and mass.
Overall, the 70 and 90 cm of the water table depth were found to be an optimum depth for soybean growth and yield in this lysimeter study. However, the quality of the shallow water table is one of the critical factors that affect crop water use and performance. Therefore, the combined effect of the different water table depth and the impact of salinity is needed for future studies.
Author Contributions
Conceptualization, H.S. and X.J.; methodology, H.S., X.J., A.L.M.D., and D.D.S.; software, Y.F.F. and A.R.N.; resources, H.H.-V., X.J., and D.D.S.; writing—original draft preparation, Y.F.F.; writing—review and editing, H.S., D.D.S., A.A.M.D., and H.H.-V.; supervision, H.S. and X.J.; funding acquisition, H.S.
Funding
This research was funded by the North Dakota Water Resource Research Institute and North Dakota Agricultural Experiment Station. These funding supports are thankfully acknowledged. Also, the authors gratefully acknowledged the financial support provided by the Turkish Ministry of Education and General Directorate of State Hydraulic Works for the scholarship that is provided for the MS student, Yavuz Fatih Fidantemiz.
Acknowledgments
We appreciate the anonymous reviewers for their valuable comments and efforts to improve this manuscript.
Conflicts of Interest
The authors declare no conflict of interest.
References
- Hamdy, A.; Ragab, R.; Scarascia-Mugnozza, E. Coping with water scarcity: Water saving and increasing water productivity. Irrig. Drain. 2003, 52, 3–20. [Google Scholar] [CrossRef]
- Steduto, P.; Hoogeveen, J.; Winpenny, J.; Burke, J. Coping with Water Scarcity: An Action Framework for Agriculture and Food Security; Food and Agriculture Organization of the United Nations: Rome, Italy, 2017. [Google Scholar]
- Ayars, J.; Schoneman, R.; Dale, F.; Meso, B.; Shouse, P. Managing subsurface drip irrigation in the presence of shallow ground water. Agric. Water Manag. 2001, 47, 243–264. [Google Scholar] [CrossRef]
- Ghamarnia, H.; Golamian, M.; Sepehri, S.; Arji, I.; Rezvani, V. Groundwater contribution by safflower (Carthamus tinctorius L.) under high salinity, different water table levels, with and without irrigation. J. Irrig. Drain. Eng. 2011, 138, 156–165. [Google Scholar] [CrossRef]
- Kahlown, M.; Ashraf, M. Effect of shallow groundwater table on crop water requirements and crop yields. Agric. Water Manag. 2005, 76, 24–35. [Google Scholar] [CrossRef]
- Hutmacher, R.; Ayars, J.; Vail, S.; Bravo, A.; Dettinger, D.; Schoneman, R. Uptake of shallow groundwater by cotton: Growth stage, groundwater salinity effects in column lysimeters. Agric. Water Manag. 1996, 31, 205–223. [Google Scholar] [CrossRef]
- Ayars, J.; Christen, E.; Soppe, R.; Meyer, W. The resource potential of in-situ shallow ground water use in irrigated agriculture: A review. Irrig. Sci. 2006, 24, 147–160. [Google Scholar] [CrossRef]
- Li, S.; Luo, W.; Jia, Z.; Tang, S.; Chen, C. The Pros and Cons of Encouraging Shallow Groundwater Use through Controlled Drainage in a Salt-Impacted Irrigation Area. Water Res. Manag. 2018, 32, 2475–2487. [Google Scholar] [CrossRef]
- Soppe, R.; Ayars, J. Characterizing ground water use by safflower using weighing lysimeters. Agric. Water Manag. 2003, 60, 59–71. [Google Scholar] [CrossRef]
- Franzen, D. Managing Saline Soils in North Dakota; NDSU Extension Service: Fargo, ND, USA, 2013. [Google Scholar]
- Gao, X.; Huo, Z.; Qu, Z.; Xu, X.; Huang, G.; Steenhuis, T.S. Modeling contribution of shallow groundwater to evapotranspiration and yield of maize in an arid area. Sci. Rep. 2017, 7, 43122. [Google Scholar] [CrossRef] [PubMed] [Green Version]
- Ghamarnia, H.; Daichin, S. Effect of different water stress regimes on different coriander (Coriander sativum L.) parameters in a semi-arid climate. Int. J. Agron. Plant Prod. 2013, 4, 822–832. [Google Scholar]
- Gowing, J.; Rose, D.; Ghamarnia, H. The effect of salinity on water productivity of wheat under deficit irrigation above shallow groundwater. Agric. Water Manag. 2009, 96, 517–524. [Google Scholar] [CrossRef]
- Benz, L.; Doering, E.; Reichman, G. Water-table contribution to alfalfa evapotranspiration and yields in sandy soils. Trans. ASAE 1984, 27, 1307–1312. [Google Scholar] [CrossRef]
- Niaghi, A.R.; Jia, X.; Scherer, T.F.; Steele, D.D. Measurement of Non-Irrigated Turfgrass Evapotranspiration Rate in the Red River Valley. Vadose Zone J. 2019, 1–37. [Google Scholar] [CrossRef]
- Meyer, W.; Dugas, W.; Barrs, H.; Smith, R.; Fleetwood, R. Effects of soil type on soybean crop water use in weighing lysimeters. Irrig. Sci. 1990, 11, 69–75. [Google Scholar]
- Luo, W.; Sands, G.R.; Youssef, M.; Strock, J.S.; Song, I.; Canelon, D. Modeling the impact of alternative drainage practices in the northern Corn-belt with DRAINMOD-NII. Agric. Water Manag. 2010, 97, 389–398. [Google Scholar] [CrossRef]
- Kandel, H. Soybean Production Field Guide for North Dakota and Northwestern Minnesota; North Dakota Soybean Council: Fargo, ND, USA, 2010. [Google Scholar]
- Van Genuchten, M.T. A closed-form equation for predicting the hydraulic conductivity of unsaturated soils 1. Soil Sci. Soc. Am. J. 1980, 44, 892–898. [Google Scholar] [CrossRef]
- Hillel, D. Environmental Soil Physics; Academic Press: San Diego, CA, USA; Cambridge, MA, USA, 1998. [Google Scholar]
- Majumdar, D.K. Irrigation Water Management: Principles and Practice; PHI Learning Pvt. Ltd.: New Delhi, India, 2001. [Google Scholar]
- Karam, F.; Masaad, R.; Sfeir, T.; Mounzer, O.; Rouphael, Y. Evapotranspiration and seed yield of field grown soybean under deficit irrigation conditions. Agric. Water Manag. 2005, 75, 226–244. [Google Scholar] [CrossRef]
- Foroud, N.; Mündel, H.-H.; Saindon, G.; Entz, T. Effect of level and timing of moisture stress on soybean plant development and yield components. Irrig. Sci. 1993, 13, 149–155. [Google Scholar] [CrossRef]
- Namken, L.; Wiegand, C.; Brown, R. Water Use by Cotton from Low and Moderately Saline Static Water Tables 1. Agron. J. 1969, 61, 305–310. [Google Scholar] [CrossRef]
- Luo, Y.; Sophocleous, M. Seasonal groundwater contribution to crop-water use assessed with lysimeter observations and model simulations. J. Hydrol. 2010, 389, 325–335. [Google Scholar] [CrossRef] [Green Version]
- Mueller, L.; Behrendt, A.; Schalitz, G.; Schindler, U. Water Use Efficiency of Crops at Shallow Water Tables in a Temperate Climate. Proceedings of The Drainage VIII, Sacramento, CA, USA, 21–24 March 2004; p. 1. [Google Scholar]
- Imada, S.; Yamanaka, N.; Tamai, S. Water table depth affects Populus alba fine root growth and whole plant biomass. Funct. Ecol. 2008, 22, 1018–1026. [Google Scholar] [CrossRef]
Figure 1.
Schematic diagram of lysimeter and Mariotte bottle system to control water table depth.

Figure 2.
Measured daily average air temperature (°C) and reference evapotranspiration (ET0) in greenhouse-controlled environment during the soybean growing season.
Figure 2.
Measured daily average air temperature (°C) and reference evapotranspiration (ET0) in greenhouse-controlled environment during the soybean growing season.

Figure 3.
Soil water content of controlled lysimeters (Tcontrol), and the amount of applied irrigation at each Tcontrol during the soybean growing season.
Figure 3.
Soil water content of controlled lysimeters (Tcontrol), and the amount of applied irrigation at each Tcontrol during the soybean growing season.

Figure 4.
Measured crop evapotranspiration, grain yield and biomass, and obtained grain yield and biomass water use efficiency for different water table depths (30, 50, 70, and 90 cm) with three replications (R1, R2, and R3).
Figure 4.
Measured crop evapotranspiration, grain yield and biomass, and obtained grain yield and biomass water use efficiency for different water table depths (30, 50, 70, and 90 cm) with three replications (R1, R2, and R3).


Table 1.
The summary of soil physical properties.
| Soil Fractions | Physical Properties of Soil | ||||||
|---|---|---|---|---|---|---|---|
| Sand | Silt | Clay | Soil Texture | Field Capacity | Readily Available Water | Permanent Wilting Point | Bulk Density |
| % | % | % | # | cm3 cm−3 | cm3 cm−3 | cm3 cm−3 | Mg m−3 |
| 43 | 35 | 22 | Loam | 0.32 | 0.27 | 0.21 | 1.41 |
Note: Soil fractions and soil physical properties were determined after mixing the soil with sand.
Table 2.
Summary of total measured crop water use (ETc) from different water table depths (WTD).
| Replicate/WTD | Initial SWC (mm) | Irrigation (mm) | Water Table Contribution (mm) | Final SWC (mm) | ETc (mm) | Average ETc (mm) |
|---|---|---|---|---|---|---|
| R1-Tcontrol | 175 | 891 | - | 190 | 876 | 873 |
| R2-Tcontrol | 175 | 891 | - | 180 | 886 | |
| R3-Tcontrol | 175 | 891 | - | 211 | 856 | |
| R1-T30 | 360 | - | 573 | 280 | 653 | 673 |
| R2-T30 | 360 | - | 678 | 287 | 751 | |
| R3-T30 | 360 | - | 543 | 289 | 614 | |
| R1-T50 | 360 | - | 605 | 280 | 685 | 622 |
| R2-T50 | 360 | - | 518 | 222 | 656 | |
| R3-T50 | 360 | - | 433 | 268 | 525 | |
| R1-T70 | 360 | - | 431 | 241 | 550 | 567 |
| R2-T70 | 360 | - | 407 | 231 | 536 | |
| R3-T70 | 360 | - | 498 | 244 | 614 | |
| R1-T90 | 360 | - | 437 | 214 | 583 | 548 |
| R2-T90 | 360 | - | 365 | 192 | 533 | |
| R3-T90 | 360 | - | 376 | 207 | 529 |
Note: R and T denote to replication and treatment, respectively. SWC: Soil water content in mm for whole column of lysimeter. Initial condition was assumed to be identical for all lysimeters.
Table 3.
Average measured height, pod and seed weight per plant, and obtained total biomass of soybean from irrigated treatment (Tcontrol) and different applied water table depths.
Table 3.
Average measured height, pod and seed weight per plant, and obtained total biomass of soybean from irrigated treatment (Tcontrol) and different applied water table depths.
| Treatment | Height (cm) | Pod Weight g/plant | Seed Weight g/plant | Total Biomass g/plant |
|---|---|---|---|---|
| Tcontrol | 50.1 | 5.9 | 3.91b | 9.2b |
| T30 | 49.2 | 7.9 | 5.53 | 13.4 |
| T50 | 48.9 | 8.5 | 5.88 | 14.8 |
| T70 | 49.4 | 8.7 | 6.25 | 14.6 |
| T90 | 48.8 | 9.7 | 7.00a | 14.5a |
Note: The uppercase letters (a and b) illustrate the result of statistical analysis (P ≤ 0.05) between the treatments. For example, for seed weight, T90 had significantly higher seed weight than Tcontrol, but the other treatments did not show significant difference in seed weight compared to Tcontrol. The values without superscripts did not show any significant difference compared to the other treatments.
Table 4.
Average of grain yield, total biomass, measured evapotranspiration (ETc), grain yield and biomass WUE for different treatments in controlled greenhouse environment.
Table 4.
Average of grain yield, total biomass, measured evapotranspiration (ETc), grain yield and biomass WUE for different treatments in controlled greenhouse environment.
| Treatments | Grain Yield | Total Biomass | ETc | Grain Yield WUE | Total Biomass WUE |
|---|---|---|---|---|---|
| g/lys. | g/lys. | mm | g/lys./cm | g/lys./cm | |
| Tcontrol | 6.9b | 13.8b | 873a | 0.08c | 0.16b |
| T30 | 15.1a | 33.9a | 673b | 0.22ab | 0.53a |
| T50 | 10.5ab | 30a | 622bc | 0.18bc | 0.41a |
| T70 | 14.1ab | 33.8a | 566c | 0.25ab | 0.53a |
| T90 | 17.2a | 33.9a | 548c | 0.31a | 0.61a |
Note: The superscripts illustrate the result of statistical analysis between the treatments. For example, for grain yield column, T90 had significantly higher (annotated with a) grain yield than Tcontrol (annotated with b), but the other treatments did not show significant difference (ab) in grain yield compared to each other. For crop WUE column, the obtained crop WUE for T70 was significantly lower than that for T30 and crop WUE of T30 was significantly lower than that for Tcontrol. T50 showed non-significant difference in crop WUE compared to that for T30 and T70 (annotated with bc).
Table 5.
Average root mass and proportions for each layer of the treatments.
| Layers | Depth | Average Root Mass and Percentage | |||||||||
|---|---|---|---|---|---|---|---|---|---|---|---|
| Tcontrol | T30 | T50 | T70 | T90 | |||||||
| cm | g | % | g | % | g | % | g | % | g | % | |
| First | 0–20 | 4.37A | 71 | 3.53 | 41 | 2.40B | 27 | 2.30B | 20 | 3.10B | 24 |
| Second | 20–40 | 1.17B | 19 | 2.23 | 26 | 1.73B | 19 | 1.10B | 10 | 1.30B | 10 |
| Third | 40–75 | 0.63B | 10 | 2.90 | 33 | 4.80A | 54 | 8.00A | 70 | 8.43A | 66 |
| TOTAL | 6.17b | 100 | 8.67 | 100 | 8.93 | 100 | 11.40a | 100 | 12.83a | 100 | |
Note: Uppercase letters (A and B) indicate statistically significant differences (P ≤ 0.05) between depths within a given treatment (column), and lowercase letters (a and b) indicate statistically significant differences between the treatments (row). For example, average root mass of first layer in Tcontrol was significantly higher (A) than that for other layers (annotated with B). In comparison between treatments, for example Tcontrol had significantly lower average root mass compared to than that for T70 and T90 (a). Non-significant treatments do not have superscript.
© 2019 by the authors. Licensee MDPI, Basel, Switzerland. This article is an open access article distributed under the terms and conditions of the Creative Commons Attribution (CC BY) license (http://creativecommons.org/licenses/by/4.0/).
Share and Cite
MDPI and ACS Style
Fidantemiz, Y.F.; Jia, X.; Daigh, A.L.M.; Hatterman-Valenti, H.; Steele, D.D.; Niaghi, A.R.; Simsek, H. Effect of Water Table Depth on Soybean Water Use, Growth, and Yield Parameters. Water 2019, 11, 931. https://doi.org/10.3390/w11050931
AMA Style
Fidantemiz YF, Jia X, Daigh ALM, Hatterman-Valenti H, Steele DD, Niaghi AR, Simsek H. Effect of Water Table Depth on Soybean Water Use, Growth, and Yield Parameters. Water. 2019; 11(5):931. https://doi.org/10.3390/w11050931
Chicago/Turabian StyleFidantemiz, Yavuz F., Xinhua Jia, Aaron L.M. Daigh, Harlene Hatterman-Valenti, Dean D. Steele, Ali R. Niaghi, and Halis Simsek. 2019. "Effect of Water Table Depth on Soybean Water Use, Growth, and Yield Parameters" Water 11, no. 5: 931. https://doi.org/10.3390/w11050931
Note that from the first issue of 2016, this journal uses article numbers instead of page numbers. See further details here.