Production of Chromophoric Dissolved Organic Matter (CDOM) in Laboratory Cultures of Arctic Sea Ice Algae


1
College of Marine Science and Engineering, Tianjin University of Science and Technology, Tianjin 300457, China
2
Institut des sciences de la mer de Rimouski, Université du Québec à Rimouski, Rimouski, QC G5L 3A1, Canada
3
School of Marine Science and Technology, Tianjin University, Tianjin 300072, China
*
Author to whom correspondence should be addressed.
Water 2019, 11(5), 926; https://doi.org/10.3390/w11050926
Submission received: 16 March 2019
/
Revised: 28 April 2019
/
Accepted: 29 April 2019
/
Published: 1 May 2019
(This article belongs to the Special Issue Climate-Water-Ecosystem-Interaction)
Abstract
:Chromophoric dissolved organic matter (CDOM) is highly enriched in bottom sea ice in the Arctic during ice algal blooms, giving rise to multifaceted ecological implications in both the sea ice and the underlying seawater. We conducted laboratory culture incubations to assess the potential role of ice algae in the accumulation of CDOM in Arctic sea ice. Non-axenic monocultures of Attheya septentrionalis and Nitzschia frigida and a natural ice algal assemblage (NIAA) were grown at 4 °C in an f/2 medium under cool white fluorescent light. Culture samples were collected several days apart throughout the exponential, stationary, and senescent phases, and analyzed for CDOM absorbance, chlorophyll a, and bacterial cell abundance. The cultures displayed apparent specific growth rates of algal and bacterial cells comparable to those in the field. Accumulations of CDOM were observed in all cultures during the time-course incubations, with the senescent phase showing the largest accumulations and the highest production rates. The senescent-phase production rate for NIAA was ~40% higher than that for A. septentrionalis. The chlorophyll a-normalized CDOM production rates in the cultures are comparable to those reported for Arctic first-year sea ice. The absorption spectra of CDOM in the cultures exhibited characteristic short-ultraviolet shoulders similar to those previously identified in sea ice. This study demonstrates that ice algal-derived CDOM can account for the springtime accumulation of CDOM in Arctic sea ice.
1. Introduction
Chromophoric dissolved organic matter (CDOM) is highly enriched in bottom sea ice in the Arctic during the spring season [1,2,3,4,5,6,7]. The presence of this dense CDOM pool plays an important role in regulating in-ice and under-ice optics and biogeochemistry [1,8,9,10]. The high ultraviolet (UV)-absorbing nature of CDOM mitigates photo-damage to sympagic organisms, whereas the absorption of visible radiation by sea-ice CDOM decreases light availability to photosynthesis in the under-ice water column. Along with its colorless counterpart, CDOM is an important substrate for fueling sea-ice heterotrophs [11,12] and photooxidation [3,5,13]. After sea-ice CDOM is released into seawater during the melting season, it becomes a potentially significant player in water-column optics, heat budget, and biogeochemical cycling [1,2,9].
CDOM present in seawater can be incorporated into sea ice during ice formation [12,14]. However, the main cause for the enrichment of CDOM in sea ice has been attributed to in situ biological activity of sympagic organisms including ice algae, bacteria, and protozoan and/or metazoan grazers [12,15,16]. Ice algae have been suspected to be the primary source of sea-ice CDOM based on positive correlations between CDOM and ice algal biomass observed on several occasions in Arctic first-year sea ice [4,5]. To our knowledge, no direct evidence has been reported to support this supposition. By employing laboratory incubations of typical ice algal species, this study aims to assess the capability of ice algae to produce CDOM and the implication of ice algal-derived CDOM for the CDOM budget in first-year sea ice in the Arctic.
2. Materials and Methods
2.1. Culture Incubations
Diatom species of Attheya septentrionalis (A. septentrionalis) and Nitzschia frigida (N. frigida) were selected due to their widespread distributions in first-year sea ice in the Arctic [17,18,19]. The parent monocultures of A. septentrionalis (CCMP strain 2083) and N. frigida were provided by C. Lovejoy at Laval University and A. R. Juhl at Columbia University, respectively. The strain of N. frigida was isolated by ARJ from a sea ice sample collected near Barrow, Alaska [20]. In addition to the monocultures, a natural ice algae assemblage (NIAA) sample collected at the water-ice interface in the Allen Bay (74°43′ N; 95°09′ W) south of Cornwallis Island (Nunavut, Canada) was also examined. The species composition of the ice algal cells in the NIAA sample was identified using the method reported by Galindo et al. [21]. The NIAA was composed of pennate diatoms (87.8%), flagellates (8.9%), and centric diatoms (3.3%). The most abundant taxa were the pennate diatoms N. frigida (48.4%), Navicula pelagica (5.0%) and Achnanthes sp. (3.7%), the centric diatom Attheya sp. (2.3%), and 2–5 µm unidentified flagellates (7.7%). Grazers larger than 20 μm in the NIAA sample were removed by a Nylon mesh with a mesh size of 20 μm. The NIAA thus included smaller bacterial grazers such as heterotrophic nanoflagellates.
Eighty milliliters of each parent culture (non-axenic) were inoculated into 800 mL sterilized f/2 medium contained in a 1 L Erlenmeyer flask. All cultures, along with a medium-only control, were incubated in triplicate at 4 °C under continuous illumination of cool-white fluorescent tubes (Sylvania) that had an irradiance of 40 μmol m−2 s−1 over a wavelength range from 300 nm to 800 nm. The f/2 medium was prepared with seawater (salinity: 34.5) collected from a depth of 200 m at a site (71°11.04′ N, 134°44.88′ W) in Canada Basin of the Arctic Ocean. The seawater was 0.2 μm-filtered (polyethersulfone membrane, Pall) and amended with an f/2 stock solution according to the recipe of Natural Center for Marine Algae and Microbiota (NCMA) at Bigelow Laboratory. The f/2 stock solutions, containing inorganic nutrients (nitrate, phosphate, and silicate), vitamins, and trace metals, were purchased from NCMA.
2.2. Culture Sampling
Cultures were lightly agitated before being sampled, at intervals of several days, using a 50 mL sterile plastic syringe (HSW) fitted with a 1/8" PTFE tube. The samples were then gently passed through a sterile syringe filter (Nalgene) containing a polyethersulfone membrane with a pore size of 0.22 μm and a diameter of 25 mm. The filtrates were stored in 60 mL clear-glass bottles at 4 °C until being analyzed for CDOM absorbance within 2 days of sample collection. Prior to use, the syringe filters had been profusely rinsed with Nanopure water and confirmed to be free of CDOM contamination. The filtrate storage bottles had been soaked with 10% HCl overnight, thoroughly washed with Nanopure water, and combusted at 450 °C for 4–6 h. Chlorophyll a (chl a) samples were collected in duplicate onto 25 mm diameter GF/F filters (Whatman). The filters were then placed in 10 mL of 90% acetone in scintillation vials for at least 18 h at 4 °C in the dark before chl a fluorescence determination. One point eight milliliters of culture was added with 8 µL of 25% glutaraldehyde (Grade II, Sigma G6257) and stored at −80 °C until bacterial enumeration.
2.3. Biological and Chemical Analyses
Absorbance spectra were scanned from 800 nm to 200 nm at 1 nm intervals using a Perkin Elmer Lambda 35 dual beam UV–visible spectrometer fitted with a 5 cm quartz flow cell and referenced to Nanopure water. Prior to each analysis, the quartz cell was rinsed sequentially with methanol, Nanopure water, and sample water. All measured absorbance values from 240 nm to 800 nm were less than 1 and thus within the linear range of the Beer–Lambert Law. Duplicate air vs. air and pure water vs. pure water baseline scans were made every six samples to ensure instrumental stability. The absorption coefficient (base e) at wavelength λ (aλ) was calculated as 2.303 times absorbance divided by the cell’s path length in meters (i.e., 0.05 m). The data were corrected for scattering and baseline shift by subtracting the average absorption coefficient between 683 nm and 687 nm from the entire spectrum [22]. The lower detection limit, defined as three times the standard deviation of six replicate measurements of Nanopure water, was 0.008 m−1 (range: 0.002–0.013 m−1) over the wavelength range from 250 nm to 700 nm.
After extraction in acetone, the supernatants of chl a samples were measured for fluorescence, before and after acidification with 5% HCl, using a Turner Designs fluorometer (model 10-AU) according to Parsons et al. [23]. Chl a concentrations were calculated using the equation of Holm-Hansen et al. [24]. The manufacturer-designated lower detection limit of the fluorometer is 0.025 mg m−3. The average pairwise difference for 122 duplicate GF/F filters as prepared above was 11%, suggesting a standard deviation of the means of 8%.
Free-living heterotrophic bacterial abundance was determined using an Epics Altra flow cytometer (Beckman Coulter) equipped with a 488 nm argon laser operated at 15 mW [25]. A 0.5 mL subsample was half diluted in 1× Tris-EDTA buffer (pH 8) and the resulting 1 mL solution was incubated with 0.25 μL SYBR Green I (Ci = 10 000×, Invitrogen) for 30 min at room temperature in the dark. We added 10 mL fluorescent beads (1 μm in diameter; Fluoresbrite Plain, YG) to each sample as an internal standard and then analyzed the samples with the cytometer for 3 min. Bacterial cell abundance was calculated from the analysis volume that had been gravimetrically determined and corrected for the dead volume (50 μL, i.e., the volume taken from the sample tube but not accounted for when data acquisition was stopped).
3. Results
3.1. Temporal Progressions of Chl a and Bacteria
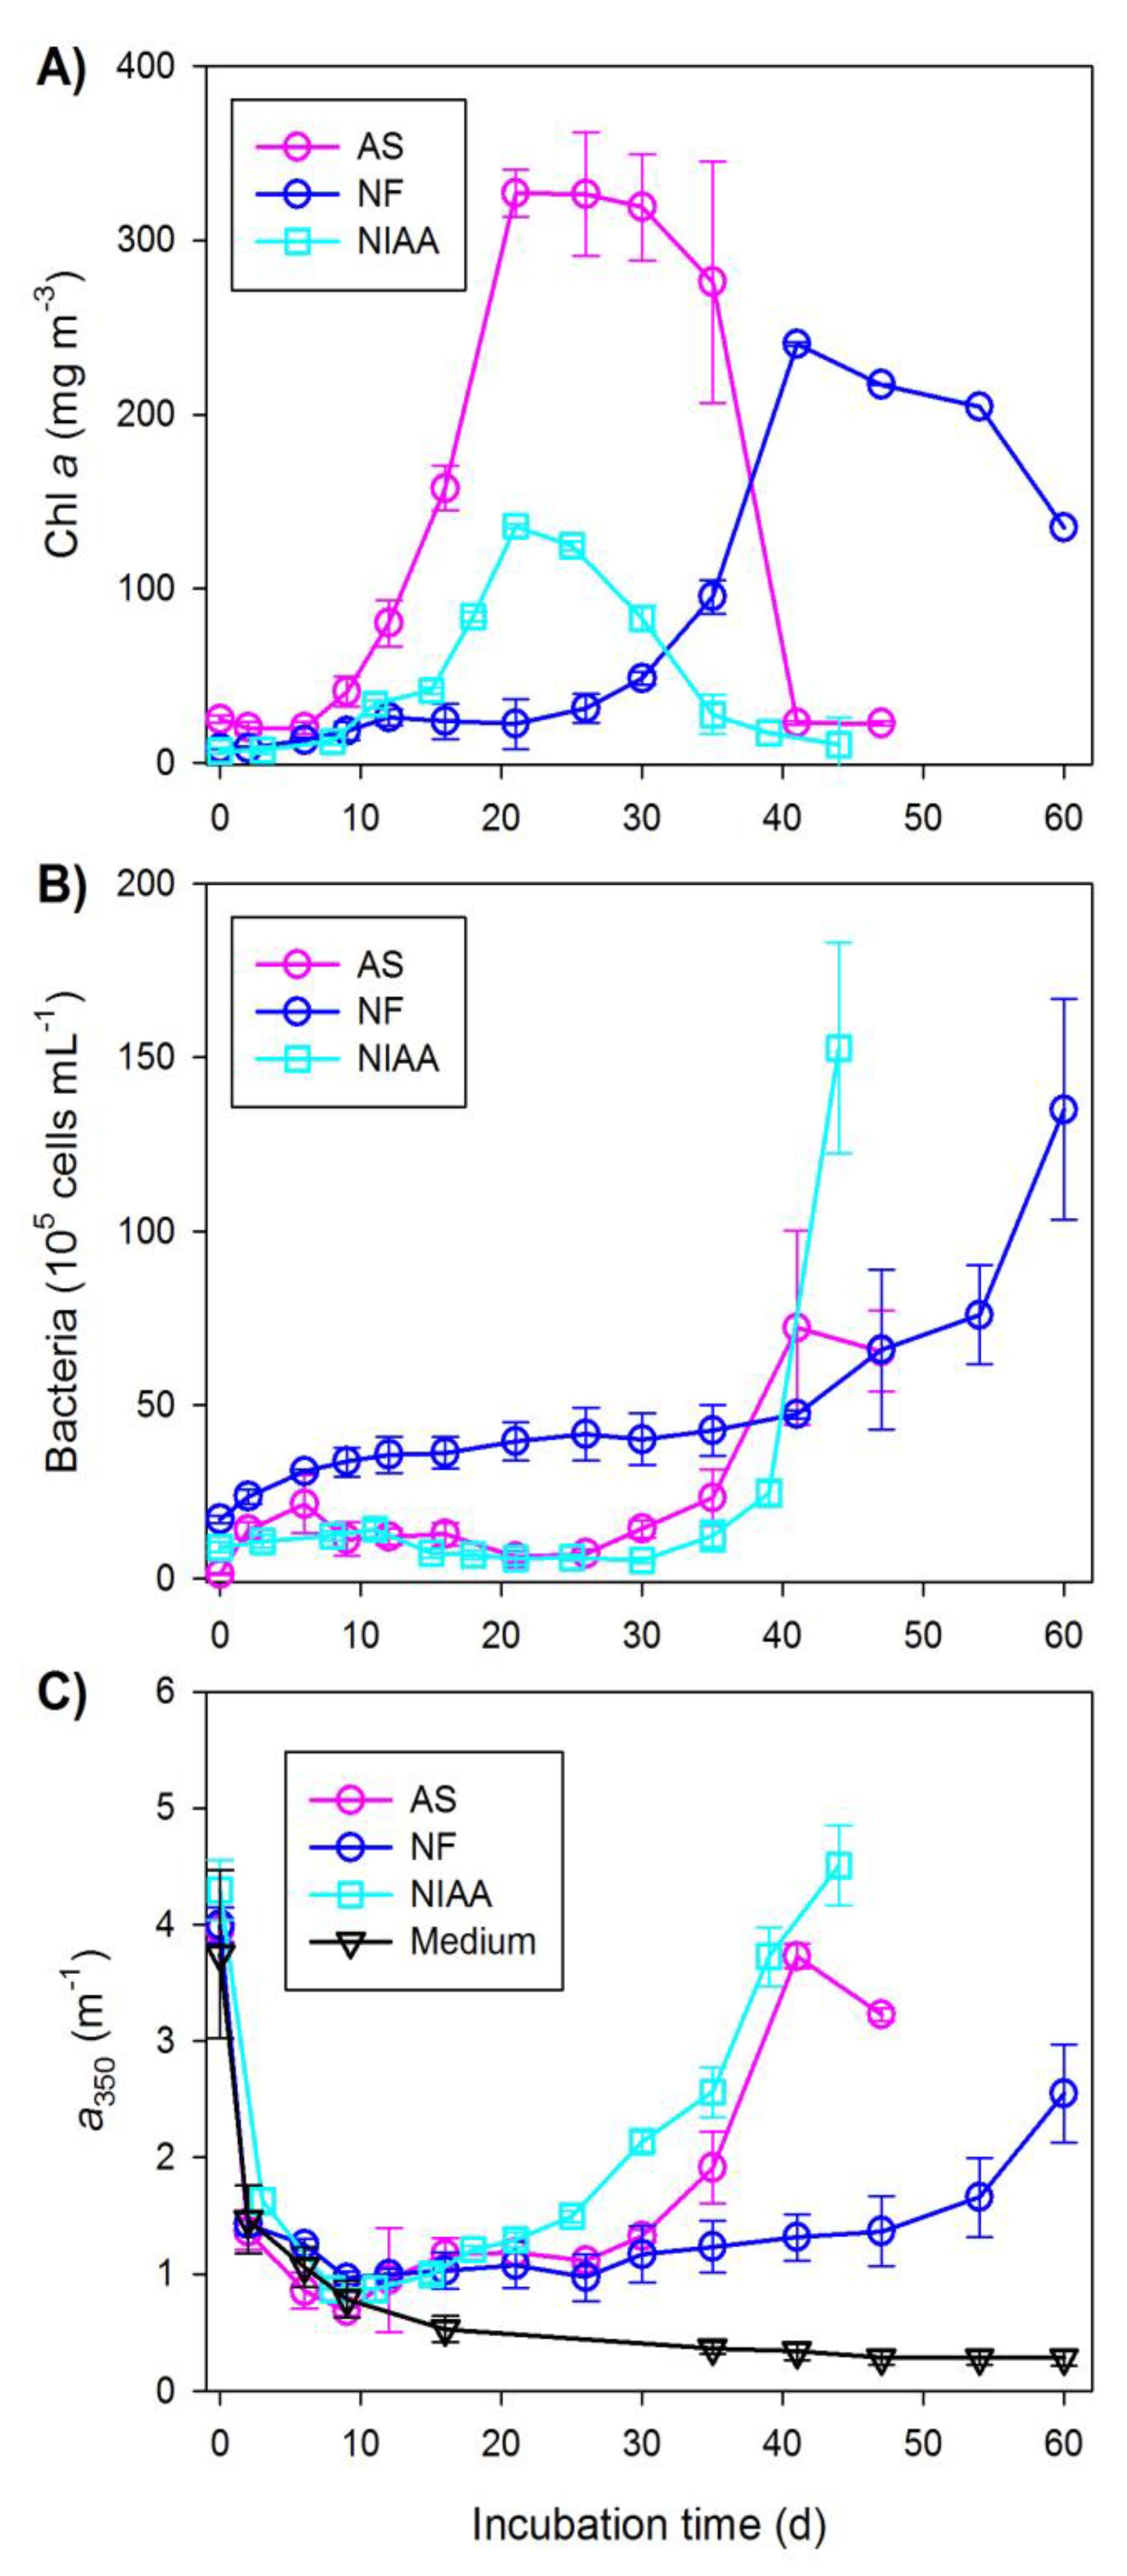
Based on the time-course evolution of chl a concentration, all three cultures sequentially experienced the following growth stages: initial lag phase, exponential phase, stationary phase, and senescent/death phase (Figure 1A). The lag phases of A. septentrionalis and NIAA were much shorter than that of N. frigida (Table 1). In contrast, the duration of the exponential phases of all three cultures were comparable. A. septentrionalis and N. frigida lived through much longer stationary phases compared to that of NIAA. Because of time constraints, the incubation of N. frigida was terminated shortly after entering senescence, leading to a far shorter senescent phase than those of A. septentrionalis and NIAA. The senescent-phase values for N. frigida reported in this study are thus not directly comparable with those of the other two cultures. Note that these growth phases are defined on chl a concentration and may differ somewhat from those conventionally established on cell abundance.
Chl a concentration during the lag phase either slightly declined (A. septentrionalis) or slowly increased (N. frigida and NIAA) with time (Figure 1A). The initial decrease in chl a concentration or the extended periods of slow growth might arise from the possibility that a large portion of the inoculated cells was not viable or that the viable parent cells needed a prolonged time for conditioning before active growth could start. Chl a concentrations differed substantially among the three cultures, with A. septentrionalis showing the highest concentrations over the first three growth phases, N. frigida the second highest, and NIAA the lowest (Table 1). Chl a concentration for the senescent phase was highest in N. frigida due to the earlier termination of the incubation noted above. Across the entire incubation period, A. septentrionalis displayed the greatest maximum chl a concentration (326.9 mg m−3), followed by N. frigida (240.5 mg m−3), and NIAA (135.9 mg m−3). In spite of the large differences in chl a concentration, the ice algae in the three cultures showed very similar chl a-based apparent specific growth rates during the exponential phases (range: 0.160–0.169 d−1) (Table 2).
Bacterial cell abundances in the triplicate cultures were more variable during the chl a senescent phase (as shown by the larger error bars in Figure 1B) than during the earlier phases. This, however, does not compromise analyzing the general temporal trends of the bacterial cell abundance. A. septentrionalis and the NIAA exhibited small fluctuations in bacterial cell abundance prior to day 26 and day 30, respectively, averaging (± SD) (10.9 ± 6.0) × 105 cells mL−1 and (8.65 ± 0.49) × 105 cells mL−1 (Figure 1B). Thereafter, the cell abundances in these two cultures entered exponential growth and reached the highest number of 72.2 × 10⁵ cells mL−1 in A. septentrionalis six days before the end of the incubation and 152.6 × 10⁵ cells mL−1 in the NIAA at the termination of the incubation. Bacterial cell abundance in N. frigida grew continually over the entire incubation period, slowly between day 0 and day 41 (mean rate: 0.74 × 10⁵ cells mL−1 d−1) and much faster (exponentially) from day 41 to the end (mean rate: 4.61 × 10⁵ cells mL−1 d−1). Bacterial multiplication occurred predominantly during the chl a senescent phase in A. septentrionalis and the NIAA but over both the stationary and senescent phases in N. frigida (Figure 1A,B, Table 1). Unlike the rather constant apparent specific growth rates of the ice algae noted above, the apparent specific growth rates of bacteria during their exponential growth phases varied considerably between the three cultures, with the rate in the NIAA being two times that in A. septentrionalis and six and half times that in N. frigida (Table 2).
3.2. Temporal Progression of CDOM
The absorption coefficient at 350 nm (a350) was adopted as an indicator of the CDOM content, given that it has been frequently used for this purpose by previous studies [26,27] and that it can avoid the interference of nitrate in the f/2 medium. Nitrate absorbs light at λ <340 nm with a peak at 310 nm [28]. The initial a350 in the medium control amounted to 3.74 m−1, which arose from the light-absorbing materials contained in the seawater and chemicals used for preparing the f/2 medium. The a350 of the original CDOM in seawater (0.20 m−1) could only account for 5.3% of the total a350 for the medium, leaving the added chemicals and the associated impurities to be the dominant light absorber.
The a350 in the medium control declined by ~80% (3.74→0.78 m−1) during the first nine days followed by a gradual decrease until reaching rather constant values (range: 0.28–0.36 m−1) from day 35 onward (Figure 1C). The initial large loss of the absorption was due to the bleaching of photochemically reactive constituents, as confirmed by a separate light-versus-dark test wherein the absorption coefficient decreased rapidly in the light but remained stable in the dark. The medium apparently contained compounds that were photobleachable by the visible and ultraviolet-A radiation, particularly by the visible which accounts for >99% of the total radiation energy (320–700 nm) emitted from the cool white fluorescent tubes used for the incubation [29]. Consistent with the medium control, all three cultures showed a fast drawdown of a350 during the first 10 days or so (Figure 1C), suggesting the occurrence of photobleaching in the cultures as well. After the initial quick decline, a350 in the NIAA (a350NIAA) increased continually to the end of incubation, while a350 in A. septentrionalis (a350AS) and N. frigida (a350NF) remained fairly constant until day 26 and then augmented with incubation time. a350AS dropped ~13% (3.73→3.23 m−1) during the last six days. The largest CDOM accumulation in all three cultures occurred during the senescent phase (Figure 2A). Similarly, the production rate of CDOM was also highest in the senescent phase (Figure 2B). The senescent-phase production rate for NIAA was ~40% higher than that for A. septentrionalis (Figure 2B).
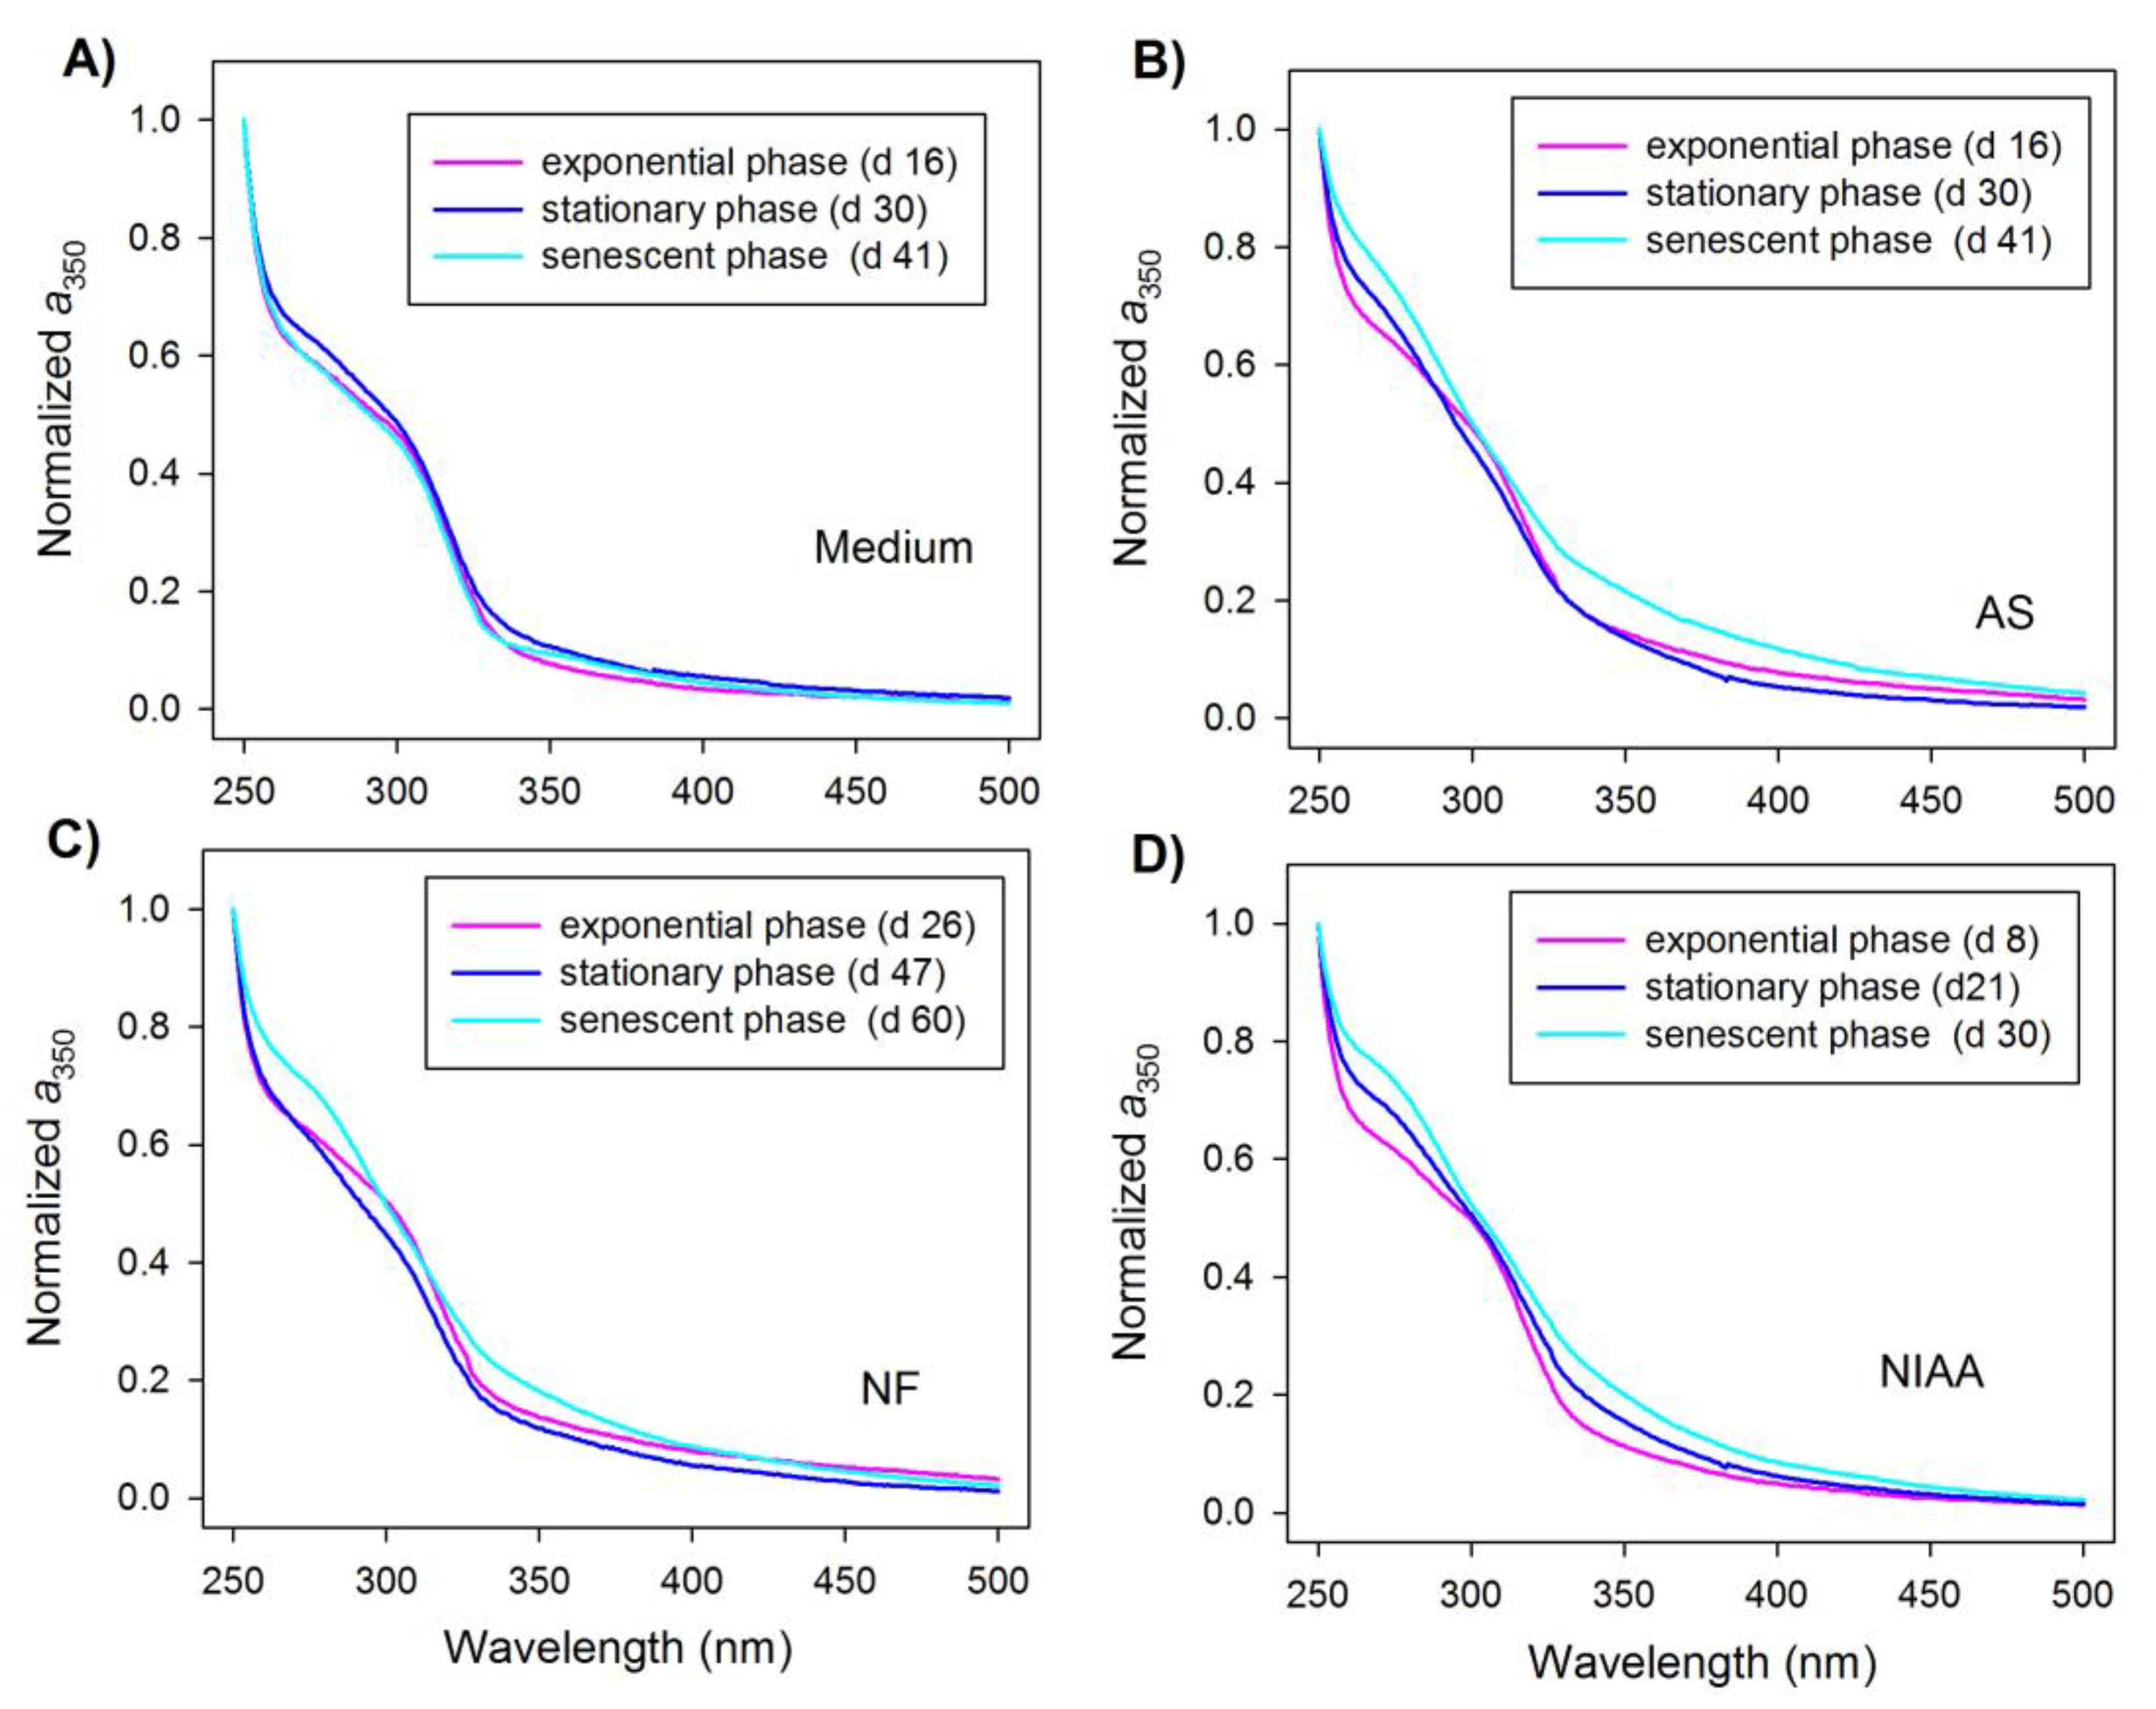
Mean absorption spectra from the exponential, stationary, and senescent phase are shown in Figure 3. To facilitate the comparison of the spectral shape, the absorption spectra were normalized to the absorption coefficient at 250 nm. The absorption spectrum of the medium control was characterized by a broad shoulder centered at 310 nm throughout the incubation period (Figure 3A) due plausibly to the presence of nitrate. In the cultures, this shoulder diminished with the progression of incubation and essentially disappeared during the senescent phase (Figure 3B) as a result of nitrate uptake by the algae, possible masking by the newly produced CDOM, or a combination of the two. Interestingly, a new shoulder spanning from 260 nm to 300 nm and centered at ~280 nm transpired and was most conspicuous during the senescent phase.
4. Discussion
4.1. Possible Mechanisms for CDOM Production
This study demonstrates that the ice algal species and NIAA tested can all produce CDOM during laboratory incubations. The accumulation of CDOM, however, lags behind the progression of chl a, a phenomenon that occurs as well in first-year drift sea ice in the western Canadian Arctic [4]. Other authors observed decoupling of CDOM and dissolved organic carbon from chl a in the Arctic and Antarctic sea ice [7,13]. Similarly, the dominant production of CDOM from marine pelagic phytoplankton in natural systems and in cultures takes place during the decay of the phytoplankton biomass [30,31,32]. Cell autolysis is a possible mechanism for CDOM production by ice algae, as the fastest generation of CDOM in the cultures occurred during the senescent phase. Bacterial and viral lysis of ice algal cells might also contribute to CDOM production in light of the non-axenic conditions of our cultures. Moreover, CDOM could be formed as a by-product of bacterial breakdown of the ice algal-derived DOM, as has been observed in pelagic phytoplankton cultures [32,33,34] and hypothesized for interpreting the dynamics of CDOM in oceanic waters [31]. A bacterial role in the formation of CDOM in our cultures is indirectly supported by the resemblance of the temporal patterns of bacterial cell abundance and a350 (Figure 1B,C). In fact, a350 showed a strong linear correlation with bacterial abundance in the cultures of A. septentrionalis (r = 0.987) and N. frigida (r = 0.984) after day 12 when most of the light-absorbing substances originally present in the medium were photochemically bleached (Section 3.2). Rochelle-Newall and Fisher [32] argued that phytoplankton is not a direct source of fluorescent DOM (FDOM, a part of CDOM) but that microbes using non-fluorescent organic matter derived from phytoplankton produce FDOM. A later study, however, revealed that phytoplankton can directly exude FDOM [35]. Further studies are needed to elucidate the relative importance of the direct and indirect (i.e., bacterial-mediated) production of CDOM from ice algae.
The NIAA displayed a substantially higher CDOM production rate than did A. septentrionalis during the senescent phase. Given that the peak chl a concentration reached in A. septentrionalis was more than two times higher than in the NIAA and that the dominant algal species in the NIAA was N. frigida (Section 2.1), N. frigida appeared to be a more efficient CDOM producer than A. septentrionalis. In addition, the presence of smaller grazers (<20 μm) in the NIAA might also have enhanced CDOM production [12]. The simultaneous decreases of a350 and bacterial cell abundance in A. septentrionalis during the last six days imply that the organic matter pool which bacteria could use and convert to CDOM started to decline. The bacterial cell abundances in N. frigida for all four growth phases were considerably higher than those in the NIAA and A. septentrionalis. This might in part explain the lowest CDOM accumulation observed in N. frigida. Because of the potential microbial CDOM degradation, the production rates reported in this study are net, instead of gross, rates.
4.2. Production of Short-UV Absorbing Chromophores
The short-UV absorption shoulders (centered at ~280 nm) formed during the culture incubations indicate the formation of new chromophores that were absent in the medium control. Similar absorption bulges have been observed in water samples collected from the Pacific [36] and the Gulf of St. Lawrence [37]; they have also been spotted in sea-ice meltwater from the Arctic [4,5,6] and the Antarctic [13]. The chemical identity of these new chromophores is unclear but has been linked to biogenic, protein-like molecules [7,13,35]. The present study demonstrates that these compounds are biogenic and can be produced by ice algae, corroborating the results of previous field studies. However, it remains unknown whether ice algae produce these compounds through cellular release or by microbial reworking of the algal detritus. Furthermore, their physiological and ecological roles have yet to be deciphered. Evidently, these compounds unlikely act as UV photoprotectants, since their absorption band is beyond the solar UV spectrum (290–400 nm) at the earth’s surface. They may, nevertheless, be involved in organic matter cycling, given their high photochemical susceptibility to solar UV radiation [4].
4.3. Implications for CDOM Production in Sea Ice
To evaluate the potential significance of ice algal-derived CDOM to the CDOM stock in Arctic sea ice, we compared the chl a-normalized CDOM production rates obtained from this study with those from a previous field survey. It must be noted that such a comparison is somewhat speculative because of the different ice algal growth conditions in the laboratory cultures and the field (see below). The chl a-normalized CDOM production rates in the cultures were calculated by dividing the maximum increase in a350 over the entire incubation period by the highest chl a concentration attained and the number of days required for a350 to increase from the minimum to maximum. This calculation assumes that the production of CDOM, which predominantly occurred during the senescent phase, was proportional to the peak algal biomass reached during the growth phases. The results are 0.29 m2 g−1 d−1 for A. septentrionalis, 0.13 m2 g−1 d−1 for N. frigida, and 0.81 m2 g−1 d−1 for the NIAA, with the NIAA showing the highest rate followed by A. septentrionalis and N. frigida. Using a similar approach, the field chl a-normalized CDOM production rates were estimated from the time-course data reported previously for the bottom 10-cm layer of sea ice in the western Canadian Arctic [4]. Chl a concentration increased from ~12 mg m−3 in mid-March to the peak value of 395 mg m−3 in early May in the drift sea ice and 1572 mg m−3 in mid-May in the land-fast sea ice, while the maximum accumulation of a350 was 8.74 m−1 in the drift sea ice and 14.8 m−1 in the land-fast sea ice over the corresponding periods. The resulting chl a-normalized CDOM production rate is 0.48 m2 g−1 d−1 for the drift sea ice and 0.16 m2 g−1 d−1 for the land-fast sea ice, which are of the same order of magnitude as those for the cultures (0.13–0.81 m2 g−1 d−1). Notably, the ice algal growth conditions in the cultures differed substantially from those in the field. Ice algae in the field, mostly living in brine channels and pockets, were exposed to varying temperatures, salinities, and incident irradiances, in contrast to the stable values kept for the incubations (Section 2.1). Moreover, before the melt period, bottom ice temperature (~−2 °C) and brine salinity (50–80) [21,38,39,40] are, respectively, considerably lower and higher than those of the cultures (temperature: 4 °C; salinity: 34.5). The similar CDOM production rates from the cultures and the field thus suggest that the large differences in the algal growth conditions did not affect the production of CDOM to large extents. Concomitantly, peak chl a concentrations in the cultures and drift sea ice agreed within a factor of three. The delay of bacterial growth relative to ice algae in the cultures is consistent with field observations in Arctic sea ice showing an increase in bacterial cell abundance after ice algal blooms [37,41]. The apparent specific growth rates of ice algae observed in the cultures (0.160–0.169 d−1) are comparable to that (0.124 d−1) estimated from the winter–spring chl a data reported for bottom sea-ice in Franklin Bay in western Canadian Arctic under low snow cover [42]. Similarly, the apparent specific growth rates of bacteria obtained for the cultures (0.052–0.34 d−1) are also close to those determined for Arctic (≤0.2 d−1) [43] and Antarctic bottom sea ice (0.06–0.2 d−1) [44]. However, caution should be exercised in interpreting the implications of the apparent consistency between the laboratory and field results due to potentially large uncertainties in the estimated CDOM production rates. The rate for the land-fast sea ice could be an underestimate owing to the start of sea ice melting in mid-May [39]. Ice melting leads to brine drainage [45] and thus a loss of solutes, including CDOM, from bottom sea ice where ice algae reside. The peak a350 observed could, therefore, be skewed downward. On the other hand, the chl a-normalized CDOM production rates for N. frigida and the NIAA could be underestimated as well, since their incubations were terminated before a350 had reached a plateau or started decaying (Figure 1A,C); this is particularly true for N. frigida (Section 3.1). Besides, the mean bacterial cell abundance in the cultures, 47.5 × 10⁵ cells mL−1 in N. frigida and ~22 × 105 cells mL−1 in A. septentrionalis and the NIAA, are four to eight times higher than the maximum abundance observed in the bottom ice (range: 0.7 to 5.7 × 10⁵ cells mL−1) [38] and at the ice water-interface (range: 4.3 to 5.5 × 10⁵ cells mL−1) [46] in the Canadian Arctic. The larger bacterial abundances could lead to an enhanced or reduced CDOM accumulation in these cultures depending on the balance between bacterial production and degradation of CDOM. Finally, the absence (A. septentrionalis and N. frigida) or reduced abundance (NIAA) of grazers in the cultures could also affect the accumulation of CDOM, since grazers are likely involved in the cycling of dissolved organic matter [12].
5. Conclusions
The three ice algal cultures tested in this study displayed apparent specific growth rates of algal and bacterial cells comparable to those in the field. All three cultures produced CDOM with new short UV-absorbing chromophores. The senescent phase exhibited the largest net accumulation and production rate. The N. frigida-dominated NIAA was more efficient at producing CDOM than the monoculture of A. septentrionalis. The cultures produced CDOM at rates comparable to those observed in the bottommost layer of first-year Arctic sea ice, suggesting that ice algae are the main source of CDOM accumulated in Arctic sea ice during spring. This study improves our understanding of CDOM cycling in polar sea ice. Future surveys should examine more ice algal species and further elucidate the mechanisms responsible for the formation of ice algal-derived CDOM (e.g., autolysis vs. bacterial-mediated release).
Author Contributions
H.X. conceived the project. G.L. and G.S. designed the experiments with input from all co-authors. G.L. carried out the experiments. H.X. wrote the paper with the contribution from all co-authors.
Funding
This research was funded by the Natural Sciences and Engineering Research Council of Canada (grant number 250966-2012) and the Ministry of Science and Technology of China (grant number 2013CB956601). G.L. was supported by a short-term research scholarship awarded by the Quebec Government’s Merit Scholarships Program for Foreign Students. G.S. was supported by graduate scholarships from the Institut des sciences de la mer de Rimouski (ISMER) and Fonds de recherche du Québec−Nature et technologies (FRQNT). This is a contribution to the research programs of ISMER and Quebec–Ocean.
Acknowledgments
C. Lovejoy and A.R. Juhl provided the parent cultures of A. septentrionalis and N. frigida, respectively. C. Belzile analyzed the bacterial cell abundance. S. Lessard identified the algae from the NIAA sample. Comments from two anonymous reviewers improved the manuscript.
Conflicts of Interest
The authors declare no conflict of interest. The funders had no role in the design of the study, in the collection, analyses, and interpretation of data, in the writing of the manuscript, and in the decision to publish the results.
References
- Belzile, C.; Johannessen, S.C.; Gosselin, M.; Demers, S.; Miller, W.L. Ultraviolet attenuation by dissolved and particulate constituents of first-year ice during late spring in an Arctic polynya. Limnol. Oceanogr. 2000, 45, 1265–1273. [Google Scholar] [CrossRef] [Green Version]
- Scully, N.M.; Miller, W.L. Spatial and temporal dynamics of colored dissolved organic matter in the North Water polynya. Geophys. Res. Lett. 2000, 27, 1009–1011. [Google Scholar] [CrossRef]
- Xie, H.; Gosselin, M. Photoproduction of carbon monoxide in first-year sea ice in Franklin Bay, southeastern Beaufort Sea. Geophys. Res. Lett. 2005, 32, L12606. [Google Scholar] [CrossRef]
- Xie, H.; Aubry, C.; Zhang, Y.; Song, G. Chromophoric dissolved organic matter (CDOM) in first-year sea ice in the western Canadian Arctic. Mar. Chem. 2014, 165C, 25–35. [Google Scholar] [CrossRef]
- Hill, V.J.; Zimmerman, R.C. Characteristics of colored dissolved organic material in first year landfast sea ice and the underlying water column in the Canadian Arctic in the early spring. Mar. Chem. 2016, 180, 1–13. [Google Scholar] [CrossRef] [Green Version]
- Kowalczuk, P.; Meler, J.; Kauko, H.M.; Pavlov, A.K.; Zabłocka, M.; Peeken, I.; Dybwad, C.; Castellani, G.; Granskog, M.A. Bio-optical properties of Arctic drift ice and surface waters north of Svalbard from winter to spring. J. Geophys. Res. Oceans 2017, 122, 4634–4660. [Google Scholar] [CrossRef]
- Brogi, S.R.; Ha, S.Y.; Kim, K.; Derrien, M.; Lee, Y.K.; Hur, J. Optical and molecular characterization of dissolved organic matter (DOM) in the Arctic ice core and the underlying seawater (Cambridge Bay, Canada): Implication for increased autochthonous DOM during ice melting. Sci. Total Environ. 2018, 627, 802–811. [Google Scholar] [CrossRef]
- Perovich, D.K.; Roesler, C.S.; Pegau, W.S. Variability in Arctic sea ice optical properties. J. Geophys. Res. Oceans 1998, 103, 1193–1208. [Google Scholar] [CrossRef] [Green Version]
- Hill, V.J. Impacts of chromophoric dissolved organic material on surface ocean heating in the Chukchi Sea. J. Geophys. Res. 2008, 113, C07024. [Google Scholar] [CrossRef]
- Uusikivi, J.; Vähätalo, A.V.; Granskog, M.A.; Sommaruga, R. Contribution of mycosporine-like amino acids and colored dissolved and particulate matter to sea ice optical properties and ultraviolet attenuation. Limnol. Oceanogr. 2010, 55, 703–713. [Google Scholar] [CrossRef] [PubMed] [Green Version]
- Granskog, M.A.; Kaartokallio, H.; Kuosa, H. Sea ice in non-polar regions. In Sea Ice; Thomas, D.N., Dieckmann, G.S., Eds.; Blackwell Science: Oxford, UK, 2009; pp. 531–577. [Google Scholar]
- Thomas, D.N.; Papadimitriou, S.; Michel, C. Biogeochemistry of sea ice. In Sea Ice; Thomas, D.N., Dieckmann, G.S., Eds.; Blackwell Science: Oxford, UK, 2009; pp. 425–467. [Google Scholar]
- Norman, L.; Thomas, D.N.; Stedmon, C.A.; Granskog, M.A.; Papadimitriou, S.; Krapp, R.H.; Meiners, K.M.; Lannuzel, D.; van der Merwe, P.; Dieckmann, G.S. The characteristics of dissolved organic matter (DOM) and chromophoric dissolved organic matter (CDOM) in Antarctic sea ice. Deep Sea Res. Part II 2011, 58, 1075–1091. [Google Scholar] [CrossRef] [Green Version]
- Giannelli, V.; Thomas, D.N.; Haas, C.; Kattner, G.; Kennedy, H.; Dieckmann, G.S. Behaviour of dissolved organic matter and inorganic nutrients during experimental sea-ice formation. Ann. Glaciol. 2001, 33, 317–321. [Google Scholar] [CrossRef] [Green Version]
- Thomas, D.N.; Lara, R.J.; Eicken, H.; Kattner, G.; Skoog, A. Dissolved organic matter in Arctic multi-year sea ice during winter: Major components and relationship to ice characteristics. Polar Biol. 1995, 15, 477–483. [Google Scholar] [CrossRef]
- Thomas, D.N.; Kattner, G.; Engbrodt, R.; Giannelli, V.; Kennedy, H.; Haas, C.; Dieckmann, G.S. Dissolved organic matter in Antarctic sea ice. Ann. Glaciol. 2001, 33, 297–303. [Google Scholar] [CrossRef] [Green Version]
- Michel, C.; Nielsen, T.G.; Nozais, C.; Gosselin, M. Significance of sedimentation and grazing by ice micro-and meiofauna for carbon cycling in annual sea ice (northern Baffin Bay). Aquat. Microb. Ecol. 2002, 30, 57–68. [Google Scholar] [CrossRef]
- Poulin, M.; Daugbjerg, N.; Gradinger, R.; Ilyash, L.; Ratkova, T.; von Quillfeldt, C. The pan-Arctic biodiversity of marine pelagic and sea–ice unicellular eukaryotes: A first-attempt assessment. Mar. Biodivers. 2011, 41, 13–28. [Google Scholar] [CrossRef]
- Von Quillfeldt, C.H.; Ambrose, W.G.; Clough, L.M. High number of diatom species in first-year ice from the Chukchi Sea. Polar Biol. 2003, 26, 806–818. [Google Scholar] [CrossRef]
- Juhl, A.R.; Krembs, C. Effects of snow removal and algal photoacclimation on growth and export of ice algae. Polar Biol. 2010, 33, 1057–1065. [Google Scholar] [CrossRef]
- Galindo, V.; Levasseur, M.; Mundy, C.J.; Gosselin, M.; Tremblay, J.-É.; Scarratt, M.; Gratton, Y.; Papakiriakou, T.; Poulin, M.; Lizotte, M. Biological and physical processes influencing sea ice, under-ice algae, and dimethylsulfoniopropionate during spring in the Canadian Arctic Archipelago. J. Geophys. Res. Oceans 2014, 119, 3746–3766. [Google Scholar] [CrossRef] [Green Version]
- Babin, M.; Stramski, D.; Ferrari, G.M.; Claustre, H.; Bricaud, A.; Obolensky, G.; Hoepffner, N. Variations in the light absorption coefficients of phytoplankton, nonalgal particles, and dissolved organic matter in coastal waters around Europe. J. Geophys. Res. Oceans 2003, 108, 3211. [Google Scholar] [CrossRef]
- Parsons, T.R.; Maita, Y.; Lalli, C.M. A Manual of Chemical and Biological Methods for Seawater Analysis; Pergamon: New York, NY, USA, 1984; pp. 107–110. [Google Scholar]
- Holm-Hansen, O.; Lorenzen, C.J.; Holmes, R.W.; Strickland, J.D. Fluorometric determination of chlorophyll. J. Cons. Cons. Int. Explor. Mer. 1965, 30, 3–15. [Google Scholar] [CrossRef]
- Belzile, C.; Brugel, S.; Nozais, C.; Gratton, Y.; Demers, S. Variations of the abundance and nucleic acid content of heterotrophic bacteria in Beaufort Shelf waters during winter and spring. J. Mar. Syst. 2008, 74, 946–956. [Google Scholar] [CrossRef]
- Miller, W.L.; Zepp, R.G. Photochemical production of dissolved inorganic carbon from terrestrial organic matter: Significance to the oceanic organic carbon cycle. Geophys. Res. Lett. 1995, 22, 417–420. [Google Scholar] [CrossRef]
- Osburn, C.L.; O’Sullivan, D.W.; Boyd, T.J. Increases in the longwave photobleaching of chromophoric dissolved organic matter in coastal waters. Limnol. Oceanogr. 2009, 54, 145–159. [Google Scholar] [CrossRef] [Green Version]
- Mack, J.; Bolton, J.R. Photochemistry of nitrite and nitrate in aqueous solution: A review. J. Photochem. Photobiol. A Chem. 1999, 128, 1–13. [Google Scholar] [CrossRef]
- Xie, H.; Scarratt, M.G.; Moore, R.M. Carbon disulphide production in laboratory cultures of marine phytoplankton. Atmos. Environ. 1999, 33, 3445–3453. [Google Scholar] [CrossRef]
- Carder, K.L.; Steward, R.G.; Harvey, G.R.; Ortner, P.B. Marine humic and fulvic acids: Their effects on remote sensing of ocean chlorophyll. Limnol. Oceanogr. 1989, 34, 68–81. [Google Scholar] [CrossRef] [Green Version]
- Nelson, N.B.; Siegel, D.A.; Michaels, A.F. Seasonal dynamics of colored dissolved material in the Sargasso Sea. Deep Sea Res. Part I 1998, 45, 931–957. [Google Scholar] [CrossRef]
- Rochelle-Newall, E.J.; Fisher, T.R. Production of chromophoric dissolved organic matter fluorescence in marine and estuarine environments: An investigation into the role of phytoplankton. Mar. Chem. 2002, 77, 7–21. [Google Scholar] [CrossRef]
- Zhang, Y.; van Dijk, M.A.; Liu, M.; Zhu, G.; Qin, B. The contribution of phytoplankton degradation to chromophoric dissolved organic matter (CDOM) in eutrophic shallow lakes: Field and experimental evidence. Water Res. 2009, 43, 4685–4697. [Google Scholar] [CrossRef]
- Romera-Castillo, C.; Sarmento, H.; Alvarez-Salgado, X.A.; Gasol, J.M.; Marrasé, C. Net production and consumption of fluorescent colored dissolved organic matter by natural bacterial assemblages growing on marine phytoplankton exudates. Appl. Environ. Microbiol. 2011, 77, 7490–7498. [Google Scholar] [CrossRef] [PubMed]
- Romera-Castillo, C.; Sarmento, H.; Alvarez-Salgado, X.A.; Gasol, J.M.; Marraséa, C. Production of chromophoric dissolved organic matter by marine phytoplankton. Limnol. Oceanogr. 2010, 55, 446–454. [Google Scholar] [CrossRef]
- Yamashita, Y.; Tanoue, E. Basin scale distribution of chromophoric dissolved organic matter in the Pacific Ocean. Limnol. Oceanogr. 2009, 54, 598–609. [Google Scholar] [CrossRef] [Green Version]
- Xie, H.; Aubry, C.; Bélanger, S.; Song, G. The dynamics of absorption coefficients of CDOM and particles in the St. Lawrence estuarine system: Biogeochemical and physical implications. Mar. Chem. 2012, 128, 44–56. [Google Scholar] [CrossRef]
- Nguyen, D.; Maranger, R. Respiration and bacterial carbon dynamics in Arctic sea ice. Polar Biol. 2011, 34, 1843–1855. [Google Scholar] [CrossRef]
- Song, G.; Xie, H.; Aubry, C.; Zhang, Y.; Gosselin, M.; Mundy, C.J.; Philippe, B.; Papakyriakou, T.N. Spatiotemporal variations of dissolved organic carbon and carbon monoxide in first-year sea ice in the western Canadian Arctic. J. Geophys. Res. Oceans 2011, 116, C00G05. [Google Scholar] [CrossRef]
- Not, C.; Brown, K.; Ghaleb, B.; Hillaire-Marcel, C. Conservative behavior of uranium vs. salinity in Arctic sea ice and brine. Mar. Chem. 2012, 130, 33–39. [Google Scholar] [CrossRef]
- Riedel, A.; Michel, C.; Gosselin, M.; LeBlanc, B. Winter–spring dynamics in sea-ice carbon cycling in the coastal Arctic Ocean. J. Mar. Syst. 2008, 74, 918–932. [Google Scholar] [CrossRef]
- Rózańska, M.; Gosselin, M.; Poulin, M.; Wiktor, J.M.; Michel, C. Influence of environmental factors on the development of bottom ice protist communities during the winter–spring transition. Mar. Ecol. Prog. Ser. 2009, 386, 43–59. [Google Scholar] [CrossRef] [Green Version]
- Bunch, J.N.; Harland, R.C. Bacterial production in the bottom surface of sea ice in the Canadian Sub-Arctic. Can. J. Fish. Aquat. Sci. 1990, 47, 1986–1995. [Google Scholar] [CrossRef]
- Kottmeier, S.T.; Sullivan, C.W. Late winter primary production and bacterial production in sea ice and seawater west of the Antarctic Peninsula. Mar. Ecol. Prog. Ser. 1987, 36, 287–298. [Google Scholar] [CrossRef]
- Tison, J.L.; Worby, A.; Delille, B.; Brabant, F.; Papadimitriou, S.; Thomas, D.; De Jong, J.; Lannuzel, D.; Haas, C. Temporal evolution of decaying summer first-year sea ice in the Western Weddell Sea, Antarctica. Deep Sea Res. Part II 2008, 55, 975–987. [Google Scholar] [CrossRef] [Green Version]
- Galindo, V.; Levasseur, M.; Scarratt, M.; Mundy, C.J.; Gosselin, M.; Kiene, R.P.; Gourdal, M.; Lizotte, M. Under-ice microbial dimethylsulfoniopropionate metabolism during the melt period in the Canadian Arctic Archipelago. Mar. Ecol. Prog. Ser. 2015, 524, 39–53. [Google Scholar] [CrossRef] [Green Version]
Figure 1.
Temporal progressions of chlorophyll a concentration (A), bacterial cell abundance (B), and the absorption coefficient at 350 nm (a proxy of the abundance of chromophoric dissolved organic matter) (C) in the ice algal cultures and medium control. AS stands for Attheya septentrionalis, NF for Nitzschia frigida, and NIAA for natural ice algae assemblage. Error bars are one standard deviation of the triplicate cultures.

Figure 2.
Net accumulation (A) and net production rate (B) of CDOM during different growth phases of the ice algal cultures. AS stands for Attheya septentrionalis, NF for Nitzschia frigida, and NIAA for natural ice algae assemblage. The absorption coefficient at 350 nm is used as a proxy of CDOM abundance. Error bars are one standard deviation of the triplicate cultures. Note that the senescent-phase values for N. frigida are not directly comparable with those of the other two cultures due to the early termination of the incubation of N. frigida.

Figure 3.
Evolution of the mean absorption spectrum of triplicate cultures over three different growth phases in the medium control (A) and the cultures (B–D). The spectra were normalized to the absorption coefficient at 250 nm. AS stands for Attheya septentrionalis, NF for Nitzschia frigida, and NIAA for natural ice algae assemblage.


Table 1.
Duration and day range of each growth phase of the algal cultures examined, along with the corresponding mean chlorophyll a concentration and mean bacterial cell abundance (BCA).
Table 1.
Duration and day range of each growth phase of the algal cultures examined, along with the corresponding mean chlorophyll a concentration and mean bacterial cell abundance (BCA).
| Growth Phase | Duration (Day Range) (d) | Chl a (mg m−3) | BCA (105 cells mL−1) |
|---|---|---|---|
| A. Septentrionalis | |||
| Lag | 6 (0–6) | 21.8 | 12.3 |
| Exponential | 15 (6–21) | 125.2 | 12.9 |
| Stationary | 14 (21–35) | 312.1 | 12.8 |
| Senescent | 12 (35–47) | 107.3 | 53.7 |
| N. Frigida | |||
| Lag | 26 (0–26) | 19.0 | 34.5 |
| Exponential | 15 (26–41) | 104.0 | 42.9 |
| Stationary | 13 (41–54) | 220.7 | 63.0 |
| Senescent | 6 (54–60) 1 | 169.8 1 | 75.9 1 |
| Natural Ice Algal Assemblage (NIAA) | |||
| Lag | 8 (0–8) | 8.95 | 10.7 |
| Exponential | 13 (8–21) | 61.5 | 9.33 |
| Stationary | 4 (21–25) | 130.3 | 5.93 |
| Senescent | 19 (25–44) | 52.6 | 40.2 |
1 These senescent-phase values are not directly comparable with those of A. septentrionalis and NIAA due to the early termination of the incubation of N. frigida.
Table 2.
Apparent specific growth rates (μ) of ice algae and heterotrophic bacteria derived from a non-linear fitting of data obtained from the exponential growth phases of ice algae and bacteria (see Figure 1A,B).
Table 2.
Apparent specific growth rates (μ) of ice algae and heterotrophic bacteria derived from a non-linear fitting of data obtained from the exponential growth phases of ice algae and bacteria (see Figure 1A,B).
| Ice Algae 1 | Bacteria 2 | |||||
|---|---|---|---|---|---|---|
| Culture | μ ± SE (d−1) | R2 | p | μ ± SE (d−1) | R2 | p |
| AS | 0.160 ± 0.008 | 0.996 | 0.0001 | 0.166 ± 0.015 | 0.992 | 0.004 |
| NF | 0.166 ± 0.015 | 0.992 | 0.004 | 0.052 ± 0.010 | 0.924 | 0.01 |
| NIAA | 0.169 ± 0.016 | 0.985 | 0.0008 | 0.342 ± 0.035 | 0.996 | 0.002 |
1 The day ranges for the exponential growth phase of the ice algae can be found in Table 1. 2 The day range for the exponential growth phase of bacteria was 26–41 for Attheya septentrionalis (AS), 41–60 for Nitzschia frigida (NF), and 30–44 for the natural ice algae assemblage (NIAA).
© 2019 by the authors. Licensee MDPI, Basel, Switzerland. This article is an open access article distributed under the terms and conditions of the Creative Commons Attribution (CC BY) license (http://creativecommons.org/licenses/by/4.0/).
Share and Cite
MDPI and ACS Style
Li, G.; Xie, H.; Song, G.; Gosselin, M. Production of Chromophoric Dissolved Organic Matter (CDOM) in Laboratory Cultures of Arctic Sea Ice Algae. Water 2019, 11, 926. https://doi.org/10.3390/w11050926
AMA Style
Li G, Xie H, Song G, Gosselin M. Production of Chromophoric Dissolved Organic Matter (CDOM) in Laboratory Cultures of Arctic Sea Ice Algae. Water. 2019; 11(5):926. https://doi.org/10.3390/w11050926
Chicago/Turabian StyleLi, Guiju, Huixiang Xie, Guisheng Song, and Michel Gosselin. 2019. "Production of Chromophoric Dissolved Organic Matter (CDOM) in Laboratory Cultures of Arctic Sea Ice Algae" Water 11, no. 5: 926. https://doi.org/10.3390/w11050926
Note that from the first issue of 2016, this journal uses article numbers instead of page numbers. See further details here.