Investigation of Low- and High-Flow Characteristics of Karst Catchments under Climate Change


1
Faculty of Civil and Geodetic Engineering, University of Ljubljana, Jamova 2, 1000 Ljubljana, Slovenia
2
Slovenian Environment Agency, Vojkova 1b, 1000 Ljubljana, Slovenia
*
Author to whom correspondence should be addressed.
Water 2019, 11(5), 925; https://doi.org/10.3390/w11050925
Submission received: 17 April 2019
/
Revised: 26 April 2019
/
Accepted: 28 April 2019
/
Published: 1 May 2019
(This article belongs to the Special Issue Hydrology of Rivers and Lakes under Climate Change)
Abstract
:It is not clear how projected climate change will impact the hydrological functioning of complex catchments that have significant karst characteristics. Therefore, in this paper we focused on the investigation of the low- and high-flow characteristics of the karst Ljubljanica River catchment. One smaller (51 km2) and one larger (1135 km2) catchment were selected in order to investigate the projected climate change impact on the hydrological conditions. For the investigation of the hydrological situation in the future, we used a lumped conceptual hydrological model. The model was calibrated using past measured daily data. Using the calibrated model, we investigated the impact of five different climate models outputs for the moderately optimistic scenario (RCP4.5). We investigated the situation in next 30-years periods: 2011–2040, 2041–2070, and 2071–2100. Several low and high-flow indices were calculated and compared. The results indicate that a summer precipitation decrease (i.e., 2011–2070) could lead to lower low-flow values for the investigated areas, which could increase the vulnerability of karst areas. Thus, additional focus should be given to water resource management in karst areas. On the other hand, mean flow could increase in the future. The same also applies for the high-flows where flood frequency analysis results indicate that a climate adaptation factor could be used for the hydrotechnical engineering design. However, differences among investigated models are large and show large variability among investigated cases.
1. Introduction
A temperature increase, related to climate changes in the future, is expected to influence the runoff dynamics in different parts of the world [1]. However, it is not clear if this increase will have a positive or negative impact on different elements of the hydrological cycle around the world. More specifically, additional analysis and modelling should be carried out in order to investigate effects of the abovementioned changes on low- and high-flow dynamics of rivers at different catchment scales. This kind of investigation is especially important in karst systems because the vulnerability of these systems is large and a potential change in the low-flow dynamics can have significant impact on the groundwater characteristics in karst areas [2]. This can affect, among others, the water supply and ecological functioning of karst rivers.
Different approaches can be used to quantify change in an environmental process. One of the most frequently used methods to detect changes in environmental series is to perform statistical tests [1,3,4,5,6,7]. By using different methods, one can test if the investigated sample exhibits a positive or negative trend with the selected significance level. Based on the detected trend results, one can estimate potential future behavior. Some recent studies investigated flood dynamics in Europe over the last 50 years [1,8]. For example, Hall et al. [8] were not able to detect a clear positive or negative trend in flood magnitudes around Europe. Similar conclusions were also made by some other studies that focused on smaller areas in Europe [4,6,7] and by a study that reviewed trend analyses of extreme precipitation and floods in Europe [5]. Furthermore, Do et al. [9], who analyzed trends in the annual maximum streamflow at a global scale, were not able to find a clear pattern and more trends were decreasing than increasing. On the other hand, Blöschl et al. [1] found a clear climate signal when investigating the timing of floods in Europe.
An alternative approach for the estimation of potential changes in the future is the use of climate change projections. When using this approach, one should link several models in order to estimate the potential impact of future changes on the runoff dynamics [5]. The bases are the global circulation models (GCMs) with the Intergovernmental Panel on Climate Change (IPCC) Special Report on Emission Scenarios (SRES) scenarios [10] and the representative concentration pathways (RCP) [5,11]. The GCMs’ outputs should be downscaled and bias corrected (BC) before they can potentially be used as an input to the hydrological models [5]. A recent review of studies that used climate change projections to evaluate impact on the hydrological conditions during extreme events (i.e., floods) indicated that changes will be negative and positive and no consistent results can be detected [5]. This conclusion is somewhat consistent with findings made based on the trend analyses of extreme events. While some studies investigating future climate situations are focusing on floods and high-flows [12,13,14,15,16], other studies can be found that are oriented on the mean [17] and low-flow dynamics [18]. Despite the fact that it is estimated that karst covers about 25% of the Earth’s surface [19] and about the same percentage of the world’s population depends on freshwater from karst sources [20], a small number of studies have focused on the future low-flow dynamics of karst areas [21]. For example, Pellicer-Martínez and Martínez-Paz [22] investigated climate change impacts on the water management of a catchment where karst aquifers are present, where they found potential large impact of the projected climate change. As pointed out by Hartmann et al. [21], the reason for the lack of studies about the impact of future climate change on karst water resources is the limitations of the available karst hydrological models and in data availability as well as in their information content. In some countries, the percentage of the population that depends on a drinking water supply from karst sources is much higher than the average of the selected EU countries (for example, in Slovenia and Austria, it is approximately 50%) [23]. Therefore, special emphasis should be given to these areas in order to study water resource availability in the future in relation to climate change projections.
For the characterization of both low- and high-flows, various indices have been developed in the past. For example, in order to investigate high-flow characteristics, researchers often focus on the so-called design floods that are determined as an output of the flood frequency analysis (FFA). Using the FFA approach, one can, based on the derived sample (either annual maxima or peaks over threshold methods can be used), estimate the distribution parameters and then calculate the relationship between the return period and discharge [24,25,26]. It is often important to focus on the estimation of the 100-year flood because this is frequently used for the design of different hydraulic structures, such as check-dams or levees. Related to the design floods and climate change, some countries have proposed to use adjustment (safety) factors in order to also take into consideration the climate change impact on the design floods [5,27,28]. Several European countries have suggested an increase of about 30% [5]. On the other hand, several indices can be used for the investigation of the low-flow dynamics, such as the baseflow index (BFI). For a comprehensive overview of available methods, one should refer to the World Meteorological Organization manual about low flow estimation [29] or to different research papers, such as the one published by Laaha and Bloöschl [30].
Based on the literature review, we can conclude that it is generally not clear how climate change will impact the low- and high-flow dynamics in karst areas. These areas are especially vulnerable because karst rivers often do not have an extensive deep groundwater storage and are characterized by short transit times. Thus, the main aim of this study was to investigate how projected climate change will affect the low- and high-flow dynamics of the Ljubljanica River karst catchment. Two sub-catchments of different sizes were selected, namely a smaller Nanoščica River catchment and the larger Ljubljanica River catchment upstream to the Vrhnika gauging station. One small (i.e., <200 km2) and one large (>1000 km2) catchment were selected in order to investigate the response of different catchments to the projected climate change because hydro-meteorological processes at larger scales are mixed and smoother hydrological behavior can be expected compared to small catchments. Thus, response could be different. Several low-flow indices and flood frequency analysis results were computed for the period from 1981 until 2100. The RCP4.5 scenario was used and several climate models were investigated.
2. Materials and Methods
2.1. Ljubljanica River Catchment and Data Used
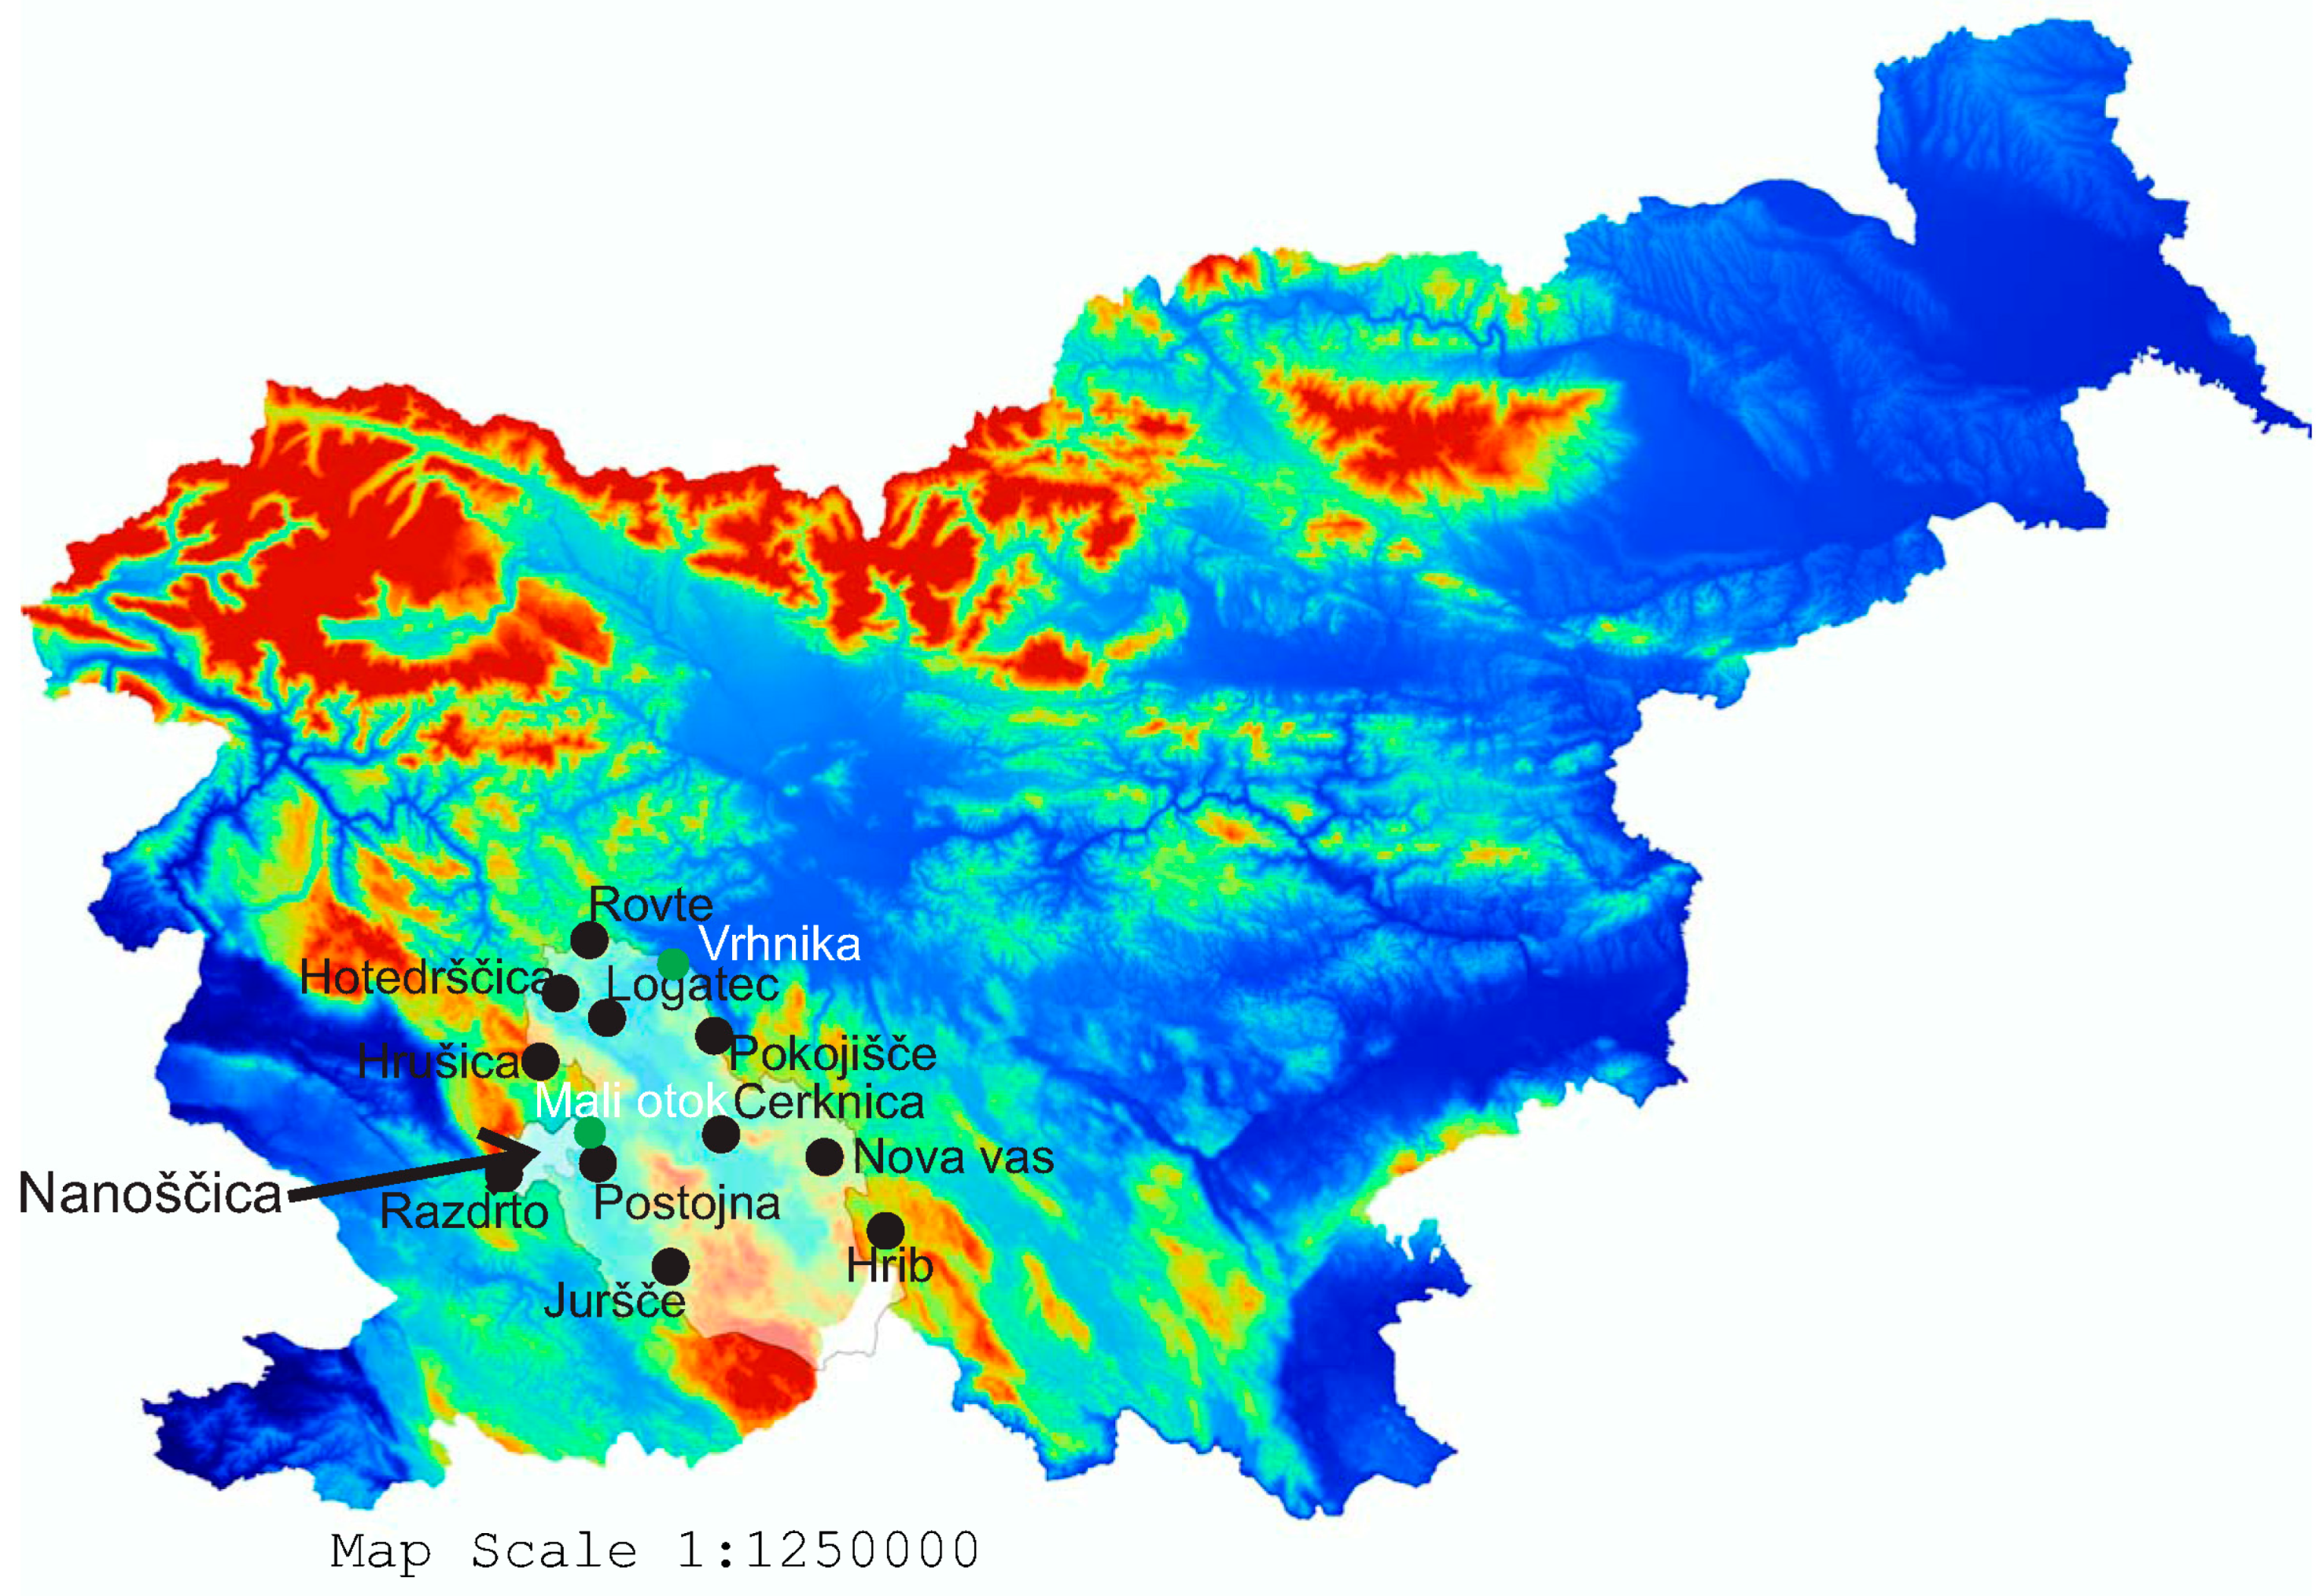
Due to its karst characteristics, the Ljubljanica River catchment was selected as a case study. It can be expected that karst rivers, such as Ljubljanica River, are more vulnerable than non-karst rivers because they can be characterized by the fast flow through underground conduits and relatively small groundwater storage. For example, this can mean that a decrease in the low flows in the future could result in reduced groundwater availability. Moreover, a decrease in low-flows could also affect the ecosystem services that a stream channel can provide. Compared to the non-karst areas where the catchment transit time is generally longer and groundwater storage is often bigger, a potential pollution on a karst area can have a significant negative impact on the karst aquifers. Thus, karst areas are often characterized by an unpredictable water supply. This is one of the reasons for investigating the low-flow characteristics of karst areas. The Ljubljanica River catchment is part of the Dinaric karst system that covers in total about 60,000 km2 and covers area including the Bay of Trieste, Drim River, Western Morava River valley, and Adriatic Sea [2]. The Dinaric karst system can be described as an extremely non-homogeneous area with high infiltration rates and often with no or little surface runoff [2]. The total catchment area of the Ljubljanica River is about 1880 km2 and is part of the Danube River basin. The selected Ljubljanica River catchment is a typical example of the Dinaric karst river and can be regarded as a highly heterogeneous catchment. Several sinking streams, such as Pivka, Stržen, or Unica, can be found in this area. Moreover, along the main karst conduit directions, streams often sink and re-appear a few kilometers downstream. For example, the Ljubljanica River is known as the river of multiple names since it re-appears seven times. The areas of the Ljubljanica River catchment with maximum elevation (up to 1800 m.a.s.l.) are karst plateaus, such as Snežnik and Javorniki. Porous carbonate rocks (mostly dolomite and limestone) cover most of the area (i.e., geology). Moreover, the dominant land-use in this area is semi-natural areas and forest. The entire catchment has temperate continental properties. A detailed description of the Ljubljanica karst river system can be found in Kovačič and Ravbar [31] and Ravbar et al. [32]. In this study, we focused on the smaller Nanoščica River catchment (upstream of the Mali otok gauging station) that covers about 50 km2 and the larger Ljubljanica River catchment (upstream of the Vrhnika gauging station) that covers about 1135 km2 (Table 1). Figure 1 shows the selected catchments on the topography map of Slovenia. Some basic characteristics of these two catchments are provided in Table 1. Nanoščica River is part of the Pivka River catchment that flows through the Postojna Cave. Moreover, several springs of the Nanoščica River were researched from the Nanos karst plateau where maximum elevation is around 1000 m.a.s.l. Flysch and other deep-marine rocks cover the Nanoščica River catchment. The data period that was used for the calibration of the hydrological model is also shown in Table 1. Table 1 also provides basic descriptive statistics of the discharge data that were used for the hydrological model calibration. One should note that a large relative difference in the maximum specific discharge values exists between the two catchments. The main reason lies in the fact that several sinks and springs located in the Ljubljanica River catchment upstream of the Vrhnika station have limited hydraulic capacity. This means that water that cannot be conveyed by the karst underground system is retained in the upstream part of the catchment where several karst poljes are located (e.g., Lake Cerknica or Planina Polje). Thus, these areas present natural flood retention areas and therefore the maximum specific discharge value for this station is relatively low. Additionally, the maximum specific discharge value for the Nanoščica River (i.e., around 0.5 m3/s/km2) is relatively low for the Slovene conditions where maximum specific discharge values in alpine areas for smaller catchments can be an order of magnitude higher for extreme flood events.
As an input to the hydrological model, we also used information about the reference evapotranspiration and air temperature. Two stations that have air temperature and reference evapotranspiration data available were selected for the model calibration period. Therefore, we decided to use the reference evapotranspiration calculated by the PenmanMontheith equation in this study because this method also uses information about the wind speed, relative humidity, and sunshine duration in order to calculate the reference evapotranspiration values. Additional information about reference evapotranspiration trends in Slovenia can be found in Maček et al. [33]. For the Vrhnika (Ljubljanica River) case study, we used average values measured at the Postojna and Nova vas stations, while for the Mali otok (Nanoščica River), we used Postojna station data. Daily rainfall data was also used as an input to the hydrological model. The rainfall stations that were used are listed in Table 2. For the Ljubljanica River case study, areal rainfall was determined using the Thiessen polygons method, while for the Nanoščica River case study, we used rainfall data from the Postojna station.
2.2. Hydrological Model
For the hydrological modelling, we used different versions of the lumped conceptual hydrological model that were developed by the Institut national de recherche en sciences et technologies pour l’environnement et l’agriculture (IRSTEA) hydrology research group [35,36,37,38]. For the Ljubljanica River, we used the model version named Cema Neige Génie Rural à 6 paramètres Journalier (CemaNeigeGR6J), while for the Nanoščica River, we used GR6J model version. The main difference between these two model versions is in the fact that CemaNeigeGR6J also includes a snow module and uses two additional parameters compared to the GR6J model. The GR6J model uses six model parameters to calculate the runoff. The required input data are rainfall and evapotranspiration. Moreover, in order to use the snow module, the required input data also includes the air temperature and catchment hypsometric curve. Thus, for the Ljubljanica River catchment case study, we also used this data as an input. Daily time step was used for both case studies. Both versions of the model (i.e., CemaNeigeGR6J and GR6J) are implemented in program R airGR package [39,40]. The main reason that we decided to use the CemaNeigeGR6J for the Ljubljanica River catchment lies in the fact that along the orographic barriers named Snežnik and Javorniki karst plateaus (elevation above 1700 m.a.s.l.), the mean annual rainfall sums exceed 2000 and 3000 mm, respectively, and due to the high elevation, snowfall and snowmelt are important processes. Moreover, a comparison of the GR6J and CemaNeigeGR6J models for the Ljubljanica River catchment revealed that not much difference in the models’ performances could be detected [41]. Thus, one could argue that similar results would be obtained using the GR6J model version. A detailed description of the lumped conceptual hydrological model used in this study can be found in Coron et al. [39,40], Perrin et al. [35], Pushpalatha et al. [36], and Valéry et al. [37,38]. The CemaNeige module divides the catchment into five different elevation zones based on the catchment hypsometric curve. In each zone, snow is stored using a conceptual store (i.e., snow cover) where the solid part of precipitation is the input to the store. Additional functions are then used to calculate snowmelt [37,38]. We firstly calibrated the model using the historical data since this can be regarded as the preferred way to carry out climate change investigation [42]. Model calibration was performed using the method proposed by Michel [43], where the Nash-Sutcliffe (NS) [44] was selected as the error criterion function, which gives slightly more focus to the higher discharge values.
2.3. Climate Change Models
As a part of the project entitled “The estimation of the average and extreme meteorological and hydrological conditions in Slovenia over the 21st century” [45], a bias-corrected (BC) regional climate model simulations ensemble from the project EURO-CORDEX was analyzed [46] based on different RCP scenarios. The focus of the analysis conducted as part of this research was the RCP4.5 moderately optimistic scenario, which predicts a gradual reduction in greenhouse gas emissions in the second half of the 21st century.
For this scenario, we analyzed five different combinations of global climate models (GCM) and regional climate models (RCM), namely (GCM/RCM): CNRM-CM5-LR/CCLM4-8-17, MPI-ESM-LR/CCLM4-8-17, MPI-ESM-LR/RCA4, EC-EARTH/HIRHAM5, and IPSL-CM5A-MR/WRF331F. Both low and high resolution RCMs were available in the EURO-CORDEX database. We decided to use high-resolution models with a resolution of approximately 140 km2. First, we applied the BC to model data. This was done for every variable (precipitation, air temperature, and evapotranspiration) separately. Prior to that, we interpolated the observational data in the reference period (1981–2010) to the same grid as the RCM model cells. Then, we were able to apply the BC to each model cell. For precipitation, the BC was done by quantile mapping, using R software with the qmap package [47]. Based on the suggestions proposed by Gudmundsson et al. [48], we decided to use the method of non-parametric quantile mapping using empirical quantiles with linear extrapolation. This was done for each model cell separately. The reference period for the BC was 1981–2010. Corrections were made for every day of the year with a 61-day moving window and 100 quantile classes.
For air temperature, the correction method was a bit different to that used for the precipitation. We wanted to preserve trends in the model data. For this purpose, we corrected deviations of the temperature from the average annual temperature cycle for four different precipitation classes. We applied quantile delta mapping as the BC method in these cases, using the Univariate bias correction via quantile delta mapping (QDM) function from R package MBC [49]. The reference period was 1981–2010 and corrections were made for 30-year periods (1981–2010, 2011–2040, 2041–2070, and 2071–2100), for each precipitation class separately. The first precipitation class was without precipitation, the other three were separated by a tercile. Lastly, corrected deviations were added to the annual temperature cycle in the reference period for a particular precipitation class.
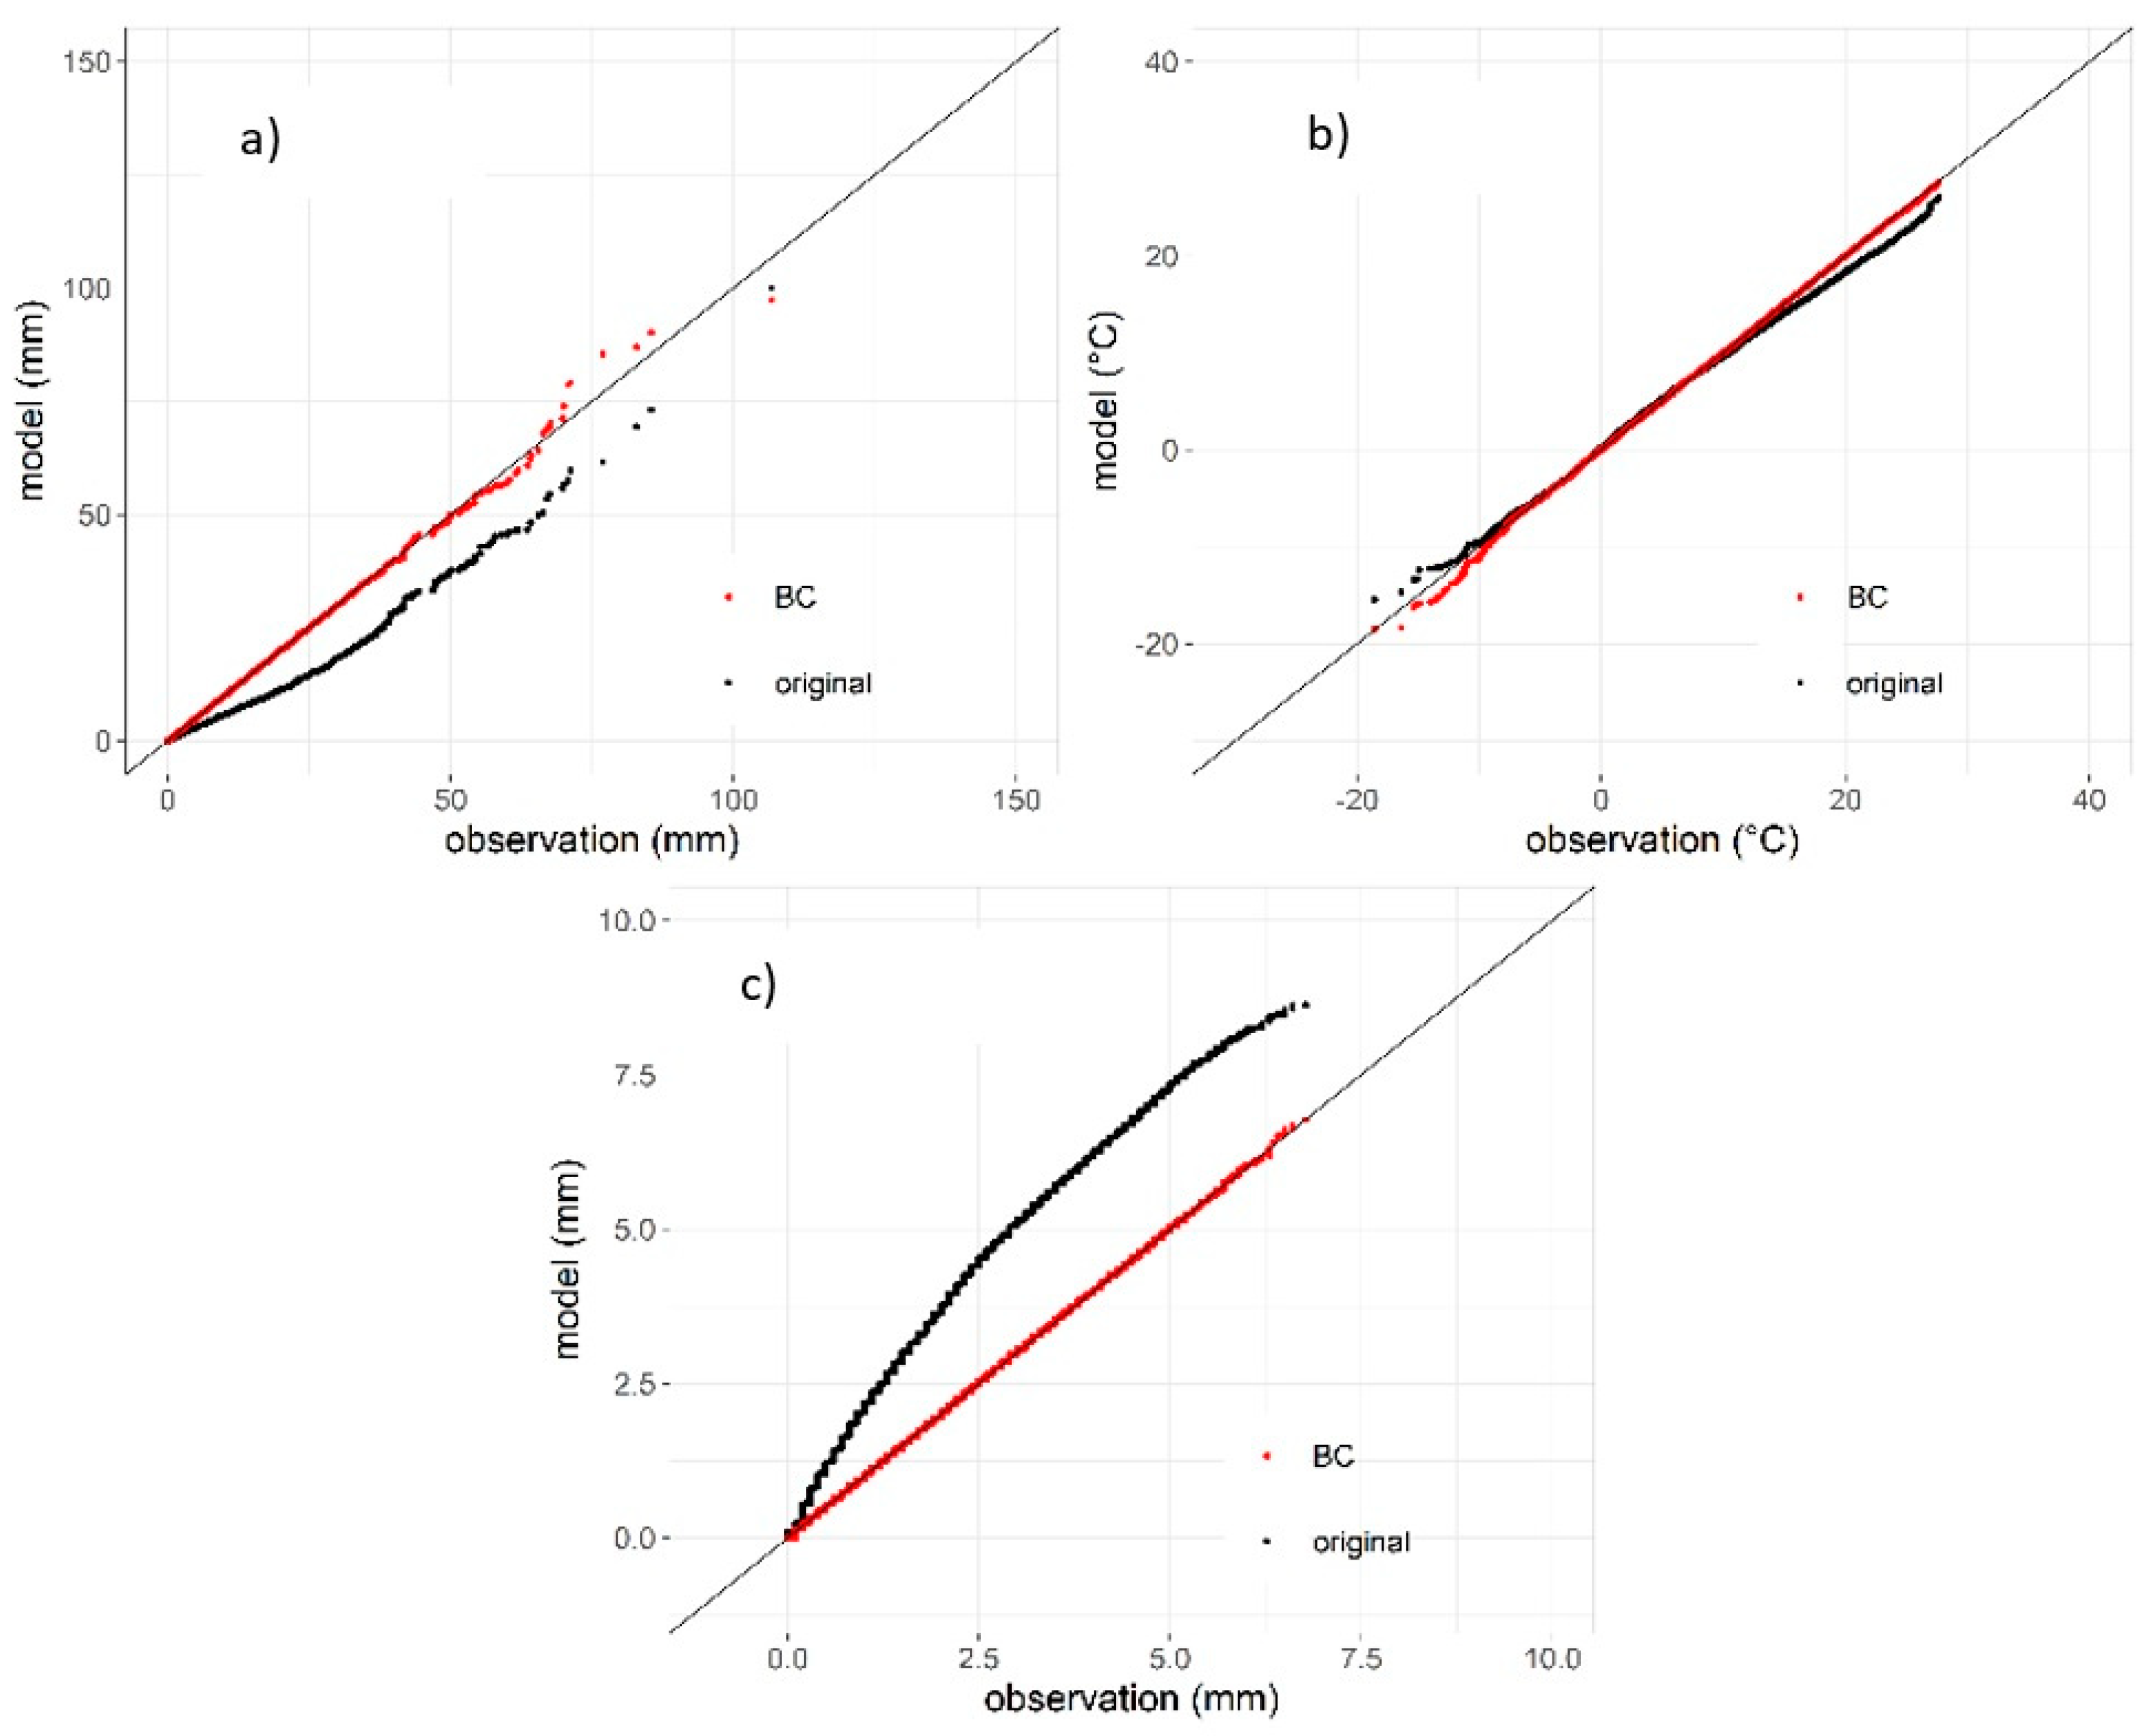
For the evapotranspiration, the process was similar to that for the air temperature, but instead of correcting deviations as in the case of air temperature, we corrected model values. Again, there were four precipitation classes and BC was done for 30-year periods. Some results of BC can be seen in Figure 2. This figure represents a comparison between the observations and model data in the reference period (1981–2010). We can see that the BC data shows a much better fit to the observational data compared to the raw model data. Because the same corrections were used for the projection periods (2011–2040, 2041–2070, 2071–2100), one can anticipate that the BC data better describes the future than the original model data. For further analysis, we used the BC model data.
These five climate models were used to investigate changes in the precipitation, air temperature, and evapotranspiration in Slovenia until the year 2100 [45,50]. The results in the precipitation, air temperature, and evapotranspiration projections can be summarized as follows. Air temperature is projected to increase in all four seasons for the RCP4.5 scenario [45]. This increase is generally higher for the 2071–2100 and 2041–2070 periods compared to the 2011–2040 period. For the precipitation, the projected situation is more ambiguous for the RCP4.5 scenario [45,50]. Generally, in summer, the precipitation is expected to decrease (i.e., 2011–2070) while in other seasons the precipitation could increase. Most of Slovenia’s territory is located in a temperate continental climate [51], which means that higher rainfall amounts are usually characteristic for autumn and spring periods, while smaller amounts are characteristic for the summer period. However, rainfall events with the highest intensity can be observed in summer. Moreover, the reference evapotranspiration is also projected to increase for all three investigated periods [45,50]. Taking into account the projected situation using the RCP4.5 scenario, one could assume that the summer precipitation decrease will lead to more frequent and longer droughts and the autumn precipitation increase will result in more frequent flood events. However, in order to confirm this, we also carried out hydrological modelling for the selected cases.
For the low- and high-flow analyses that were carried out in this paper, we took into consideration three 30-year periods, which agree with the periods considered in the climate projections: 2011–2040, 2041–2070, and 2071–2100.
In the case of all three periods, we compared the results with the selected reference period (i.e., from 1981 to 2010). All results presented in this paper are reported as a percentage calculated as the relative increase or decrease based on the selected reference period. More specifically, this means that we compared the discharge with the 100-year return period for the 2011–2040 period with the 1981–2010 period. The same procedure was also applied for other selected indices that were used to evaluate low and high flows. Moreover, based on the five selected climate models, we calculated the minimum, median, and maximum values of all five cases.
2.4. Low-Flow Indices
A river’s low flows can be analyzed in different ways by using various indices, depending on the available data and the question we want to answer with the analysis. Consequently, there is a large set of measures and indicators of low flows that one can use [52]. In order to investigate how projected climate change will impact the low-flow values (discharge), we selected the following indices: Baseflow index (BFI), 7-day mean annual minima (MAM7), 30-day mean annual minima (MAM30), Q50 (i.e., median discharge), and Q95 (i.e., the flow that is exceeded in 95% of the selected time period). All low-flow indices were calculated using the package, lfstat [53], included in the R software [54].
Flows with the probability of exceedance during a certain percentage of time, in our case 50% and 95%, are together with BFI and MAMn one of the most commonly used low-flow indices. Moreover, for the analysis of the low-flows’ seasonality, the seasonality index and seasonality ratio were included in the study. For the seasonality ratio, we analyses the Julian date of low-flow occurrence (D (from 1 to 365) that indicates in which time period of a year the low flow usually occurs and the strength of seasonality (R [0,1]). Moreover, we also analyzed the seasonality ratio (SR), which is defined as:
where and are flows that are exceeded 95% of the time in the summer and winter period, respectively. Summer (1 April–30 November) and winter (1 December–31 March) periods were determined in the same way as Laaha and Blöschl [30] did for Austria. A detailed description of the seasonality ratio can be found in Burn [55] and applications to some of the Slovenian gauging stations can be found in Bezak et al. [3] or Petek et al. [56].
The baseflow index (BFI) is a non-dimensional ratio between the baseflow volume (i.e., slowly varying component of the streamflow originating from subsurface storage) and the total streamflow [52,57]. BFI values close to 0 are typical for flashy streams with an impermeable geological structure and soil, while BFI values close to 1 are characteristic for high storage capacity catchments with a permeable geological structure [57].
Mean n-day annual minima (MAMn) values were obtained by calculating a moving average, where average flows for the duration of n-days were calculated for every hydrological year. In the Ljubljanica River catchment, the lowest flows are expected in summer [58]. Therefore, 1st January was selected for the beginning of the hydrological year. MAMn for the individual hydrological year is defined as the minimum value. In the case when the number of days is equal to 1, MAM1 is equal to the annual minimum. However, Smakthin [52] and Bormann and Pinter [59] recommended not to use the MAM1 for low-flow analysis because the MAM1 can be a result of measurement error or day-to-day variations. Therefore, for the purpose of this study, possible impacts of projected climate change on the MAM7 and MAM30 values were evaluated.
2.5. Flood Frequency Analysis
In order to investigate the impact of the projected climate characteristics on high-flows, we used the flood frequency analysis (FFA). The annual maxima method was used to define the sample. This means that the maximum discharge value of each year was selected [24,25,26]. The generalized extreme value (GEV) distribution and the method of L-moments [60] were used for the parameter estimation. GEV distribution was selected because it is often used in practical applications for the determination of the design discharge values in different countries [61]. Using the GEV distribution, we calculated the discharge with a 10-, 50- and 100-year return period. An additional description about the flood frequency approach can be found in hydrological textbooks [62] and research papers, such as Bezak et al. [24], Lang et al. [25], and Karmakar and Simonovic [26].
3. Results and Discussion
3.1. Model Calibration
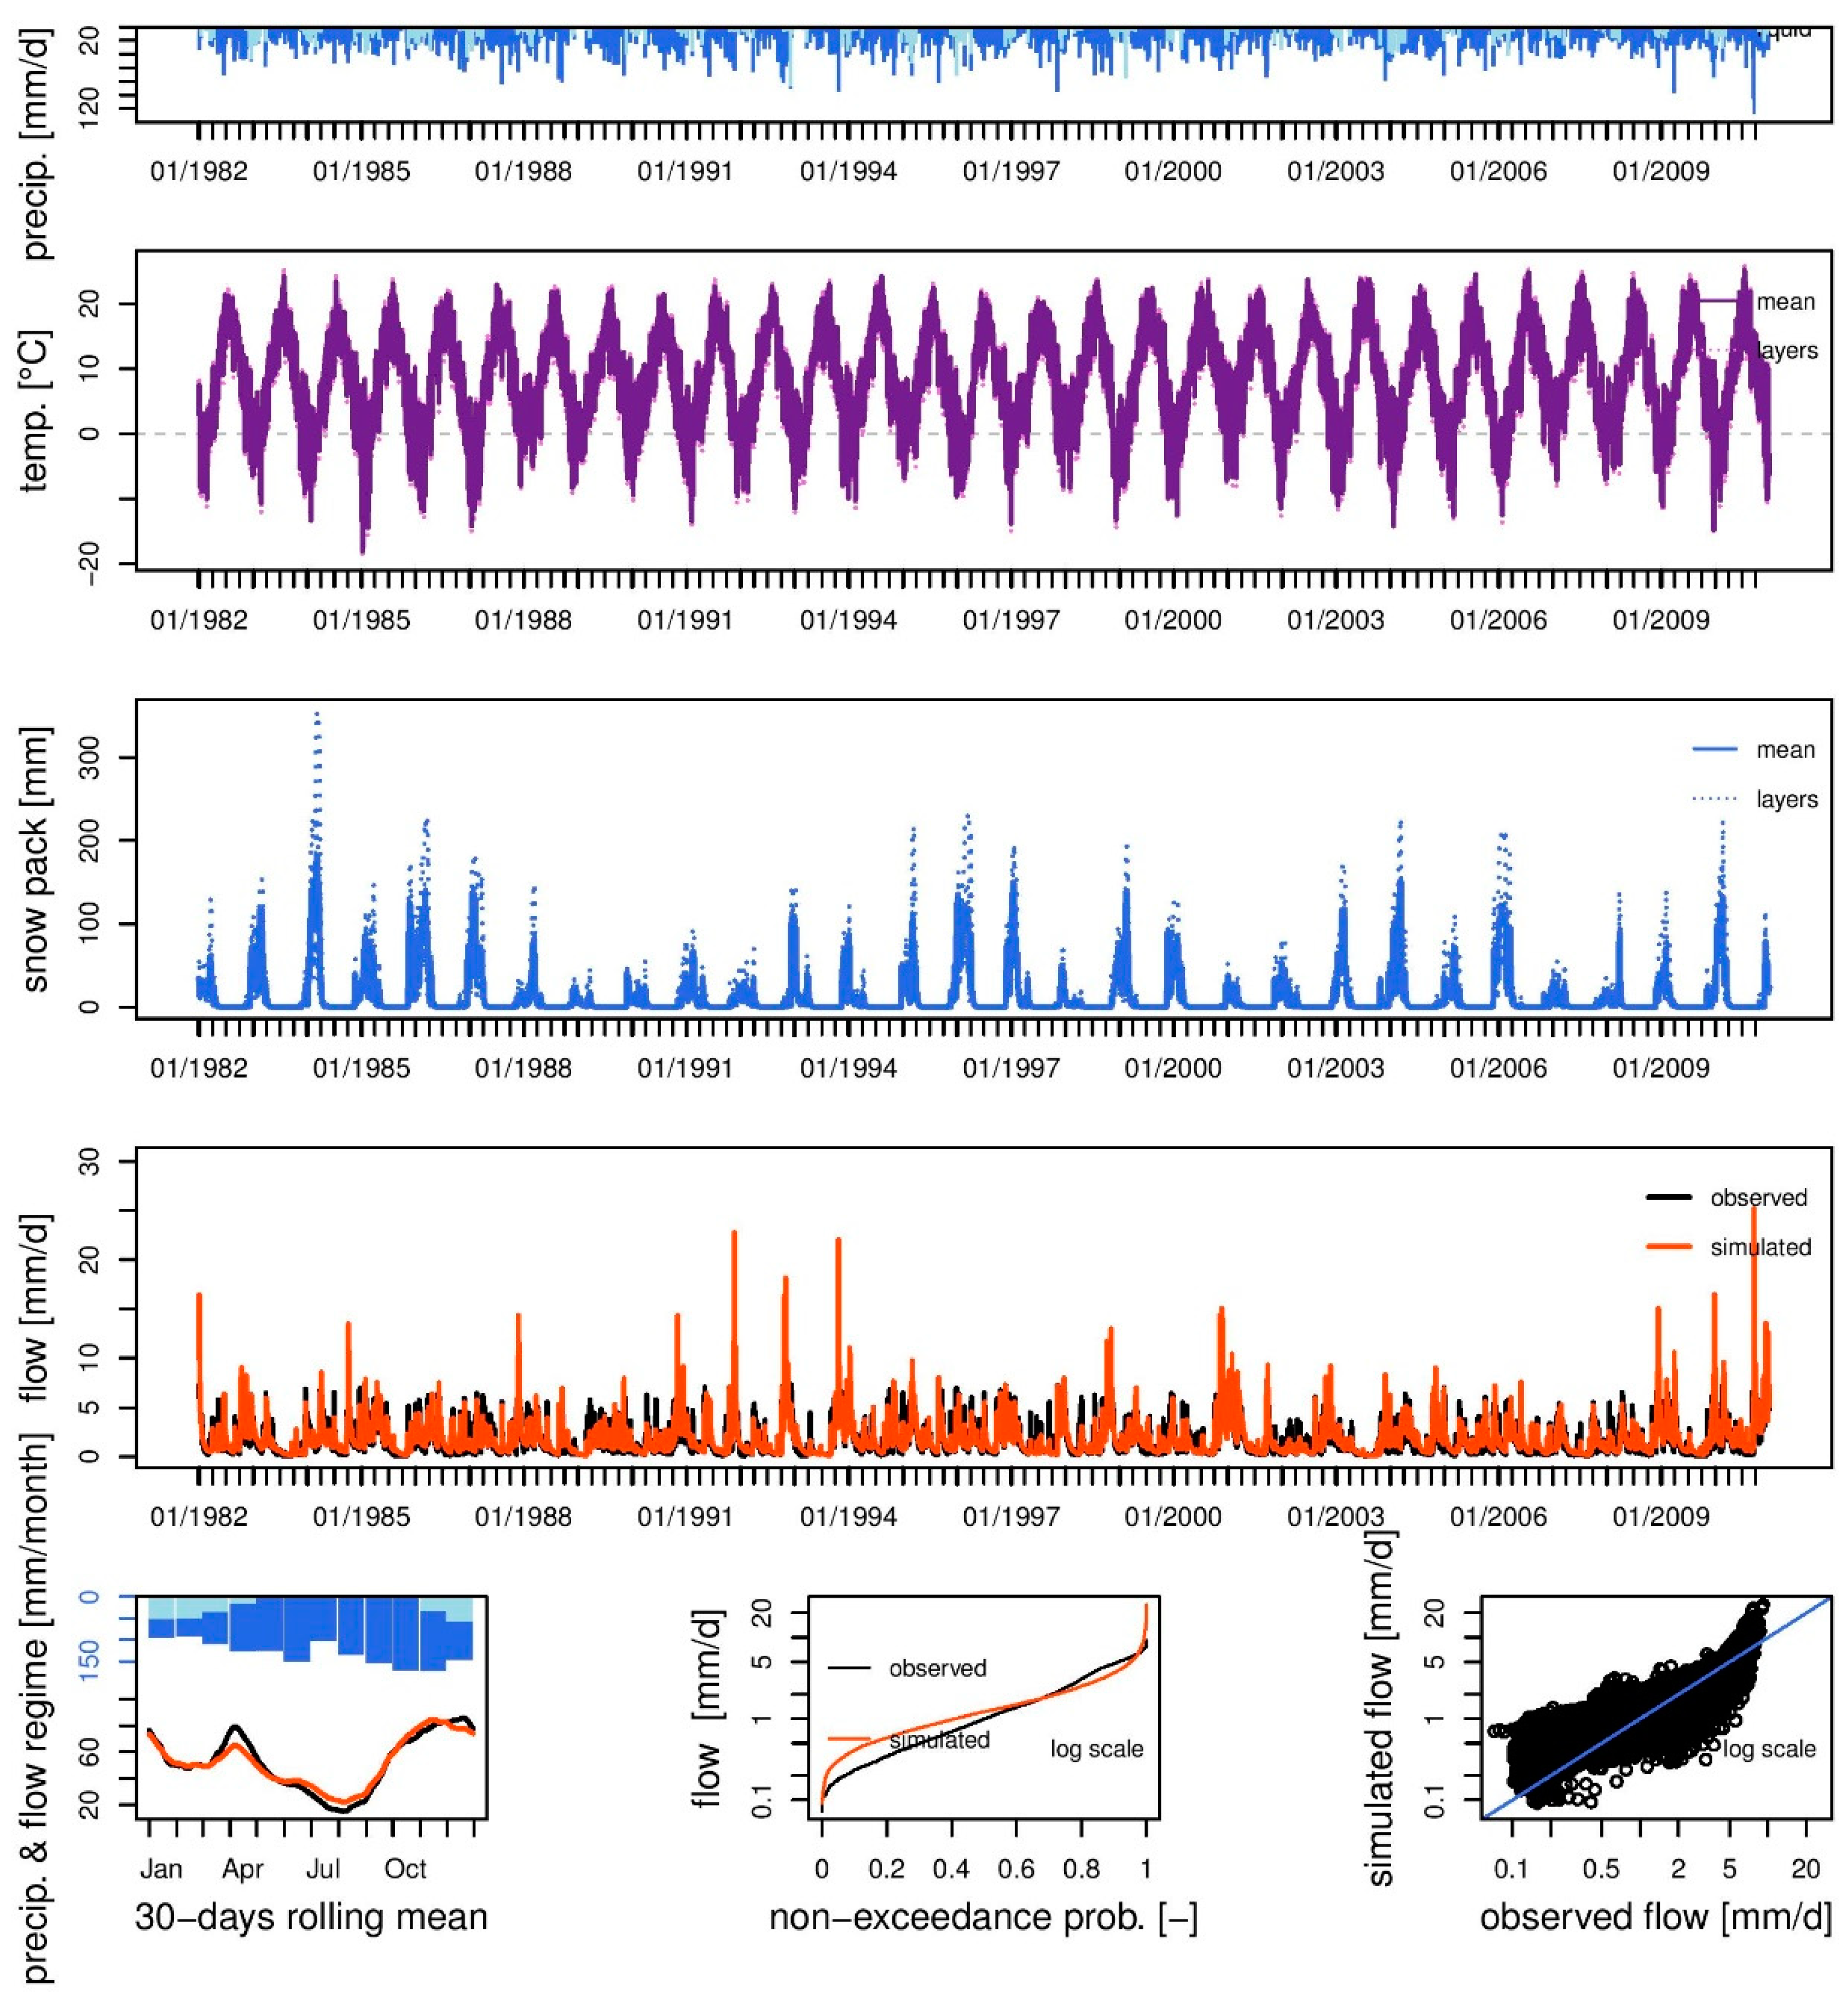
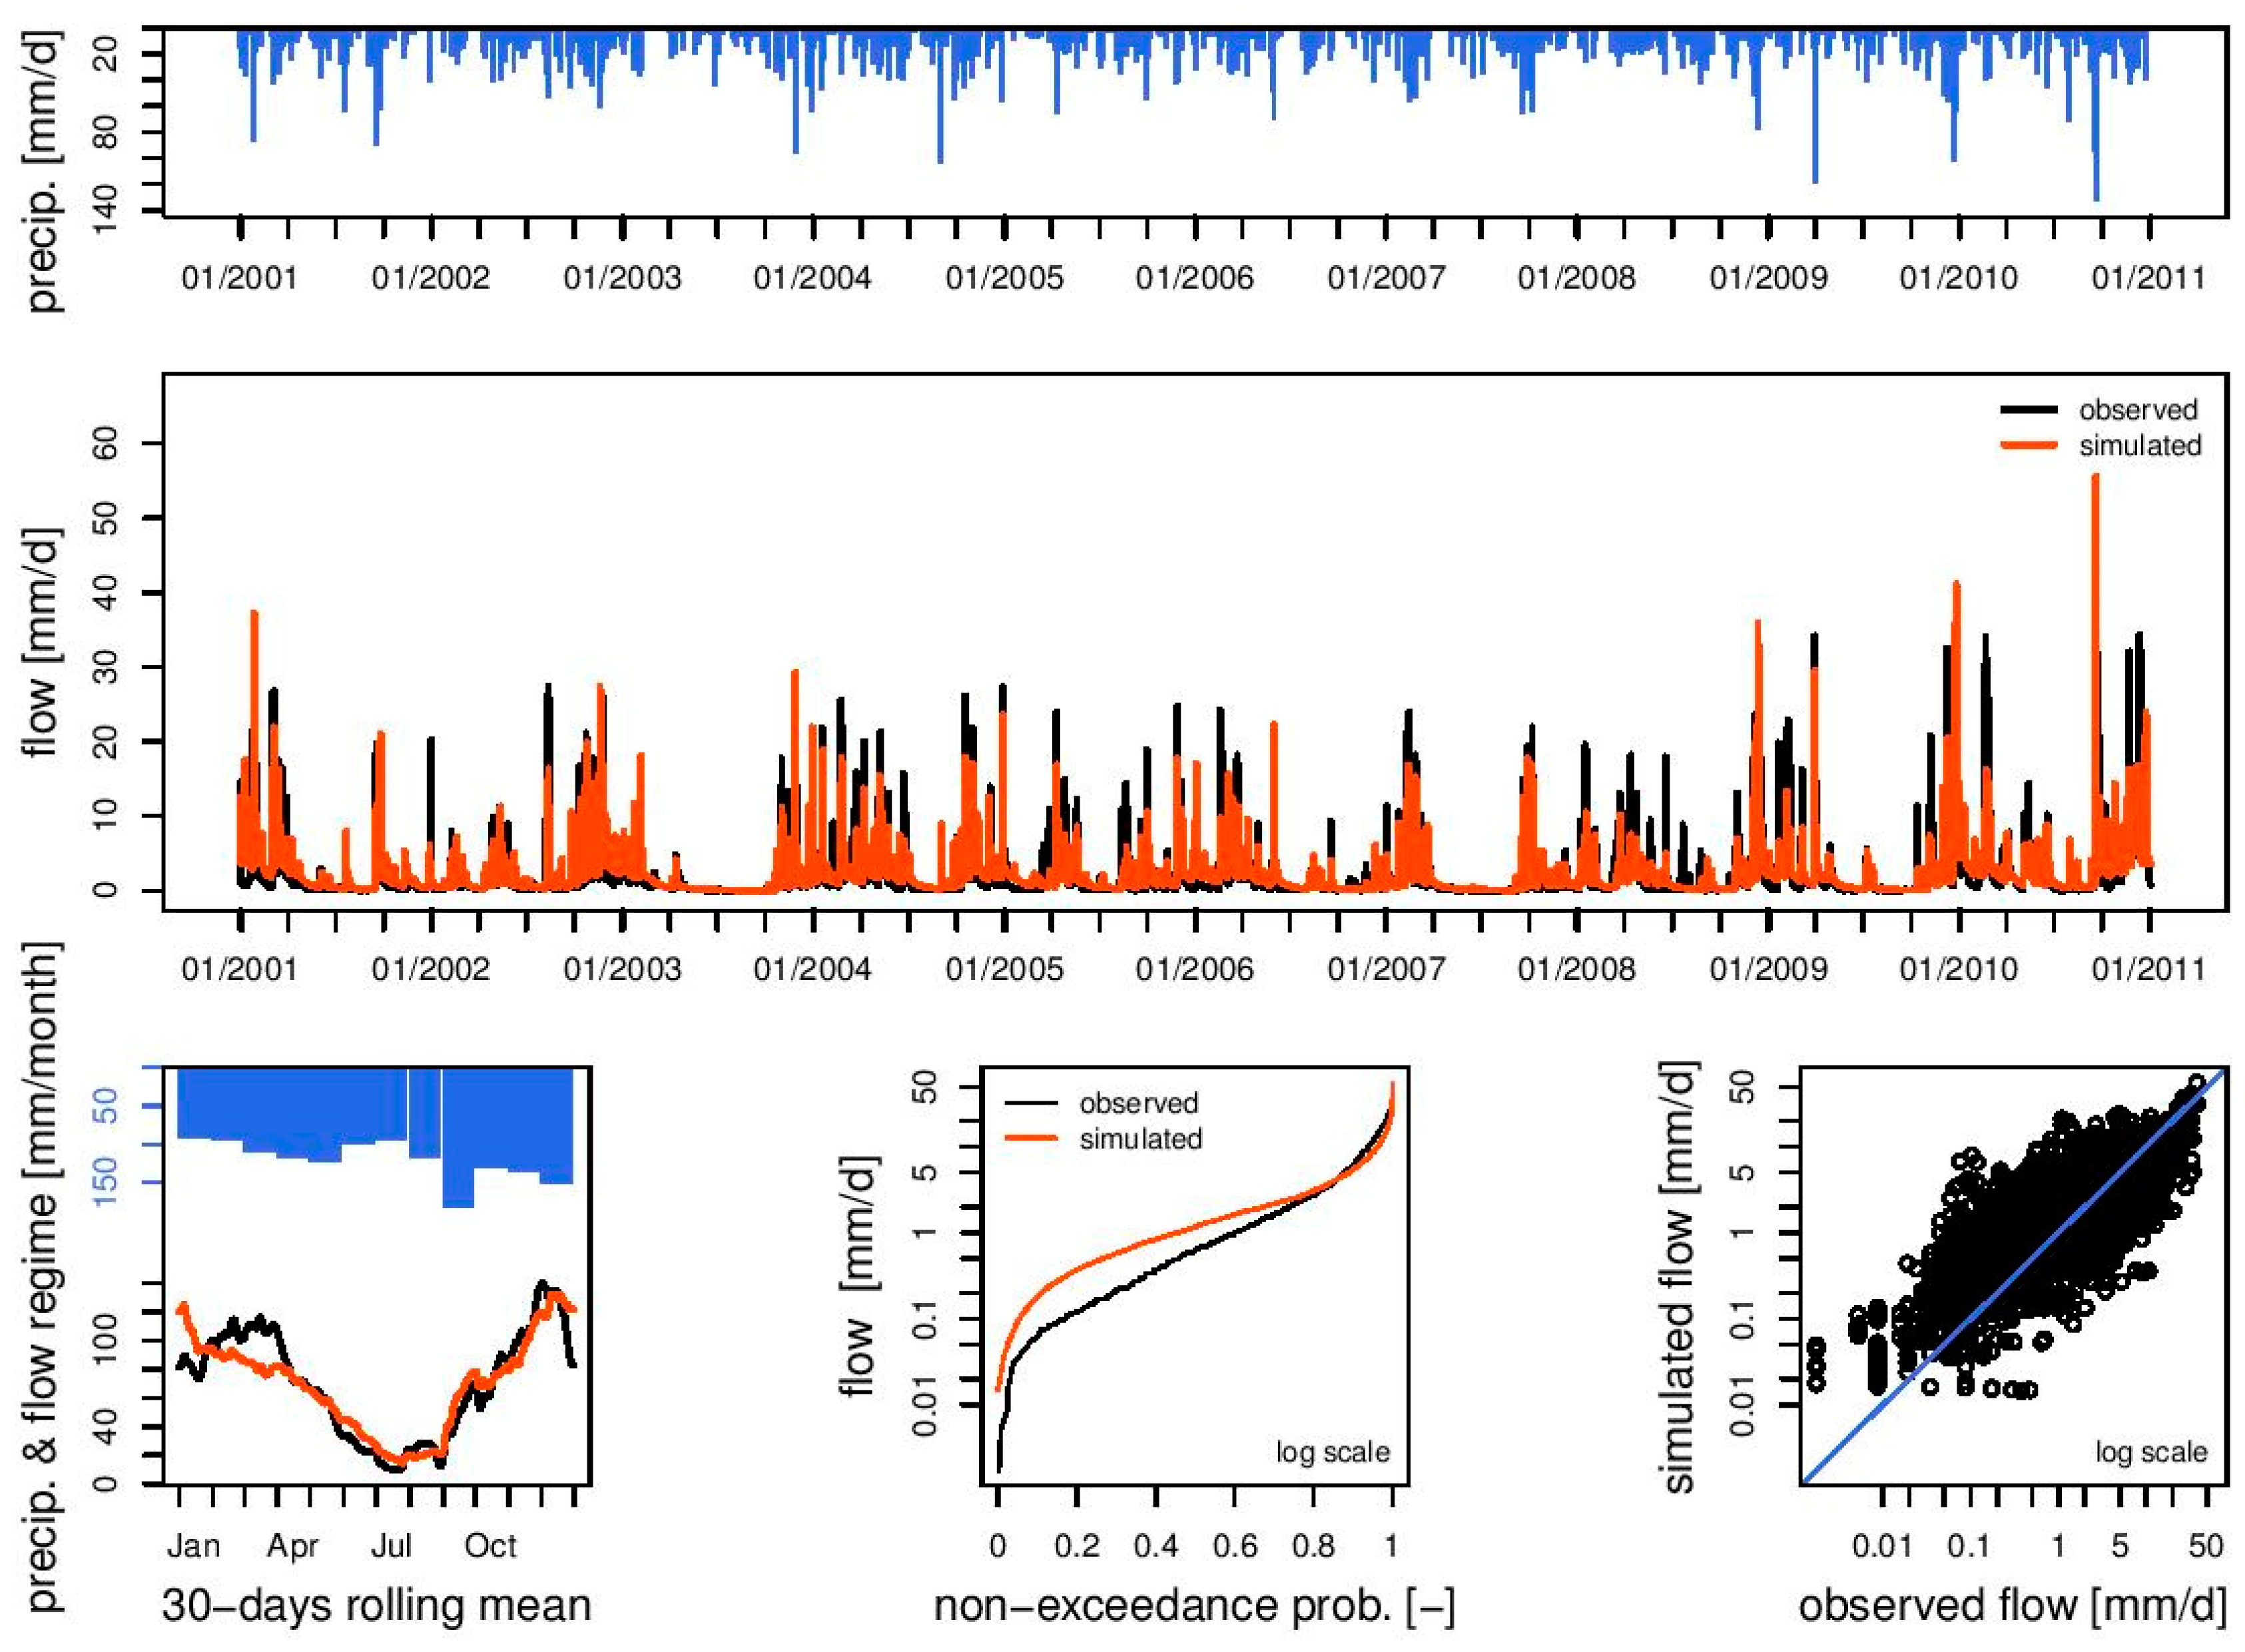
In the first step of the study, we calibrated the hydrological model for two selected case studies. The data and methodology described in Section 2.1 and Section 2.2 were used in order to obtain the most suitable model parameters. Calibration periods for both case studies are reported in Table 1. Figure 3 shows the calibration results for the CemaNeige GR6J model that was used for the Ljubljanica River study catchment. Several different hydrological comparisons were used, such as the non-exceedance probability or 30-days rolling mean. Comparison between the observed and modelled flows in log scales indicates a relatively good model performance, both for the low and high flows. Moreover, the calculated NS coefficient for the calibration period was 0.70. Figure 4 shows the results for the Nanoščica River case study (Mali otok gauging station). For a description of this study catchment, we used the GR6J model. A similar comparison of the observed and modelled flows as for the Ljubljanica case study was also used for the Nanoščica case study. Moreover, the calculated NS coefficient for the calibration period was 0.55. Based on the methodology that was proposed by Moriasi et al. [63], the presented results can be regarded as satisfactory. A similar conclusion can also be made based on the criteria proposed by Krysanova et al. [42]. Both calibrated hydrological models (for Ljubljanica and Nanoščica catchments) were used for further investigation of the climate change impact on the low- and high-flow characteristics of these two case studies. Similar to [64], better modelling results were obtained for the larger catchment.
3.2. Climate Change Models
Low-flow and flood frequency analyses were carried out for five climate models that are described in Section 2.3. Based on the projected rainfall, air temperature, and evapotranspiration, we calculated the daily discharge values using the calibrated hydrological model. For low- and high-flow analyses, the results are shown in Figure 5, Figure 6, Figure 7 and Figure 8 for three time periods, namely 2011–2040, 2041–2070, and 2071–2100. For each period, the minimum, median, and maximum values are given taking into account the results of five model simulations. All values in the tables are given as changes relative to the selected reference period of 1981–2010.
3.2.1. Ljubljanica River (Vrhnika station)
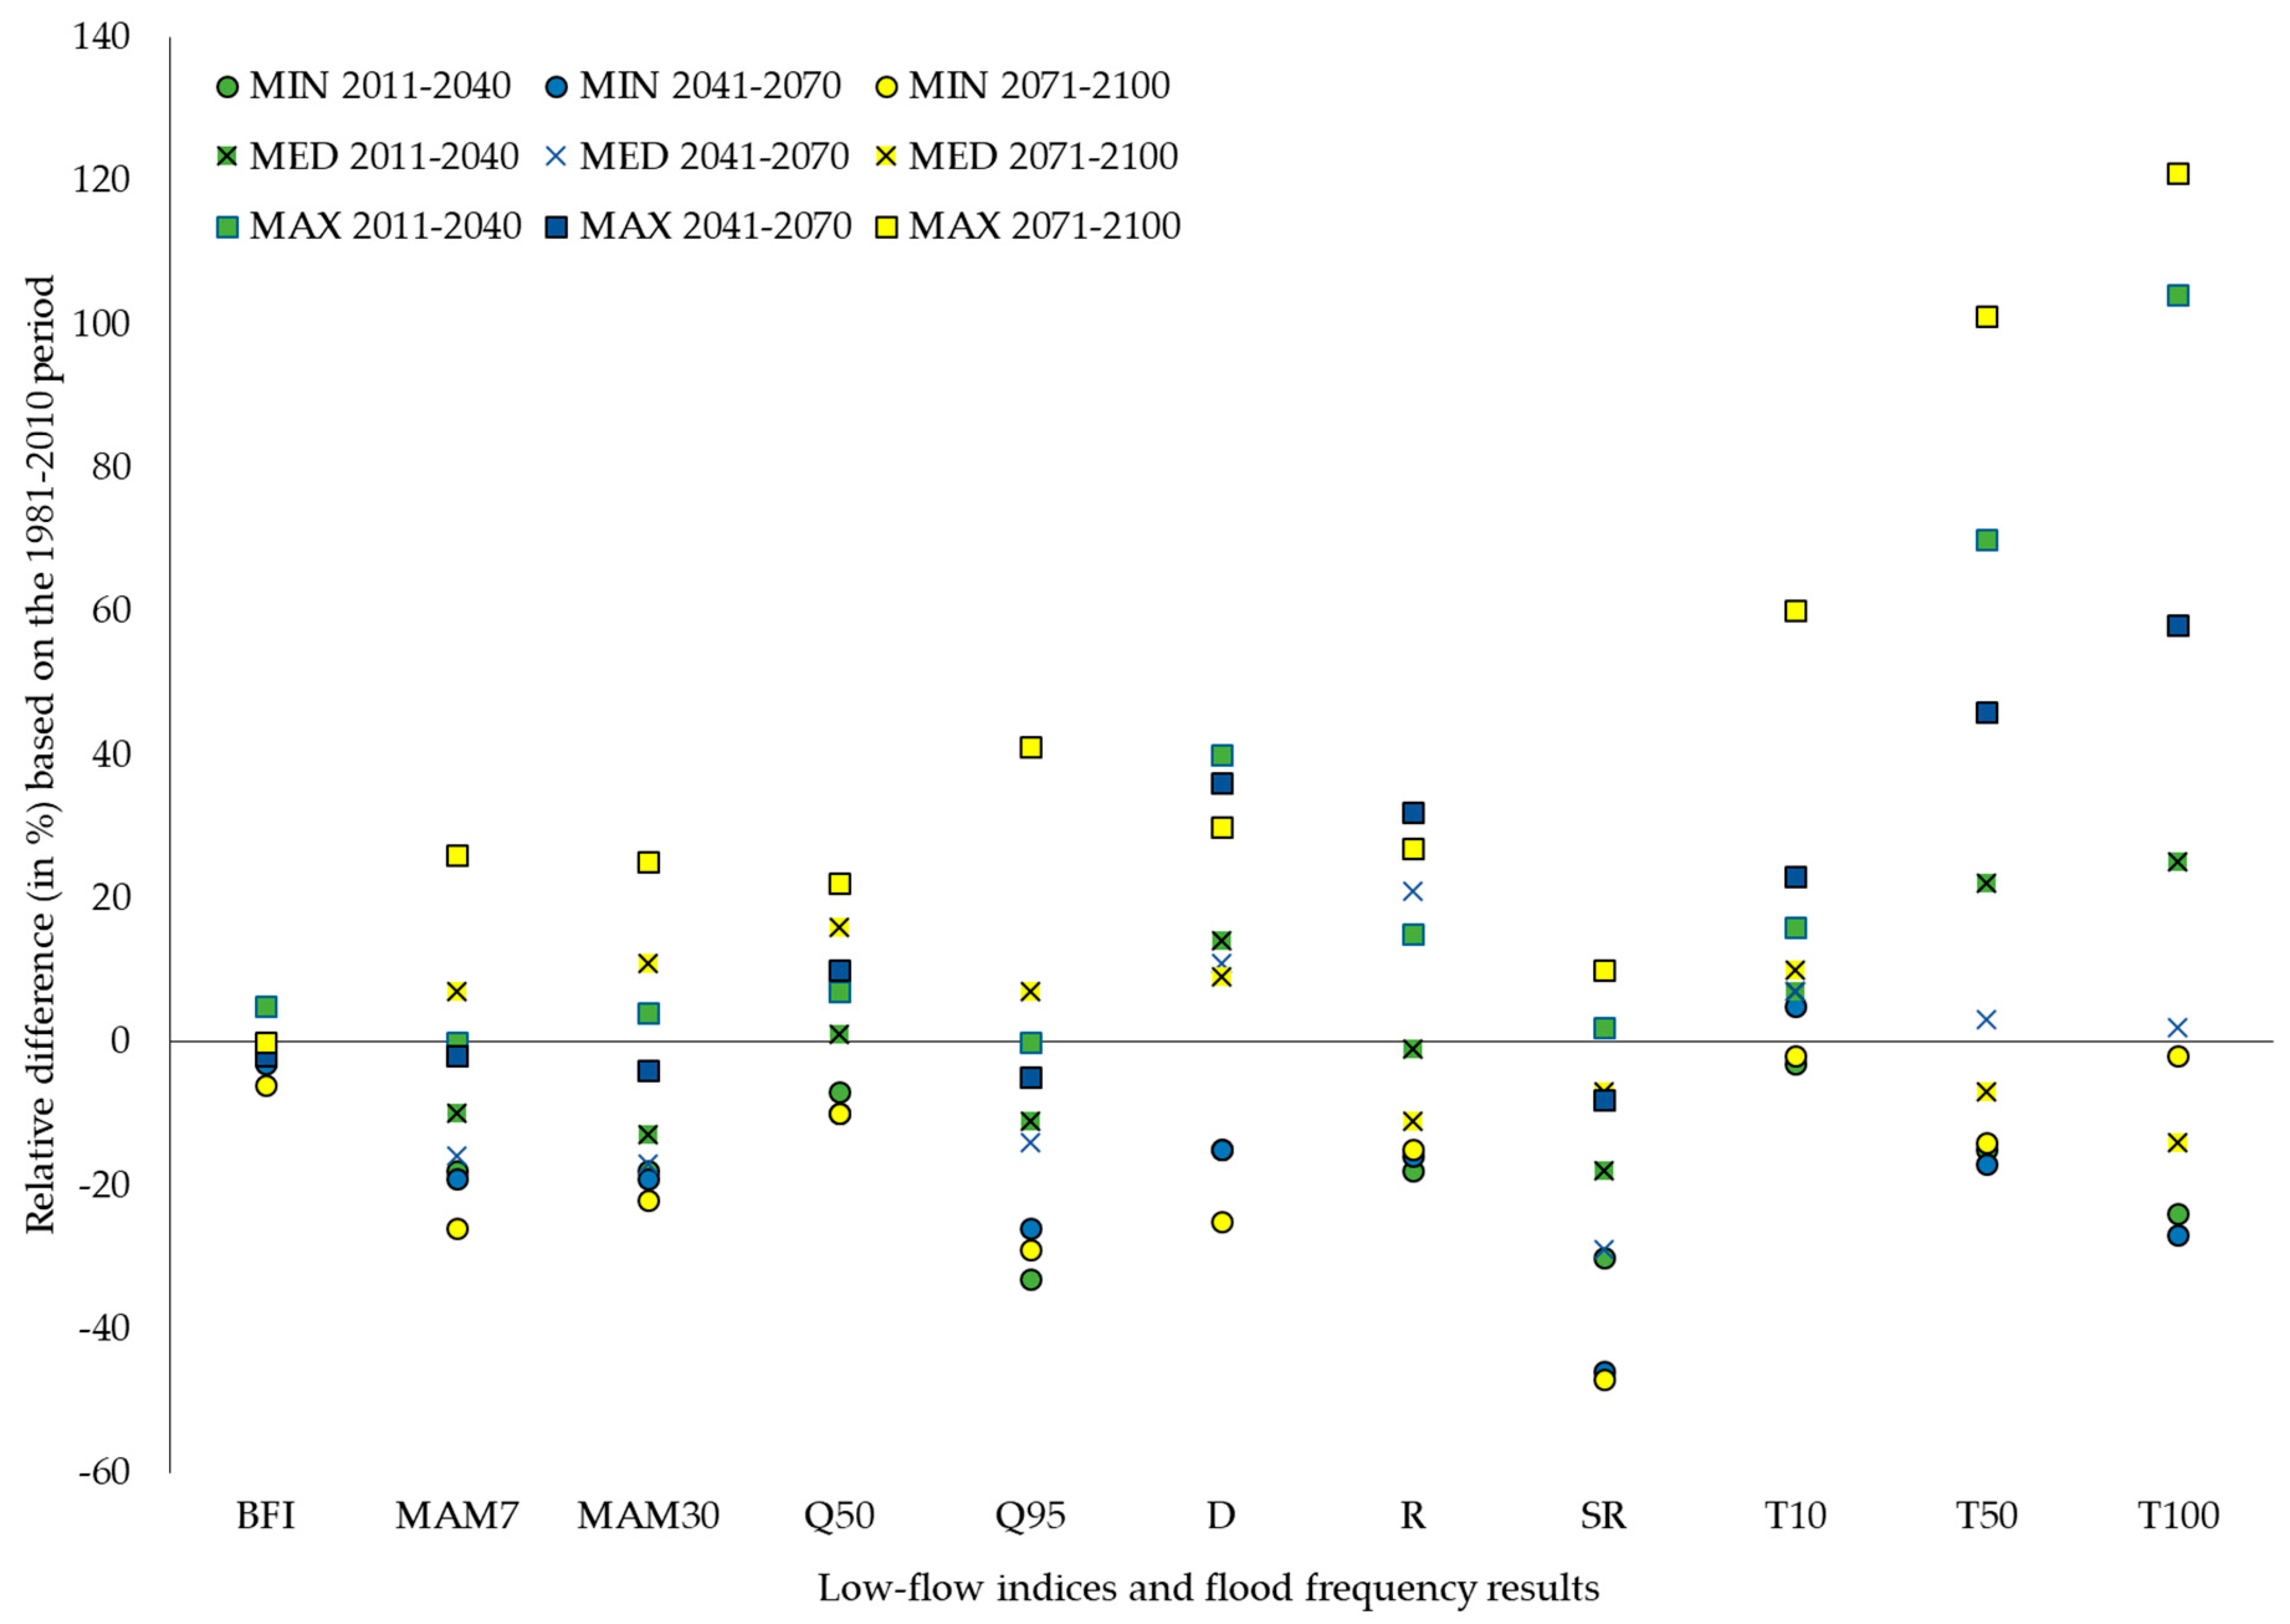
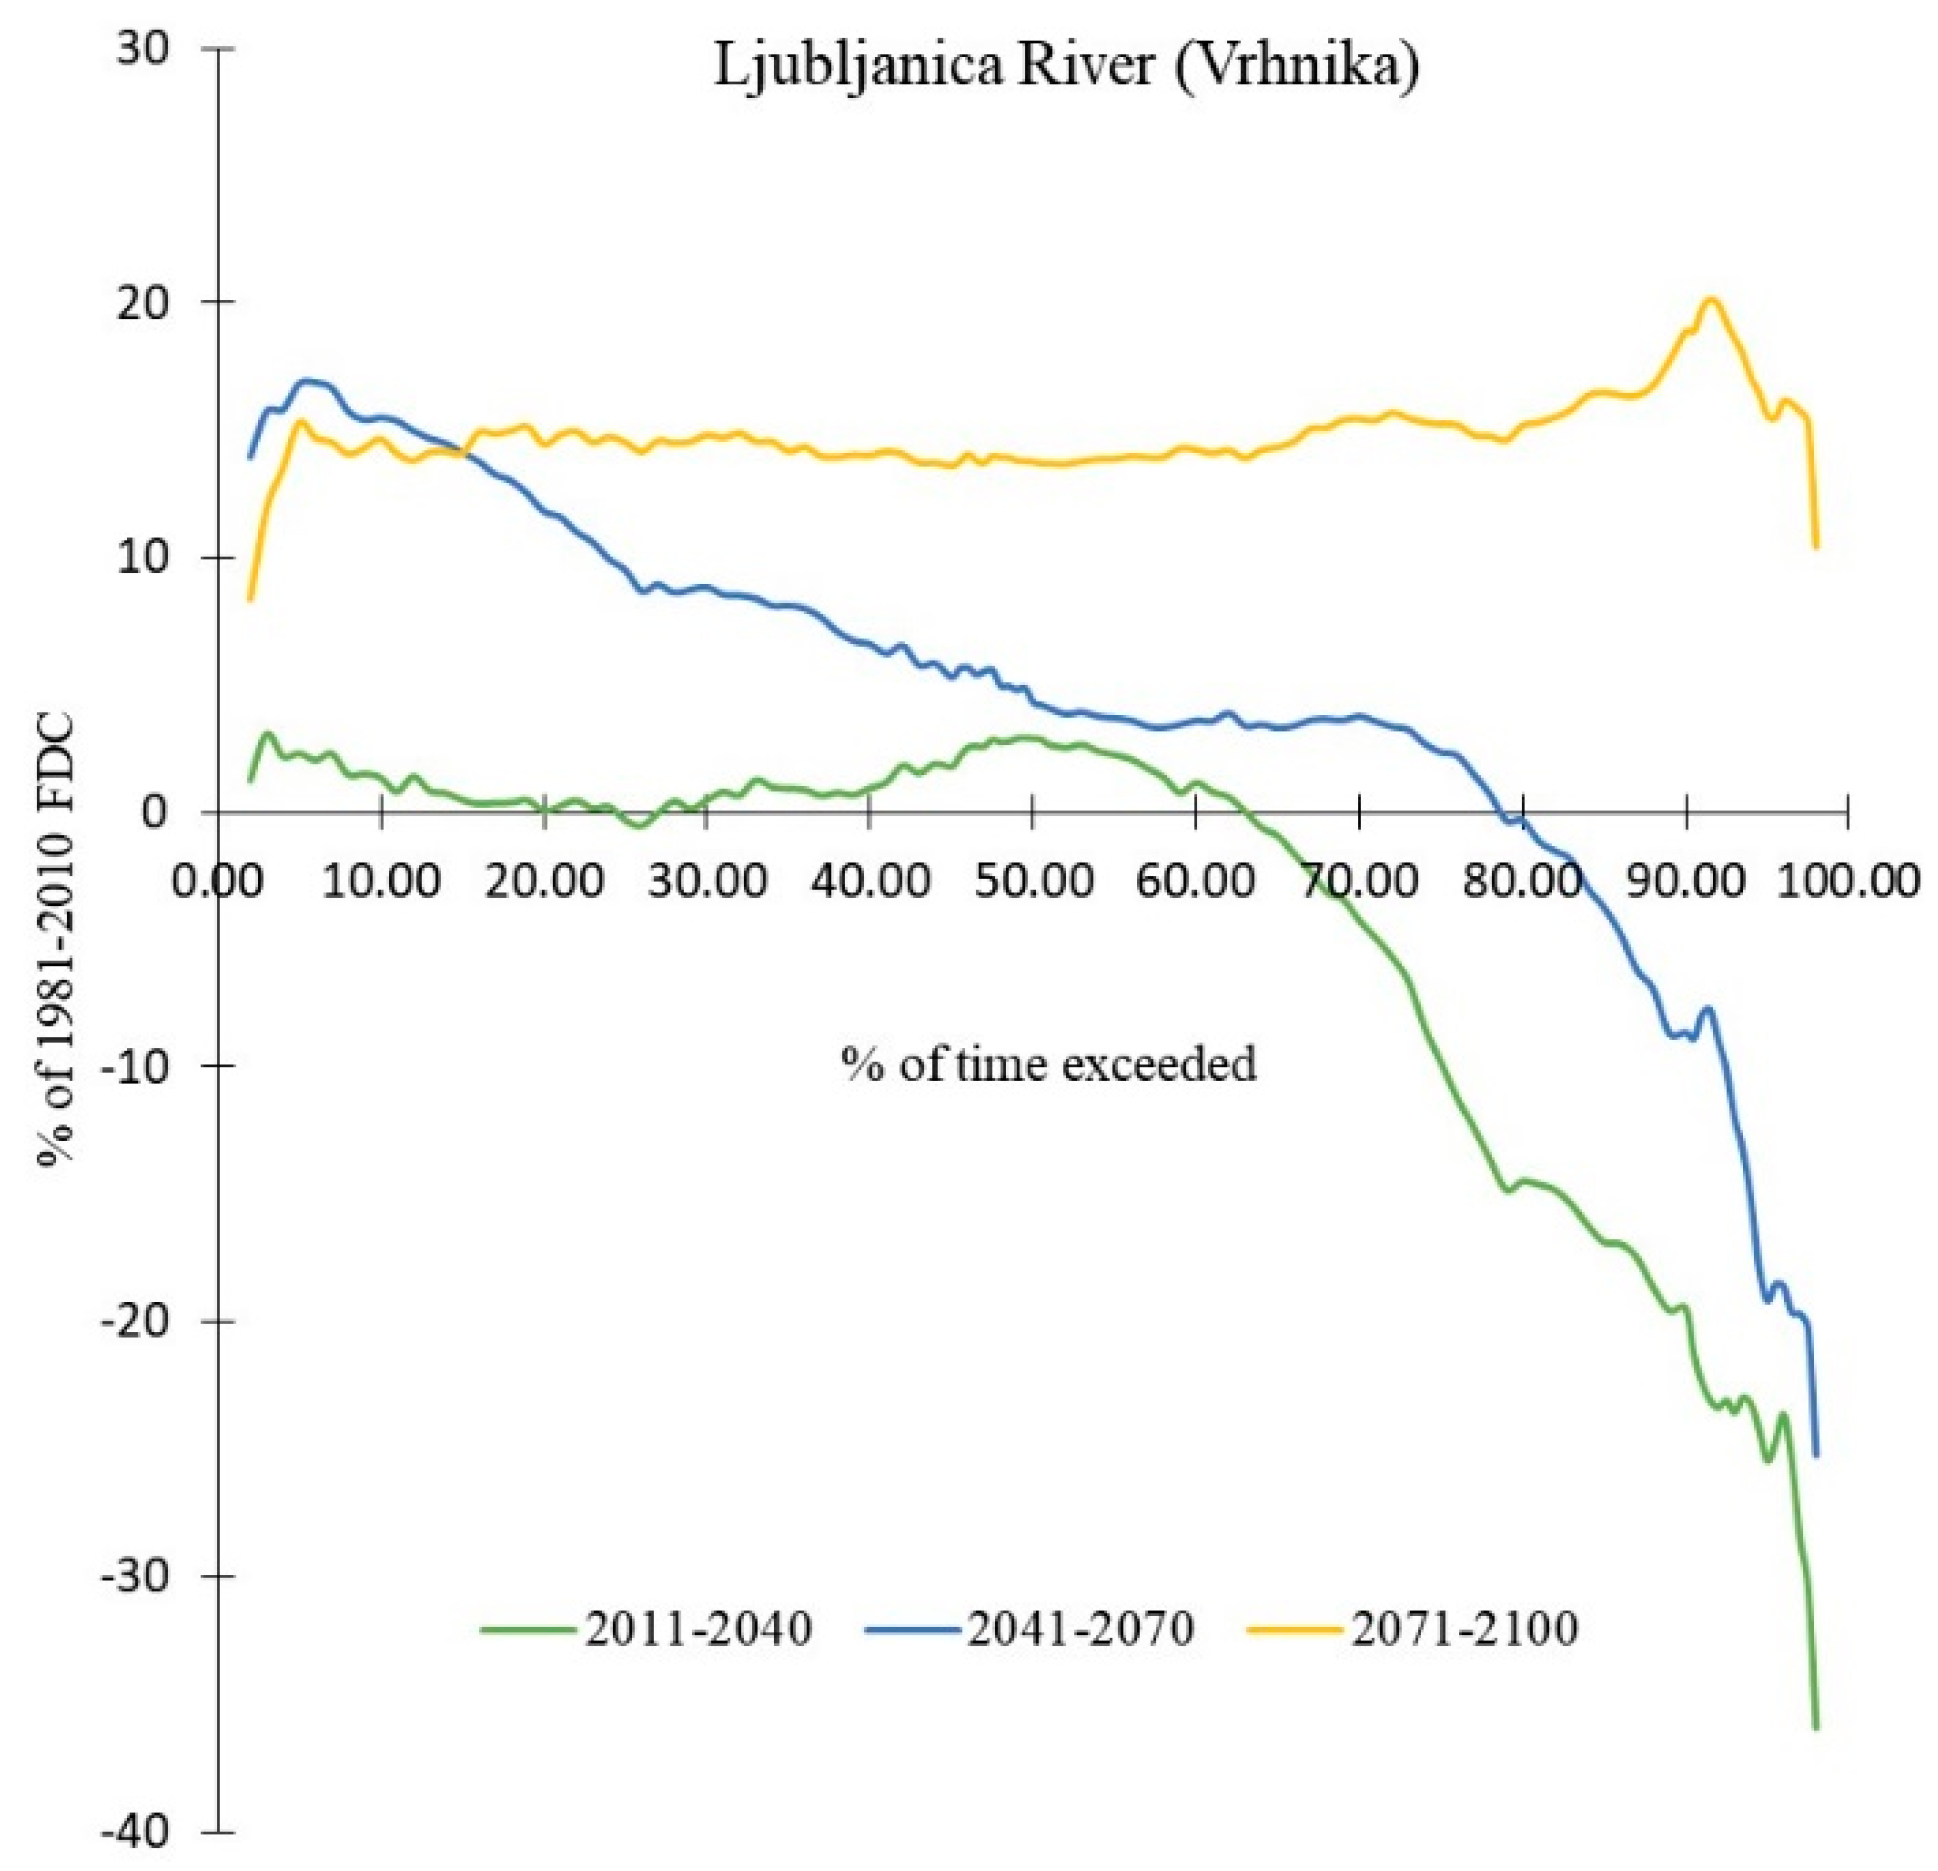
Figure 5 shows results for the low-flow investigation of the Ljubljanica River (Vrhnika station). One can notice that both MAM7 and MAM30 decrease for the periods of 2011–2040 and 2041–2070 (i.e., median value). For the last 30-years period of the 21st century, the MAM7 and MAM30 are projected to increase. This indicates that in periods with less rain, one can expect longer and more significant low-flow conditions (except for the 2071–2100 period). This conclusion is further confirmed by the Q95, which is projected to decrease in two of the three investigated 30-year periods (i.e., median case). This means that the flow duration curve shown in Figure 3 could change in the future. Based on the simulated daily flow data from the five models that were used in this study, the changes between the reference (1981–2010) and the future (2011–2040, 2041–2070, 2071–2100) flow duration curves were determined (Figure 6). A similar conclusion was also made by [65], who found that Q95 could decrease by up to 20% for the south-eastern part of Austria for the 2021–2050 period compared to the 1978–2007 period. However, for the Alps, an increase in the range of 10% to 30% could be expected [65].
Changes in the flow duration curves for the Vrhnika gauging station confirm that based on the predictions used in this study, one could expect that the greatest changes in the hydrological cycle will be seen primarily in the decline of low-flow values, especially for the 2011–2070 period. This kind of behavior is manly driven by the precipitation decrease [50] in summer months when karst rivers in a temperate continental climate often have lowest discharge values. [45,50] indicated that summer precipitation could decrease in the periods of 2011–2040 and 2041–2070 compared to the reference period (i.e., 1981–2010) while precipitation could increase in summer for the 2071–2100 period compared to the reference period. Thus, this leads to different FDC dynamics in the period of 2071–2100 compared to the other two periods (Figure 5). Thus, a precipitation decrease could result in a lower summer discharge value, which could influence the water abundance and vulnerability of karst rivers. However, looking at the minimum and maximum values shown in Figure 5, one can notice that low-flow characteristics could either significantly decrease (e.g., Q95 of more than 30% in the period of 2011–2040) or even increase in the future (e.g., period 2071–2100). [65] stated that the total uncertainty in the Q95 for some catchments can exceed 60%.
Looking at the seasonality characteristics of the investigated future periods, one can notice that the minimum discharge could shift for a few weeks from mid-summer to late-summer (D in Figure 5). However, the minimum option indicates a shifting of the lowest discharge values in the opposite direction (i.e., towards July). Moreover, the strength of seasonality could become either more or less significant. No clear pattern could be detected for the median values reported in Figure 5. Similarly, [65] also found that the seasonality pattern varies among different climate scenarios. Furthermore, investigated climate models also projected a decrease in the SR for all three period (Figure 5). This could mean either that will increase or that will decrease. The latter option is more likely since Q95 is also projected to decrease. Further, the lowest discharge value in karst areas in Slovenia in the temperate continental climate usually occur in the summer period.
The low-flow analysis shows a general increase in the Q50 value in the future until the year 2100 (Figure 5). Taking into consideration a decrease of low flows, this means that mean and high flows are expected to increase in the future, which could result in more frequent extreme flood events. This conclusion can be mostly confirmed by looking at the results presented in Figure 5 (i.e., median option). For the discharge with a 10-year return period, the climate models project an increase for all three investigated periods while for the 50- and 100-year discharge an increase is projected for the 2011–2040 and 2041–2070 periods. On the other hand, a decrease in the design discharge value is expected for the 2071–2100 period compared to the 1981–2010 period (Figure 5). Some studies that were included in the review made by [5] also found that 10-year or 100-year floods are expected to increase (e.g., France, Germany, Slovakia). For some of these cases, the projected increase was larger than for the selected case studies presented in this paper (e.g., Slovakia). Moreover, for some other countries, 100-year floods are also expected to decrease in the future (e.g., Finland). However, similar to the low-flow analyses shown in Figure 5, for the FFA, one can also notice relatively large differences among the investigated models (i.e., minimum and maximum values). A similar conclusion can also be made based on the review made by [5]. This means that the magnitude of extreme floods could either increase or decrease in the future in relation to the considered climate change scenario (i.e., we used the RCP4.5 scenario).
3.2.2. Nanoščica River (Mali Otok Station)
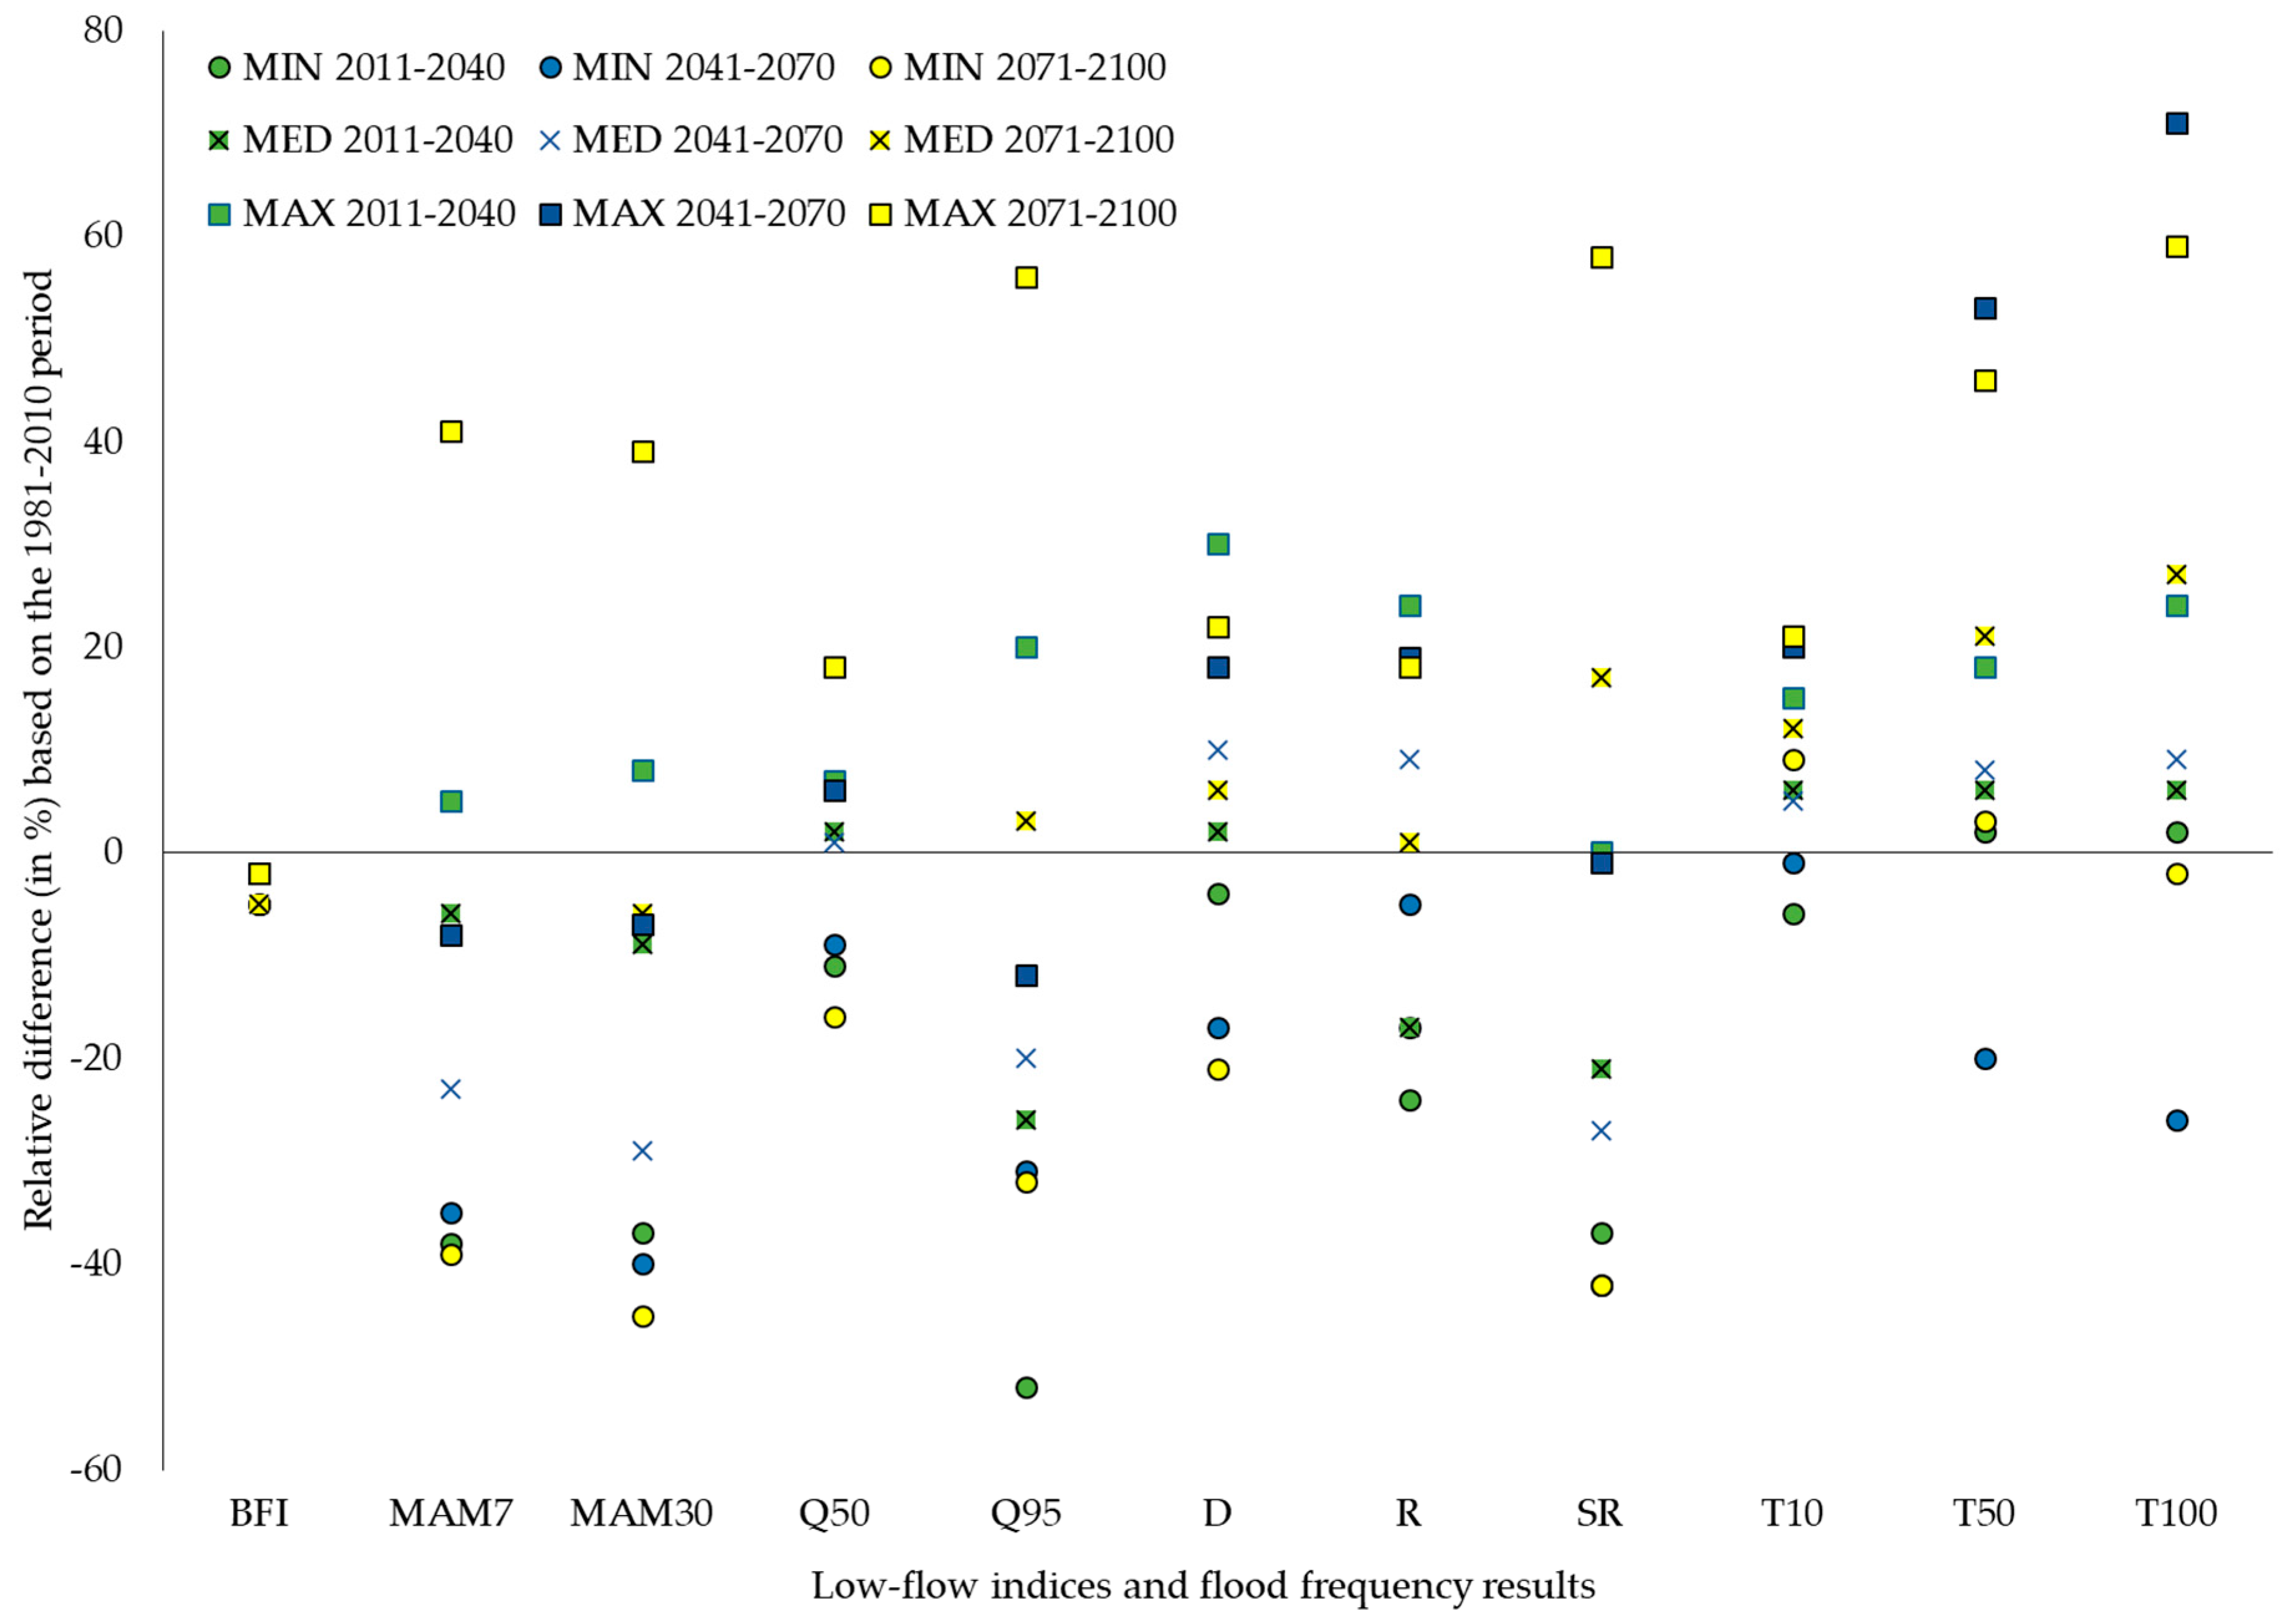
The second investigated study area was the Nanoščica River catchment, which is much smaller than the Ljubljanica River catchment upstream of the Vrhnika water station. One could assume that any potential climate change impact would be more pronounced in the case of a smaller catchment, which has less underground storage and a shorter hydrological response to the rainfall events. Moreover, hydrological processes on a larger scale are also more mixed compared to small catchments, such as the Nanoščica River catchment. Figure 7 shows the investigation of the low-flow and seasonality indices for the three investigated periods using the five tested climate models. The value of BFI could decrease by 2% to 5% in the future (Figure 7), which could be related to the anticipated prolonged dry periods and more frequent extreme flood events. The median values of MAM7 and MAM30 indicate a decrease in low flows for the 2011–2070 period with the lowest values in the period of 2040–2071. Similar results were also obtained for the larger Ljubljanica River case study. Moreover, a low flow decrease in the 2041–2070 period is also observed at maximum values (Figure 7). The decrease of low flows is also confirmed by the Q95, where the lowest median values are expected in the first period (2011–2040).
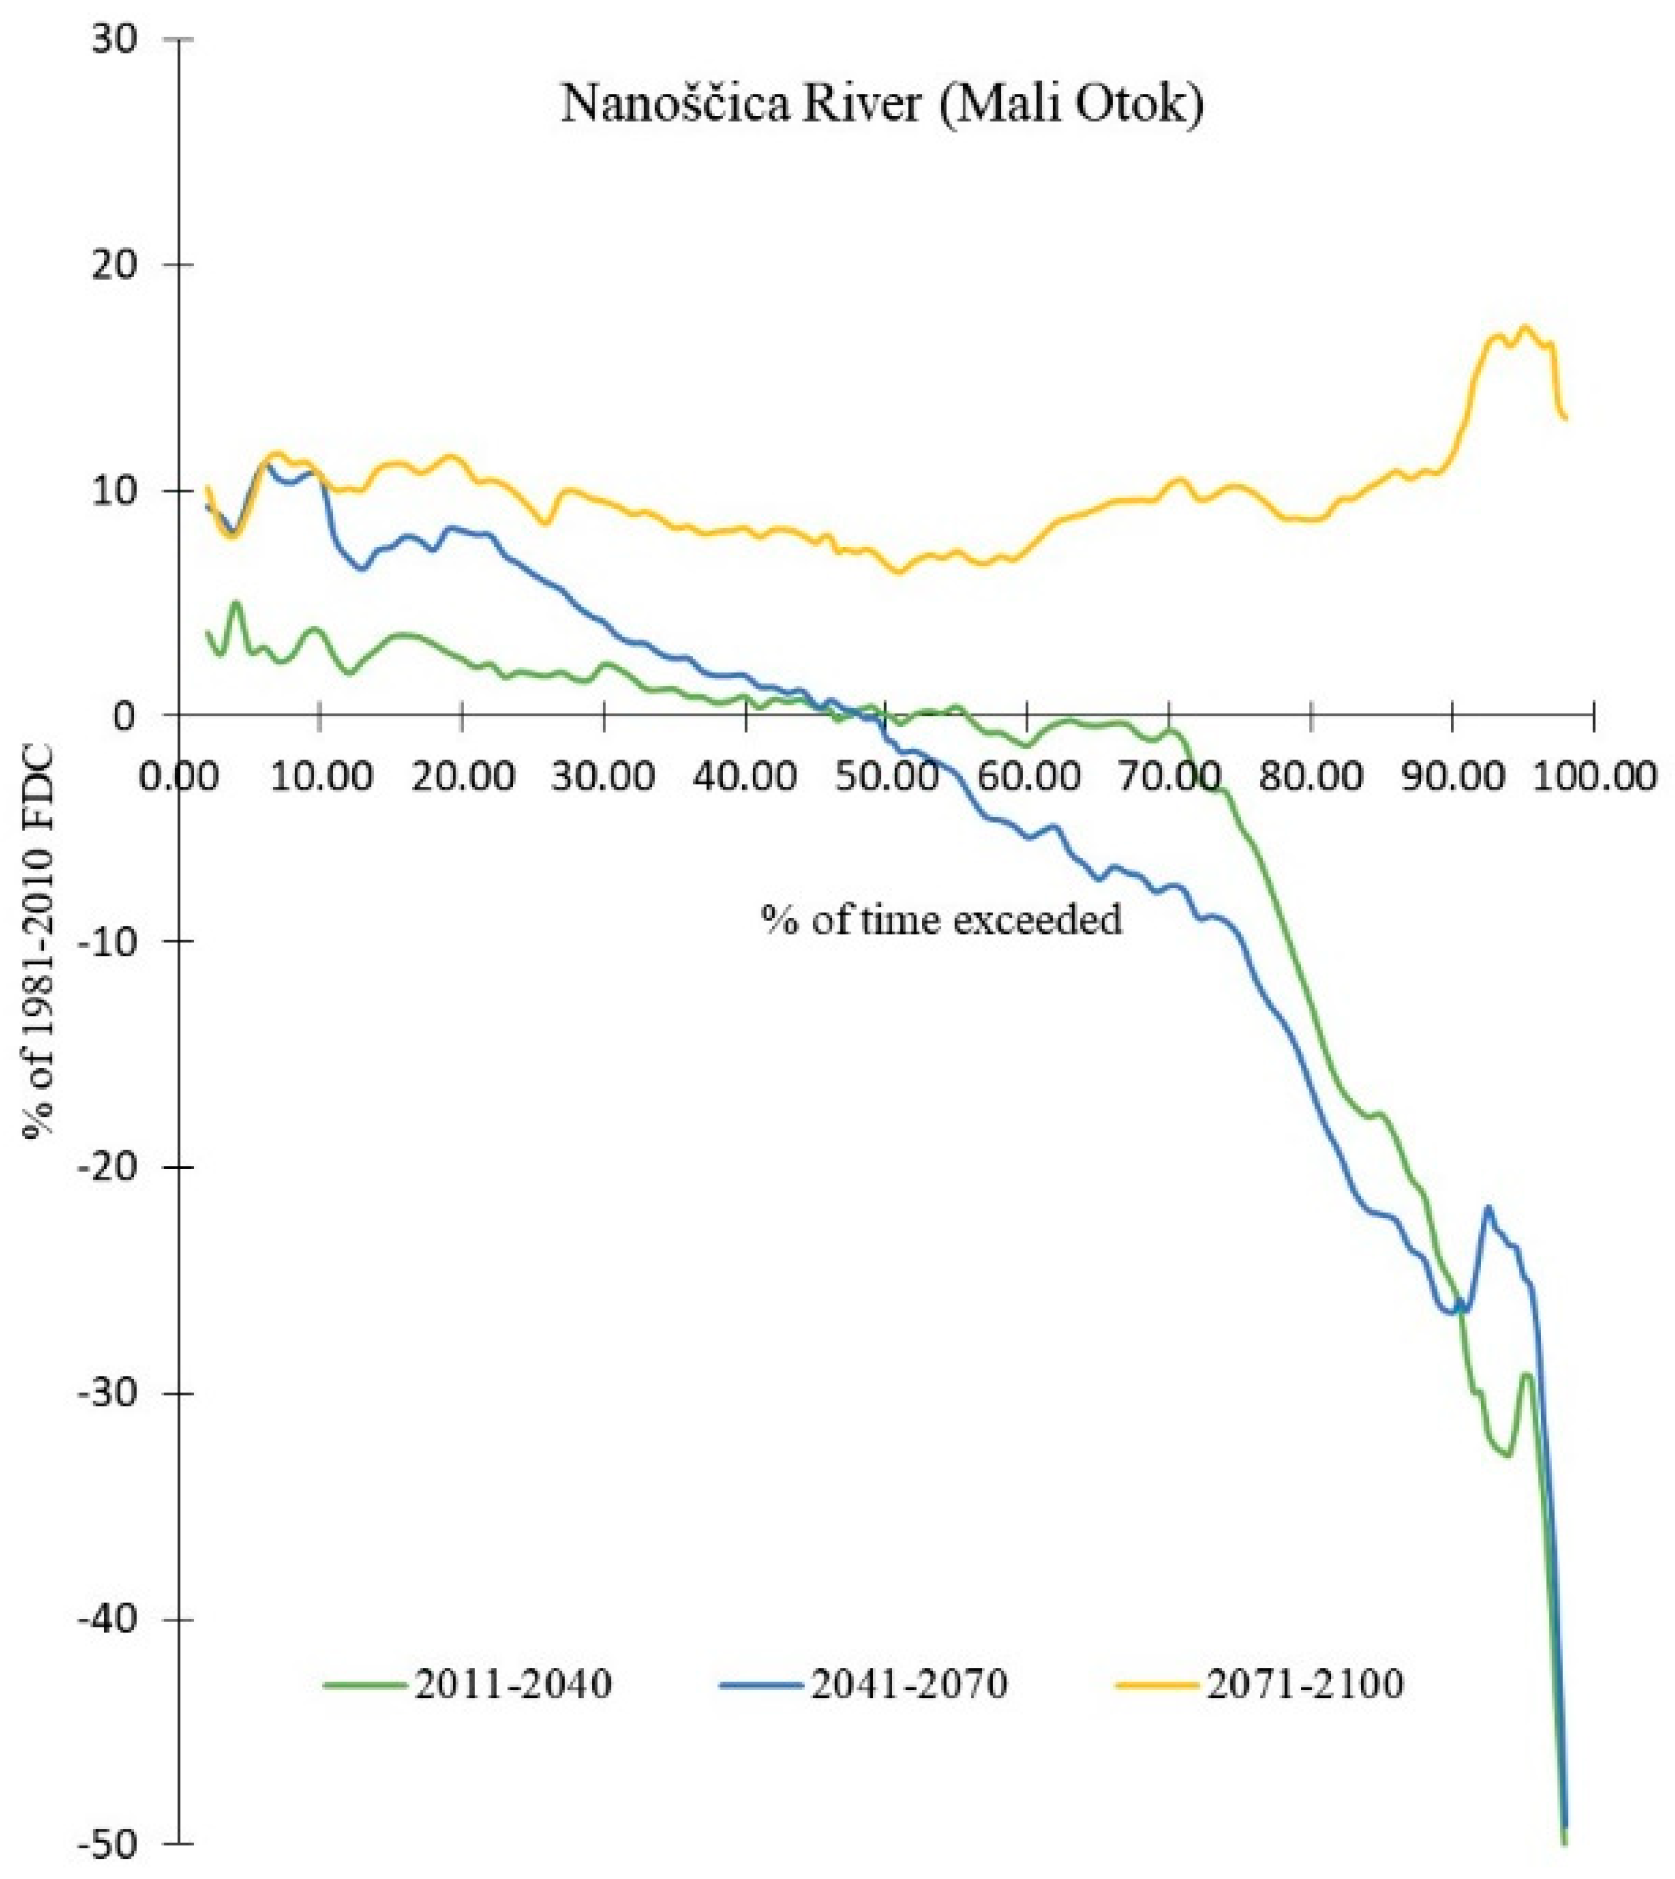
Similar to for the Ljubljanica River case study, the expected decrease of low flows can be attributed to the prediction of the decreased precipitation amount. In the periods of 2011–2040 and 2041–2070, the predicted change in the precipitation amount at the annual level is between –5% and 5% [50]. Furthermore, the range between the minimum and maximum values of MAM7, MAM30, and Q95 is large. Compared to the Ljubljanica River, the decrease in the MAM7, MAM30, and Q95 is slightly larger, which could confirm the hypothesis that smaller streams are more vulnerable compared to rivers with larger catchment areas. Just as we did for the Vrhnika gauging station on the Ljubljanica River, we also compared the predicted flow duration curves of Nanoščica River for three future periods with the flow duration curve of the reference period. Figure 8 confirms the observations described above based on the low-flow indices. In particular, the last observed period of 2071–2100 should be highlighted, as it shows an increase for the entire discharge value range by approximately 10%. The reason is that precipitation could increase in this period and it is only for this period that we do not have a projected decrease in summer precipitation [45,50].
Similar to the Ljubljanica River, the seasonality analysis indicates that the low-flow period could shift towards autumn for a few weeks and no clear pattern in the strength of the seasonality could be detected by looking at the R parameter (Figure 7). Parajka et al. [65] also pointed out that no clear seasonality shift could be found in Austria, at least not at the country scale. Furthermore, differences among investigated climate models are relatively large, which could also be associated with large uncertainty as indicated by [65]. Moreover, SR could decrease in the future, which probably means that will be smaller (the exception is the 2071–2100 period).
Similarly, as for the Ljubljanica River, the low-flow analysis shown in Figure 7 indicates that Q50 could increase in the future, which could indicate more extreme events since Q95 is also decreasing. While the median values indicate a slight increase in Q50 by 2100, the minimum and maximum values show approximately a 15% change in the negative and positive direction, respectively. Figure 7 also presents FFA results for the Nanoščica River. One can notice that the median values are always positive, which means that the magnitude of extreme events for the Nanoščica River could increase in the future. This increase can be up to 30% for the discharge with the 100-year return period. These results (Figure 5 and Figure 7) indicate that, similar to what has been suggested for some other European countries [5,27,28], in Slovenia, it would also be reasonable to adopt adjustment factors that incorporate a consideration of climate change impacts in water management decision making guidelines. For our case studies, these could range up to 30%. However, additional investigation should be carried out using data from other catchments in order to confirm this conclusion. A comparison of our results with findings of other studies showed that in some countries (e.g., Slovakia), the projected increase in maximum discharge values is larger than in both of our study cases [5]. On the other hand, the 10-year flood in France does not significantly change (up to 10%) [5], which is similar to that presented for Nanoščica River. Compared to the larger Ljubljanica River case, extreme floods for the Nanoščica River could increase in all three future periods for T10, T50, and T100 (Figure 7).
Land cover and climate change (variability) effects on floods and low flows are strongly controlled by the flow paths in catchment systems that differ in their time scales and the degree of connectivity [66]. One of the key questions is how does land use change and climate change (variability) modify flow pathways, storage, and consequently also water resource vulnerability. Due to the high complexity and heterogeneity of flow pathways in karst catchments, the impact of climate change on the low-flow dynamics in karst catchments might be controlled by different factors, but one of the most important is undoubtedly the quantity and temporal distribution of rainfall. In our case, climate change impact on low-flow dynamics, and most likely also on storage, seems to be more pronounced at catchments of small size such as the Nanoščica River catchment, which has smaller groundwater storage and shorter transit times. According to the modelling result, we could expect changed dynamics (e.g., longer periods) of discharge intermittence due to changed temporal precipitation patterns. This might not only be problematic solely from the water quantity point of view (availability of water for different uses), but also from the view of changed ecological functions and ecosystem services that a stream channel can provide.
4. Conclusions
The presented paper investigated climate change impact on the low- and high-flow conditions for two karst rivers in Slovenia. The smaller Nanoščica River (catchment area of about 50 km2; Mali otok station) and larger Ljubljanica River (catchment area of more than 1000 km2, Vrhnika station) were selected. CemaNeige GR6J and GR6J models were used for the rainfall-runoff modelling of these two catchments. Both hydrological models were calibrated using measured discharge, rainfall, evapotranspiration, and air temperature data. Using climate change scenario RCP4.5, we investigated the hydrological situation in periods of 2011–2040, 2041–2070, and 2071–2100 compared with the 1981–2010 period. Five climate models are selected. Based on the presented results the following conclusions can be made:
- A summer precipitation decrease (i.e., 2011–2040 and 2041–2070) could result in lower summer discharge values, which is in our analysis confirmed with the investigation of the MAM7, MAM30, and Q95 indices. This could mean that the vulnerability of karst rivers will increase in the future, which could, for example, impact groundwater availability in this area or ecosystem services that a stream channel can provide. Therefore, special emphasis should be given to the water resource management in karst areas in the future due to the potential climate change impact. This applies for both the small and large catchments that were investigated in this study.
- Investigation of the seasonality characteristics indicates that a slightly changed low-flow seasonal pattern. However, the strength of seasonality is not expected to either significantly decrease or increase.
- Q50 and Qmean could increase in the future, which means that the magnitude of extreme events could also increase since the low flows are expected to decrease. This was also confirmed with the FFA results for both investigated case studies. Similarly, as in other EU countries, climate change adjustment factors should be used in engineering practice when designing different hydro-technical structures, such as dams or levees, taking into account climate change impacts. This conclusion is valid for small and large catchments with no clear and significant difference between two investigated cases.
- Related to the use of different climate models and projections, there is an inevitable high uncertainty in the climate change projections. Consequently, there is huge variability among the five investigated climate models for the RCP4.5 scenario for both high and low-flows. Despite the fact that the above mentioned conclusions were drawn based on the median value of five models, there is undoubtedly still a high uncertainty present and future situations could be different than the calculated situation based on the median value. Thus, further investigation is needed in order to investigate the future climate situation and its impact on the hydrological conditions in karst areas.
Author Contributions
K.S., A.M., S.R. and N.B. drafted the manuscript and determined the aims of the research; A.M. carried out downscaling and bias correction of climate models; N.B. calibrated hydrological model and calculated runoff using climate data; K.S. carried out low-flow analyses. All authors contributed to the interpretation of the results, manuscript writing and revision.
Funding
The results of the study are part of the research project J2-7322 “Modelling hydrologic response of nonhomogeneous catchments”, research programme P2-0180 “Water Science and Technology, and Geotechnical Engineering: Tools and Methods for Process Analyses and Simulations, and Development of Technologies”, and PhD grant of the first author (K. Sapač) that are financed by the Slovenian Research Agency (ARRS). N. Bezak would also like to acknowledge funding by the World Federation of Scientists (WFS).
Acknowledgments
The critical and useful comments of anonymous reviewers improved this work, for which the authors are very grateful.
Conflicts of Interest
The authors declare no conflict of interest.
References
- Blöschl, G.; Hall, J.; Parajka, J.; Perdigão, R.A.; Merz, B.; Arheimer, B.; Aronica, G.T.; Bilibashi, A.; Bonacci, O.; Borga, M.; et al. Changing climate shifts timing of European floods. Science 2017, 357, 588–590. [Google Scholar] [CrossRef]
- Bonacci, O. Karst hydrogeology/hydrology of dinaric chain and isles. Environ. Earth Sci. 2015, 74, 37–55. [Google Scholar] [CrossRef]
- Bezak, N.; Brilly, M.; Šraj, M. Flood frequency analyses, statistical trends and seasonality analyses of discharge data: A case study of the Litija station on the Sava River. J. Flood Risk Manag. 2016, 9, 154–168. [Google Scholar] [CrossRef]
- Bormann, H.; Pinter, N.; Elfert, S. Hydrological signatures of flood trends on German rivers: Flood frequencies, flood heights and specific stages. J. Hydrol. 2011, 404, 50–66. [Google Scholar] [CrossRef]
- Madsen, H.; Lawrence, D.; Lang, M.; Martinkova, M.; Kjeldsen, T.R. Review of trend analysis and climate change projections of extreme precipitation and floods in Europe. J. Hydrol. 2014, 519, 3635–3650. [Google Scholar] [CrossRef]
- Šraj, M.; Menih, M.; Bezak, N. Climate variability impact assessment on the flood risk in Slovenia. Phys. Geogr. 2016, 37, 73–87. [Google Scholar] [CrossRef]
- Villarini, G.; Smith, J.A.; Serinaldi, F.; Ntelekos, A.A.; Schwarz, U. Analyses of extreme flooding in Austria over the period 1951–2006. Int. J. Climatol. 2012, 32, 1178–1192. [Google Scholar] [CrossRef]
- Hall, J.; Arheimer, B.; Borga, M.; Brázdil, R.; Claps, P.; Kiss, A.; Kjeldsen, T.R.; Kriaučiūnienė, J.; Kundzewicz, Z.W.; Lang, M.; et al. Understanding flood regime changes in Europe: A state-of-the-art assessment. Hydrol. Earth Syst. Sci. 2014, 18, 2735–2772. [Google Scholar] [CrossRef]
- Do, H.; Westra, S.; Leonard, M. A global-scale investigation of trends in annual maximum streamflow. J. Hydrol. 2017, 552, 28–43. [Google Scholar] [CrossRef]
- Nakićenović, N.; Alcamo, J.; Davis, G.; de Vries, B.; Fenhann, J.; Gaffin, S.; Gregory, K.; Grübler, A.; Jung, T.Y.; Kram, T.; et al. IPCC Special Report on Emissions Scenarios; Cambridge University Press: Cambridge, UK; New York, NY, USA, 2000; 599p. [Google Scholar]
- Meinshausen, M.; Smith, S.J.; Calvin, K.V.; Daniel, J.S.; Kainuma, M.; Lamarque, J.F.; Matsumoto, K.; Montzka, K.A.; Raper, S.C.B.; Riahi, K.; et al. The RCP greenhouse gas concentrations and their extension from 1765 to 2300. Clim. Chang. 2011, 109, 213–241. [Google Scholar] [CrossRef]
- Arnell, N.W.; Gosling, S.N. The impacts of climate change on river flood risk at the global scale. Clim. Chang. 2016, 134, 387–401. [Google Scholar] [CrossRef]
- Dankers, R.; Feyen, L. Flood hazard in Europe in an ensemble of regional climate scenarios. J. Geophys. Res. Atmos. 2009, 114, D16108. [Google Scholar] [CrossRef]
- Feyen, L.; Dankers, R.; Bodis, K.; Salamon, P.; Barredo, J.I. Fluvial flood risk in Europe in present and future climates. Clim. Chang. 2012, 112, 47–62. [Google Scholar] [CrossRef]
- Hirabayashi, Y.; Mahendran, R.; Koirala, S.; Konoshima, L.; Yamazaki, D.; Watanabe, S.; Kim, H.; Kanae, S. Global flood risk under climate change. Nat. Clim. Chang. 2013, 3, 816–821. [Google Scholar] [CrossRef]
- Maurer, E.P.; Kayser, G.; Doyle, L.; Wood, A.W. Adjusting Flood Peak Frequency Changes to Account for Climate Change Impacts in the Western United States. J. Water Resour. Plan. Manag. 2018, 144, 05017025. [Google Scholar] [CrossRef]
- Arnell, N.W.; Gosling, S.N. The impacts of climate change on river flow regimes at the global scale. J. Hydrol. 2013, 486, 351–364. [Google Scholar] [CrossRef]
- Yan, D.; Werners, S.E.; Ludwig, F.; Huang, H.Q. Hydrological response to climate change: The Pearl River, China under different RCP scenarios. J. Hydrol. Reg. Stud. 2015, 4, 228–245. [Google Scholar] [CrossRef]
- Bonacci, O. Karst hydrology and water resources—Past, present and future. In Water for the Future: Hydrology in Perspective, Proceedings of the Rome Symposium, Rome, Italy, 27–29 April 1987; IAHS Publication: Wallingford, UK, 1987; pp. 205–213. [Google Scholar]
- Ford, D.C.; Williams, P.W. Karst Hydrogeology and Geomorphology; Wiley: Chichester, UK, 2007. [Google Scholar]
- Hartmann, A.; Goldscheider, N.; Wagener, T.; Lange, J.; Weiler, M. Karst water resources in a changing world: Review of hydrological modelling approach. Rev. Geophys. 2014, 52, 218–242. [Google Scholar] [CrossRef]
- Pellicer-Martínez, F.; Martínez-Paz, J.M. Climate change effects on the hydrology of the headwaters of the Tagus River: Implications for the management of the Tagus-Segura transfer. Hydrol. Earth Syst. Sci. 2018, 22, 6473–6491. [Google Scholar] [CrossRef]
- Cooperation in Science and Technology (COST). COST 65: Hydrogeological Aspects of Groundwater Protection in Karstic Areas; Final Report (COST Action 65) Rep.; COST: Brussels, Belgium, 1995; 446p. [Google Scholar]
- Bezak, N.; Brilly, M.; Šraj, M. Comparison between the peaks-over-threshold method and the annual maximum method for flood frequency analysis. Hydrol. Sci. J. 2014, 59, 959–977. [Google Scholar] [CrossRef]
- Lang, M.; Ouarda, T.B.M.J.; Bobee, B. Towards operational guidelines for over-threshold modelling. J. Hydrol. 1999, 225, 103–117. [Google Scholar] [CrossRef]
- Karmakar, S.; Simonovic, S.P. Bivariate flood frequency analysis: Part 1. Determination of marginals by parametric and nonparametric techniques. J. Flood Risk Manag. 2008, 1, 190–200. [Google Scholar] [CrossRef]
- Defra. Flood and Coastal Defence Appraisal Guidance (FCDPAG3), Economic Appraisal Supplementary Note to Operating Authorities—Climate Change Impacts; Department for Environment, Food and Rural Affairs: London, UK, 2006; 9p. [Google Scholar]
- Boukhris, O.; Willems, P. Climate change impact on hydrological extremes along rivers in Belgium. In Risk Management: Research and Practice, Proceedings of FloodRisk 2008 Conference, Oxford, UK, 30 September–2 October 2008; Samuels, P., Huntington, S., Allsop, W., Harrop, J., Eds.; Flood Taylor & Francis Group: London, UK, 2008; pp. 1083–1091. [Google Scholar]
- World Meteorological Organization (WMO). Manual of Low-flow Estimation and Prediction; Operational Hydrology Report No. 50. (WMO-No. 1029); WMO: Geneva, Switzerland, 2009; 136p. [Google Scholar]
- Laaha, G.; Blöschl, G. Seasonality indices for regionalizing low flows. Hydrol. Process. 2006, 20, 3851–3878. [Google Scholar] [CrossRef]
- Kovačič, G.; Ravbar, N. Characterisation of selected karst springs in Slovenia by means of a time series analysis. In Karst without Boundaries; Stevanović, Z., Krešič, N., Kukurić, N., Eds.; CRC Press: Boca Raton, FL, USA, 2016. [Google Scholar]
- Ravbar, N.; Barberá, J.A.; Petric, M.; Kogovsek, J.; Andreo, B. The study of hydrodynamic behaviour of a complex karst system under low-flow conditions using natural and artificial tracers (the catchment of the Unica River, SW Slovenia). Environ. Earth Sci. 2012, 65, 2259–2272. [Google Scholar] [CrossRef]
- Maček, U.; Bezak, N.; Šraj, M. Reference evapotranspiration changes in Slovenia, Europe. Agric. For. Meteorol. 2018, 260–261, 183–192. [Google Scholar] [CrossRef]
- Habič, P.; Kos, V. Reference Karst. In The Encyclopedia of Slovenia; Mladinska Knjiga: Ljubljana, Slovenia, 1987. [Google Scholar]
- Perrin, C.; Michel, C.; Andreassian, V. Improvement of a parsimonious model for streamflow simulation. J. Hydrol. 2003, 279, 275–289. [Google Scholar] [CrossRef]
- Pushpalatha, R.; Perrin, C.; Le Moine, N.; Mathevet, T.; Andreassian, V. A downward structural sensitivity analysis of hydrological models to improve low-flow simulation. J. Hydrol. 2011, 411, 66–76. [Google Scholar] [CrossRef]
- Valery, A.; Andreassian, V.; Perrin, C. As simple as possible but not simpler: What is useful in a temperature-based snow-accounting routine? Part 1—Comparison of six snow accounting routines on 380 catchments. J. Hydrol. 2014, 517, 1166–1175. [Google Scholar] [CrossRef]
- Valery, A.; Andreassian, V.; Perrin, C. As simple as possible but not simpler: What is useful in a temperature-based snow-accounting routine? Part 2—Sensitivity analysis of the cemaneige snow accounting routine on 380 catchments. J. Hydrol. 2014, 517, 1176–1187. [Google Scholar] [CrossRef]
- Coron, L.; Perrin, C.; Michel, C. airGR: Suite of GR Hydrological Models for Precipitation-Runoff Modelling. R Package Version 1.0.9.64. 2017. Available online: https://webgr.irstea.fr/en/airGR/ (accessed on 17 April 2019).
- Coron, L.; Thirel, G.; Delaigue, O.; Perrin, C.; Andreassian, V. The suite of lumped gr hydrological models in an R package. Environ. Model. Softw. 2017, 94, 166–171. [Google Scholar] [CrossRef]
- Sezen, C.; Bezak, N.; Šraj, M. Hydrological modelling of the karst Ljubljanica River catchment using lumped conceptual model. Acta Hydrotech. 2018, 31, 87–100. [Google Scholar] [CrossRef]
- Krysanova, V.; Donnelly, C.; Gelfan, A.; Gerten, D.; Arheimer, B.; Hattermann, F.; Kundzewicz, Z.W. How the performance of hydrological models relates to credibility of projections under climate change. Hydrol. Sci. J. 2018, 63, 696–720. [Google Scholar] [CrossRef]
- Michel, C. Hydrologie appliquée aux petits bassins ruraux. In Hydrology Handbook; Cemagref: Antony, France, 1991. (In French) [Google Scholar]
- Nash, J.E.; Sutcliffe, J.V. River flow forecasting through conceptual models part I—A discussion of principles. J. Hydrol. 1970, 10, 282–290. [Google Scholar] [CrossRef]
- Bertalanič, R.; Dolinar, M.; Draksler, A.; Honzak, L.; Kobold, M.; Kozjek, K.; Lokošek, N.; Medved, A.; Vertačnik, G.; Vlahovič, Ž.; et al. Assessment of Climate Change in Slovenia Until the End of the 21st Century. Synthesis Report, Part 1; Slovenian Environment Agency: Ljubljana, Slovenia, 2018; 156p, (In Slovenian). Available online: http://www.meteo.si/uploads/probase/www/climate/text/sl/publications/OPS21_Porocilo.pdf (accessed on 17 April 2019).
- Benestad, R.; Haensler, A.; Hennemuth, B.; Illy, T.; Jacob, D.; Keup-Thiel, E.; Kotlarski, S.; Nikulin, G.; Otto, J.; Rechid, D.; et al. Guidance for EURO-CORDEX Climate Projections Data Use. 2018. Available online: https://www.euro-cordex.net/imperia/md/content/csc/cordex/euro-cordex-guidelines-version1.0-2017.08.pdf (accessed on 17 April 2019).
- Gudmundsson, L. Package “qmap”. 2016. Available online: https://cran.r-project.org/web/packages/qmap/qmap.pdf (accessed on 17 April 2019).
- Gudmundsson, L.; Bremnes, J.; Haugen, J.; Engen-Skaugen, T. Technical Note: Downscaling RCM precipitation to the station scale using statistical transformations—A comparison of methods. Hydrol. Earth Syst. Sci. 2012, 8, 3383–3390. [Google Scholar] [CrossRef]
- Cannon, A.J. Package “MBC”. 2018. Available online: https://cran.r-project.org/web/packages/MBC/MBC.pdf (accessed on 17 April 2019).
- ARSO. Assessment of Climate Change in Slovenia Until the End of the 21st Century; Slovenian Environment Agency: Ljubljana, Slovenia, 2017; (In Slovenian). Available online: http://meteo.arso.gov.si/uploads/probase/www/climate/text/sl/publications/povzetek-podnebnih-sprememb-temp-pad.pdf (accessed on 17 April 2019).
- Dolšak, D.; Bezak, N.; Šraj, M. Temporal characteristics of rainfall events under three climate types in Slovenia. J. Hydrol. 2016, 541, 1395–1405. [Google Scholar] [CrossRef]
- Smakhtin, V.U. Low flow hydrology—A review. J. Hydrol. 2001, 240, 147–186. [Google Scholar] [CrossRef]
- Koffler, D.; Gauster, T.; Laaha, G. lfstat: Calculation of Low Flow Statistics for Daily Stream Flow Data. R Package Version 0.9.4. 2016. Available online: https://CRAN.R-project.org/package=lfstat (accessed on 17 April 2019).
- R Core Team. R: A Language and Environment for Statistical Computing; R Foundation for Statistical Computing: Vienna, Austria, 2018; Available online: https://www.R-project.org/ (accessed on 17 April 2019).
- Burn, D.H. Catchment similarity for regional flood frequency analysis using seasonality measures. J. Hydrol. 1997, 202, 212–230. [Google Scholar] [CrossRef]
- Petek, M.; Kobold, M.; Šraj, M. Low-flow analysis of streamflows in Slovenia using R software and lfstat package. Acta Hydrotech. 2014, 27, 13–28. [Google Scholar]
- Gustard, A.; Bullock, A.; Dixon, J.M. Low Flow Estimation in the United Kingdom; IH Report No.108; Institute of Hydrology: Wallingford, UK, 1992; 88p. [Google Scholar]
- Bat, M.; Dolinar, M.; Frantar, P.; Hrvatin, M.; Kobold, M.; Kurnik, B.; Nadbath, M.; Ožura, V.; Uhan, J.; Ulaga, F. Water Balance of Slovenia 1971–2000; Slovenian Environment Agency: Ljubljana, Slovenia, 2008; 119p. [Google Scholar]
- Bormann, H.; Pinter, N. Trends in low flows of German rivers since 1950: Comparability of different low-flow indicators and their spatial patterns. River Res. Appl. 2017, 33, 1191–1204. [Google Scholar] [CrossRef]
- Hosking, J.R.M.; Wallis, J.R. Regional Frequency Analysis: An Approach Based on L-Moments; Cambridge University Press: Cambridge, UK, 2005; 224p. [Google Scholar]
- Salinas, J.L.; Castellarin, A.; Viglione, A.; Kohnová, S.; Kjeldsen, T.R. Regional parent flood frequency distributions in Europe—Part 1: Is the GEV model suitable as a pan-European parent? Hydrol. Earth Syst. Sci. 2014, 18, 4381–4389. [Google Scholar] [CrossRef]
- Maidment, D. Handbook of Hydrology; McGrow-Hill: New York, NY, USA, 1993; 1424p. [Google Scholar]
- Moriasi, D.N.; Arnold, J.G.; Van Liew, M.W.; Binger, R.L.; Harmel, R.D.; Veith, T. Model evaluation guidelines for systematic quantification of accuracy in watershed simulations. Trans. ASABE 2007, 50, 885–900. [Google Scholar] [CrossRef]
- Van Esse, W.R.; Perrin, C.; Booij, M.J.; Augustijn, D.C.M.; Fenecia, F.; Kavetski, D.; Lobligeois, F. The influence of conceptual model structure on model performance: A comparative study for 237 French catchments. Hydrol. Earth Syst. Sci. 2013, 17, 4227–4239. [Google Scholar] [CrossRef]
- Parajka, J.; Blaschke, A.P.; Blöschl, G.; Haslinger, K.; Hepp, G.; Laaha, G.; Schöner, W.; Trautvetter, H.; Viglione, A.; Zessner, M. Uncertainty contributions to low-flow projections in Austria. Hydrol. Earth Syst. Sci. 2016, 20, 2085–2101. [Google Scholar] [CrossRef]
- Blöschl, G.; Ardoin-Bardin, S.; Bonell, M.; Dorninger, M.; Goodrich, D.; Gutknecht, D.; Matamoros, D.; Shand, P.; Szolgay, J. At what scales do climate variability and land cover change impact on flooding and low flows? Hydrol. Process. 2007, 21, 1241–1247. [Google Scholar] [CrossRef]
Figure 1.
Location of the Ljubljanica River (Vrhnika station; green circle) and Nanoščica River (Mali otok station; green circle) catchments on a map of Slovenia and locations of the rainfall gauging stations (black circles) used.
Figure 1.
Location of the Ljubljanica River (Vrhnika station; green circle) and Nanoščica River (Mali otok station; green circle) catchments on a map of Slovenia and locations of the rainfall gauging stations (black circles) used.

Figure 2.
Quantile-quantile (Q-Q) plots of observations against model data for the precipitation (a), air temperature (b), and evapotranspiration (c) data during the reference period, 1981–2010, for the grid cell which contains a Ljubljana-Bežigrad meteorological station. Red dots represent bias-corrected (BC) data, black dots represent raw model data. BC values adjust better to observations than raw model data. It should be noted that we did not apply BC on station values, but on interpolated values in the model grid.

Figure 3.
Hydrological modelling results using the CemaNeige GR6J model for the Vrhnika station on the Ljubljanica River for the calibration period (1982–2010; 1981 is used for model warm-up).
Figure 3.
Hydrological modelling results using the CemaNeige GR6J model for the Vrhnika station on the Ljubljanica River for the calibration period (1982–2010; 1981 is used for model warm-up).

Figure 4.
Hydrological modelling results using the GR6J model for the Mali Otok station on the Nanoščica River for the calibration period (2001–2010; 2000 is used for model warm-up).
Figure 4.
Hydrological modelling results using the GR6J model for the Mali Otok station on the Nanoščica River for the calibration period (2001–2010; 2000 is used for model warm-up).

Figure 5.
Low-flow indices and flood frequency results (T10, T50, T100 are discharge with 10, 50, and 100-year return period, respectively) for the periods of 2011–2040, 2041–2070, and 2071–2100 for the Vrhnika gauging station (Ljubljanica River). All values are given as a relative difference (in %) based on the 1981–2010 period. Five climate models were investigated and the minimum, median, and maximum values of these five models (RCP4.5 scenario was used) are shown. Different colors represent different 30-year periods and different symbols (i.e., circle, cross, and rectangle) represent the minimum, mean, and maximum values.

Figure 6.
Flow duration curve (Q2–Q98) comparison for the three investigated periods where the median curve is shown for the Vrhnika station (Ljubljanica River).
Figure 6.
Flow duration curve (Q2–Q98) comparison for the three investigated periods where the median curve is shown for the Vrhnika station (Ljubljanica River).

Figure 7.
Low-flow indices and flood frequency results (T10, T50, T100 are discharge with a 10, 50, and 100-year return period, respectively) for the periods of 2011–2040, 2041–2070, and 2071–2100 for the Mali otok gauging station (Nanoščica River). All values are given as a relative difference (in %) based on the 1981–2010 period. Five climate models (RCP4.5 scenario was used) were investigated and the minimum, median, and maximum values of these five models are shown. Different colors represent different 30-year periods and different symbols (i.e., circle, cross, and rectangle) represent the minimum, mean, and maximum values.

Figure 8.
Flow duration curve (Q2–Q98) comparison for the three investigated time periods where the median curve is shown for the Mali otok station (Nanoščica River).
Figure 8.
Flow duration curve (Q2–Q98) comparison for the three investigated time periods where the median curve is shown for the Mali otok station (Nanoščica River).


Table 1.
Basic characteristics of the selected case studies and basic characteristics of the discharge series (Q) that were used for the model calibration.
Table 1.
Basic characteristics of the selected case studies and basic characteristics of the discharge series (Q) that were used for the model calibration.
| Gauging Station | Vrhnika | Mali Otok |
|---|---|---|
| River | Ljubljanica | Nanoščica |
| Catchment area (km2) | 1135 | 51 |
| Mean catchment elevation (m) | 715 | 579 |
| Karst type (defined by [34]) | Mostly dinaric karst | Mostly impermeable surface with underground through the karst edge |
| Calibration period | 1981–2010 | 2000–2010 |
| Q minimum (m3/s) | 1.0 | 0 |
| Q mean (m3/s) | 22.8 | 1.4 |
| Q maximum (m3/s) | 120.5 | 22.3 |
| Q standard deviation (m3/s) | 23.5 | 2.7 |
Table 2.
Basic characteristics of rainfall stations used in the process of model calibration.
| Station Name | Elevation (m.a.s.l.) | Latitude | Longitude | Mean Annual Precipitation (mm) |
|---|---|---|---|---|
| Rovte | 700 | 45.9861 | 14.1734 | 1854 |
| Hotedrščica | 550 | 45.9314 | 14.1389 | 1834 |
| Logatec | 485 | 45.9077 | 14.2032 | 1782 |
| Pokojišče | 716 | 45.8915 | 14.3536 | 1480 |
| Nova vas | 720 | 45.7731 | 14.5094 | 1505 |
| Cerknica | 576 | 45.7956 | 14.3636 | 1627 |
| Postojna | 533 | 45.7661 | 14.1932 | 1542 |
| Hrušica | 872 | 45.8639 | 14.1120 | 1885 |
| Razdrto | 577 | 45.7564 | 14.0623 | 1528 |
| Hrib | 827 | 45.7038 | 14.5927 | 1426 |
| Juršče | 703 | 45.6656 | 14.2950 | 1488 |
© 2019 by the authors. Licensee MDPI, Basel, Switzerland. This article is an open access article distributed under the terms and conditions of the Creative Commons Attribution (CC BY) license (http://creativecommons.org/licenses/by/4.0/).
Share and Cite
MDPI and ACS Style
Sapač, K.; Medved, A.; Rusjan, S.; Bezak, N. Investigation of Low- and High-Flow Characteristics of Karst Catchments under Climate Change. Water 2019, 11, 925. https://doi.org/10.3390/w11050925
AMA Style
Sapač K, Medved A, Rusjan S, Bezak N. Investigation of Low- and High-Flow Characteristics of Karst Catchments under Climate Change. Water. 2019; 11(5):925. https://doi.org/10.3390/w11050925
Chicago/Turabian StyleSapač, Klaudija, Anže Medved, Simon Rusjan, and Nejc Bezak. 2019. "Investigation of Low- and High-Flow Characteristics of Karst Catchments under Climate Change" Water 11, no. 5: 925. https://doi.org/10.3390/w11050925
Note that from the first issue of 2016, this journal uses article numbers instead of page numbers. See further details here.