A Review of SWAT Studies in Southeast Asia: Applications, Challenges and Future Directions
by
 , ,
, ,
Mou Leong Tan
1,* ,
,
Philip W. Gassman
2,
Raghavan Srinivasan
3 ,
,
Jeffrey G. Arnold
4 and
XiaoYing Yang
5 1
Geography Section, School of Humanities, Universiti Sains Malaysia, 11800 Penang, Malaysia
2
Center for Agricultural and Rural Development, Iowa State University, Ames, IA 50011-1054, USA
3
Spatial Sciences Laboratory, Department of Ecosystem Science and Management, Texas A&M University, College Station, TX 77843-2120, USA
4
USDA-ARS Grassland, Soil and Water Research Laboratory, Temple, TX 76502, USA
5
Department of Environmental Science and Engineering, Fudan University, Shanghai 200433, China
*
Author to whom correspondence should be addressed.
Water 2019, 11(5), 914; https://doi.org/10.3390/w11050914
Submission received: 8 April 2019
/
Revised: 25 April 2019
/
Accepted: 26 April 2019
/
Published: 1 May 2019
(This article belongs to the Special Issue Hydrological Modelling and Remote Sensing: Selected Papers from the 2017 and 2018 SWAT International Conferences)
Abstract
:The Soil and Water Assessment Tool (SWAT) model is recognized as one of the top hydrological models applied for addressing hydrologic and environmental issues. This is the first review on the SWAT model studies in Southeast Asia, with an emphasis on its applications, current challenges and future research directions. A total of 126 articles were identified since 2006; roughly 50% of these studies were conducted in Vietnam or Thailand. About 16% of the studies were performed at a transnational scale, which included Cambodia, Lao PDR, Thailand, and Vietnam. Model capability assessment, land use, and climate change assessment are the main SWAT applications that have been reported for the region. Most of the SWAT calibration and validation results for these studies were classified as satisfactory to very good results based on widely recognized performance indicators. However, the parameterization, calibration and validation procedures are not well reported in some articles. Availability of reliable data is one of the main problems that SWAT users are confronted with, as these data are either not freely available or restricted from public access in some countries. Hence, future studies should be considered on identification and development of reliable input data for SWAT modeling. SWAT model modification based on the SEA climate, geographical and land use conditions is another research direction to be considered in the future. Moreover, application of SWAT for extreme events simulation requires more attention in this region.
Keywords:
SWAT model; review; Southeast Asia; applications; research directions; Mekong River; tropical; challenges1. Introduction
Southeast Asia (SEA) currently hosts about 669 million people, which is equivalent to 8.6% of the total world population based on the United Nations estimates [1]. The SEA region is located in a humid tropical zone, which is further partitioned into Tropical Forest and Tropical Monsoon climates [2]. Thus, abundant annual precipitation amounts occur, although the amount of precipitation can vary considerably both spatially and temporally. Typical precipitation amounts in the SEA region range from 2000 to 3000 mm but can differ greatly in mountainous areas, where rainfall levels can be >6000 mm or <1000 mm for conditions defined by windward maritime slopes versus tropical leeward slopes, respectively [3]. Other factors can affect seasonal and annual precipitation levels in this region. For example, inter-annual variation can greatly impact the length of the monsoon season [4] in affected countries including Cambodia, Lao People’s Democratic Republic (Lao PDR), Malaysia, Myanmar, and Thailand.
The SEA region further features some of the longest and most productive inland fisheries in the world, including the Irrawaddy (Ayeyarwady), Salween, Chao Phraya, Mekong, and Lancang River [5]. These rivers are characterized by extremely diverse fish faunas that represent more than 100 families, which inhabit a broad spectrum of river channel and floodplain habitats [5]. Hydropower output is another important product of SEA inland waterways, which has more than doubled from 18.9 GW in 2007 to 44.1 GW in 2016 [6]. SEA rice production is also a key usage of water resources, which includes five of the top ten rice producing countries (Indonesia, Myanmar, Philippines, Thailand, and Vietnam), which currently produce a combined 182 million MT of raw rice [7]. Over 50% of the rice grown in this region is produced using either flooded rainfed lowland rice systems or upland rain-fed rice systems [8]. However, irrigated lowland rice systems account for 64% to 83% of the irrigated cropland area in the SEA region [9].
A complex matrix of severe stresses threatens these and other SEA related water resources. A key fundamental issue is the increasing risk of droughts and flooding in the region, which damage rice and other crop production, adversely affect water flows in streams and other uses of water resources, and negatively impact other resources including damage to infrastructure in both rural and urban contexts [10,11,12,13]. Extensive threats to inland fisheries also exist via disruptions of flow due to dams, pollution from a variety of sources, and diversions of water for irrigation and other uses [5]. Despite the problems caused by dams for fisheries and other riparian uses, pressure to create more sources of hydropower are resulting in construction of additional dams. This is an especially acute issue for the Mekong River system, where existing and planned dams have huge transnational implications that could result in severe degradation of available water resources [14,15,16]. Conversion of SEA tropical forested areas, due to land use shifts such as extensive logging or expansion of oil palm or rubber tree plantations pose additional environmental threats, including potential degradation of water resources, reduction of biodiversity and reduced total carbon biomass [17,18,19,20]. Additional studies confirm that runoff from oil palm plantations can result in detrimental effects on aquatic life if mitigating measures such as forested riparian reserves are not implemented [21,22].
The intricacies and interwoven nature of SEA water resources problems points to the need for innovative methods and tools that can be used to help identify solutions for multi-faceted issues. Available tools include dozens of eco-hydrological models, which have been developed to quantify water quantity and water quality indicators for varying ranges of watershed drainage areas, environmental conditions, and pollutants [14,23,24,25,26,27]. The Soil and Water Assessment Tool (SWAT) model [28,29,30] has emerged as one of the most widely used eco-hydrological models worldwide, as documented by previous review studies [31,32,33,34,35,36,37] and an extensive literature collection that now exceeds 3000 studies [38]. To date, most of these reviews have focused on either the global use of SWAT or as overview articles for special issues, with the only exceptions being reviews of SWAT applications in the Nile River region [36] and Brazil [37]. Thus, there is a need to perform additional reviews of SWAT applications for other global sub-regions including the SEA region, where the model has been increasingly applied over the past decade.
Some of the earliest applications of SWAT in the SEA were for hydrologic analyses of the Mekong River basin [14,39,40]. Analyses of parts or all of the Mekong system with SWAT have continued to the present [41,42,43,44,45] along with increasing numbers of studies that have been performed for specific watersheds located in various SEA countries [46,47,48,49,50,51,52,53]. These SWAT studies have been performed for a wide range of water resource issues, watershed size, and climatic conditions, but there have been no analyses to date of the overall implications of these studies for the SEA region. Thus the goal of this study is to synthesize this existing SWAT-based English peer-reviewed journal literature for the SEA region, drawing primarily on literature available in the Clarivate Analytics Web of Science database [54] and literature compiled by the Center for Agriculture and Rural Development (CARD) [38]. Specifically, the objectives of this review are: (1) to summarize the key findings of reported SWAT applications in the broader context of the overall SEA region, (2) to discuss current data and other challenges that limit the utility of SWAT in the SEA region, and (3) identify future research directions that are needed to maximize the ability of the model in serving as a critical tool for solving SEA water resource problems.
2. Overview of SWAT in Southeast Asia
SEA is a sub-region of Asia, with a total land area of 4.5 million km2 (Figure 1). There are eleven countries within this region including Brunei, Cambodia, East Timor, Indonesia, Lao PDR, Malaysia, Myanmar, Philippines, Singapore, Thailand, and Vietnam. SEA is rich in term of number of rivers. With a course of 4350 km, the Mekong River is the longest river in SEA and is the 12th longest river in the world. The river originates from the Tibetan Plateau and flows through the Myanmar, Lao PDR, Thailand, Cambodia, and Vietnam to the South China Sea. The mean annual discharge of the Mekong River is about 14,500 m3/s, which ranks tenth globally [55].
The climate system in SEA is mainly tropical with plentiful rainfall. Only the Myanmar Himalaya and the Northern Vietnam regions are subjected to sub-tropical climate. Generally, SEA is influenced by the monsoon system that is divided into the southwest monsoon from late May to September (dry season) and the northeast monsoon from November to March (wet season) [56]. Projected increasing of surface temperature by the end of 21st century will lead to changes of monsoon precipitation up to 70% more than normal level [57]. More intense rainfall due to climate change had caused major flood events in SEA and caused loss of lives and property damage. For instance, Thailand experienced one of the most severe monsoon floods in 2011 that resulted in the deaths of more than 815 people, 13.6 million people affected (e.g., property damage), and total loss of $45.8 billion USD [58].
About 2.1 million km2 in SEA is forest area, which equals 17% of the global tropical forests [59]. Since the 1700s, forest cover in this region has decreased dramatically due to agriculture expansion and urbanization [60]. For example, more than 50% of the oil palms in Malaysia and Indonesia in 2005 were forest in 1990 [61]. Such changes will not only pose a serious threat to flora and fauna, but also modify the local hydrological cycle (e.g., increase in surface runoff) and thus impact on local water resources [21,22]. Moreover, the use of fertilizers and pesticides is expected to affect the stream water quality and aquatic life.
2.1. SWAT Studies in Southeast Asia
On 24 February 2019, the final search of the term “SWAT” in the Web of Science database from 1998 to 2018 produced a total of 4370 publications. By contrast, a total of 127 articles were found for the SEA region by using a search concept of “SWAT + specific country” (e.g., “SWAT Malaysia”, “SWAT Vietnam”) and “SWAT + Mekong River”. Nevertheless, there were some trans-boundary studies and a couple of studies did not use the ‘SWAT’ term as a keyword. Thus, the SWAT studies compiled by CARD [38] was used to further assess the literature, resulting in an overall 239 publications for the SEA region. However, there are some overlap publications due to their trans-boundary study area; e.g., the same study appeared under Vietnam, Thailand, and Lao PDR. Some local language articles and proceedings, and unrelated publications were also excluded from this review. From the combined search, we identified 126 articles that used SWAT to study water-related issues in the SEA region (Table 1).
A comparison between the SWAT global and SEA studies in term of the number of publications from 1998 to 2018 is shown in Figure 2. The number of SWAT global studies was extracted from CARD [38], resulting in a total of 3622 publications (accessed on 24 February 2019). The number of global and SEA region publications have increased rapidly since 2009. A key catalyst that has influenced the increased use of SWAT in the SEA region are several SWAT-SEA or SWAT Asia regional conferences there were held as follows [62]: Chiang Mai, Thailand (2009); Ho Chi Minh, Vietnam (2011); Bogor, Indonesia (2013); Tsukuba, Japan (2015) and Selangor, Malaysia (2017). In addition, assorted SWAT workshops and schools have been held in the region that have also contributed to increasing use of the model.
The two countries with the most documented SEA SWAT studies were Vietnam (28.6%) and Thailand (22.2%) as shown in Figure 1. In addition, the SWAT model has been applied in a transnational context for 15.9% of the identified SEA studies, which involved evaluation of stream systems that drain portions of two or more countries in the mainland SEA (note that the total number of studies shown in Figure 1 is >126 because each country is additionally accounted for in the transnational studies). With the exception of Indonesia, Figure 1 also underscores that the application of SWAT model is relatively low in the maritime SEA region, including Brunei, East Timor, Philippines, Singapore, and East Malaysia. Two reasons for the expanded use of the model in Vietnam and Thailand are well developed higher education systems and the fact that more SWAT workshops and other training opportunities have been conducted in these two countries.
Many of the SWAT studies were conducted in watersheds of 1000–5000 km2 or 10,001–100,000 km2 in area, which represent 30.5 and 31.3% of the total publications, respectively (Figure 3). In contrast, only about 21.1% of the studies were performed in small watersheds, which are less <1000 km2 in size. This situation differs in comparison with the SWAT applications that were reported in Brazil, where about 72% of the studies were conducted in smaller watersheds that were <1000 km2 [37]. This underscores the fact that more applications of SWAT are required for small-scale river watershed systems in SEA.
2.2. SWAT Performance in Southeast Asia
A model cannot be applied for scenario analysis and policy development without statistical analysis of its reliability. In general, the coefficient of determination (R2) and Nash-Sutcliffe Efficiency (NSE) are the most popular statistics used to evaluate the performance of the SWAT model [31,32,33,34,37]. Similarly, most of the SWAT SEA studies reported model performance based on a SWAT rating performance table produced by Moriasi et al. [177], which has further been updated with revised criteria suggested by Moriasi et al. [178]. Based on the comparison of monthly streamflow or water quality simulations with observed data, the authors suggested that the SWAT model can be considered as demonstrating “satisfactory” or “very good” performance with NSE values greater than 0.5 and 0.75, respectively.
Table 2 lists the number of monthly and daily streamflow R2 and NSE values reported in the compiled SWAT SEA publications. The total NSE values (i.e., 217 for monthly calibration) is greater than the referred 126 publications (Table 1) because some SWAT capability or uncertainty assessments studies reported more than one NSE value. For example, Rossi [39] reported a total number of 232 NSE values in their SWAT performance assessment in the Lower Mekong River basin. All of the reported monthly scale evaluations exceeded the “satisfactory” criteria set by Moriasi et al. [177,178], and more than 60% of the studies showed a “very good” performance. Similar results were also found for the daily streamflow performance evaluation, but a few studies did report “unsatisfactory” results where the NSE value <0.5. Basically, the SWAT model performed better in the monthly time scale compared to daily time scale, which is consistent with previously reported results [31,32,33,34,37].
A further analysis of statistical values reported for SWAT streamflow calibration and validation in each specific SEA country is listed in Table 3. Generally, SWAT performed well for monthly streamflow simulations that were reported for Vietnam, with NSE values of 0.41 to 0.98 and 0.55 to 0.99 for calibration and validation periods, respectively. SWAT has also been found to perform well for Thailand watershed conditions, with the highest reported NSE values of 0.99 and 0.89 for monthly and daily time scales, respectively. SWAT also showed good performance at both daily and monthly scales in Malaysia, Indonesia and Myanmar. By contrast, an “unsatisfactory” SWAT performance for daily streamflow simulation was found in a Philippines study, resulting in NSE and R2 values of −2.87 and 0.1, respectively [52]. As mentioned by the authors, the main reason for the “unsatisfactory” performance might be due to inadequate reservoir input during the model development. Similarly, SWAT did not perform well for a monthly streamflow simulation in Cambodia as evidenced by the reported NSE value of 0.27. The number of reported SWAT Philippines and Cambodia studies is lower compared to other SEA countries. Hence, more studies need to be carried out in these two countries to check the SWAT reliability in both countries.
2.3. Example SWAT Testing to Support Scenario Analyses
The reliability of SWAT should be evaluated prior to any applications to ensure it is capable of replicating the dynamics of the simulated system and adequately simulating the scenario analyses of interest. Therefore, most of the SWAT studies include analyses of calibration and validation performance results. For example, SWAT model reliability assessments were conducted for the PoKo [162], Cong [148], and Nam Kim [151] watersheds in Vietnam. These studies reported the model performed well for overall streamflow simulation but did not match some peaks and base flows accurately. In addition, SWAT was found to satisfactorily simulate monthly evapotranspiration in the Nam Kim watershed.
Example SWAT model testing in Thailand to support scenario analyses include evaluations for the Chaophraya River basin [139], the Chi River Sub-basin II [137], the Lam Sonthi basin [135,136], and Tachin River basin [129]. The model performed well in simulating streamflow for these basins, as indicated by the strongest NSE values of 0.85 and 0.89 during the calibration and validation periods, respectively. To improve SWAT modeling in the Mae Sa watershed [124,125], the authors developed a new calibration method known as A Nash-Sutcliffe Likelihood Match (ANSELM), which allows the assignment of optimal parameters to different hydrological response units. The ANSELM produced better streamflow and pesticide transport simulations compared to the Parasol calibration tool in the SWAT model, and also resulted in improved model efficiency and computation time.
Two other examples of underlying model testing were reported for SWAT applications in Indonesia. Ridwansyah et al. [91] assessed the performance of SWAT for the Cisadane watershed in west Java, Indonesia for the period of 2005 to 2010. They found that SWAT performed well for the simulated watershed, with NSE values for calibration and validation of 0.72 and 0.7, respectively. Rahayuningtyas et al. [89] improved the streamflow simulation in the upstream Lesti River watershed by integrating groundwater recharge prediction via the water table fluctuation method. The R2 value of model validation was found to be >0.7. They also reported that better performance was observed in the wet season versus the dry season.
3. Analysis of SWAT Applications in Southeast Asia
3.1. Foundational SWAT Model Testing for Scenario Assessments
Table 4 lists an overview of the primary SWAT applications that have been reported for each SEA country, which include scenario analyses such as land use, climate change, climate change and land use change, and Best Management Practices (BMP) assessments, and other types of analyses such as comparisons of SWAT with other models and the effects of different climate data. Hydrologic analyses and model testing are not listed specifically in Table 4 because those are foundational aspects of most of the reported studies. Additionally, some of the studies relied on interfaces with other models to conduct the overall reported scenario or other analyses, as reported by CARD [38].
The broadest range of applications were reported for Vietnam and Thailand which follows expectations considering that 50% of the studies were performed in those two countries as noted above. The broad use of the model in Vietnam reflects the reality that the country is one of the world’s richest agricultural regions and that more than 80% of the water resources in Vietnam are used for agricultural purposes, which is consistent with the original design of SWAT for agricultural water management. The types of studies reported for both countries reflect both water quantity and water quality problems, underscoring that there is a considerable array of water resource issues that need to be addressed in both Thailand and Vietnam. Some unique types of studies that were performed in the two countries include critical source area analysis and bioenergy crop impacts in Thailand and irrigation impacts and regionalization of input parameters in Vietnam.
The most common types of SWAT scenarios reported across the entire SEA region (Table 4) were climate change, land use change and combined climate change and land use change impacts. Most of these studies reported just hydrological impacts versus both hydrological and water quality impacts. The effects of using different sources of climate data was another common type of analysis, which was reported in a transnational context as well as for Cambodia, Malaysia, Myanmar, Thailand, and Vietnam (Table 4). The impacts of impoundments were analyzed in several transnational studies that were performed for parts or all of the Mekong River basin, as well as for some tributaries in Cambodia and Lao PDR (Table 4). These studies and others listed in Table 4 are described in more detail below.
3.2. SWAT Studies on Climate Change
The increasing number and intensity of natural hazards has raised the awareness of the global community about the fact that the earth’s climate system is changing. Many scientists are trying to understand the changes of future climate and hydrological systems, which are important to design useful strategies to adapt and mitigate the impacts. To understand the future hydro-climatic changes, the future climate projections generated from general circulation models can be incorporated into the SWAT model. The projected future streamflow is very useful to water resources managers and policy makers as a reference in their planning.
In the southern region of Vietnam, Khoi, and Suetsugi [165,166] evaluated the impacts and uncertainties of climate change on water resources in the Be River watershed. They used a multi-model ensemble approach by incorporating the projections from four different general circulation models into SWAT. The results show that annual streamflow is projected to decrease between 4% and 6% under future climate projections. The only drought assessment using the standardized runoff index and SWAT model was conducted by Vu et al. [150] in the Dakbla river basin in Vietnam. The findings indicate extreme drought events in this basin normally occurred after a year of strong El Nino events.
The impact of climate change on hydrological cycle was well studied in the Samat watershed [138], Bangpakong River basin [131] and Chao Phraya River basin [126] of Thailand. The latter study applied the Commonwealth Scientific and Industrial Research Organisation (CSIRO) Mark 3.5 (Mk3.5) climate projections generated by CSIRO Marine and Atmospheric Research in Australia into a calibrated SWAT model. The authors tried to identify the possible changes of local hydrological cycle under three greenhouse gas emission scenarios of A2, A1B and B1 that were recommended by Intergovernmental Panel on Climate Change (IPCC) in their third IPCC report [179]. They found that high greenhouse gases emission will lead to a significant increase in streamflow of up to 41.9% in the Chao Phraya basin.
In Malaysia, Tan et al. [100,106] and Dlamini et al. [102] incorporated CMIP5 GCM climate projections into SWAT to study hydro-climatic impacts of the Johor, Kelantan, and Bernam River basin, respectively. The Johor River basin, located in southern Peninsular Malaysia, supplies fresh water to both the Malaysia and Singapore populations. Tan et al. [106] examined how climate change may impact streamflow in this important oil palm growing basin. Eighteen General Circulation Model (GCMs) were validated with historical rainfall data, and the six GCMs with the best performance were selected as input into a well calibrated SWAT model (NSE = 0.62 for validation) to assess future changes in streamflow. The future streamflow is projected to decrease during dry seasons, but increase in wet seasons.
Lao PDR is a land-locked country in mainland SEA, but it has rich water resources of good quality. The SWAT model was used to evaluate the climate change impacts in the Nam Ou basin by Shrestha et al. [97]. Future downscaled climate from four GCMs and PRECIS were applied into the calibrated SWAT model. The results indicate the future annual streamflow (–17–66%) and suspended sediment (−27–160%) changed unevenly.
3.3. SWAT Studies on Land Use Change
Information of the impact of land use change on hydrological cycle within a river basin is very important to develop an effective Integrated River Basin Management System (IRBM). This is mainly due to different land use types affecting hydrological components differently. For example, the infiltration rates for urban areas are lower than forest areas, causing greater surface runoff during heavy rainfall events. Hence, a good land use plan to manage the development of land within a river basin could help reduce the risk of flood and drought, as well as ensure sufficient water supply. Land use change analysis is a common SWAT application because it can be used to evaluate different land use change scenarios on the hydrological cycle and water quality.
To analyze the sensitivity of model outputs to various land use changes for the Chi River basin of Thailand, Homdee et al. [132] used five hypothetical scenarios: (1) Deforestation; (2) farmland expansion; (3) rice paddy field to energy crop; (4) farmland to rice paddy field; and (5) farmland to sugarcane plantation. Simulations under all different land use scenarios contributed to different effects; i.e., the last scenario showed significant impact on seasonal evapotranspiration (ET), but only small changes on water yield. Wangpimool et al. [130] used the SWAT model to study streamflow changes under reforestation in the upper Nan River basin, Thailand based on three scenarios: (1) Improved distributed forest; (2) field crops and range grass; and (3) both distributed forest and field crops. They found the first and third scenarios could result in decreased streamflow during the wet season and increased streamflow during the dry season, while the second scenario did not show significant effects.
In Asaham watershed of Indonesia, Sunandar et al. [90] identified the most suitable land use management system which would minimize suspended sediment without influencing water yield. The optimization was conducted using a linear program and query method, with several constraint functions based on the existing land use conditions. They found the ideal situation could be reached by increasing forest and plantation areas and decreasing dry land farm areas. Tarigan et al. [94] quantified the minimum forest cover that is essential for watersheds in Jambi province in Indonesia to provide sufficient ecosystem services to local water resources. They found that at least 30% of the forest cover needs to be protected so that the watersheds could achieve sustainable ecosystem services. In Indonesia, the effects of land use change on runoff were also evaluated by Prasena and Shrestha [92] in the Bedog sub-watershed, Marhaento et al. [83] in the Samin watershed, and Noda et al. [84] in the upper Citarum watershed. They concluded the land use changes would lead to significant changes in the hydrological cycle.
Three out of the five Philippines SWAT studies [114,115,116] focused solely on land use change impact assessments. The first study was conducted by Alibuyong [115] for subwatersheds in the Manupali River watershed, focusing on runoff and sediment yield. The SWAT-based land use scenarios analysis showed that significant changes in sediment yield occurred (200–273%) compared to the runoff volume (3–14%). Palao et al. [114] conducted a similar study in the Layawan watershed, and found an increase of sediment yield up to 106% if forest area was converted to agricultural area. Lastly, a land use change impact assessment on the hydrological cycle in the Calumpang watershed, Batangas, was conducted by Boongaling et al. [116]. The SWAT modelling showed an increase in surface runoff and sediment yield by 5% and 6%, respectively, but a decrease in baseflow by 11%.
3.4. SWAT Studies on Climate Change and Land Use Change
The simulation of combined climate change and land use change impacts in SWAT was an innovation that developed from the assessments that focused only on climate change impacts or just on land use change effects. These combined analyses provide the ability to account for potential future shifts in climate and land use on the hydrology and/or water quality of a given stream system. There are 12 studies out of the 126 reviewed articles (Table 1) that reported applications of combined climate change and land use change impacts on SEA watersheds. These studies were conducted in Indonesia [87,93], Lao PDR [96], Malaysia [104], Myanmar [112], Thailand [49,117], Vietnam [147,154,155], and also the 3S river basin [63]. Basically, the SWAT-based combined climate change and land use change impact assessment can be divided into two main groups: (1) Consider only the historical climate and land use pattern; and (2) incorporation of future climate and land use projections into the SWAT model.
The first assessment was conducted by Tan et al. [104] to evaluate the separate and combined impacts of land use change and climate variability on the hydrological components of the Johor River basin, Malaysia from 1975 to 2004. They divided climate datasets into two periods (1975–1990 and 1991–2004) and used historical land use maps (1984 and 2002) that represented these two periods. The modeling results show climate variability imposed a stronger impact on streamflow and evaporation than land use changes. A similar approach was also applied by Khoi and Suetsugi [155] in the Be River basin, Vietnam and Setyorini et al. [87] in the Upper Brantas basin in Indonesia. Setyorini et al. [87] reported that the combined historical climate and land use impact lead to a reduction in surface runoff, lateral flow, groundwater and streamflow, and a slight increment in evapotranspiration in the Upper Brantas basin, Indonesia.
Sayasane et al. [96] studied the Nam Xong watershed located in Lao PDR, with consideration of future land use and climate changes. Future land use was produced by using statistical analysis of historical land use trends between 1997 and 2008, while future climate was generated from the PRECIS model [96]. They found that the future streamflow will decrease by 11.7 to 12.2% over the next 20 years, especially in the middle part of the basin. Shrestha and Htut [112] evaluated the future combined land use and climate change impacts in the Bago River basin, Myanmar. Projection from six GCMs under Representative Concentration Pathways (RCP) 4.5 and 8.5 scenarios [180] for the periods of 2020s, 2050s and 2070s were used as climate inputs. Future land use was projected by using the Conversion of Land Use Change and its Effects at Small Regional Extent (CLUE-S) models. Future precipitation and temperature are projected to increase by 30 to 125 mm/year and 0.7 to 3 °C, respectively. The combined land use and climate change was predicted to result in an increase of the annual streamflow up to 68%. On the other hand, Trang et al. [63] evaluated the combined climate change and land use impacts on hydrological cycle and nutrient yield in the 3S river basin. The future climate projections were extracted from several GCMs, while an assumption approach was used in the land use projections development as follows: (1) Conversion of forest to grassland with a rate of 1%/year; and (2) conversion of forest to agricultural land at a rate of 1%/year. Their findings show that annual streamflow and nutrient loads are projected to increase, with increases during the wet season, but decreases during the dry season.
3.5. SWAT Studies on Best Management Practices
Identifying BMPs for a specific basin is one of the widely applied types of SWAT applications. Three studies conducted in Thailand report the impacts of a range of BMP scenarios. In the Chi River Sub-basin Part II, Kheereemangkla et al. [122] evaluated three management practices: (1) Current land use with conservation practices; (2) land use planning based on watershed classification; and (3) land use planning based on watershed classification with conservation practices. The authors noted the third scenario represents the most suitable management practices, based on the findings of a slight decrease in streamflow and a small increase in suspended sediment. Similarly, Phomcha et al. [181] found that a combination of deforestation and mulching is the best way to reduce suspended sediment in the Lam Sonthi watershed. The study by Pongpetch et al. [127] reports on how BMPs may impact the sediment and nutrient loads in the Lam Takong River basin. It was found that the BMP effects are highest in September, while lowest in January and December.
To identify suitable flood management system in the Yang River basin in Thailand, Kuntiyawichai et al. [134] coupled the SWAT and SOBEKs models. They found the bypass channel approach is the most appropriate solution because it can reduce up to 10% of flood events per year, with a reduction of peak flow by 14%. Tarigan et al. [88] investigated the flow regulation function (surface runoff) in the Merangi Tembesi watershed, a rapidly expanding oil palm production region located in the southwest part of Sumatra in Indonesia. Two mitigation scenarios were assessed: (1) frond pile management—mulch made across slope with palm fronds or empty fruit bunches; and (2) frond pile management and silt pit treatment with a density of 20 units/ha were used. The simulations showed that scenarios 1 and 2 resulted in decreases of surface runoff by 10% and 31%, respectively.
3.6. SWAT Studies on Water Quality
SWAT has also been used to study water quality problems in SEA. However, application of SWAT for water quality simulations is relatively low compared to other regions such as China. This might be due to the lack of water quality monitoring stations that can be used for calibration and validation the SWAT water quality related outputs. Field collection of water quality parameters is a time-consuming and costly process, therefore many SWAT users might not be able to perform water quality simulations without funding support from local government agencies or international organizations.
Xu and Chua [101] coupled the SWAT model with a hydrodynamic model called SUNTANS to perform a three-dimensional land-based pollutant transport simulation from the Johor River to Singapore coastal waters. Unfortunately, they only reported the hydrological calibration and validation results for SWAT based on streamflow data. The SWAT model was used to study soil erosion in Ta Trach River basin [160] and upper Bo River watershed [161] of Vietnam. Similarly, they only conducted streamflow calibration and validation due to the lack of sediment observations.
Bannwarth et al. [123] coupled the SWAT and the Mathematical Programming-based Multi-Agent Systems (MPMAS) models to study the effects of pesticide application rates on farm household income. The results show that SWAT reproduced the observed dynamics of cypermethrin and chlorothalonil loads satisfactorily in the calibration periods, with NSE values of 0.7 and 0.67, respectively. However, the model efficiency dropped to 0.35 for cypermethrin and 0.28 for chlorothalonil in the validation period. They found a decreasing application rate of chlorothalonil (80%) and cypermethrin (99%) would reduce farm income by 17.3% and 38.2%, respectively. Interestingly, Kim et al. [95] explored the ability of SWAT to simulate Fecal Indicator Bacteria (FIB) and suspended sediment simulations in the Houay Pano watershed in Northern Lao PDR. They found that the original version of the SWAT model did not correctly simulate small E. coli numbers during the dry season, but the model performance could be improved by integrating E. coli and suspended sediment inputs.
3.7. SWAT Studies on Hydropower
The use of SWAT in Cambodia is mostly related to hydropower. Arias et al. [81] evaluated the amount of suspended sediment affected by two different land use management scenarios (forest conservation and deforestation) and corresponding impacts on hydropower operation in the Pursat 1 watershed. The results show the forest conservation scenario reduced suspended sediment flows into the reservoir, and thus improved the lifespan of the dam and associated hydropower generation. To understand the development of dams planned for the Sekong, Sesan and Srepok (3S) rivers in the Lower Mekong tributaries to the Tonle Sap floodplain in Cambodia, Arias et al. [80] coupled four numerical models representing surface hydrology, water resources management and flood plain hydrodynamics to account for the effects of three dams built on the main stem of the Lower Mekong River and up to 42 more dams in the 3S system. The SWAT model was used to simulate surface hydrology (runoff), which was then used as input into the water resources management models. The simulation results show that the full development of the 3S and Mekong River dams will lead to significant negative impacts on hydrological processes for the Tonle Sap wetland system in Cambodia. Chhuon et al. [79] coupled the SWAT and MODSIM models as a decision support system, to investigate the influence of a future upstream hydropower and a downstream canal irrigation system on hydrological processes in the Prek Te River basin located in East central Cambodia. The results show that a hydropower station could produce 13.61 MW of electricity and the reservoir can potentially reduce the water shortage problem during the dry season.
3.8. SWAT Model Uncertainty Analysis
Uncertainty analysis of SWAT modelling outputs is an essential assessment that is designed to improve simulation outputs. In general, hydrological model uncertainty can arise from input data, model parameterization and model structure. Khoi and Thom [152] evaluated four SWAT model parameter uncertainty analysis approaches in simulating streamflow in the Srepok River watershed, Vietnam and concluded that the Sequential Uncertainty Fitting (SUFI-2) method had the best performance. Comparison between SWAT, Recurrent Fuzzy Neural Network (RFNN) and improved RFNN-Genetic Algorithm (RFNN-GA) models in simulating runoff in the Srepok River, Central Vietnam was conducted by Duong et al. [145]. The findings show that the data-driven based models (RFNN-GA and RFNN) performed better than the physical-based model (SWAT) for runoff simulation, due to lack of reliable input data for SWAT modeling.
SWAT input data uncertainty analysis in a tropical region context has been well tested in Malaysia. For example, Tan et al. [105] evaluated the uncertainties of streamflow outputs by using different Digital Elevation Model (DEM) resolution, source and resampling technique. They further improved the SWAT DEM sensitivity analysis framework by integrating the area threshold [109]. The studies show that streamflow simulation within SWAT is sensitive to DEM inputs, especially for the DEM resolution parameter. Therefore, SWAT modelers should consider this uncertainty prior to the model setup. On the other hand, Tan et al. [46] compared three long-term public domain precipitation data for SWAT modelling in Malaysia. They found that the NCEP-CFSR precipitation product that is available on the SWAT website is not suitable to be used in tropical regions. They recommended a combination of Asian Precipitation Highly Resolved Observational Data Integration Towards Evaluation of water resources (APHRODITE) precipitation and NCEP-CFSR temperature data should be used instead for SWAT modelling in Malaysia. Vu et al. [167] evaluated the capability of five different gridded precipitation products in simulating streamflow using SWAT in the Dakbla River basin in Vietnam. They found that the APHRODITE product performed the best and could be used as rainfall input data in future studies. The capability of the latest Global Precipitation Mission (GPM) satellite precipitation products for hydro-meteorological simulations was evaluated by Tan et al. [47] with SWAT for the Kelantan River basin in Malaysia. The findings indicated that the GPM products are very useful in simulating streamflow during flood periods.
4. Challenges and Future Recommendations
4.1. Applications
The Mekong River Commission selected SWAT as one of main hydrological models for their decision framework related to water related issues [43,182]. Besides that, they also coupled SWAT with other hydrodynamic models to extend the usefulness and effectiveness of the modelling framework. For example, SWAT has been linked with MIKE11, MIKE HYDROBasin and MIKE 21 models for a comprehensive integrated water resources modelling framework to understand the water resources of the Lower Mekong basin [76]. However, capabilities of the SWAT model are still unknown in many regions in SEA. For example, no SWAT study was reported for East Malaysia, which is separated from the Peninsular Malaysia by the South China Sea. Similarly, the application of the SWAT is also limited in the Philippines and in Indonesia, which are comprised of thousands of volcanic islands. Therefore, more SWAT studies should be carried out in these “unknown” regions, as such assessment is crucial for the SWAT modelers to improve the model.
The majority of SWAT model applications in SEA are limited to land use management, climate change assessment and model capability analysis. More applications should be focused on the following aspects in the future: (1) ecosystem services—to model the collective benefits of natural systems to human beings [183]; (2) input uncertainty analysis—to evaluate the sensitivity of various input data including remote sensing data on SWAT outputs in order to optimize the most suitable data; (3) specific crop assessment—to understand hydrological processes of specific crops in this region; i.e., oil palm plantations in Malaysia and Indonesia; and (4) hydro-meteorological analysis—to study extreme events, which is very useful for flood and drought management in this region.
Incorporation of SWAT as part of undergraduate and graduate curriculum in the Nong Lam University (Ho Chi Minh City, Vietnam), Hanoi Agricultural University (Hanoi, Vietnam) and the Asian Institute of Technology (Bangkok, Thailand) has resulted in more SWAT related research and indirectly increased the number of peer reviewed articles in Vietnam and Thailand. But still the total number of SWAT publications in SEA from 1998 to 2018 is rather limited compared to some other countries in Asia; i.e., >500 and >200 SWAT publications from China and India [38], respectively. A lack of SWAT workshops in SEA is probably one of the main reasons contributing to low numbers of SWAT studies. Basically, these workshops are organized along with the SWAT conferences, every two to four years in the SEA. In addition, SWAT workshops have not been held in certain countries in SEA, thus limiting the model promotion and knowledge distribution. Some limitations of the previous workshops have also been identified. Generally, the workshop is divided into beginner (SWAT model setup) and advanced (SWAT calibration and validation) modules. However, the SWAT module on specific applications is missing, so some users are unable to fully utilize the model. For example, the “climate change module” that teaches users how to download, downscale, and apply future climate data in a calibrated SWAT model should be conducted in workshops in the future. This will not only promote the SWAT model applications in this region, but also ensure the results are generated in a correct way. This can also lead to better comparisons of the model outputs among studies from different regions. SEA SWAT researchers who at the same time are also university lecturers could introduce SWAT in their hydrology or water resources related subjects, so that more students know about the model.
4.2. Data, Calibration and Validation
In SEA, one of the main difficulties in applying SWAT is poor data reliability and availability. In addition, this situation is exacerbated with limited access to these data and conversion of them to SWAT input data, which is quite similar to the Brazilian SWAT databases’ problem [37]. Produced by various government agencies, most of these data need further processing before inputting to SWAT. However, some data are not freely available or are restricted at various levels from general public access including researchers. In addition, climate data in certain SEA countries can usually only be obtained for a fee, so a student or researcher without research funding is unable to proceed with their “SWAT objectives”. Tan et al. [46] and Vu et al. [167] started a useful initiative by evaluating the capability of free precipitation products in SWAT simulations in SEA regions, but their studies are limited to Malaysia and Vietnam only. Therefore, future studies should be considered in identifying the utility of potential free input data including climate, topography, land use and soil data for SWAT modeling in this region. More model testing is also required to validate the performance of freely available data in SWAT modelling.
Applications of SWAT are typically initiated with calibration and validation using streamflow, followed by suspended sediment and water quality data at the outlet of a sub-basin or the entire basin (if such data are available). This review shows that the model has performed at satisfactorily or stronger levels in SEA, which would indicate that the model is suitable to be used in tropical regions. However, there is considerable research that still needs to be conducted regarding tropical vegetation dynamics in SWAT, as discussed in the following section. However, the applied calibration and validation approaches and details are unclear and deficient in some reported studies in SEA. Moreover, in some reported cases the SWAT model performance is nearly perfect [39,87]. These results might be of uncertain quality as the empirical equations within the model were derived from large data sets in the USA [36]. The USLE soil loss equations and the curve number approach are some examples. Future studies should provide more details regarding calibrated model parameters and model performance.
Many SWAT studies considered the model is reliable if the reported validation statistics such as NSE values are 0.5 or above at the basin’s outlet. In fact, the reliability of outputs in the other sub-basins is not necessarily the same as the main outlet [35]. Moreover, such a procedure also does not guarantee that other variables such as baseflow, surface runoff, and evapotranspiration are simulated correctly. Therefore, multi-site and multi-variable calibrations are crucial for better results, particularly for larger basins. For un-gauged basins, certain variables may be calibrated and validated in basins with similar climate and geographical conditions, or with remote sensing data. “Soft calibration” of water, sediment, and nutrient budgets could also improve calibration, especially in areas that are lacking data [184]. For example, the SWAT-simulated evaporation amounts could be compared with that from the MODIS Global Evapotranspiration Project (MOD16).
4.3. Model Modification
SEA has some of the richest land use types in the world, and agricultural land has become the dominant landscape. However, many crops in this region are not currently included in the SWAT plant parameters database. Moreover, the SWAT plant growth algorithm was developed for temperate regions, thus it may not be fully adequate for simulating tropical region vegetation [185]. Many SWAT studies did not account for the suitability of the model to simulate tropical vegetation dynamics. To tackle this issue, Strauch and Volk [186] modified the SWAT plant growth submodel to improve the modeling of perennial vegetation in the Santa Maria/Torto watershed in Central Brazil. On the other hand, a modified SWAT version for tropical conditions (SWAT-T) has been developed by Alemayehu et al. [187] to improve the simulation of vegetation variables within SWAT such as leaf area index (LAI) for tropical ecosystems. Using the Mara basin (Kenya/Tanzania) as a case study, LAI simulated with the SWAT-T model matched well with the MODIS LAI for savanna grassland, forest and shrubland. The improved vegetation representation also resulted in a better simulation of streamflow and evapotranspiration compared to the original SWAT model. These studies show that modified plant modules result in better performance than the conventional SWAT model. Such SWAT plant module modifications are still limited for crops in SEA; i.e., improved representation of oil palm and rubber trees is important for Malaysia, Indonesia, and Thailand. Hence, there is an urgent need to expand the plant parameter database for this region to produce better simulations.
Because SWAT was initiated to study the impact of management practices on water supply and quality in agricultural-based basins [28], the model might be less effective for urban storm water simulations. Indirectly, this drawback would affect the performance of SWAT in extreme events such as peak and low flow simulations. In fact, these extreme events are among the conditions that cause massive damage to human environments and facilities. However, in SEA, there are not many studies that concentrate solely on the extreme events simulation and thus this requires more attention. Additionally, modifications of SWAT to better capture the extreme events are essential for the flood or drought mitigation strategies simulations.
A new SWAT version called SWAT+ [30], was just released recently with improved modular design, algorithms and subroutines. Besides that, there are many SWAT-related models that are designed for specific regions or applications, which are often outside the USA. These models include: (1) the Soil and Water Integrated Model (SWIM)—climate and land use impact assessment [188]; (2) SWAT-G—low mountain range watersheds in Germany [189]; (3) SWAT-MODFLOW—coupled watershed and groundwater models [190]; (4) ESWAT—sub-daily simulations [191]; and (5) SWATgrid—grid-based version of the SWAT to enhance the spatial representation of hydrological and transport processes [192]. Development of a SWAT model that specifically considers the climate and geographical conditions of SEA (e.g., SWAT-SEA) should be considered in the near future.
5. Conclusions
SWAT is a well-known reliable ecohydrological model that has been used for multi-disciplinary studies in different climatic and physiographic conditions. The model is now among the most widely used models used for environmental studies as it covers a wide range of processes related to hydrological balance, water quality and erosion elements [193]. Therefore, the application of SWAT in SEA has grown rapidly in the recent years, as evidenced by the publishing of more than 100 studies. These studies have generally focused on land use and climate change assessment, and model capability analysis. Vietnam and Thailand are the leading SWAT application countries in SEA, with a rapidly increasing trend in Malaysia and Indonesia. Many transnational studies were also found for mainland SEA, which are mostly focused on parts or all of the Mekong River basin.
The model has been quite reliable in SEA, with most of the studies reporting R2 and NSE values above 0.5. However, the capability of the model is still unknown in many SEA subregions (e.g., East Malaysia, Brunei, East Timor and Singapore) where there are no reported studies. Besides that, descriptions of parameter, calibration, and validation methods is vague in some studies, which prevent readers from fully understanding the model performance analysis. Therefore, SWAT applications should be extended to the other parts of SEA, with more detailed information on model capability evaluation. This could be facilitated by organizing more SWAT workshops, including an emphasis on specific modules (i.e., SWAT climate change module).
Data availability and reliability are the main problems confronting SWAT users in SEA, which is similar as those reported in the Brazil [37] and the upper Blue Nile basin countries [36]. This is mainly due to data that must be purchased or that is restricted for general public use including researchers. Future studies should focus on the identification of reliable alternative data sources for SWAT modeling in SEA. As precipitation is the most important input to any hydrological model [194], the reliability of gridded precipitation products from modeled or satellite sources for SWAT applications should be further evaluated.
SEA has a variety of land use types. However, rainforests as well as many types of crops have not been included in the SWAT plant database. For instance, oil palm plantations are essential to the economy of Malaysia and Indonesia, yet development of oil palm parameters for the SWAT plant database is still limited. In addition, the SWAT plant growth model was developed based on data collected in the USA, which may not be fully suitable for tropical regions. Therefore, there is an urgent need to modify and improve the SWAT plant module based on the vegetation dynamics in SEA.
A new version of SWAT, known as the SWAT+ has been released recently, with better modular design and algorithms. More studies can be expected that will focus on analyzing the capability of the new model in SEA. Comparison of SWAT+ with other ecohydrological models including previous versions of SWAT will assist hydrologists and other users in choosing the most suitable model. Furthermore, SWAT has been expanded for a variety of land uses or geographical regions, but this has not yet occurred for SEA. Considering its special climate and geographical conditions, SWAT extensions specific to SEA should be encouraged.
Author Contributions
Conceptualization, M.L.T. and P.G.; methodology, M.L.T. and P.G.; writing—original draft preparation, M.L.T. and P.G.; writing—review and editing, M.L.T., P.G., R.S., J.A. and X.Y.Y.; project administration, M.L.T.; funding acquisition, M.L.T.
Funding
This research was funded by the Ministry of Education Malaysia under the Newton-NERC grant (203.PHUMANITI.6780001) and Fundamental Research Grant Scheme (203.PHUMANITI.6711695).
Acknowledgments
Special thanks to editors and reviewers for their comments.
Conflicts of Interest
The authors declare no conflict of interest.
References
- UN. Population Division: Population Databases; Population Division, Department of Economic and Social Affairs, United Nations: New York, NY, USA, 2019; Available online: https://www.un.org/en/development/desa/population/publications/database/index.shtml (accessed on 1 February 2019).
- Peel, M.C.; Finlayson, B.L.; McMahon, T.A. Updated world map of the köppen-geiger climate classification. Hydrol. Earth Syst. Sci. 2007, 11, 1633–1644. [Google Scholar] [CrossRef]
- EB. Asia Continent: Precipitation; Encyclopedia Britannica: Chicago, IL, USA, 2019; Available online: https://www.britannica.com/place/asia/climate (accessed on 1 February 2019).
- Misra, V.; DiNapoli, S. The variability of the southeast asian summer monsoon. Int. J. Climatol. 2014, 34, 893–901. [Google Scholar] [CrossRef]
- Welcomme, R.L.; Baird, I.G.; Dudgeon, D.; Halls, A.; Lamberts, D.; Mustafa, M.G. Fisheries of the rivers of Southeast Asia. In Freshwater Fisheries Ecology; John, F.C., Ed.; John Wiley & Sons: Oxford, UK, 2015. [Google Scholar]
- IRENA. Renewable Capacity Statistics 2017; International Renewable Energy Agency: Abu Dhabi, UAE, 2017; Available online: https://www.irena.org/hydropower (accessed on 2 February 2019).
- TDR. Top 10 Largest Rice Producing Countries in the World. The Daily Records: Latest News around the Globe; Jaipur, Rajsthan, India, 2019; Available online: http://www.thedailyrecords.com/2018-2019-2020-2021/world-famous-top-10-list/world/largest-rice-producing-countries-world/6558/ (accessed on 2 February 2019).
- USDA-FAS. Southeast Asia: 2015/16 Rice Production Outlook at Record Levels; Commodity Intelligence Report, Foreign Agricultural Service; United States Department of Agriculture: Washington, DC, USA, 2015. Available online: https://ipad.fas.usda.gov/highlights/2015/06/southeast_asia/ index.htm (accessed on 2 February 2019).
- GriSP (Global Rice Science Partnership). Rice Almanac, 4th ed.; International Rice Research Institute: Los Baños, Philippines, 2013; 283p. [Google Scholar]
- Wang, Q.; Wu, J.; Lei, T.; He, B.; Wu, Z.; Liu, M.; Mo, X.; Geng, G.; Li, X.; Zhou, H.; et al. Temporal-spatial characteristics of severe drought events and their impact on agriculture on a global scale. Quat. Int. 2014, 349, 10–21. [Google Scholar] [CrossRef]
- Miyan, M.A. Droughts in asian least developed countries: Vulnerability and sustainability. Weather Clim. Extremes 2015, 7, 8–23. [Google Scholar] [CrossRef]
- Ahamed, A.; Bolten, J.D. A modis-based automated flood monitoring system for Southeast Asia. Int. J. Appl. Earth Obs. Geoinf. 2017, 61, 104–117. [Google Scholar] [CrossRef]
- Güneralp, B.; Güneralp, İ.; Liu, Y. Changing global patterns of urban exposure to flood and drought hazards. Glob. Environ. Chang. 2015, 31, 217–225. [Google Scholar] [CrossRef]
- Johnston, R.; Kummu, M. Water resource models in the Mekong basin: A review. Water Resour. Manag. 2012, 26, 429–455. [Google Scholar] [CrossRef]
- Matthews, N.; Motta, S. Chinese state-owned enterprise investment in Mekong hydropower: Political and economic drivers and their implications across the water, energy, food nexus. Water 2015, 7, 6269–6284. [Google Scholar] [CrossRef]
- Pokhrel, Y.; Burbano, M.; Roush, J.; Kang, H.; Sridhar, V.; Hyndman, D.W. A review of the integrated effects of changing climate, land use, and dams on Mekong River hydrology. Water 2018, 10, 266. [Google Scholar] [CrossRef]
- Ziegler, A.D.; Fox, J.M.; Xu, J. The rubber juggernaut. Science 2009, 324, 1024–1025. [Google Scholar] [CrossRef]
- Mukherjee, I.; Sovacool, B.K. Palm oil-based biofuels and sustainability in southeast asia: A review of Indonesia, Malaysia, and Thailand. Renew. Sustain. Energy Rev. 2014, 37, 1–12. [Google Scholar] [CrossRef]
- Ahrends, A.; Hollingsworth, P.M.; Ziegler, A.D.; Fox, J.M.; Chen, H.; Su, Y.; Xu, J. Current trends of rubber plantation expansion may threaten biodiversity and livelihoods. Glob. Environ. Chang. 2015, 34, 48–58. [Google Scholar] [CrossRef]
- Drescher, J.; Rembold, K.; Allen, K.; Beckschäfer, P.; Buchori, D.; Clough, Y.; Faust, H.; Fauzi, A.M.; Gunawan, D.; Hertel, D.; et al. Ecological and socio-economic functions across tropical land use systems after rainforest conversion. Philos. Trans. R. Soc. B Biol. Sci. 2016, 371, 20150275. [Google Scholar] [CrossRef]
- Mercer, E.V.; Mercer, T.G.; Sayok, A.K. Effects of forest conversions to oil palm plantations on freshwater macroinvertebrates: A case study from Sarawak, Malaysia. J. Land Use Sci. 2014, 9, 260–277. [Google Scholar] [CrossRef]
- Giam, X.; Hadiaty, R.K.; Tan, H.H.; Parenti, L.R.; Wowor, D.; Sauri, S.; Chong, K.Y.; Yeo, D.C.J.; Wilcove, D.S. Mitigating the impact of oil-palm monoculture on freshwater fishes in Southeast Asia. Conserv. Biol. 2015, 29, 1357–1367. [Google Scholar] [CrossRef]
- Wellen, C.; Kamran-Disfani, A.-R.; Arhonditsis, G.B. Evaluation of the current state of distributed = nutrient water quality modeling. Environ. Sci. Technol. 2015, 49, 3278–3290. [Google Scholar] [CrossRef]
- Pandey, A.; Himanshu, S.K.; Mishra, S.K.; Singh, V.P. Physically based soil erosion and sediment yield models revisited. Catena 2016, 147, 595–620. [Google Scholar] [CrossRef]
- Cho, K.H.; Pachepsky, Y.A.; Oliver, D.M.; Muirhead, R.W.; Park, Y.; Quilliam, R.S.; Shelton, D.R. Modeling fate and transport of fecally-derived microorganisms at the watershed scale: State of the science and future opportunities. Water Res. 2016, 100, 38–56. [Google Scholar] [CrossRef]
- Ochoa, V.; Urbina-Cardona, N. Tools for spatially modeling ecosystem services: Publication trends, conceptual reflections and future challenges. Ecosyst. Serv. 2017, 26, 155–169. [Google Scholar] [CrossRef]
- Brewer, S.K.; Worthington, T.A.; Mollenhauer, R.; Stewart, D.R.; McManamay, R.A.; Guertault, L.; Moore, D. Synthesizing models useful for ecohydrology and ecohydraulic approaches: An emphasis on integrating models to address complex research questions. Ecohydrology 2018, 11. [Google Scholar] [CrossRef]
- Arnold, J.G.; Srinivasan, R.; Muttiah, R.S.; Williams, J.R. Large area hydrologic modeling and assessment part i: Model development1. JAWRA J. Am. Water Resour. Assoc. 1998, 34, 73–89. [Google Scholar] [CrossRef]
- Arnold, J.G.; Moriasi, D.N.; Gassman, P.W.; Abbaspour, K.C.; White, M.J.; Srinivasan, R.; Santhi, C.; Harmel, R.D.; van Griensven, A.; van Liew, M.W.; et al. SWAT: Model use, calibration, and validation. Trans. ASABE 2012, 55, 1491–1508. [Google Scholar] [CrossRef]
- Bieger, K.; Arnold, J.G.; Rathjens, H.; White, M.J.; Bosch, D.D.; Allen, P.M.; Volk, M.; Srinivasan, R. Introduction to SWAT+, a completely restructured version of the Soil and Water Assessment Tool. JAWRA J. Am. Water Resour. Assoc. 2017, 53, 115–130. [Google Scholar] [CrossRef]
- Gassman, P.W.; Reyes, M.R.; Green, C.H.; Arnold, J.G. The Soil and Water Assessment Tool: Historical development, applications, and future research directions. Trans. ASABE 2007, 50, 1211–1250. [Google Scholar] [CrossRef]
- Gassman, P.W.; Sadeghi, A.M.; Srinivasan, R. Applications of the SWAT model special section: Overview and insights. J. Environ. Qual. 2014, 43, 1–8. [Google Scholar] [CrossRef] [PubMed]
- Douglas-Mankin, K.R.; Srinivasan, R.; Arnold, J.G. Soil and Water Assessment Tool (SWAT) model: Current developments and applications. Trans. ASABE 2010, 53, 1423–1431. [Google Scholar] [CrossRef]
- Tuppad, P.; Douglas-Mankin, K.R.; Lee, T.; Srinivasan, R.; Arnold, J.G. Soil and Water Assessment Tool (SWAT) hydrologic/water quality model: Extended capability and wider adoption. Trans. ASABE 2011, 54, 1677–1684. [Google Scholar] [CrossRef]
- Krysanova, V.; White, M. Advances in water resources assessment with SWAT—An overview. Hydrol. Sci. J. 2015, 60, 771–783. [Google Scholar] [CrossRef]
- Van Griensven, A.; Ndomba, P.; Yalew, S.; Kilonzo, F. Critical review of SWAT applications in the Upper Nile basin countries. Hydrol. Earth Syst. Sci. 2012, 16, 3371–3381. [Google Scholar] [CrossRef]
- Bressiani, D.D.; Gassman, P.W.; Fernandes, J.G.; Garbossa, L.H.P.; Srinivasan, R.; Bonuma, N.B.; Mendiondo, E.M. Review of Soil and Water Assessment Tool (SWAT) applications in Brazil: Challenges and prospects. Int. J. Agric. Biol. Eng. 2015, 8, 9–35. [Google Scholar]
- CARD. Swat Literature Database for Peer-Reviewed Journal Articles; Center for Agricultural and Rural Development, Iowa State University: Ames, IA, USA, 2019; Available online: https://www.card.iastate.edu/swat_articles/ (accessed on 24 February 2019).
- Rossi, C.G.; Srinivasan, R.; Jirayoot, K.; Le Duc, T.; Souvannabouth, P.; Binh, N.; Gassman, P.W. Hydrologic evaluation of the lower mekong river basin with the Soil and Water Assessment Tool model. Int. Agric. Eng. J. 2009, 18, 1–13. [Google Scholar]
- MRC. Swat and Iqqm Models. Technical Reference Report 620. Decision Support Framework. Water Utilisation Project Component A: Development of Basin Modelling Package and Knowledge Base (Wup-a); Mekong River Commission: Vientiane, Laos, 2004. [Google Scholar]
- Shrestha, B.; Cochrane, T.A.; Caruso, B.S.; Arias, M.E. Land use change uncertainty impacts on streamflow and sediment projections in areas undergoing rapid development: A case study in the Mekong basin. Land Degrad. Dev. 2018, 29, 835–848. [Google Scholar] [CrossRef]
- Shrestha, B.; Cochrane, T.A.; Caruso, B.S.; Arias, M.E.; Piman, T. Uncertainty in flow and sediment projections due to future climate scenarios for the 3S rivers in the Mekong basin. J. Hydrol. 2016, 540, 1088–1104. [Google Scholar] [CrossRef]
- Mohammed, I.N.; Bolten, J.D.; Srinivasan, R.; Lakshmi, V. Improved hydrological decision support system for the lower Mekong river basin using satellite-based earth observations. Remote Sens. 2018, 10, 885. [Google Scholar] [CrossRef]
- Mohammed, I.N.; Bolten, J.D.; Srinivasan, R.; Lakshmi, V. Satellite observations and modeling to understand the lower Mekong River basin streamflow variability. J. Hydrol. 2018, 564, 559–573. [Google Scholar] [CrossRef] [PubMed]
- Nguyen-Tien, V.; Elliott, R.J.R.; Strobl, E.A. Hydropower generation, flood control and dam cascades: A national assessment for Vietnam. J. Hydrol. 2018, 560, 109–126. [Google Scholar] [CrossRef]
- Tan, M.L.; Gassman, P.W.; Cracknell, A.P. Assessment of three long-term gridded climate products for hydro-climatic simulations in tropical river basins. Water 2017, 9, 229. [Google Scholar] [CrossRef]
- Tan, M.L.; Samat, N.; Chan, N.W.; Roy, R. Hydro-meteorological assessment of three GPM satellite precipitation products in the Kelantan River basin, Malaysia. Remote Sens. 2018, 10, 1011. [Google Scholar] [CrossRef]
- Rafiei Emam, A.; Kappas, M.; Linh, N.H.K.; Renchin, T. Hydrological modeling and runoff mitigation in an ungauged basin of central Vietnam using SWAT model. Hydrology 2017, 4, 16. [Google Scholar] [CrossRef]
- Shrestha, S.; Bhatta, B.; Shrestha, M.; Shrestha, P.K. Integrated assessment of the climate and landuse change impact on hydrology and water quality in the Songkhram River basin, Thailand. Sci. Total Environ. 2018, 643, 1610–1622. [Google Scholar] [CrossRef]
- Tran, V.-B.; Ishidaira, H.; Nakamura, T.; Do, T.-N.; Nishida, K. Estimation of nitrogen load with multi-pollution sources using the SWAT model: A case study in the Cau River basin in northern Vietnam. J. Water Environ. Technol. 2017, 15, 106–119. [Google Scholar] [CrossRef]
- Chotpantarat, S.; Boonkaewwan, S. Impacts of land-use changes on watershed discharge and water quality in a large intensive agricultural area in Thailand. Hydrol. Sci. J. 2018, 63, 1386–1407. [Google Scholar] [CrossRef]
- Ligaray, M.; Kim, M.; Baek, S.; Ra, J.S.; Chun, J.A.; Park, Y.; Boithias, L.; Ribolzi, O.; Chon, K.; Cho, K.H. Modeling the fate and transport of malathion in the Pagsanjan-lumban basin, Philippines. Water 2017, 9, 451. [Google Scholar] [CrossRef]
- Ang, R.; Oeurng, C. Simulating streamflow in an ungauged catchment of Tonlesap Lake basin in Cambodia using Soil and Water Assessment Tool (SWAT) model. Water Sci. 2018, 32, 89–101. [Google Scholar] [CrossRef]
- Database, W.o.S (Web of Science). Available online: https://clarivate.com/products/web-of-science/ (accessed on 24 February 2019).
- Hecht, J.S.; Lacombe, G.; Arias, M.E.; Dang, T.D.; Piman, T. Hydropower dams of the Mekong River basin: A review of their hydrological impacts. J. Hydrol. 2019, 568, 285–300. [Google Scholar] [CrossRef]
- Tan, M.L.; Ibrahim, A.L.; Duan, Z.; Cracknell, A.P.; Chaplot, V. Evaluation of six high-resolution satellite and ground-based precipitation products over Malaysia. Remote Sens. 2015, 7, 1504–1528. [Google Scholar] [CrossRef]
- Schewe, J.; Levermann, A. A statistically predictive model for future monsoon failure in India. Environ. Res. Lett. 2012, 7, 044023. [Google Scholar] [CrossRef]
- Loo, Y.Y.; Billa, L.; Singh, A. Effect of climate change on seasonal monsoon in asia and its impact on the variability of monsoon rainfall in Southeast Asia. Geosci. Front. 2015, 6, 817–823. [Google Scholar] [CrossRef]
- FAO (Food and Agriculture Organization). Global Forest Resources Assessment 2010 Main Report; FAO: Rome, Italy, 2010. [Google Scholar]
- Samek, J.H.; Lan, D.X.; Silapathong, C.; Navanagruha, C.; Abdullah, S.M.S.; Gunawan, I.; Crisostomo, B.; Hilario, F.; Hien, H.M.; Skole, D.L.; et al. Land use and land cover change in Southeast Asia. In Land Change Science: Observing, Monitoring and Understanding Trajectories of Change on the Earth’s Surface; Gutman, G., Janetos, A.C., Justice, C.O., Moran, E.F., Mustard, J.F., Rindfuss, R.R., Skole, D., Turner, B.L., Cochrane, M.A., Eds.; Springer: Dordrecht, The Netherlands, 2004; pp. 111–122. [Google Scholar]
- Koh, L.P.; Wilcove, D.S. Is oil palm agriculture really destroying tropical biodiversity? Conserv. Lett. 2008, 1, 60–64. [Google Scholar] [CrossRef]
- SWAT. Soil and Water Assessment Tool: Southeast Asia Conferences. Available online: https://swat.tamu.edu/conferences/ (accessed on 10 February 2019).
- Trang, N.T.T.; Shrestha, S.; Shrestha, M.; Datta, A.; Kawasaki, A. Evaluating the impacts of climate and land-use change on the hydrology and nutrient yield in a transboundary river basin: A case study in the 3S river basin (Sekong, Sesan, and Srepok). Sci. Environ. 2017, 576, 586–598. [Google Scholar] [CrossRef]
- Khoi, D.N.; Thang, L.V. Climate change impacts on streamflow and non-point source pollutant loads in the 3S rivers of the Mekong basin. Water Environ. J. 2017, 31, 401–409. [Google Scholar] [CrossRef]
- Shrestha, S.; Shrestha, M.; Shrestha, P.K. Evaluation of the swat model performance for simulating river discharge in the himalayan and tropical basins of Asia. Hydrol. Res. 2018, 49, 846–860. [Google Scholar] [CrossRef]
- Giang, P.Q.; Giang, L.T.; Toshiki, K. Spatial and temporal responses of soil erosion to climate change impacts in a transnational watershed in Southeast Asia. Climate 2017, 5, 22. [Google Scholar] [CrossRef]
- Piman, T.; Cochrane, T.A.; Arias, M.E. Effect of proposed large dams on water flows and hydropower production in the Sekong, Sesan and Srepok rivers of the Mekong basin. River Res. Appl. 2016, 32, 2095–2108. [Google Scholar] [CrossRef]
- Wild, T.B.; Loucks, D.P.; Annandale, G.W.; Kaini, P. Maintaining sediment flows through hydropower dams in the Mekong River basin. J. Water Resour. Plan. Manag. 2016, 142, 05015004. [Google Scholar] [CrossRef]
- Vu, M.T.; Raghavan, S.V.; Liong, S.Y. Use of regional climate models for proxy data over transboundary regions. J. Hydrol. Eng. 2016, 21, 05016010. [Google Scholar] [CrossRef]
- Wild, T.B.; Loucks, D.P. Managing flow, sediment, and hydropower regimes in the Sre pok, Se san, and Se kong rivers of the Mekong basin. Water Resour. Res. 2014, 50, 5141–5157. [Google Scholar] [CrossRef]
- Yamauchi, K. Climate change impacts on agriculture and irrigation in the lower Mekong basin. Paddy Water Environ. 2014, 12, 227–240. [Google Scholar] [CrossRef]
- Giang, P.Q.; Toshiki, K.; Sakata, M.; Kunikane, S.; Vinh, T.Q. Modelling climate change impacts on the seasonality of water resources in the upper ca river watershed in Southeast Asia. Sci. World J. 2014, 2014, 279135. [Google Scholar] [CrossRef]
- Giang, P.Q.; Toshiki, K.; Sakata, M.; Kunikane, S. Modelling the seasonal response of sediment yield to climate change in the Laos-Vietnam transnational upper Ca River watershed. Environ. Asia 2014, 7, 152–162. [Google Scholar]
- Piman, T.; Lennaerts, T.; Southalack, P. Assessment of hydrological changes in the lower Mekong basin from basin-wide development scenarios. Hydrol. Process. 2013, 27, 2115–2125. [Google Scholar] [CrossRef]
- Piman, T.; Cochrane, T.A.; Arias, M.E.; Green, A.; Dat, N.D. Assessment of flow changes from hydropower development and operations in sekong, sesan, and srepok rivers of the mekong basin. J. Water Resour. Plan. Manag. 2013, 139, 723–732. [Google Scholar] [CrossRef]
- Trung, L.D.; Duc, N.A.; Nguyen, L.T.; Thai, T.H.; Khan, A.; Rautenstrauch, K.; Schmidt, C. Assessing cumulative impacts of the proposed lower mekong basin hydropower cascade on the Mekong river floodplains and delta—Overview of integrateoid modeling methods and results. J. Hydrol. 2018, in press. [Google Scholar] [CrossRef]
- Wen, X.; Liu, Z.; Lei, X.; Lin, R.; Fang, G.; Tan, Q.; Wang, C.; Tian, Y.; Quan, J. Future changes in yuan river ecohydrology: Individual and cumulative impacts of climates change and cascade hydropower development on runoff and aquatic habitat quality. Sci. Environ. 2018, 633, 1403–1417. [Google Scholar] [CrossRef]
- Sirisena, T.A.J.G.; Maskey, S.; Ranasinghe, R.; Babel, M.S. Effects of different precipitation inputs on streamflow simulation in the Irrawaddy River basin, Myanmar. J. Hydrol. Reg. Stud. 2018, 19, 265–278. [Google Scholar] [CrossRef]
- Chhuon, K.; Herrera, E.; Nadaoka, K. Application of integrated hydrologic and river basin management modeling for the optimal development of a multi-purpose reservoir project. Water Resour. Manag. 2016, 30, 3143–3157. [Google Scholar] [CrossRef]
- Arias, M.E.; Piman, T.; Lauri, H.; Cochrane, T.A.; Kummu, M. Dams on mekong tributaries as significant contributors of hydrological alterations to the Tonle Sap floodplain in Cambodia. Hydrol. Earth Syst. Sci. 2014, 18, 5303–5315. [Google Scholar] [CrossRef]
- Arias, M.E.; Cochrane, T.A.; Lawrence, K.S.; Killeen, T.J.; Farrell, T.A. Paying the forest for electricity: A modelling framework to market forest conservation as payment for ecosystem services benefiting hydropower generation. Environ. Conserv. 2011, 38, 473–484. [Google Scholar] [CrossRef]
- Thoeun, H.C. Observed and projected changes in temperature and rainfall in Cambodia. Weather Clim. Extremes 2015, 7, 61–71. [Google Scholar] [CrossRef]
- Marhaento, H.; Booij, M.J.; Rientjes, T.H.M.; Hoekstra, A.Y. Attribution of changes in the water balance of a tropical catchment to land use change using the SWAT model. Hydrol. Process. 2017, 31, 2029–2040. [Google Scholar] [CrossRef]
- Noda, K.; Yoshida, K.; Shirakawa, H.; Surahman, U.; Oki, K. Effect of land use change driven by economic growth on sedimentation in river reach in Southeast Asia—A case study in upper Citarum river basin. J. Agric. Meteorol. 2017, 73, 22–30. [Google Scholar] [CrossRef]
- Nurcahyo, H.; Soekarno, I.; Hadihardaja, I.K.; Rosyidie, A. Development flow duraton curve for criticality assesment of river basin applied at the upper Citarum River basin, Indonesia. Int. J. Geomate 2017, 13, 46–53. [Google Scholar] [CrossRef]
- Rospriandana, N.; Fujii, M. Assessment of small hydropower potential in the Ciwidey subwatershed, Indonesia: A GIS and hydrological modeling approach. Hydrol. Res. Lett. 2017, 11, 6–11. [Google Scholar] [CrossRef]
- Setyorini, A.; Khare, D.; Pingale, S.M. Simulating the impact of land use/land cover change and climate variability on watershed hydrology in the upper Brantas basin, Indonesia. Appl. Geomat. 2017, 9, 191–204. [Google Scholar] [CrossRef]
- Tarigan, S.D.; Sunarti; Wiegand, K.; Dislich, C.; Slamet, B.; Heinonen, J.; Meyer, K. Mitigation options for improving the ecosystem function of water flow regulation in a watershed with rapid expansion of oil palm plantations. Sustain. Water Qual. Ecol. 2016, 8, 4–13. [Google Scholar] [CrossRef]
- Rahayuningtyas, C.; Wu, R.S.; Anwar, R.; Chiang, L.C. Improving avswat stream flow simulation by incorporating groundwater recharge prediction in the upstream Lesti watershed, East Java, Indonesia. Terr. Atmos. Ocean. Sci. 2014, 25, 881–892. [Google Scholar] [CrossRef]
- Sunandar, A.D.; Suhendang, E.; Hendrayanto; Jaya, I.N.S.; Marimin. Land use optimization in Asahan watershed with linear programming and SWAT model. Int. J. Sci. Basic Appl. Res. 2014, 18, 63–78. [Google Scholar]
- Ridwansyah, I.; Pawitan, H.; Sinukaban, N.; Hidayat, Y. Watershed modeling with ArcSWAT and SUF12 in Cisadane catchment area: Calibration and validation of river flow prediction. Int. J. Sci. Eng. 2014, 6, 12–21. [Google Scholar] [CrossRef]
- Prasena, A.; Shrestha, D.B.P. Assessing the effects of land use change on runoff in Bedog sub watershed Yogyakarta. Indones. J. Geogr. 2013, 45, 48–61. [Google Scholar]
- Marhaento, H.; Booij, M.J.; Hoekstra, A.Y. Hydrological response to future land-use change and climate change in a tropical catchment. Hydrol. Sci. J. 2018, 63, 1368–1385. [Google Scholar] [CrossRef]
- Tarigan, S.; Wiegand, K.; Sunarti; Slamet, B. Minimum forest cover required for sustainable water flow regulation of a watershed: A case study in Jambi province, Indonesia. Hydrol. Earth Syst. Sci. 2018, 22, 581–594. [Google Scholar] [CrossRef]
- Kim, M.; Boithias, L.; Cho, K.H.; Silvera, N.; Thammahacksa, C.; Latsachack, K.; Rochelle-Newall, E.; Sengtaheuanghoung, O.; Pierret, A.; Pachepsky, Y.A.; et al. Hydrological modeling of fecal indicator bacteria in a tropical mountain catchment. Water Res. 2017, 119, 102–113. [Google Scholar] [CrossRef]
- Sayasane, R.; Kawasaki, A.; Shrestha, S.; Takamatsu, M. Assessment of potential impacts of climate and land use changes on stream flow: A case study of the Nam Xong watershed in Lao PDR. J. Water Clim. Chang. 2016, 7, 184–197. [Google Scholar] [CrossRef]
- Shrestha, B.; Babel, M.S.; Maskey, S.; van Griensven, A.; Uhlenbrook, S.; Green, A.; Akkharath, I. Impact of climate change on sediment yield in the mekong river basin: A case study of the Nam Ou basin, Lao PDR. Hydrol. Earth Syst. Sci. 2013, 17, 1–20. [Google Scholar] [CrossRef]
- Kim, M.; Boithias, L.; Cho, K.H.; Sengtaheuanghoung, O.; Ribolzi, O. Modeling the impact of land use change on basin-scale transfer of fecal indicator bacteria: SWAT model performance. J. Environ. Qual. 2018, 47, 1115–1122. [Google Scholar] [CrossRef]
- Shrestha, B.; Maskey, S.; Babel, M.S.; van Griensven, A.; Uhlenbrook, S. Sediment related impacts of climate change and reservoir development in the lower Mekong River basin: A case study of the Nam Ou basin, Lao PDR. Clim. Chang. 2018, 149, 13–27. [Google Scholar] [CrossRef]
- Tan, M.L.; Ibrahim, A.L.; Yusop, Z.; Chua, V.P.; Chan, N.W. Climate change impacts under CMIP5 RCP scenarios on water resources of the Kelantan River basin, Malaysia. Atmos. Res. 2017, 189, 1–10. [Google Scholar] [CrossRef]
- Xu, M.; Chua, V.P. A numerical study on land-based pollutant transport in Singapore coastal waters with a coupled hydrologic-hydrodynamic model. J. Hydro-Environ. Res. 2017, 14, 119–142. [Google Scholar] [CrossRef]
- Dlamini, N.S.; Kamal, M.R.; Soom, M.A.B.; bin Mohd, M.S.F.; Bin Abdullah, A.F.; Hin, L.S. Modeling potential impacts of climate change on streamflow using projections of the 5th assessment report for the Bernam River basin, Malaysia. Water 2017, 9, 226. [Google Scholar] [CrossRef]
- Mohd, M.S.F.; Mispan, M.R.; Juneng, L.; Tangang, F.T.; Rahman, N.F.A.; Khalid, K.; Rasid, M.Z.A.; Haron, S.H. Assessment of impacts of climate change on streamflow trend in upper Kuantan watershed. ARPN J. Eng. Appl. Sci. 2015, 10, 6634–6642. [Google Scholar]
- Tan, M.L.; Ibrahim, A.L.; Yusop, Z.; Duan, Z.; Ling, L. Impacts of land-use and climate variability on hydrological components in the Johor River basin, Malaysia. Hydrol. Sci. J. 2015, 60, 873–889. [Google Scholar] [CrossRef]
- Tan, M.L.; Ficklin, D.L.; Dixon, B.; Ibrahim, A.L.; Yusop, Z.; Chaplot, V. Impacts of DEM resolution, source, and resampling technique on SWAT-simulated streamflow. Appl. Geogr. 2015, 63, 357–368. [Google Scholar] [CrossRef]
- Tan, M.L.; Ficklin, D.L.; Ibrahim, A.L.; Yusop, Z. Impacts and uncertainties of climate change on streamflow of the Johor River basin, Malaysia using a CMIP5 general circulation model ensemble. J. Water Clim. Chang. 2014, 5, 676–695. [Google Scholar] [CrossRef]
- Memarian, H.; Balasundram, S.K.; Abbaspour, K.C.; Talib, J.B.; Teh Boon Sung, C.; Sood, A.M. SWAT-based hydrological modelling of tropical land use scenarios. Hydrol. Sci. J. 2014, 59, 1808–1829. [Google Scholar] [CrossRef]
- Hasan, Z.A.; Hamidon, N.; Yusof, M.S.; Ab Ghani, A. Flow and sediment yield simulations for Bukit Merah reservoir catchment, Malaysia: A case study. Water Sci. Technol. 2012, 66, 2170–2176. [Google Scholar] [CrossRef]
- Tan, M.L.; Ramli, H.P.; Tam, T.H. Effect of DEM resolution, source, resampling technique and area threshold on SWAT outputs. Water Resour. Manag. 2018, 32, 4591–4606. [Google Scholar] [CrossRef]
- Shrestha, M.; Shrestha, S.; Datta, A. Assessment of climate change impact on water diversion from the Bago River to the Moeyingyi wetland, Myanmar. Curr. Sci. 2017, 112, 377–384. [Google Scholar] [CrossRef]
- Shrestha, S.; Htut, A.Y. Modelling the potential impacts of climate change on hydrology of the Bago River basin, Myanmar. Int. J. River Basin Manag. 2016, 14, 287–297. [Google Scholar] [CrossRef]
- Shrestha, S.; Htut, A.Y. Land use and climate change impacts on the hydrology of the Bago River basin, Myanmar. Environ. Model. Assess. 2016, 21, 819–833. [Google Scholar] [CrossRef]
- Briones, R.U.; Ella, V.B.; Bantayan, N.C. Hydrologic impact evaluation of land use and land cover change in Palico watershed, Batangas, Philippines using the swat model. J. Environ. Sci. Manag. 2016, 19, 96–107. [Google Scholar]
- Palao, L.K.M.; Dorado, M.M.; Anit, K.P.A.; Lasco, R.D. Using the Soil and Water Assessment Tool (SWAT) to assess material transfer in the layawan watershed, mindanao, philippines and its implications on payment for ecosystem services. J. Sustain. Dev. 2013, 6, 73–88. [Google Scholar] [CrossRef]
- Alibuyong, N.R.; Ella, V.B.; Reyes, M.R.; Srinivasan, R.; Heatwole, C.; Dillaha, T. Predicting the effects of land use change on runoff and sediment yield in Manupali River subwatersheds using the SWAT model. Int. Agric. Eng. J. 2009, 18, 15–25. [Google Scholar]
- Boongaling, C.G.K.; Faustino-Eslava, D.V.; Lansigan, F.P. Modeling land use change impacts on hydrology and the use of landscape metrics as tools for watershed management: The case of an ungauged catchment in the Philippines. Land Use Policy 2018, 72, 116–128. [Google Scholar] [CrossRef]
- Prasanchum, H.; Kangrang, A. Optimal reservoir rule curves under climatic and land use changes for Lampao dam using genetic algorithm. KSCE J. Civ. Eng. 2017, 22, 351–364. [Google Scholar] [CrossRef]
- Wangpimool, W.; Pongput, K.; Tangtham, N.; Prachansri, S.; Gassman, P.W. The impact of para rubber expansion on streamflow and other water balance components of the Nam Loei River basin, Thailand. Water 2017, 9, 1. [Google Scholar] [CrossRef]
- Jamrussri, S.; Toda, Y. Simulating past severe flood events to evaluate the effectiveness of nonstructural flood countermeasures in the upper chao phraya river basin, thailand. J. Hydrol. Reg. Stud. 2017, 10, 82–94. [Google Scholar] [CrossRef]
- Jakrawatana, N.; Ngammuangtueng, P.; Gheewala, S.H. Linking substance flow analysis and Soil and Water Assessment Tool for nutrient management. J. Clean. Prod. 2017, 142, 1158–1168. [Google Scholar] [CrossRef]
- Phukoetphim, P.; Shamseldin, A.Y.; Adams, K. Multimodel approach using neural networks and symbolic regression to combine the estimated discharges of rainfall-runoff models. J. Hydrol. Eng. 2016, 21, 04016022. [Google Scholar] [CrossRef]
- Kheereemangkla, Y.; Shrestha, R.P.; Shrestha, S.; Jourdain, D. Modeling hydrologic responses to land management scenarios for the Chi River sub-basin part II, Northeast Thailand. Environ. Earth Sci. 2016, 75, 793. [Google Scholar] [CrossRef]
- Bannwarth, M.A.; Grovermann, C.; Schreinemachers, P.; Ingwersen, J.; Lamers, M.; Berger, T.; Streck, T. Non-hazardous pesticide concentrations in surface waters: An integrated approach simulating application thresholds and resulting farm income effects. J. Environ. Manag. 2016, 165, 298–312. [Google Scholar] [CrossRef]
- Bannwarth, M.A.; Hugenschmidt, C.; Sangchan, W.; Lamers, M.; Ingwersen, J.; Ziegler, A.D.; Streck, T. Simulation of stream flow components in a mountainous catchment in Northern Thailand with SWAT, using the Anselm calibration approach. Hydrol. Process. 2015, 29, 1340–1352. [Google Scholar] [CrossRef]
- Bannwarth, M.A.; Sangchan, W.; Hugenschmidt, C.; Lamers, M.; Ingwersen, J.; Ziegler, A.D.; Streck, T. Pesticide transport simulation in a tropical catchment by SWAT. Environ. Pollut. 2014, 191, 70–79. [Google Scholar] [CrossRef]
- Ligaray, M.; Kim, H.; Sthiannopkao, S.; Lee, S.; Cho, K.H.; Kim, J.H. Assessment on hydrologic response by climate change in the Chao Phraya River basin, Thailand. Water 2015, 7, 6892–6909. [Google Scholar] [CrossRef]
- Pongpetch, N.; Suwanwaree, P.; Yossapol, C.; Dasananda, S.; Kongjun, T. Using swat to assess the critical areas and nonpoint source pollution reduction best management practices in Lam Takong River basin, thailand. Environ. Asia 2015, 8, 41–52. [Google Scholar]
- Singkran, N.; Tosang, J.; Waijaroen, D.; Intharawichian, N.; Vannarart, O.; Anantawong, P.; Kunta, K.; Wisetsopa, P.; Tipvong, T.; Janjirawuttikul, N.; et al. Influences of land use and climate changes on hydrologic system in the northeastern river basin of Thailand. J. Water Clim. Chang. 2015, 6, 325–340. [Google Scholar] [CrossRef]
- Yasin, H.Q.; Clemente, R.S. Application of swat model for hydrologic and water quality modeling in Thachin River basin, Thailand. Arab. J. Sci. Eng. 2014, 39, 1671–1684. [Google Scholar] [CrossRef]
- Wangpimool, W.; Pongput, K.; Sukvibool, C.; Sombatpanit, S.; Gassman, P.W. The effect of reforestation on stream flow in upper nan river basin using Soil and Water Assessment Tool (SWAT) model. Int. Soil Water Conserv. Res. 2013, 1, 53–63. [Google Scholar] [CrossRef]
- Sangmanee, C.; Wattayakorn, G.; Sojisuporn, P. Simulating changes in discharge and suspended sediment loads of the Bangpakong River, Thailand, driven by future climate change. Maejo Int. J. Sci. Technol. 2013, 7, 72–84. [Google Scholar]
- Homdee, T.; Pongput, K.; Kanae, S. Impacts of land cover changes on hydrologic responses: A case study of Chi River basin, Thailand. Annu. J. Hydraul. Eng. 2011, 55, S31–S36. [Google Scholar] [CrossRef]
- Babel, M.S.; Shrestha, B.; Perret, S.R. Hydrological impact of biofuel production: A case study of the Khlong Phlo watershed in Thailand. Agric. Water Manag. 2011, 101, 8–26. [Google Scholar] [CrossRef]
- Kuntiyawichai, K.; Schultz, B.; Uhlenbrook, S.; Suryadi, F.X.; Van Griensven, A. Comparison of flood management options for the Yang River basin, Thailand. Irrig. Drain. 2011, 60, 526–543. [Google Scholar] [CrossRef]
- Phomcha, P.; Wirojanagud, P.; Vangpaisal, T.; Thaveevouthti, T. Predicting sediment discharge in an agricultural watershed: A case study of the Lam Sonthi watershed, Thailand. Sci. Asia 2011, 37, 43–50. [Google Scholar] [CrossRef]
- Phomcha, P.; Wirojanagud, P.; Vangpaisal, T.; Thaveevouthti, T. Suitability of swat model for simulating of monthly streamflow in Lam Sonthi watershed. J. Ind. Technol. 2011, 7, 49–56. [Google Scholar]
- Reungsang, P.; Kanwar, R.S.; Srisuk, K. Application of swat model in simulating stream flow for the Chi River subbasin II in Northeast Thailand. Trends Res. Sci. Technol. 2010, 2, 25–38. [Google Scholar]
- Graiprab, P.; Pongput, K.; Tangtham, N.; Gassman, P.W. Hydrologic evaluation and effect of climate change on the at Samat watershed, northeastern region, Thailand. Int. Agric. Eng. J. 2010, 19, 12–22. [Google Scholar]
- Vathananukij, H. Geoinformatic public domain system model “SWAT” in Thailand. Kasetsart J. Nat. Sci. 2006, 40, 264–272. [Google Scholar]
- Kangrang, A.; Prasanchum, H.; Hormwichian, R. Development of future rule curves for multipurpose reservoir operation using conditional genetic and tabu search algorithms. Adv. Civ. Eng. 2018, 2018, 6474870. [Google Scholar] [CrossRef]
- Mahaarcha, V.; Tangham, N. Reevaluating fmolp decision variable coefficients using the SWAT results for the optimization of sustainable agricultural land use in small watershed. Mod. Appl. Sci. 2013, 7, 59–76. [Google Scholar] [CrossRef]
- Ongsomwang, S.; Iamchuen, N. Integration of geospatial models for optimum land use allocation in three different scenarios. Suranaree J. Sci. Technol. 2015, 22, 377–396. [Google Scholar]
- Huyen, N.T.; Tu, L.H.; Tram, V.N.Q.; Minh, D.N.; Liem, N.D.; Loi, N.K. Assessing the impacts of climate change on water resources in the Srepok watershed, central highland of Vietnam. J. Water Clim. Chang. 2017, 8, 524–534. [Google Scholar] [CrossRef]
- Thom, V.; Khoi, D.; Linh, D. Using gridded rainfall products in simulating streamflow in a tropical catchment—A case study of the Srepok River catchment, Vietnam. J. Hydrol. Hydromech. 2017, 65, 18–25. [Google Scholar] [CrossRef]
- Duong, H.N.; Nguyen, H.T.; Vaclav, S.; Sanghyuk, L. A comparative study of SWAT, RFNN and RFNN-GA for predicting river runoff. Indian J. Sci. Technol. 2016, 9, 10–12. [Google Scholar] [CrossRef]
- Le, T.B.; Sharif, H.O. Modeling the projected changes of river flow in central Vietnam under different climate change scenarios. Water 2015, 7, 3579–3598. [Google Scholar] [CrossRef]
- Khoi, D.N.; Thom, V.T. Impacts of climate variability and land-use change on hydrology in the period 1981–2009 in the central highlands of Vietnam. Glob. Nest J. 2015, 17, 870–881. [Google Scholar]
- Anh, N.V.; Fukuda, S.; Hiramatsu, K.; Harada, M. Sensitivity-based calibration of the Soil and Water Assessment Tool for hydrologic cycle simulation in the Cong watershed, Vietnam. Water Environ. Res. 2015, 87, 735–750. [Google Scholar] [CrossRef] [PubMed]
- Ngo, T.S.; Nguyen, D.B.; Shrestha, R.P. Effect of land use change on runoff and sediment yield in Da River basin of Hoa Binh province, Northwest Vietnam. J. Mt. Sci. 2015, 12, 1051–1064. [Google Scholar] [CrossRef]
- Vu, M.T.; Raghavan, V.S.; Liong, S.Y. Ensemble climate projection for hydro-meteorological drought over a river basin in central highland, Vietnam. KSCE J. Civ. Eng. 2015, 19, 427–433. [Google Scholar] [CrossRef]
- Nguyen, H.Q.; Kappas, M. Modeling surface runoff and evapotranspiration using SWAT and beach for a tropical watershed in North Vietnam, compared to MODIS products. Int. J. Adv. Remote Sens. GIS 2015, 4, 1367–1384. [Google Scholar] [CrossRef]
- Khoi, D.N.; Thom, V.T. Parameter uncertainty analysis for simulating streamflow in a river catchment of vietnam. Glob. Ecol. Conserv. 2015, 4, 538–548. [Google Scholar] [CrossRef]
- Le, T.B.; Al-Juaidi, F.H.; Sharif, H. Hydrologic simulations driven by satellite rainfall to study the hydroelectric development impacts on river flow. Water 2014, 6, 3631–3651. [Google Scholar] [CrossRef]
- Khoi, D.N.; Suetsugi, T. The responses of hydrological processes and sediment yield to land-use and climate change in the Be River catchment, Vietnam. Hydrol. Process. 2014, 28, 640–652. [Google Scholar] [CrossRef]
- Khoi, D.N.; Suetsugi, T. Impact of climate and land-use changes on hydrological processes and sediment yield-a case study of the Be River catchment, Vietnam. Hydrol. Sci. J.-J. Sci. Hydrol. 2014, 59, 1095–1108. [Google Scholar] [CrossRef]
- Raghavan, S.V.; Tue, V.M.; Liong, S.Y. Impact of climate change on future stream flow in the Dakbla River basin. J. Hydroinform. 2014, 16, 231–244. [Google Scholar] [CrossRef]
- Raghavan, S.V.; Vu, M.T.; Liong, S.Y. Assessment of future stream flow over the sesan catchment of the Lower Mekong basin in Vietnam. Hydrol. Process. 2012, 26, 3661–3668. [Google Scholar] [CrossRef]
- Khoi, D.N.; Suetsugi, T. Assessment of climate change impacts on hydrology and sediment yield in the Be River catchment, Vietnam. J. Jpn. Soc. Civ. Eng. Ser. B1 (Hydraul. Eng.) 2013, 69, I31–I36. [Google Scholar] [CrossRef]
- Quyen, N.T.N.; Liem, N.D.; Loi, N.K. Effect of land use change on water discharge in Srepok watershed, central highland, Vietnam. Int. Soil Water Conserv. Res. 2014, 2, 74–86. [Google Scholar] [CrossRef]
- Nguyen, B.N.; Nguyen, H.K.L. Basin resources management: Simulating soil erosion risk by Soil and Water Assessment Tool (SWAT) in Ta Trach River watershed, central Vietnam. J. Vietnam. Environ. 2014, 6, 165–170. [Google Scholar]
- Phuong, T.T.; Thong, C.V.T.; Ngoc, N.B.; Chuong, H.V. Modeling soil erosion within small mountainous watershed in central Vietnam using GIS and SWAT. Resour. Environ. 2014, 4, 139–147. [Google Scholar]
- Tram, V.N.Q.; Liem, N.D.; Loi, N.K. Assessing water availability in Poko catchment using SWAT model. Khon Kaen Agric. J. 2014, 42, 73–84. [Google Scholar]
- Loi, N.K.; Liêm, N.D.; Thien, P.C.; Phan, L.V.; Tú, L.H.; Thuy, H.T.; Trai, N.V.; Quynh, T.L.N.; Phúc, L.T.; Huyen, N.T.; et al. Development of an online supporting system flood warning for Vu Gia watershed, Quang Nam province, Vietnam: Conceptual framework and proposed research techniques. VNU J. Earth Environ. Sci. 2013, 29, 38–44. [Google Scholar]
- Bang, H.Q.; Quan, N.H.; Phu, V.L. Impacts of climate change on catchment flows and assessing its impacts on hydropower in Vietnam’s central highland region. Glob. Perspect. Geogr. 2013, 1, 1–8. [Google Scholar]
- Khoi, D.N.; Suetsugi, T. Uncertainty in climate change impacts on streamflow in Be River catchment, Vietnam. Water Environ. J. 2012, 26, 530–539. [Google Scholar] [CrossRef]
- Khoi, D.N.; Suetsugi, T. Hydrologic response to climate change: A case study for the Be River catchment, Vietnam. J. Water Clim. Chang. 2012, 3, 207–224. [Google Scholar] [CrossRef]
- Vu, M.T.; Raghavan, S.V.; Liong, S.Y. SWAT use of gridded observations for simulating runoff—A Vietnam iver basin study. Hydrol. Earth Syst. Sci. 2012, 16, 2801–2811. [Google Scholar] [CrossRef]
- Wang, J.; Ishidaira, H. Effects of climate change and human activites on streamflow and sediment flow into the Hoa Binh reservoir. J. Jpn. Soc. Civ. Eng. Ser. B1 (Hydraul. Eng.) 2012, 68, I91–I96. [Google Scholar]
- Phan, D.B.; Wu, C.C.; Hsieh, S.C. Land use change effects on discharge and sediment yield of Song Cau catchment in Northern Vietnam. J. Environ. Sci. Eng. 2011, 5, 92–101. [Google Scholar]
- Phan, D.B.; Wu, C.C.; Hsieh, S.C. Impact of climate change on stream discharge and sediment yield in Northern Vietnam. Water Resour. 2011, 38, 827–836. [Google Scholar] [CrossRef]
- Ha, L.T.; Bastiaanssen, W.G.M.; Van Griensven, A.; Van Dijk, A.I.J.M.; Senay, G.B. Calibration of spatially distributed hydrological processes and model parameters in swat using remote sensing data and an auto-calibration procedure: A case study in a Vietnamese river basin. Water 2018, 10, 212. [Google Scholar] [CrossRef]
- Son, N.T.; Nhu, N.Y. Applying swat model to simulate streamflow in Ben Hai river basin in response to climate change scenarios. VNU J. Sci. Earth Environ. Sci. 2009, 25, 161–167. [Google Scholar]
- Ravi, S.K.; Ghosh, K.S.; Thach, N.N.; Canh, P.X. Simulation of runoff and sediment yield for the Calo watershed, Vinh Phuc province by using swat model. VNU J. Sci. Earth Environ. Sci. 2011, 27, 174–190. [Google Scholar]
- Nguyen, Q.H.; Le, T.T.H.; Pham, T.T.N.; Kappas, M. Modelling surface runoff and soil erosion for Yen Bai province, Vietnam, using the Soil and Water Assessment Tool (SWAT). J. Vietnam. Environ. 2016, 8, 71–79. [Google Scholar]
- Thang, L.V.; Khoi, D.N.; Phi, H.L. Impact of climate change on streamflow and water quality in the upper Dong Nai River basin, Vietnam. La Houille Blanche 2018, 1, 70–79. [Google Scholar] [CrossRef]
- Thai, T.H.; Thao, N.P.; Dieu, B.T. Assessment and simulation of impacts of climate change on erosion and water flow by using the Soil and Water Assessment Tool and GIS: Case study in upper Cau River basin in Vietnam. Vietnam J. Earth Sci. 2017, 39, 362–375. [Google Scholar] [CrossRef]
- Moriasi, D.N.; Arnold, J.G.; van Liew, M.W.; Binger, R.L.; Harmel, R.D.; Veith, T. Model evaluation guidelines for systematic quantification of accuracy in watershed simulations. Trans. ASABE 2007, 50, 885–900. [Google Scholar] [CrossRef]
- Moriasi, D.N.; Gitau, M.W.; Pai, N.; Daggupati, P. Hydrologic and water quality models: Performance measures and evaluation criteria. Trans. ASABE 2015, 58, 1763–1785. [Google Scholar]
- Nakicenovic, N.; Swart, R. IPCC Special Report on Emissions Scenarios (SRES); Cambridge University Press: Cambridge, UK, 2000. [Google Scholar]
- Meinshausen, M.; Smith, S.J.; Calvin, K.; Daniel, J.S.; Kainuma, M.L.T.; Lamarque, J.F.; Matsumoto, K.; Montzka, S.A.; Raper, S.C.B.; Riahi, K.; et al. The RCP greenhouse gas concentrations and their extensions from 1765 to 2300. Clim. Chang. 2011, 109, 213–241. [Google Scholar] [CrossRef]
- Phomcha, P.; Wirojanagud, P.; Vangpaisal, T.; Thaveevouthti, T. Modeling the impacts of alternative soil conservation practices for an agricultural watershed with the swat model. Procedia Eng. 2012, 32, 1205–1213. [Google Scholar] [CrossRef]
- Mekong River Commission. Available online: http://www.mrcmekong.org/ (accessed on 15 March 2019).
- Francesconi, W.; Srinivasan, R.; Perez-Minana, E.; Willcock, S.P.; Quintero, M. Using the Soil and Water Assessment Tool (SWAT) to model ecosystem services: A systematic review. J. Hydrol. 2016, 535, 625–636. [Google Scholar] [CrossRef]
- Arnold, J.G.; Youssef, M.A.; Yen, H.; White, M.J.; Sheshukov, A.Y.; Sadeghi, A.M.; Moriasi, D.N.; Steiner, J.L.; Amatya, D.M.; Skaggs, R.W.; et al. Hydrological processes and model representation: Impact of soft data on calibration. Trans. ASABE 2015, 58, 1637–1660. [Google Scholar]
- Wagner, P.D.; Kumar, S.; Fiener, P.; Schneider, K. Hydrological modeling with SWAT in a monsoon-driven environment: Experience from the western Ghats, India. Trans. ASABE 2011, 54, 1783–1790. [Google Scholar] [CrossRef]
- Strauch, M.; Volk, M. Swat plant growth modification for improved modeling of perennial vegetation in the tropics. Ecol. Model. 2013, 269, 98–112. [Google Scholar] [CrossRef]
- Alemayehu, T.; van Griensven, A.; Woldegiorgis, B.T.; Bauwens, W. An improved swat vegetation growth module and its evaluation for four tropical ecosystems. Hydrol. Earth Syst. Sci. 2017, 21, 4449–4467. [Google Scholar] [CrossRef]
- Krysanova, V.; Müller-Wohlfeil, D.-I.; Becker, A. Development and test of a spatially distributed hydrological/water quality model for mesoscale watersheds. Ecol. Model. 1998, 106, 261–289. [Google Scholar] [CrossRef]
- Eckhardt, K.; Haverkamp, S.; Fohrer, N.; Frede, H.G. Swat-g, a version of SWAT99.2 modified for application to low mountain range catchments. Phys. Chem. Earth Parts A/B/C 2002, 27, 641–644. [Google Scholar] [CrossRef]
- Kim, N.W.; Chung, I.M.; Won, Y.S.; Arnold, J.G. Development and application of the integrated SWAT–MODLOW model. J. Hydrol. 2008, 356, 1–16. [Google Scholar] [CrossRef]
- Van Griensven, A.; Bauwens, W. Application and evaluation of ESWAT on the Dender basin and the Wister lake basin. Hydrol. Process. 2005, 19, 827–838. [Google Scholar] [CrossRef]
- Rathjens, H.; Oppelt, N.; Bosch, D.D.; Arnold, J.G.; Volk, M. Development of a grid-based version of the swat landscape model. Hydrol. Process. 2015, 29, 900–914. [Google Scholar] [CrossRef]
- Mannschatz, T.; Wolf, T.; Hulsmann, S. Nexus tools platform: Web-based comparison of modelling tools for analysis of water-soil-waste nexus. Environ. Model. Softw. 2016, 76, 137–153. [Google Scholar] [CrossRef]
- Kite, G.W.; Pietroniro, A. Remote sensing applications in hydrological modelling. Hydrol. Sci. J. 1996, 41, 563–591. [Google Scholar] [CrossRef]
Figure 1.
Number of SWAT studies in Southeast Asia (the totals for each country include transnational studies that were performed for multiple countries).
Figure 1.
Number of SWAT studies in Southeast Asia (the totals for each country include transnational studies that were performed for multiple countries).

Figure 2.
SWAT publications for entire globe and for Southeast Asia.

Figure 3.
Watershed size of SWAT studies in Southeast Asia.


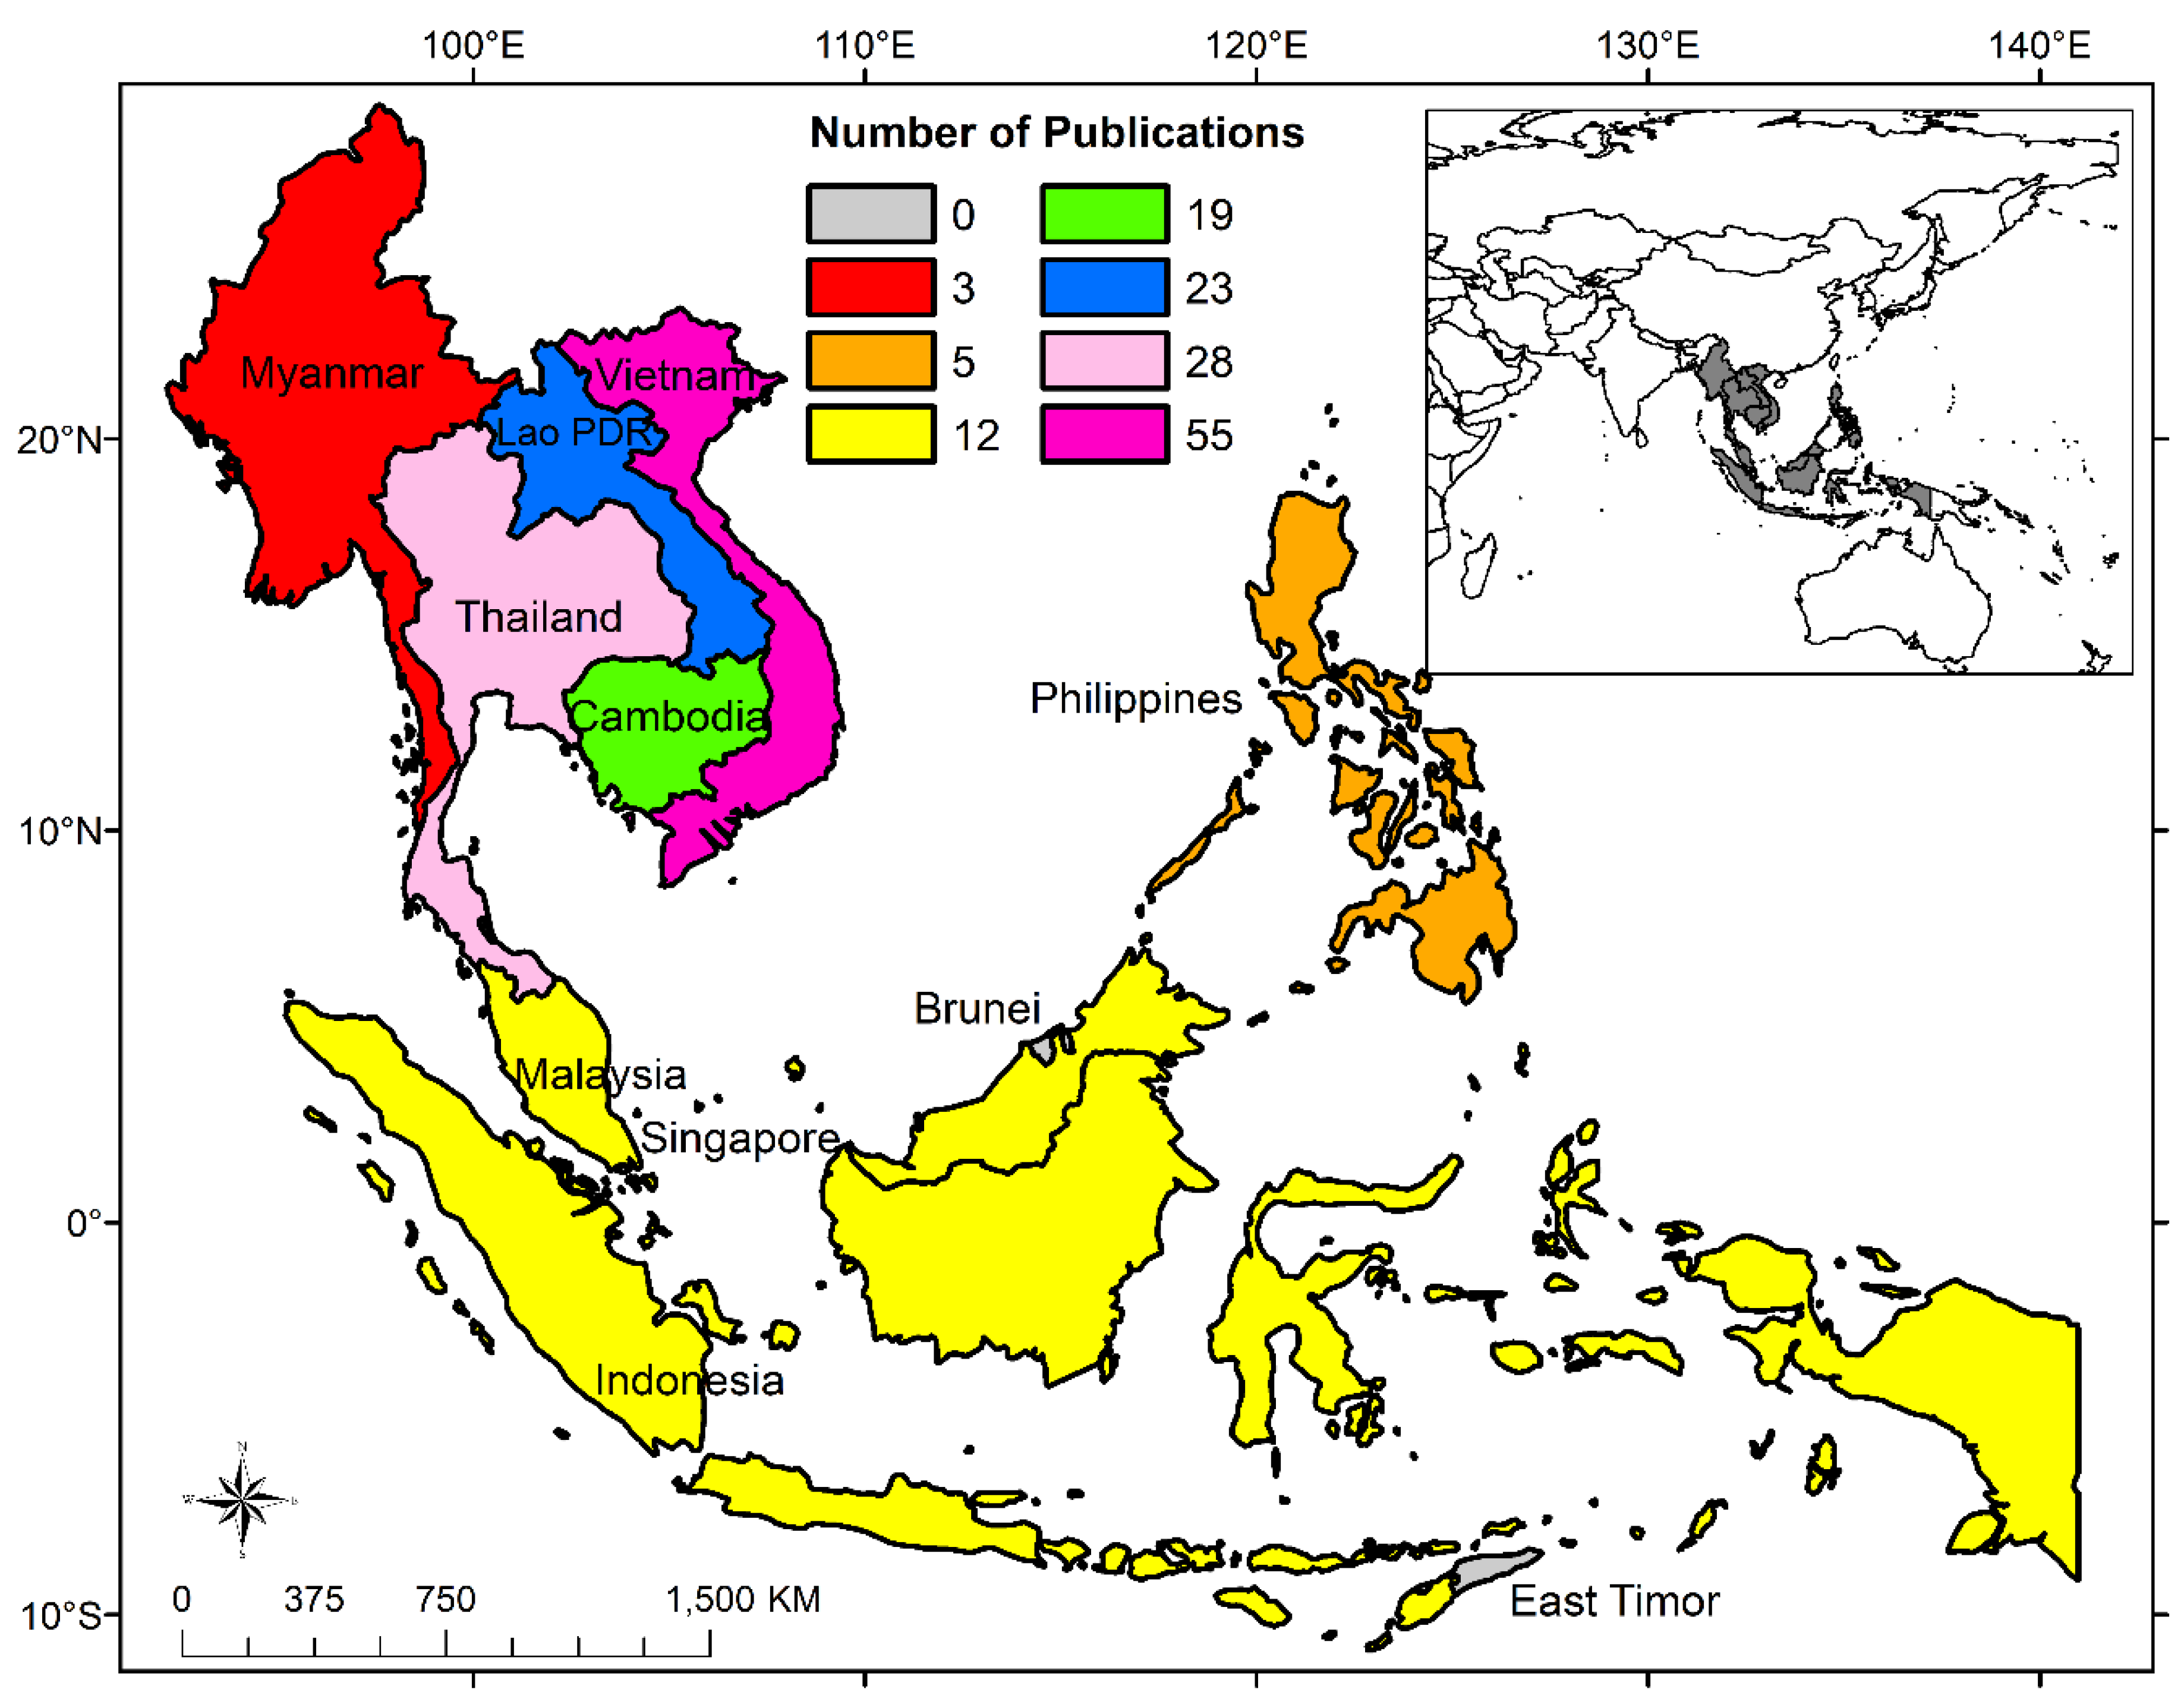
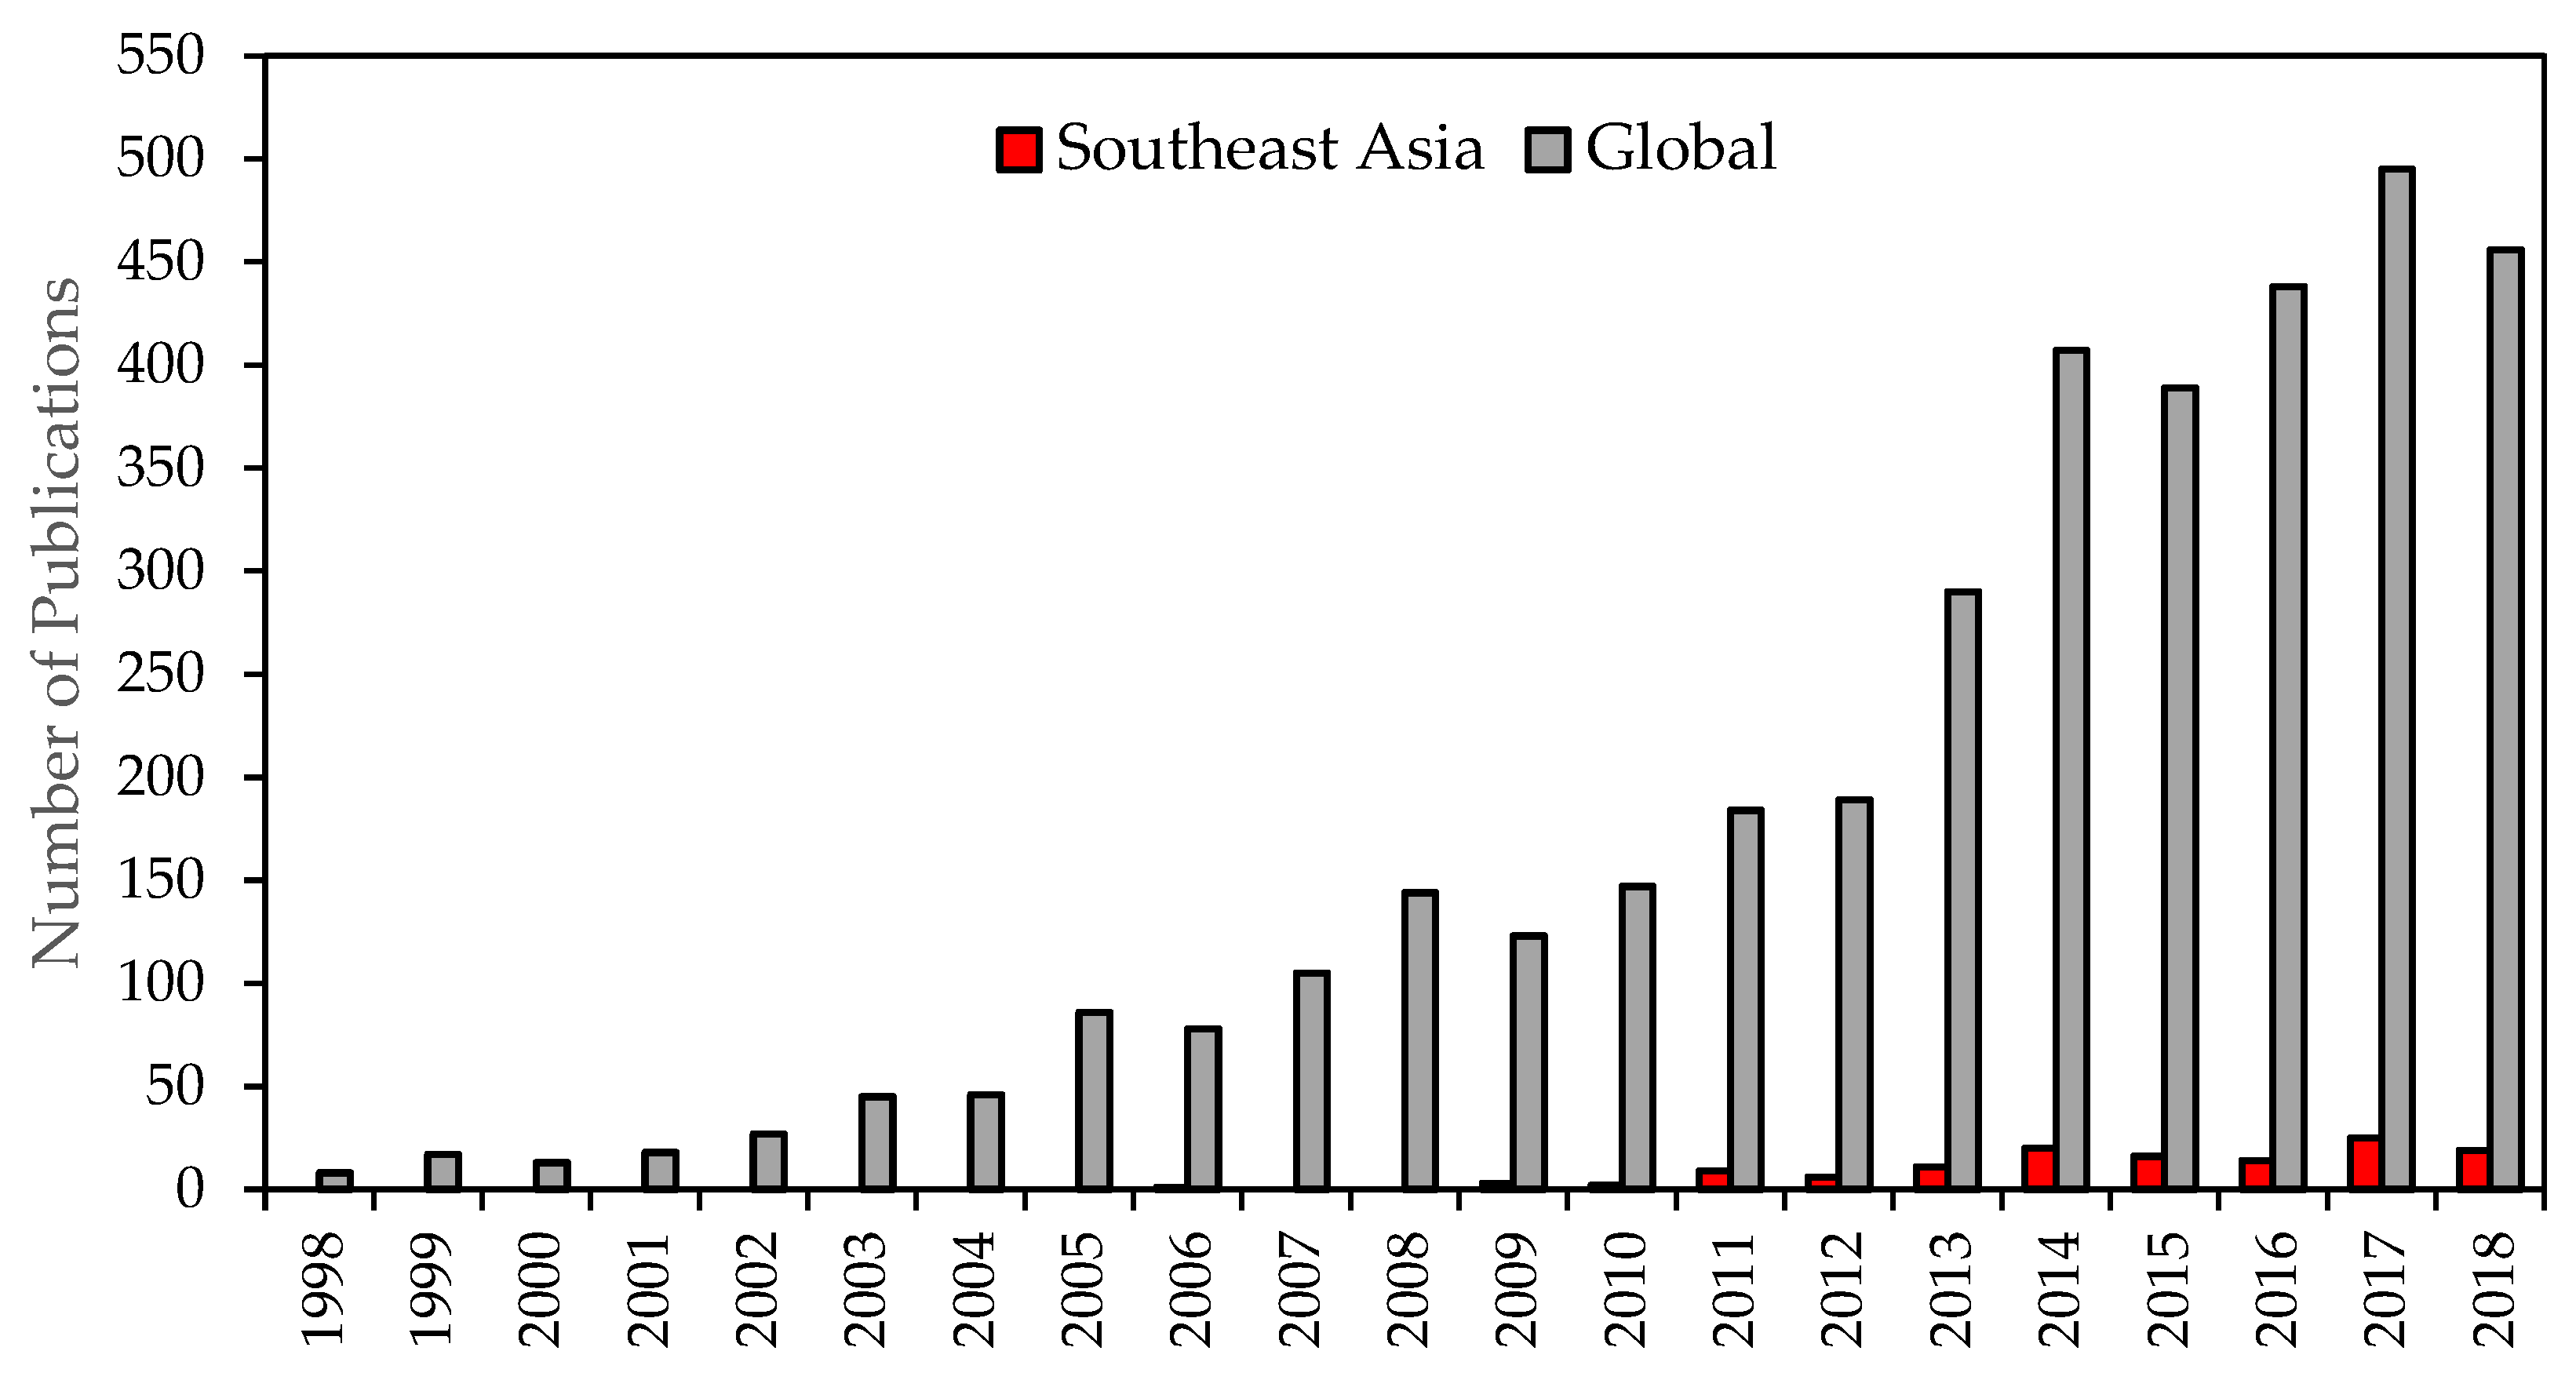
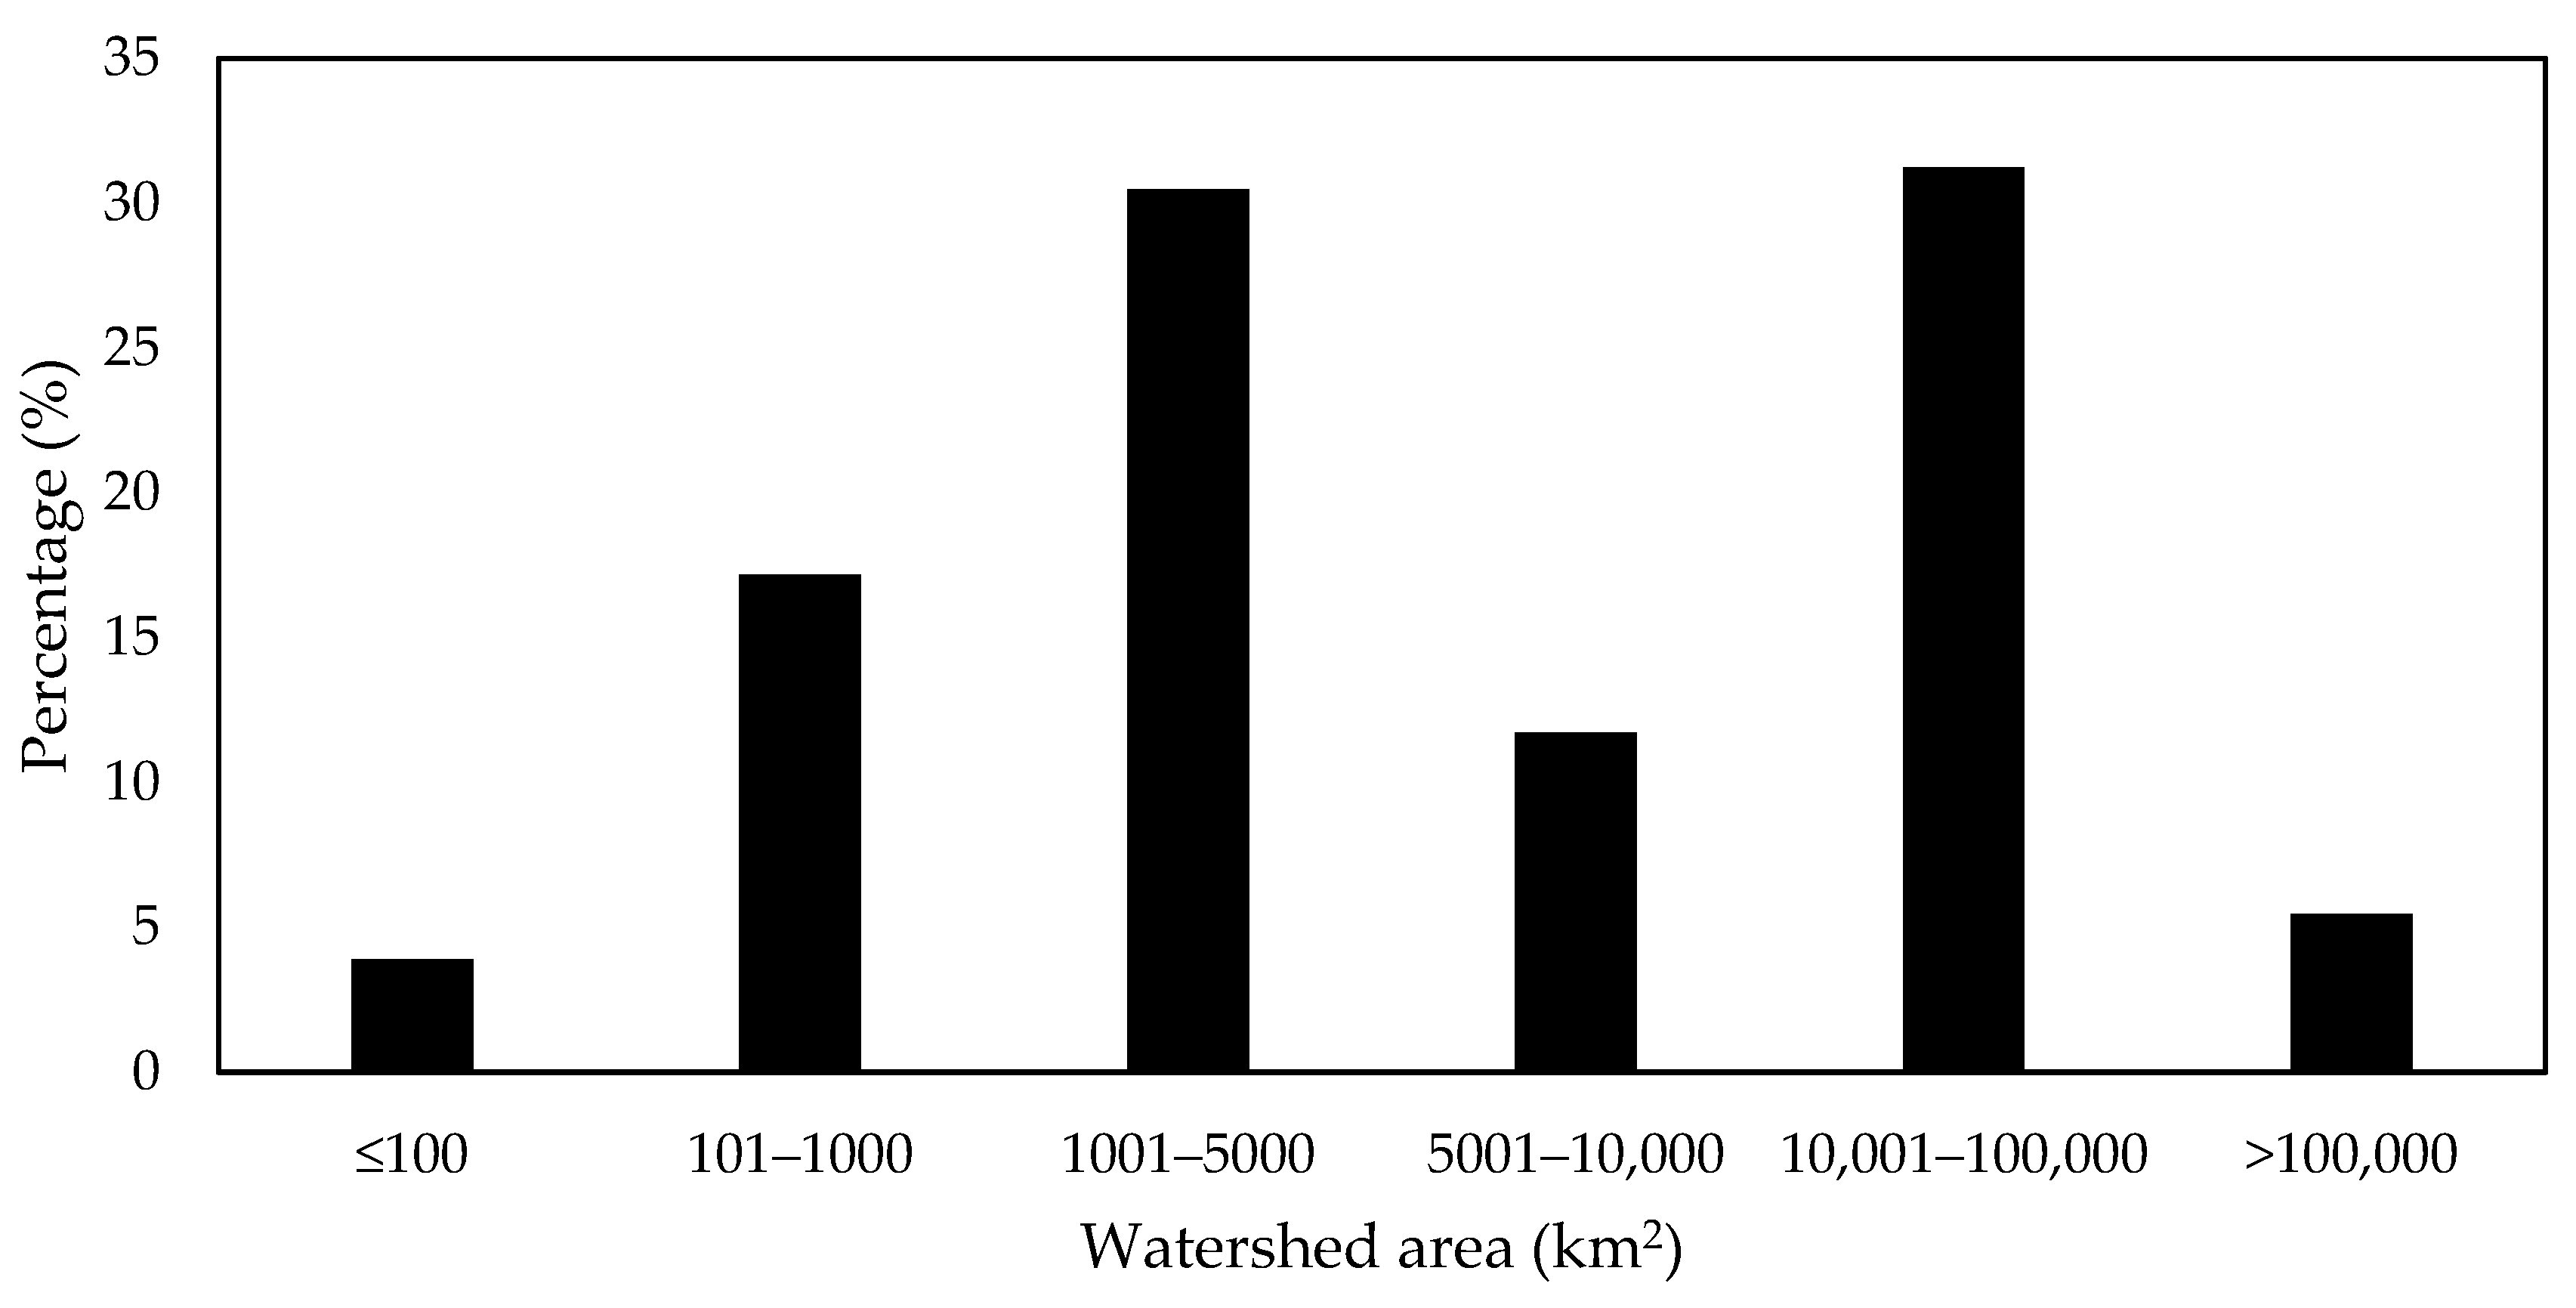
Table 1.
References of the SWAT studies in Southeast Asia reviewed in this paper.
| Region | Number of Publications | Reference |
|---|---|---|
| Transnational | 20 | [39,43,44,45,63,64,65,66,67,68,69,70,71,72,73,74,75,76,77,78] |
| Cambodia | 5 | [53,79,80,81,82] |
| Indonesia | 12 | [83,84,85,86,87,88,89,90,91,92,93,94] |
| Lao PDR | 5 | [95,96,97,98,99] |
| Malaysia | 12 | [46,47,100,101,102,103,104,105,106,107,108,109] |
| Myanmar | 3 | [110,111,112] |
| Philippines | 5 | [52,113,114,115,116] |
| Thailand | 28 | [49,51,117,118,119,120,121,122,123,124,125,126,127,128,129,130,131,132,133,134,135,136,137,138,139,140,141,142] |
| Vietnam | 36 | [48,50,143,144,145,146,147,148,149,150,151,152,153,154,155,156,157,158,159,160,161,162,163,164,165,166,167,168,169,170,171,172,173,174,175,176] |
Table 2.
Summary of reported SWAT model performance in streamflow simulations in Southeast Asia.
| Monthly | Daily | |||||||
|---|---|---|---|---|---|---|---|---|
| Frequency Ranges | Calibration | Validation | Calibration | Validation | ||||
| NSE | R2 | NSE | R2 | NSE | R2 | NSE | R2 | |
| 0.90–1.00 | 52 | 32 | 49 | 36 | 14 | 1 | 17 | 3 |
| 0.80–0.89 | 81 | 45 | 55 | 27 | 20 | 19 | 17 | 16 |
| 0.70–0.79 | 40 | 11 | 59 | 51 | 31 | 17 | 37 | 19 |
| 0.60–0.69 | 26 | 6 | 28 | 49 | 22 | 18 | 35 | 13 |
| 0.50–0.59 | 12 | 1 | 34 | 12 | 27 | 13 | 22 | 14 |
| 0.40–0.49 | 3 | 0 | 34 | 8 | 17 | 5 | 10 | 5 |
| 0.30–0.39 | 1 | 0 | 4 | 2 | 9 | 1 | 10 | 0 |
| 0.20–0.29 | 1 | 0 | 2 | 3 | 3 | 1 | 2 | 1 |
| 0.10–0.19 | 0 | 0 | 3 | 3 | 1 | 0 | 1 | 0 |
| 0.00–0.09 | 0 | 0 | 3 | 0 | 0 | 0 | 0 | 1 |
| <0 | 1 | 0 | 4 | 0 | 1 | 0 | 4 | 0 |
| Total | 217 | 95 | 275 | 191 | 145 | 75 | 155 | 72 |
Table 3.
The range of statistical values reported for SWAT streamflow calibration and validation by specific Southeast Asia countries.
Table 3.
The range of statistical values reported for SWAT streamflow calibration and validation by specific Southeast Asia countries.
| Monthly | Daily | |||||||
|---|---|---|---|---|---|---|---|---|
| Calibration | Validation | Calibration | Validation | |||||
| NSE | R2 | NSE | R2 | NSE | R2 | NSE | R2 | |
| Transnational | −0.01–0.96 | 0.68–0.96 | 0.07–0.95 | 0.11–0.97 | −0.33–0.95 | 0.54–0.89 | −0.4–0.97 | 0.53–0.89 |
| Cambodia | 0.6 | - | 0.27 | - | 0.38 | - | −6.61–0.91 | 0.8–0.94 |
| Indonesia | 0.55-0.88 | 0.78–0.89 | <0–0.88 | 0.51–0.81 | 0.4–1 | 0.49–0.91 | 0.41–1 | 0.5–0.92 |
| Lao PDR | - | - | - | - | 0.6–0.66 | 0.6–0.66 | 0.57–0.82 | 0.66–0.74 |
| Malaysia | 0.62–0.88 | 0.67–0.88 | 0.41–0.85 | 0.59–0.91 | 0.84 | 0.85 | 0.66–0.89 | 0.69–0.9 |
| Myanmar | 0.82–0.86 | 0.81–0.93 | 0.81 | 0.82–0.93 | 0.5–0.73 | 0.53–0.79 | 0.5–0.81 | 0.56–0.82 |
| Philippines | 0.84 | 0.86 | 0.61–0.7 | 0.68–0.95 | 0.22 | 0.42 | −2.87 | 0.1 |
| Thailand | 0.45–0.92 | 0.57–0.93 | −7.89–0.93 | 0.23–0.93 | 0.2–0.83 | 0.26–0.81 | 0.16–0.87 | 0.27–0.81 |
| Vietnam | 0.41–0.98 | 0.61–0.92 | 0.55–0.99 | 0.55–0.94 | 0.53–0.87 | 0.58–0.84 | 0.46–0.89 | 0.45–0.81 |
Table 4.
Various types of SWAT applications that have been reported for Southeast Asia.
| Application | Transnational | Cambodia | Indonesia | Lao PDR | Malaysia | Myanmar | Philippines | Thailand | Vietnam |
|---|---|---|---|---|---|---|---|---|---|
| Bioenergy crop impacts | • | ||||||||
| BMP assessment | • | • | |||||||
| Climate and land use Change | • | • | • | • | • | • | • | ||
| Climate change | • | • | • | • | • | • | |||
| Climate data effects | • | • | • | • | • | • | |||
| Critical source area analysis | • | ||||||||
| DEM data resolution effects | • | ||||||||
| Evaporation assessment | • | ||||||||
| Flood analysis | • | • | |||||||
| Groundwater analysis | • | ||||||||
| Impoundment effects | • | • | • | • | |||||
| Input uncertainty analysis | • | ||||||||
| Irrigation impact | • | ||||||||
| Land use change | • | • | • | • | • | • | |||
| Model comparison | • | • | |||||||
| Nitrogen cycling and transport | • | • | |||||||
| Nutrient cycling and transport | • | ||||||||
| Pathogen fate and transport | • | ||||||||
| Pesticide fate and transport | • | • | |||||||
| Regionalization of input parameters | • | ||||||||
| Sediment loss and transport | • | • | • | • | • | ||||
| Soil data resolution effects | • | • | |||||||
| Uncertainty analysis | • | • |
© 2019 by the authors. Licensee MDPI, Basel, Switzerland. This article is an open access article distributed under the terms and conditions of the Creative Commons Attribution (CC BY) license (http://creativecommons.org/licenses/by/4.0/).
Share and Cite
MDPI and ACS Style
Tan, M.L.; Gassman, P.W.; Srinivasan, R.; Arnold, J.G.; Yang, X. A Review of SWAT Studies in Southeast Asia: Applications, Challenges and Future Directions. Water 2019, 11, 914. https://doi.org/10.3390/w11050914
AMA Style
Tan ML, Gassman PW, Srinivasan R, Arnold JG, Yang X. A Review of SWAT Studies in Southeast Asia: Applications, Challenges and Future Directions. Water. 2019; 11(5):914. https://doi.org/10.3390/w11050914
Chicago/Turabian StyleTan, Mou Leong, Philip W. Gassman, Raghavan Srinivasan, Jeffrey G. Arnold, and XiaoYing Yang. 2019. "A Review of SWAT Studies in Southeast Asia: Applications, Challenges and Future Directions" Water 11, no. 5: 914. https://doi.org/10.3390/w11050914
Note that from the first issue of 2016, this journal uses article numbers instead of page numbers. See further details here.