Article

Climate Change Impact on the Evolution of the Saline Lakes of the Soan-Sakaser Valley (Central Salt Range; Pakistan): Evidences from Hydrochemistry and Water (δD, δ18O) and Chlorine (δ37Cl) Stable Isotopes

1
Key Laboratory of Comprehensive and Highly Efficient Utilization of Salt lake Resources, Qinghai Institute of Salt lakes, Chinese Academy of Science, Xining 810008, China
2
Qinghai Provincial Key Laboratory of Geology and Environment of Salt lakes, Xining 810008, China
3
University of Chinese Academy of Science, Beijing 100049, China
4
GFZ German Research Centre for Geosciences, 14473 Potsdam, Germany
5
Geotop-Earth and Atmosphere Sciences Department, UQAM, Case postale 888, Succursale Centre-Ville, Montreal, H3C 3P8, QC, Canada
*
Authors to whom correspondence should be addressed.
Water 2019, 11(5), 912; https://doi.org/10.3390/w11050912
Submission received: 27 February 2019 / Revised: 30 March 2019 / Accepted: 26 April 2019 / Published: 1 May 2019
(This article belongs to the Section Water Quality and Contamination)

Abstract

:
The surfaces of saline lakes are shrinking at a threatening rate worldwide. Likewise, the Uchhali complex (formed by three saltwater lakes located in the Salt Range, Pakistan) that serves as a major regional source of water for humans and as a habitat for water birds must be monitored. With this objective in mind, we conducted a study coupling hydrochemistry and stable isotope compositions (δ37Cl, δ18O and δD) in order to characterize its hydrochemical properties and the main processes controlling them. Results showed that the Uchhali complex salinity has dramatically increased compared to other similar lakes in the world. While the Uchhali (UL) and Khabbeki (KL) lakes present a sodium-chloride hydrofacies, the Jahlar (JL) is of a sodium-bicarbonate type. Hydrochemistry parameters indicate that the weathering of surrounding rocks is the major vector for the increase of total dissolved solids in the water. On the other hand, the observed enrichment in heavy isotopes of the water stable isotope compositions implies that the different lakes are undergoing a long history of intense evaporation. The study of the corresponding δ37Cl isotope compositions supports the conclusion that evaporation, along with weathering, are the main driving processes. Besides climate effects that result in the decrease of annual precipitation and the increase of evaporation, water consumption for domestic purposes (household and agriculture) aggravates the rise of the lakes’ salinity.

1. Introduction

Water is the key governing element for economic and eco-environmental developments in arid and semi-arid regions of the world [1]. Water resources, such as groundwaters (GW), lakes, wetlands and saline lakes, play a dominant role in the development and ecology of a given region [1]. Rural and urban areas in arid zones rely on these sources for their daily requirements [2]. With an increasing population and development, the demand for water resources is increasing day by day and causes their overutilization. The Soan-Sakesar valley, in the Salt Range (Pakistan) is a semi-arid area (Figure 1) where groundwater and wetlands (saline lakes) are the major water resources for daily consumption, explaining their large utilization to meet the regional growing demand. Saline lakes, which provide a large number of services to water birds, mineral extraction, environmental conservation or to industrial use, are shrinking worldwide [3,4] due to their overexploitation by humans, particularly for agricultural irrigation and other domestic purposes [5,6]. As such, the chemistry of this water resource changes quickly and its salinity usually increases significantly [1,7,8]. In numerous places, particularly in arid and semi-arid regions, this increase in salinity restricts the availability of drinkable and fresh water. Consequently, the need to evaluate water salinity and its evolution over time under natural conditions arises in order to better use and preserve major water resources that are under anthropogenic pressure.
During the last century (1901 to 2000) a significant raise (~0.57 °C) in the average annual temperature was recorded in Pakistan [9]. This increase accelerated (0.47 °C) during the last half 50 years (Figure 1). The highest rise in the annual temperatures (0.87 °C) was recorded in 1961 and the lowest (0.48 °C) in 2007 [10]. The Pakistan Meteorological Department (PMD) monitored a rise in surface temperatures between 1951 and 2000. Throughout the country the annual mean surface temperature increased by 0.6–1.0 °C [11]. This increase may be linked to the 0.5–0.7% increase in solar radiations that was documented over the southern part of Pakistan. In parallel to this rise in temperature, a decrease in the annual mean precipitations of about 10–15% in the arid plains and coastal areas was observed during the same period [9]. These conditions were worsened by numerous El Niño events that punctually decreased the precipitations as much as 64% (range of 17–64%). Ultimately, Pakistan’s projected temperature increase is expected to be higher than the modelled worldwide average [9]. The monitoring of the Indus River System shows declining annual flows, especially between 1998 and 2003 [12], that the authors attributed to low rain fall, an increase in temperature and persistent drought from 1998 to 2004. In such conditions, water bodies in arid and semi-arid regions will become more pressured and their chemistry will change quickly.
Until now, research in Pakistan has focused on the characterization of groundwater resources (e.g., [14,15]), water quality (e.g., [16,17,18,19]), and water management (e.g., [20,21]). However, to our knowledge, the environmental quality of the Uchhali complex (UC) wetlands around the Soan-Sakesar valley (Salt Range) have received little attention, and in particular studies based on a geochemical approach are scarce. Previous works on this region have described the ecology (e.g., [22]), climatic patterns [23] and aquatic biota [24]. The sole study on the presence of metals (e.g., selenium) in regional water was carried out by Afzal et al. [25]. Therefore, analyzing the hydrochemical characteristics of the UC appears a priority in order to preserve this regional water resource. Approaches coupling multiple stable isotope systematics (e.g., Cl, H, O) with more classical geochemistry, geology and hydrogeochemistry have already proven their added value for tracking the origin, recharge and evolution of water resources and salinity (e.g., [26,27]). In particular, in areas like the Soan-Sekaser valley, where current evaporation is very high, stable isotopes and hydrochemical indicators are established tools for identifying and measuring relative evaporation (e.g., [28,29]).
Studies using stable isotope compositions of water and of water-soluble minerals (including halite) are capable of providing insights on the leading processes that govern their budgets in numerous environments (e.g., [30]). Stable isotopes have been widely used to identify the origin, evolution, fluid-mixing, water-rock interaction and deposition environment of different systems (e.g., [31,32,33,34,35,36]). In particular, Cl isotopes have proven to be valuable geochemical and forensic tracers in arid and semi-arid contexts (e.g., [37,38]). The distribution of Cl stable isotopes is very sensitive to low-temperature geochemical processes, for example during halite crystallization or dissolution [37], salinity [39]. This makes them excellent indicators to differentiate the sources of magmatic fluids, to trace the origin of mixed brine as well as to study brine deposition conditions, such as evaporation rate [40]. On the other hand, water stable isotopes (δD, δ18O) have been successfully applied to better understand the physical environment, the origin of water resources and their mixing [41], to assess man-induced climate changes and evaporation effects [42] on water bodies.
With that in mind, the main objective of this study was to use an approach coupling water chemistry and stable isotopes (δD and δ18O) with chlorine isotopes (δ37Cl) to better understand the impact of climate change on the recent evolution of the Uchhali complex’s hydrogeochemistry and salinity, as well as the processes that led to the observed increase in salinity and shrinking of the lakes’ surfaces.

2. Study Site

Most of the arid or semi-arid areas of Pakistan still have about 10% of their wetlands [43]. A total of 225 significant wetlands have been identified, among 19 which are included in the List of Wetlands of International Importance of the Ramsar convention adopted in 1971 [43]. The “Uchhali Wetlands Complex” (UC) is located in the Khushab District, part of the central Salt Range (SR; between 72°00′ to 72°30′ E and 32°29′ and 32°45′ N coordinates). The UC is bound by a dual parallel ridge system (Figure 1). Its average altitude is 750 m.a.s.l. and its peak point is mount Sakesar with an elevation of ~ 1500 m.a.s.l. The UC includes three lakes: the Uchhali Lake (UL), the Khabbeki Lake (KL) and the Jahlar Lake (JL). The Uchhali Lake presents the largest surface (14.3 Km2), a depth of about 4 m and it is saline (Total Dissolved Solids; TDS = ~36 g/L) [20]. The Khabbeki and Jahlar lakes are smaller with surfaces of 4.2 and 3.0 km2, respectively. Both lakes are considered as brackish [44]. Based on their nutrient contents and sizes, the UL is categorized as a large shallow hypereutrophic lake (nutrient-rich and characterized by frequent algal blooms and thus low transparency) while the others (KL, JL) are categorized as intermediate-sized shallow hypereutrophic lakes [45]. These lakes are surrounded by sedimentary rocks and are settled in the synclinal structures of Eocene rocks (Figure 2).

Hydrogeology and Climate Conditions

Previous studies identified two major formations from the Eocene and Miocene ages as the major water resources of the Soan-Sakesar aquifer system [44,45]: the Sakesar Formation (limestone) of the Chharat group (Eocene age) is a freshwater formation and the Murree Formation of the Rawalpindi group (Miocene age) is brackish (Figure 2). Rainwater infiltration is the primary source of the groundwater (GW) recharge [25,45]. However, all three lakes are mainly fed by local rainfall, small springs, seepage from the adjacent irrigated land, and run-off from the surrounding hills of the Salt Range. The study area has a drainage pattern that is mostly dendritic (in which the streams randomly flow in all directions; Figure 2A). However, trellis (characterized by parallel main streams intersected perpendicularly, or nearly perpendicularly, by their tributaries) and rectangular patterns (a drainage pattern in which the tributaries intersect perpendicularly the main streams, and exhibit sections of approximately the same length, which form rectangular shapes) can easily be observed in the SE portion of the area. These patterns are mostly observed on Sakesar limestones due to chemical weathering. The Sakesar limestone anticlines are acting as a watershed and control the drainage system of the area [44]. Although GW pumping started in the late 1960s and peaked after 2000, it caused an added alteration of the GW flow system [14]. While percolation is the major recharge pathway, evapotranspiration and well production are the main discharge mechanisms. The water table depth is variable and is generally between 4 to 7 m.b.s. [25,46], but in recent years high pumping rates have deepened the water table down to a depth of more than 10 m.b.s.
The regional climate is sub-humid sub-tropical inland with hot to temperate summers and cold winters. The regional climate conditions are highly variable within the last 30 years: the annual rainfall fluctuated from 300 to 800 mm, and the relative humidity from 22 to 85% [47]. There are two contrasting rain periods, one being the Monsoon rainy season (i.e., summer rain season) which persists up to three months (between July to September). Generally, a high rain fall is observed during July and August. The other rain period is the winter rainy season, which generally starts in January until March. The average evapotranspiration, estimated by the horticulture station located in the Soan-Sakesar Valley, is 2.6 mm/day, varying from 1.5 to 6.4 mm/day [44].
From 1985 to 1994 the local mean annual rainfall is 613 mm and the average temperature in summer and winter are 33 °C and 3 °C, respectively [45]. But since 2000, lower average annual rainfalls (0.00 to 111.15 mm) and elevated temperatures (3.16 to 37.6 °C) in winter and summer, respectively, are reported [46]. Within recent years, December and January are generally the coldest months of the year and June the hottest. During winter, temperatures often drop below 0 °C, and in summer it can reach as high as 38.4 °C [47], hinting at the potential impact of climate change.

3. Materials and Methods

3.1. Sampling

In total, 14 water samples were collected from the three lakes in October 2017, 5 from UL, 5 from KL and 4 from JL. The samples from JL were collected at the surface of the lake, while for UL and KL samples were collected at the surface as well as at variable depths using a sampling bucket. The water samples were collected in clean (rinsed with distilled water at least three times) 500 mL bottles. Before collecting samples, each bottle was washed three to five times with the lake water. Water temperature, TDS, and pH were measured in situ (using SG2/SG3 Sevengo meters). The air tight samples were then transferred to laboratory for further analysis. Chemical analysis of major ions, K+, Na+, Ca2+ and Mg2+ were performed by Plasma spectrometry (ICAP6500DUO, USA) with an analytical error of less than ±5%. SO42− concentrations were determined by Ion Chromatography (IC-5000+, Thermo Fisher USA) with and error <1%. Chloride, CO3, HCO3 were measured by Titration with a precision better than 0.3% (ISL, CAS, 1988; [48]). The stable Cl isotope compositions were analyzed by Positive Thermal Ionization Mass Spectrometry (TIMS-TRITON) with a precision range of (0.2‰) 1-320 a.m.u. All these measurements were performed at the Salt Lakes Analytical and Testing Department, Qinghai Institute of Salt Lakes, Chinese Academy of Sciences.

3.2. Sample Preparation (δ37Cl)

All samples were processed following the two-steps resin method described by [49] and [50]. Briefly, a polyethylene ion-exchange column (diameter of 0.5 cm) was filled with ~2 cm of a H-cation exchange resin (~300 mesh, resin type: Dowex 50 W × 8). A second polyethylene ion-exchange column (diameter of 0.5 cm) was filled with 1.5 cm of a regenerated Cs-cation exchange resin. Samples were first eluted through the H-cation exchange resin column and then through the Cs column. During the process, the pH of the solution was maintained at 6. Ultimately, samples were collected for TIMS analysis.
A tantalum (Ta) filament was heated under vacuum for one hour (using a current of 2-3A) before being covered with 2.5 µL of a graphite slurry containing at least 80% of ethanol plus 80 µg of graphite. About 2.5 µL of the sample solution, containing at least 10 µg of Cl as CsCl was deposited onto the filament, which was then dried using a current of 1A for ~2 minutes. Samples were finally placed into the source of the mass spectrometer until a vacuum around 2.5 × 10⁻⁷ mbars is reached. During analysis the Cs2Cl+ ion current was kept at 4 × 10⁻¹² A by adjusting the source current. Raw data were obtained on Faraday cups “C” and “H1” associated to mass numbers 301 (133Cs235Cl+) and 303 (133Cs237Cl+). The 37Cl/35Cl ratio we obtained for the international IAEA ISL-354 NaCl standard was 0.319028±0.000058 (n = 12), in agreement with the certified value of Xiao et al. [51] 0.31964±0.00092. Precision for the δ37Cl determination was ±0.03‰.
δD and δ18O were measured using a liquid water isotope analyzer (Picarro L2130-i) at the Institute of Earth Environment, CAS. Detailed method is described in Wan et al. [52] and Liu et al. [53]. Precision for both isotope systematics was about ±1‰.
The isotope ratios are reported as per mil deviation (δD, δ18O or δ37Cl) of the D/1H, 18O/16O ratios relative to SMOW (H and O isotope systematics) and ISL-354 standards (Cl isotopes), according to the equations:
δ D = [ D 1 H s a m p l e D 1 H V S M O W 1 ] × 10 3 δ 18 O = [ 18 O 16 O s a m p l e 18 O 16 O V S M O W 1 ] × 10 3 δ 37 C l = [ 37 C l 35 C l s a m p l e 37 C l 35 C l I S L 354 1 ] × 10 3

4. Results and Discussion

4.1. Salinity and Hydrofacies

Water samples from all sampling sites show pH > 8.6 and indicate that all lakes are basic alkaline. Soils in the Uchhali Wetlands Complex catchment area are rich in basic (rock salt) but poor in nitrogen matter [47]. The Uchhali Lake (UL) is hypersaline with an average TDS concentration ranging between 36 g/L on surface water and 36.21 g/L at maximum depth (~4 m; Table 1). These values are higher than Arshad (2011) [47], and are similar to those reported for the Soan-Sakesar valley Salt-Range by Afzal et al. [25,45] between 1994 and 1996 (Table 1). This suggests that evaporation and/or recharge is inconstant and may be affected by climate change. Cations are dominated by Na+ and Mg2+ (followed by K+) and anions by SO42− and Cl (followed by HCO3). Ion concentrations shows a rough variation with depth and sampling location (Table 1). The chemistry of the Khabbeki Lake (KL), a medium-sized shallow hypereutrophic lake, has changed during the last three decades: while it had been previously classified as a brackish lake with a TDS ranging from 1.3 to 2.4 g/L Afzal et al. (1998, 1999 and 2000) [25,44,45], we are now reporting a higher TDS of 2.6 g/L (Table 1). This significant increase in its TDS probably results from higher evaporation and lower recharge rates. Its cation and anion abundances are comparable to those of UL (i.e., Na+ > Mg2+ > K+ and SO42− > Cl > HCO3). Both UL and KL are of Na-Cl type (Figure 3). The Jahlar Lake (JL) shows a pH value of 9.3, a TDS of 7.9 g/L and ion concentrations dominated by Na+ > K+ and HCO3 > Cl > SO42−. JL is even more affected by climate change, as within the last 30 years its TDS has shifted from 8.7 g/L in 1994–1996 [25], to 4.1–4.3 g/L in 2007 [47] and 7.9 g/L in the present study, again hinting at a potential impact of climate change. This 7.9 g/L TDS indicates that the lake is now of brakish type, within the Na-HCO3 type facies (Figure 3). Variations in the hydrochemical facies, related to the corresponding variations in the water chemical composition are controlled by both interactions with the local lithologies and geochemical processes. The Piper diagram from Figure 3 shows that while cations are dominated by alkalis (Na+ + K+), anions differ for each of the three lakes: bicarbonate type for JL, chloride type for UL and no dominant anion for KL. The diamond-shaped central field, (used to characterize four distinct water types; Figure 3) on the other hand, identifies two main populations: sodium chloride type (JL) and sodium bicarbonate type (UL, KL).

4.2. Sources and Processes Controlling Ion Compositions of the Lakes

Several processes may induce a salinity rise in our water samples. Discriminating them and their implications is thus essential. This may be achieved by studying variations of the water ion composition (Figure 4). As previously discussed HCO3, Ca2+ and Mg2+ greatly contribute to the TDS levels we are measuring, and result from rock weathering, particularly of limestones, dolomite, Ca-Mg-silicates and gypsum. This is in agreement with a recharge by groundwater and/or rainwater draining the lithology of mount Sekaser [45]. The (Ca2+ + Mg2+) vs (HCO3 + SO42−) diagram (Figure 4a) shows that all water samples plot below the 1:1 line, indicating that cations mainly originate from the weathering of carbonate and silicate rocks, and that HCO3 comes from the weathering of carbonate rocks [1,54]. This corresponds to the regional lithology of the drained basin, essentially made of carbonates and evaporitic formations, that interact with the water hosted in the aquifer. Ultimately, the final water composition is controlled by the water-rock interaction (WRI) and thus by both the composition of the sedimentary rocks and the local hydrologic characteristics, such as the flow path. (Mg2+ + Ca2+)/HCO3 ratios in our lake samples show large variations (Figure 4b) that we can potentially relate to the dissolution of pyroxene/amphibole minerals (which yields a ratio of ~0.5 [55]), and thus give us indications about sources of Mg2+ and Ca2+. (Mg2+ + Ca2+)/HCO3 ratios lower than 0.5 may be explained by cation exchange processes, either by Ca2+ + Mg2+ depletion or by HCO3 enrichment. Conversely, high (Mg2+ + Ca2+)/HCO3 ratios cannot be attributed to HCO3 depletion as the alkaline character of the lakes prevents the formation of carbonic acid H2CO3 [56]. Elevated (Mg2+ + Ca2+)/HCO3 values suggest that the higher alkalinity of these waters is balanced by alkalis. The higher (Mg2+ + Ca2+)/HCO3 ratios measured in UL limit an additional supply of Ca2+ and Mg2+ and are buffered by Cl and SO42− ions. Additionally, the relationship existing between (Ca2+ + Mg2+) and the total cations (Figure 4c) shows that all samples are plotting away from the 1:1 line, revealing an increasing influence of Na+ and K+ as TDS increases. Figure 4d shows a positive relationship between Na+ and Cl concentrations, with all water samples plotting above the 1:1 line. This indicates that most of the Na+ is captured along water flows poor in Cl [18]. In Figure 4e, Na++K+ increases in parallel with Cl + SO42−, hinting at a common source for these ions and by extension to the presence of Na2SO4 and K2SO4 Salts [1]. As Na+ is considered a weathering index, its enriched concentrations in our samples (Table 1) suggest that the underlying processes for its presence are salt dissolution or silicate weathering.
The positive trend observed between the Na+/Ca2+ ratio and TDS (Figure 4f) is explained by the substitution of Ca2+ by Na+ as water flows further. Besides, other geological processes may also control the water ion balance: while ion exchange will yield waters with Na+/(Na+ + Cl) ratios >0.5, a ratio <0.5 suggests water softening [57]. In our study area, the Na+/(Na+ + Cl) ratios are all higher than 0.5, which indicates that silicate weathering or dissolution of soil salts is prevailing. However, the excess of Na+ + K+ over Cl is not in favor of silicate weathering [54] and suggests that the elevation of alkalis is not caused by precipitation [58].

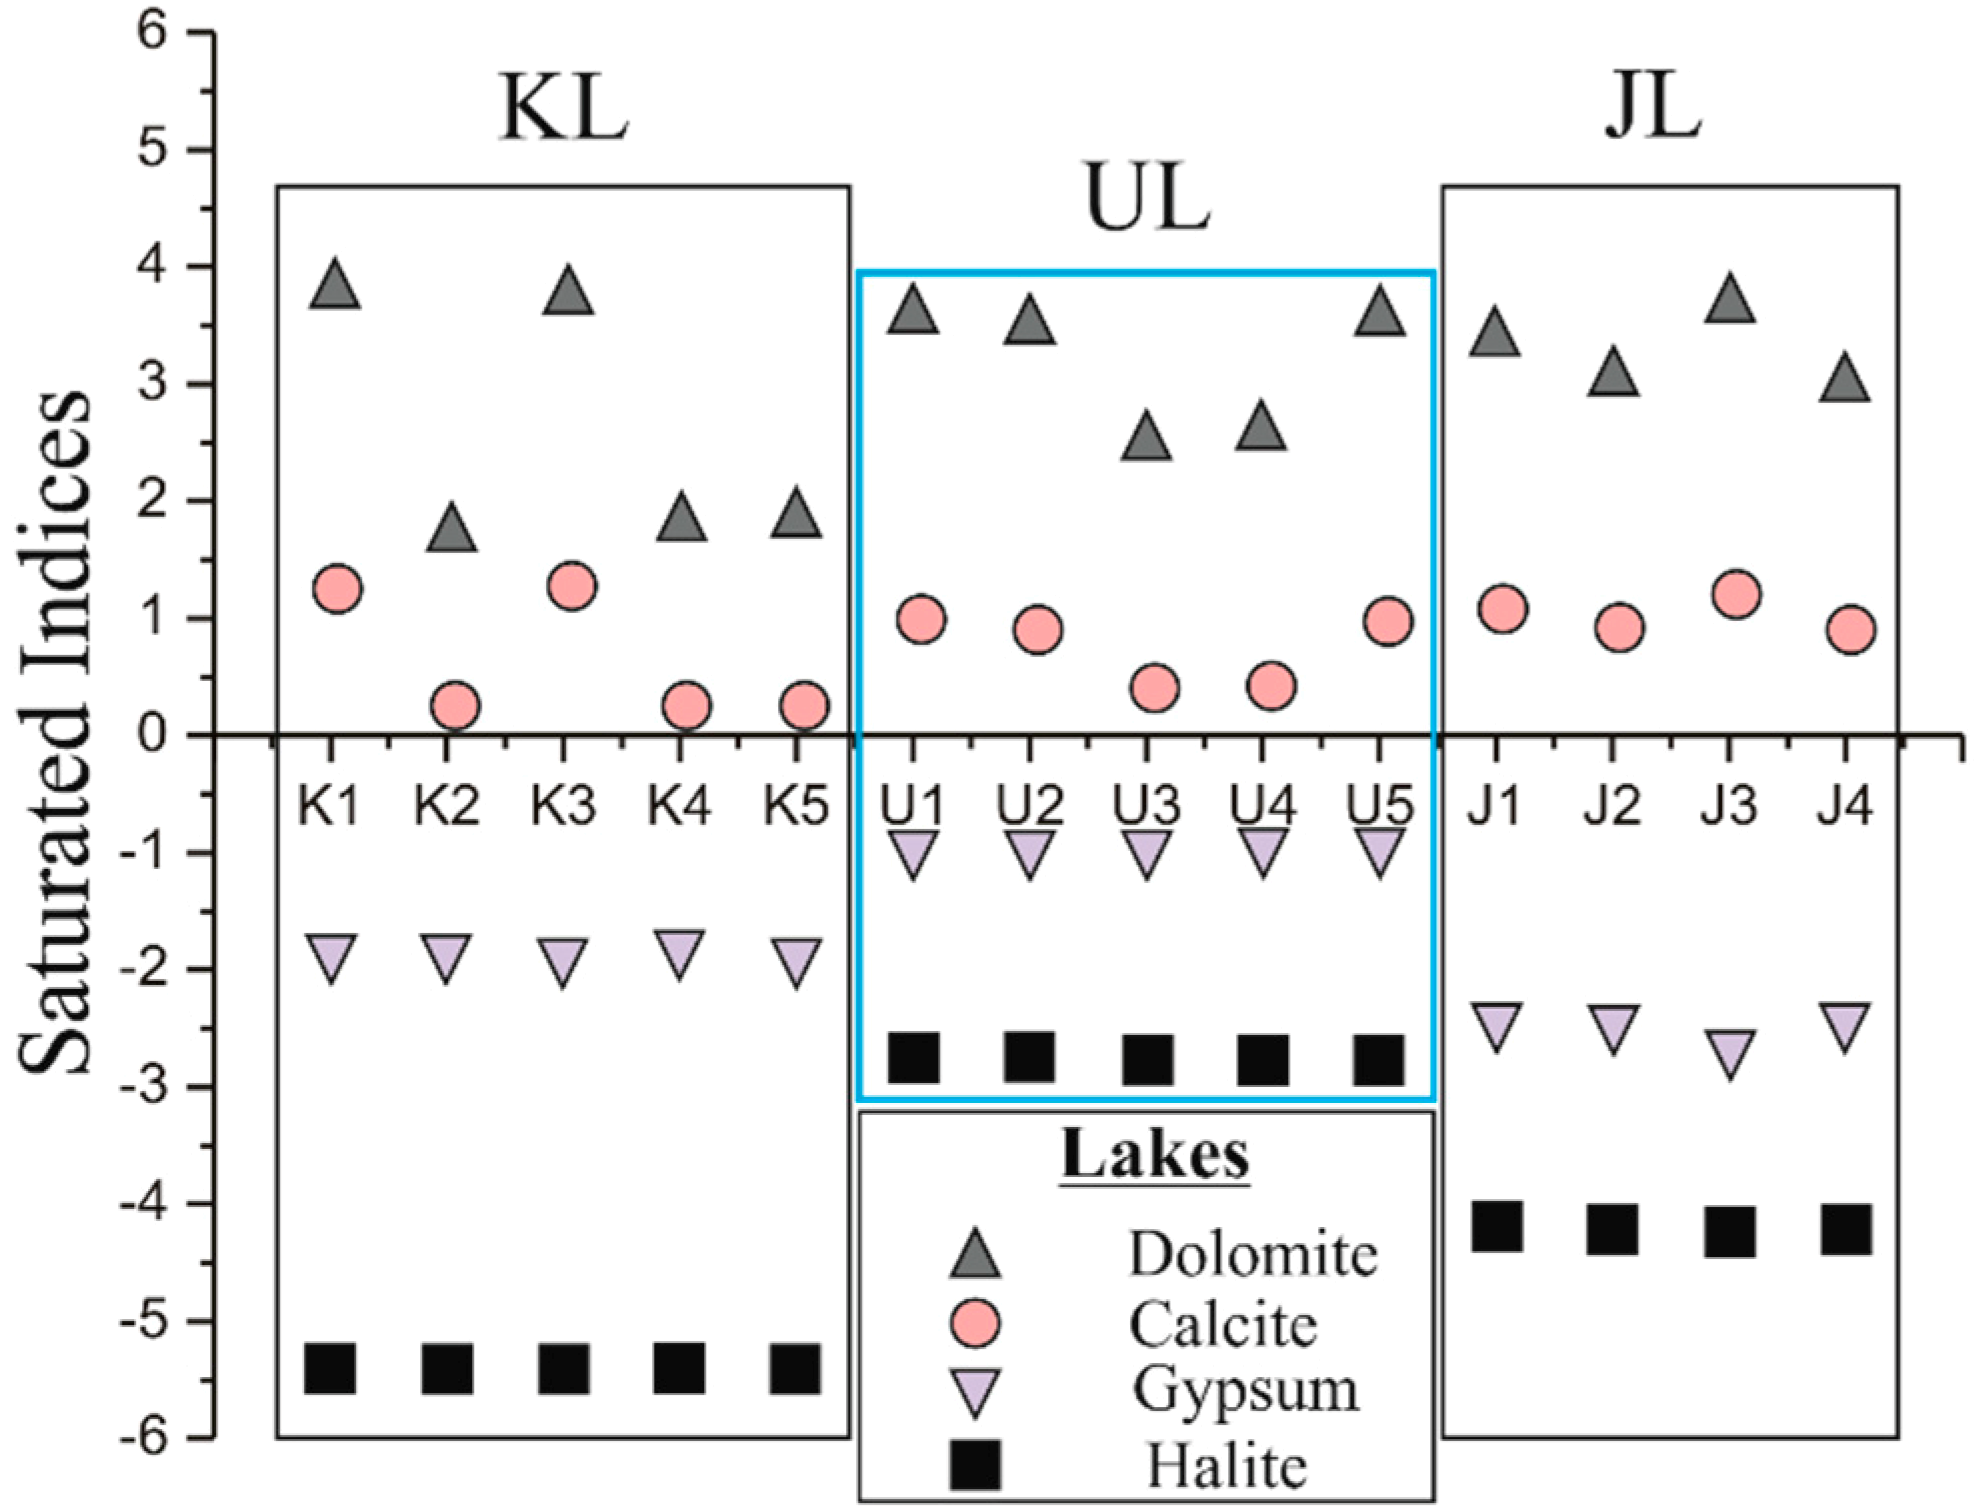
4.3. Dissolution and Deposition

The classical Gibbs diagram (Na+/(Na+ + Cl) and Cl/(Cl + HCO3) vs. TDS (Figure 5) shows that the water composition is dominated by evaporation-crystallization processes. Evaporation of surface water and wetness in the unsaturated region is the key mechanism in the evolution of GW chemical composition. The evaporation process always significantly increases ion concentrations in the residual water and thus leads to higher TDS values.
Mineral equilibrium calculation is efficient at predicting dissolved mineral reactivity in water [59]. Some minerals such as calcite and dolomite are normally found in equilibrium in surface waters. Saturation index (SI) is another approach to predict the mineralogy of the subsurface from the analysis of waters without having to analyze the solid samples [60]. Here, SI values were calculated using PHREECQ (version 3.3.7). If SI = 0, the corresponding mineral is in equilibrium in the solution; SI < 0 indicates that the mineral is under-saturated (i.e., further dissolution is possible); whereas SI > 0 indicates that the mineral is supersaturated and will thus have a tendency of precipitating from the solution [61,62]. Results show (Figure 6) that all calculated SI values for calcite and dolomite in our water samples are positive, indicating oversaturation for these two minerals. SI values for gypsum and halite, on the contrary, are all negative, indicating that these last two minerals are far from saturation.

4.4. Chlorine Isotope Compositions

Stable chlorine isotopes (δ37Cl) are proven tools for studying dissolved Cl, fluid mixing, water-rock interaction [33,34] as well as saline lake systems [35,36], including the possibility of determining their evaporation rate [40,63]. In our study, brine samples had δ37Cl values ranging from −0.03 to +0.09‰, a moderately large isotope range that suggests that they have experienced different evolution processes. During evaporation Cl stable isotopes fractionate, resulting in a 37Cl-enrichment in the salt deposits [64], i.e., chlorine isotope fractionation correlates with halite precipitation. However, in our case all samples were far from the halite (NaCl) precipitation point. It is therefore impossible that their Cl isotope compositions were controlled by halite precipitation. The most positive δ37Cl (+0.09‰) were measured in the shallow JL that yielded a TDS around 8 g/L (Figure 7a). The lowest δ37Cl were measured in the KL that corresponded to the highest TDS compared to previous studies (see Table 1). However, this isotope variation does not appear to be correlated with the corresponding Cl concentrations (Figure 7b). This isotope difference might be explained by different flow paths and/or origin of the groundwater. Cl in the aquifer may have percolated from subsurface rocks or come from pore fluids. Nevertheless, the most 37Cl enriched samples were hypothesized to be from evaporitic (NaCl) residues in the near-surface as well as from water interaction with Cl-containing minerals (e.g., NaCl, KCl from the regional salt deposits). Sherif et al. (2019) [65] stipulated that the presence of certain rock types ultimately controls the δ37Cl observed in the aquifer, and that pore fluids in confining shales may be a significant source of Cl in groundwater [66]. Similarly, the presence of silicates (δ37Cl between +0.4 and +7.5‰) and mafic rocks (up to +4‰; [67]) will imprint chlorine isotope compositions in groundwater. Intensive evaporation, a process that enriches the precipitating phase in 37Cl relative to the coexisting brines [40,68], will also impact the δ37Cl isotope compositions. These results suggest that further work on Cl isotope ratios from these lakes as well as from local ground and fresh water is needed to better understand the variations of chlorine isotopes in the UC.

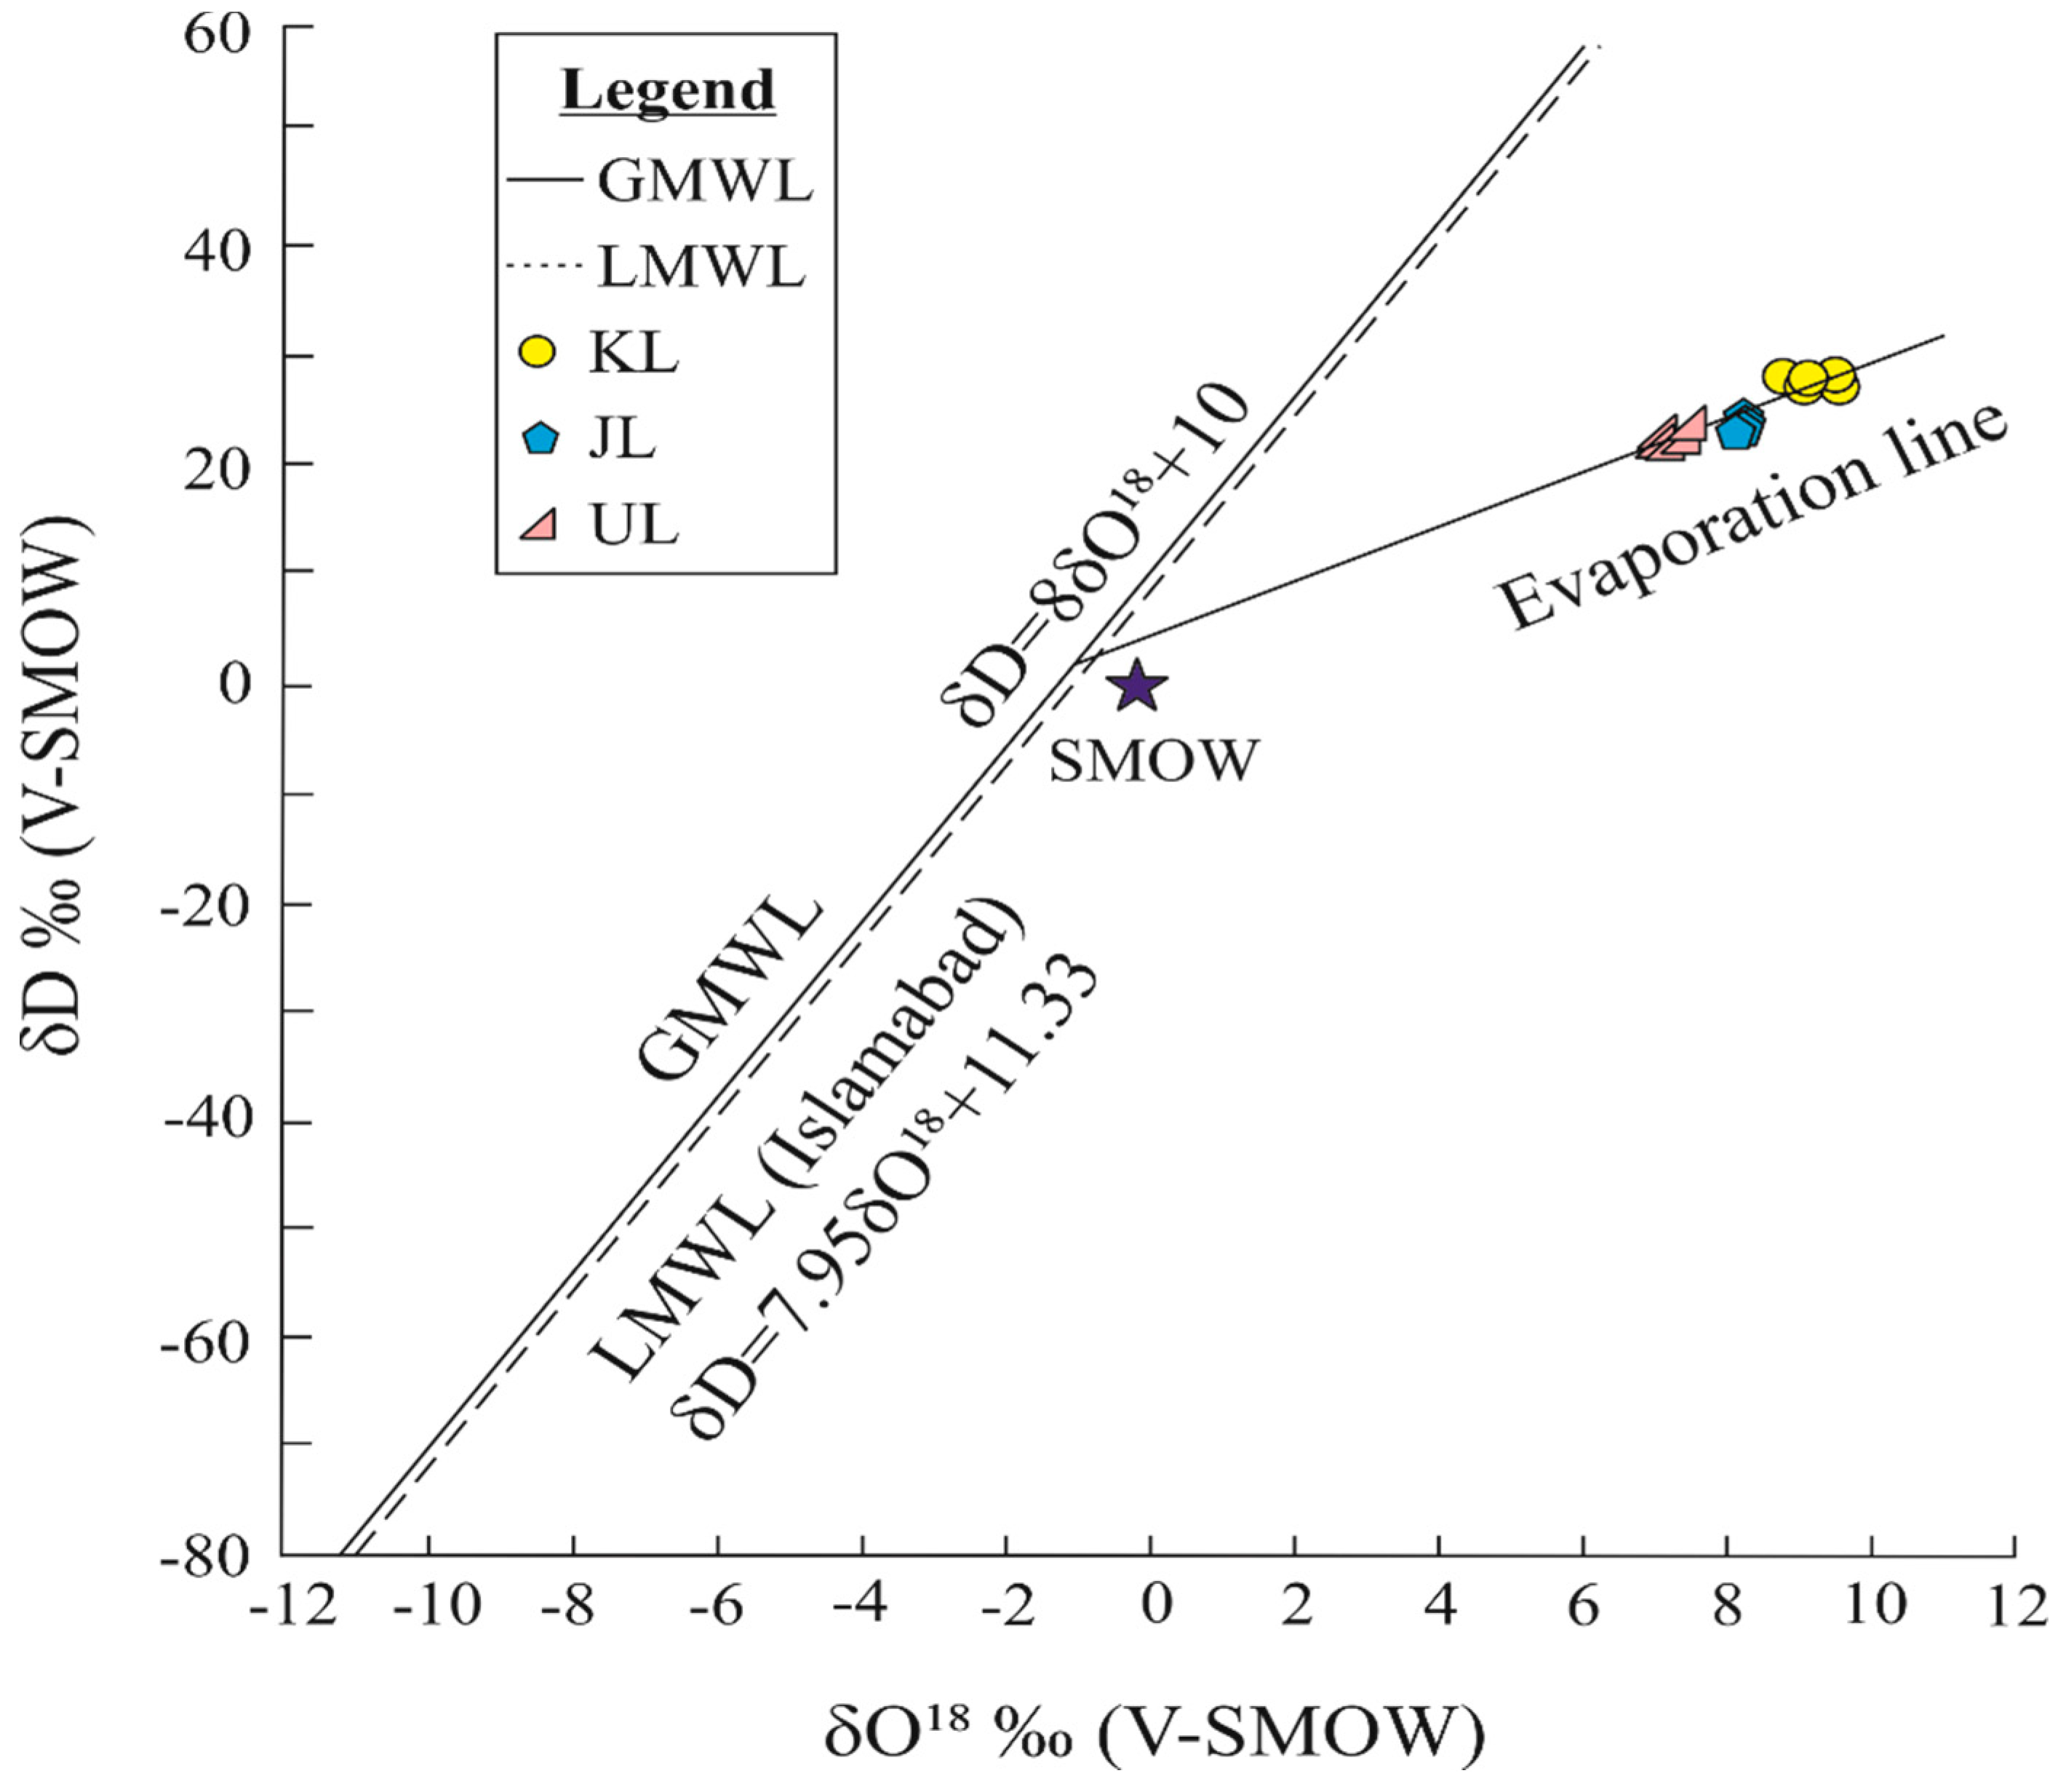
4.5. Water Stable Isotope Compositions

Just like chlorine isotopes, water stable isotope compositions (δ18O and δD) can be used as tracers in hydrology and water resources contexts. They bring key information on the groundwater (GW) origin and recharge, water contamination, water-rock interaction, and most importantly; they are influenced by evaporation rates [31,32,41,69,70]. We therefore measured both δ18O and δD for each UC water sample in order to better constrain its formation. Results (Table 1) showed that δ18O values range between +7.7 and +9.2‰ (with an average value of 8.3 ± 0.6‰), and from +21 to +29‰ for δD (with a mean value of 25 ± 3‰). All samples (Figure 8) were plotting away from both the global meteoric water line (GMWL) and the local one (LMWL; calculated in Islamabad). Samples plot on a typical evaporation line [1,71] with a lower slope of ~5. Similar slopes were reported for arid/semiarid regions in China [1] and for some African lakes [70]. This again confirms that the Uchhali complex is undergoing strong evaporation.

5. Conclusions

Our study indicates that the saline lakes of the Salt Range (Pakistan) are highly impacted by climate change. Within the last 10 years, the lower precipitations and higher temperatures increased the salinity of these lakes. The Ucchali Lake is the least affected of all with a TDS concentration similar to the one recorded by previous studies. In contrast, the Khabbeki and Jahlar lakes (Ramser site) present significantly higher TDS, indicating that they are the most affected by climate change. The study of local hydrochemistry demonstrates that these changes in the TDS concentrations are due to intensive evaporation, although the role of rock weathering should not be neglected. Still, water stable isotope compositions follow a clear high evaporation slope line showing that this process controls the overall regional salinity. This conclusion is supported by the study of δ37Cl isotope compositions that also hint at possible multiple origins for water. On top of all these natural processes, human activities such as water pumping for agriculture and other domestic purposes also contribute to the observed TDS increase. Finally, our study suggests the necessity of implementing a continuous monitoring as well as remediation strategies for the conservation of these crucial water resources for local populations.

Author Contributions

Conceptualization, S.A.H.; validation, W.H.; data curation, J.-L.H.; J.H.; software, Z.M.; X.-Q.N.; L.Y.; writing—original draft preparation, S.A.H.; writing—review and editing, D.W.; A.R.; supervision, F.-Q.H.; D.W.; project administration, F.-Q.H.; funding acquisition, F.-Q.H.

Funding

This scientific work was supported by the project entitled “The formation of salt deposits in South and Central Asia, prospect exploration and development” [grant No. Y660071023], the Chinese Academy of Sciences (CAS) and the Qinghai Natural Science Foundation [grant No. 2019-ZJ-911].

Acknowledgments

We especially thank Tasawur Ali Akhund for his help during sampling. We are also thankful to Ma Yunqi and his students for their guidance and help in the laboratory, and the anonymous reviewers for their helpful comments.

Conflicts of Interest

The authors declare no conflict of interest.

References

  1. Wen, X.; Wu, Y.; Su, J.; Zhang, Y.; Liu, F. Hydrochemical characteristics and salinity of groundwater in the Ejina Basin, Northwestern China. Environ. Geol. 2005, 48, 665–675. [Google Scholar] [CrossRef]
  2. Hussain, S.A.; Hussain, A.; Fatima, U.; Ali, W.; Hussain, A.; Hussain, N. Evaluation of drinking water quality in urban areas of Pakistan: A case study of Gulshan-e-Iqbal Karachi, Pakistan. J. Biodivers. Environ. Sci. 2016, 8, 64–76. [Google Scholar]
  3. Messager, M.L.; Lehner, B.; Grill, G.; Nedeva, I.; Schmitt, O. Estimating the volume and age of water stored in global lakes using a geo-statistical approach. Nat. Commun. 2016, 7, 13603. [Google Scholar] [CrossRef] [PubMed] [Green Version]
  4. MEA, M.E.A. Ecosystems and Human Well-Being: Wetlands and Water; World Resources Institute: Washington, DC, USA, 2005. [Google Scholar]
  5. Williams, W.D. What future for saline lakes? Environ. Sci. Policy Sustain. Dev. 1996, 38, 12–39. [Google Scholar] [CrossRef]
  6. Wurtsbaugh, W.A.; Miller, C.; Null, S.E.; DeRose, R.J.; Wilcock, P.; Hahnenberger, M.; Howe, F.; Moore, J. Decline of the world’s saline lakes. Nat. Geosci. 2017, 10, 816. [Google Scholar] [CrossRef]
  7. Fisher, R.S.; Mullican, W.F., III. Hydrochemical evolution of sodium-sulfate and sodium-chloride groundwater beneath the northern Chihuahuan Desert, Trans-Pecos, Texas, USA. Hydrogeol. J. 1997, 5, 4–16. [Google Scholar] [CrossRef]
  8. Kraft, G.J.; Stites, W.; Mechenich, D. Impacts of irrigated vegetable agriculture on a humid north-central US sand plain aquifer. Groundwater 1999, 37, 572–580. [Google Scholar] [CrossRef]
  9. Chaudhry, Q.U.Z. Climate Change Profile of Pakistan; Asian Development Bank: Mandaluyong, Philippines, 2017. [Google Scholar]
  10. Chaudhry, Q.-U.-Z.; Mahmood, A.; Rasul, G.; Afzaal, M. Climate Change Indicators of Pakistan; Pakistan Meteorological Department: Islamabad, Pakistan, 2009.
  11. Farooqi, A.B.; Khan, A.H.; Mir, H. Climate change perspective in Pakistan. Pak. J. Meteorol. 2005, 2, 11–21. [Google Scholar]
  12. Ahmad, S. Water Resources and Management in Pakistan–Challenges and Future Vision. Course on Integrated Water Resources Management at the National University. 2009. [Google Scholar]
  13. Rasul, G.; Afzal, M.; Zahid, M.; Ahsan, A.; Bukhari, A. Climate Change in Pakistan, Focused on Sindh Province; Technical Report No. PMD-25/2012; Pakistan Meteorological Department: Islamabad, Pakistan, 2012.
  14. Kahlown, M.A.; Majeed, A. Water-resources situation in Pakistan: Challenges and future strategies. In Water Resources in the South: Present Scenario and Future Prospects; Commission on Science and Technology for Sustainable Development in the South: Islamabad, Pakistan, 2003; pp. 20–39. [Google Scholar]
  15. Ahmad, M.; Farooq, U. The state of food security in Pakistan: Future challenges and coping strategies. Pak. Dev. Rev. 2010, 49, 903–923. [Google Scholar] [CrossRef]
  16. Rafique, T.; Naseem, S.; Usmani, T.H.; Bashir, E.; Khan, F.A.; Bhanger, M.I. Geochemical factors controlling the occurrence of high fluoride groundwater in the Nagar Parkar area, Sindh, Pakistan. J. Hazard. Mater. 2009, 171, 424–430. [Google Scholar] [CrossRef] [PubMed]
  17. Naseem, S.; Rafique, T.; Bashir, E.; Bhanger, M.I.; Laghari, A.; Usmani, T.H. Lithological influences on occurrence of high-fluoride groundwater in Nagar Parkar area, Thar Desert, Pakistan. Chemosphere 2010, 78, 1313–1321. [Google Scholar] [CrossRef]
  18. Bashir, E.; Huda, S.N.-u.; Naseem, S.; Hamza, S.; Kaleem, M. Geochemistry and quality parameters of dug and tube well water of Khipro, District Sanghar, Sindh, Pakistan. Appl. Water Sci. 2017, 7, 1645–1655. [Google Scholar] [CrossRef]
  19. Bashir, E.; Naseem, S.; Hanif, H.; Pirzada, T. Geochemical study of groundwater of Uthal and Bela areas, Balochistan and its appraisal for drinking and irrigation water quality. Int. J. Agric. Environ. 2013, 2, 1–13. [Google Scholar]
  20. Sher, H.; Aldosari, A. Strategic program for biodiversity and water resource management and climate change adaptation in Pakistan. In Proceedings of the EGU General Assembly 2014, Vienna, Austria, 27 April–2 May 2014. [Google Scholar]
  21. Khoso, S.; Wagan, H.F.; Tunio, H.A.; Ansari, A.A. An overview on emerging water scarcity in Pakistan, its causes, impacts and remedial measures. J. Appl. Eng. Sci. 2015, 13, 35–44. [Google Scholar] [CrossRef] [Green Version]
  22. Ghalib, S.A.; Rais, M.; Abbas, D.; Tabassum, F.; Begum, A.; Jabeen, T. An overview of the status of shorebirds and internationally important sites in Pakistan. Pak. J. Zool. 2009, 41, 165–172. [Google Scholar]
  23. Arshad, M.; Mehmood, N.; Hira Muqadas, I.M.; Chaudhry, J.I.; Iram, A.; Batool, F.Z.; Malik, A. Avifauna census, assesment of heavy metal pollution and its effects on aquatic biota in relation with alteration in precipitation at jahlar lake, punjab, pakistan. Int. J. Agric. Appl. Sci. 2015, 7, 193–201. [Google Scholar]
  24. Arshad, M.; Mehmood, N.; Muqadas, H.; Chaudhry, J.; Mustafa, I.; Khan, M.R.; Malik, I.U.; Ahmed, H. Avifauna Studies in Co-Relation with Alteration in Climatic Patterns and Hydrology of Uchalli Lake, Punjab, Pakistan. Pak. J. Zool. 2014, 46, 503–515. [Google Scholar]
  25. Afzal, S.; Younas, M.; Ali, K. Selenium speciation studies from Soan-Sakesar Valley, salt range, Pakistan. Water Int. 2000, 25, 425–436. [Google Scholar] [CrossRef]
  26. Vengosh, A.; Kloppmann, W.; Marei, A.; Livshitz, Y.; Gutierrez, A.; Banna, M.; Guerrot, C.; Pankratov, I.; Raanan, H. Sources of salinity and boron in the Gaza strip: Natural contaminant flow in the southern Mediterranean coastal aquifer. Water Resour. Res. 2005, 41, W01013. [Google Scholar] [CrossRef]
  27. Han, D.; Song, X.; Currell, M.J.; Yang, J.; Xiao, G. Chemical and isotopic constraints on evolution of groundwater salinization in the coastal plain aquifer of Laizhou Bay, China. J. Hydrol. 2014, 508, 12–27. [Google Scholar] [CrossRef]
  28. Lapworth, D.; MacDonald, A.; Tijani, M.; Darling, W.; Gooddy, D.; Bonsor, H.; Araguás-Araguás, L. Residence times of shallow groundwater in West Africa: Implications for hydrogeology and resilience to future changes in climate. Hydrogeol. J. 2013, 21, 673–686. [Google Scholar] [CrossRef]
  29. Vanderzalm, J.; Jeuken, B.; Wischusen, J.; Pavelic, P.; La Salle, C.L.G.; Knapton, A.; Dillon, P. Recharge sources and hydrogeochemical evolution of groundwater in alluvial basins in arid central Australia. J. Hydrol. 2011, 397, 71–82. [Google Scholar] [CrossRef]
  30. Amundson, R.; Barnes, J.D.; Ewing, S.; Heimsath, A.; Chong, G. The stable isotope composition of halite and sulfate of hyperarid soils and its relation to aqueous transport. Geochim. Cosmochim. Acta 2012, 99, 271–286. [Google Scholar] [CrossRef]
  31. Ala-Aho, P.; Soulsby, C.; Pokrovsky, O.S.; Kirpotin, S.N.; Karlsson, J.; Serikova, S.; Vorobyev, S.N.; Manasypov, R.M.; Loiko, S.; Tetzlaff, D. Using stable isotopes to assess surface water source dynamics and hydrological connectivity in a high-latitude wetland and permafrost influenced landscape. J. Hydrol. 2018, 556, 279–293. [Google Scholar] [CrossRef]
  32. Kumar, S.; Prakash, S.; Logan, A.; Singh, Y. Tracing groundwater recharge sources in the northwestern Indian alluvial aquifer using water isotopes (δ18O, δ2H and 3H). J. Hydrol. 2018, 559, 835–847. [Google Scholar]
  33. Kaufmann, R.S.; Frape, S.; McNutt, R.; Eastoe, C. Chlorine stable isotope distribution of Michigan Basin formation waters. Appl. Geochem. 1993, 8, 403–407. [Google Scholar] [CrossRef]
  34. Eastoe, C.; Long, A.; Land, L.S.; Kyle, J.R. Stable chlorine isotopes in halite and brine from the Gulf Coast Basin: Brine genesis and evolution. Chem. Geol. 2001, 176, 343–360. [Google Scholar] [CrossRef]
  35. Berry Lyons, W.; Frape, S.K.; Welch, K.A. History of McMurdo Dry Valley lakes, Antarctica, from stable chlorine isotope data. Geology 1999, 27, 527–530. [Google Scholar] [CrossRef]
  36. Ying-kai, X.; Wei-guo, L.; Yin-min, Z.; Yun-hui, W.; Shirodkar, P. Variations in isotopic compositions of chlorine in evaporation-controlled salt lake brines of Qaidam Basin, China. Chin. J. Oceanol. Limnol. 2000, 18, 169–177. [Google Scholar] [CrossRef]
  37. Eastoe, C. Stable chlorine isotopes in arid non-marine basins: Instances and possible fractionation mechanisms. Appl. Geochem. 2016, 74, 1–12. [Google Scholar] [CrossRef]
  38. Eggenkamp, H. The Geochemistry of Stable Chlorine and Bromine Isotopes; Springer: Berlin, Germany, 2014. [Google Scholar]
  39. Banks, D.; Green, R.; Cliff, R.; Yardley, B. Chlorine isotopes in fluid inclusions: Determination of the origins of salinity in magmatic fluids. Geochim. Cosmochim. Acta 2000, 64, 1785–1789. [Google Scholar] [CrossRef]
  40. Luo, C.; Xiao, Y.; Wen, H.; Ma, H.; Ma, Y.; Zhang, Y.; Zhang, Y.; He, M. Stable isotope fractionation of chlorine during the precipitation of single chloride minerals. Appl. Geochem. 2014, 47, 141–149. [Google Scholar] [CrossRef]
  41. Richards, L.A.; Magnone, D.; Boyce, A.J.; Casanueva-Marenco, M.J.; van Dongen, B.E.; Ballentine, C.J.; Polya, D.A. Delineating sources of groundwater recharge in an arsenic-affected Holocene aquifer in Cambodia using stable isotope-based mixing models. J. Hydrol. 2018, 557, 321–334. [Google Scholar] [CrossRef]
  42. Kamtchueng, B.T.; Fantong, W.Y.; Wirmvem, M.J.; Tiodjio, R.E.; Takounjou, A.F.; Asai, K.; Djomou, S.L.B.; Kusakabe, M.; Ohba, T.; Tanyileke, G. A multi-tracer approach for assessing the origin, apparent age and recharge mechanism of shallow groundwater in the Lake Nyos catchment, Northwest, Cameroon. J. Hydrol. 2015, 523, 790–803. [Google Scholar] [CrossRef] [Green Version]
  43. Chaudhry, A.A. Wetlands in Pakistan: What is happening to them? World Environment Day, 5 June 2010. [Google Scholar]
  44. Afzal, S.; Younas, M.; Hussain, K. Physical and chemical characterisation of the agricultural lands of the Soan–Sakesar Valley, Salt Range, Pakistan. Soil Res. 1999, 37, 1035–1046. [Google Scholar] [CrossRef]
  45. Afzal, S.; Younas, M.; Ali, K. Temporal variability of the water quality of saline lakes from the Soan-Sakesar Valley, Salt Range, Pakistan. Water Qual. Res. J. 1998, 33, 331–346. [Google Scholar] [CrossRef]
  46. Ahmad, I.; Hussain, M.; Ahmad, M.S.A.; Ashraf, M.Y.; Ahmad, R.; Ali, A. Spatio-temporal variations in physiochemical attributes of Adiantum capillus-veneris from Soone Valley of salt range (Pakistan). Pak. J. Bot. 2008, 40, 1387–1398. [Google Scholar]
  47. Arshad, M. Management Plan Uchalli Wetlands Complex; The Ministry of Environment’s Pakistan Wetlands Programme: Islamabad, Pakistan, 2011.
  48. Qinghai Institute of Salt Lakes, Chinese Academy of Sciences. Analytical Method of Brines and Salts; Science Press Beijing: Beijing, China, 1988; pp. 29–368. (In Chinese) [Google Scholar]
  49. Magenheim, A.J.; Spivack, A.J.; Michael, P.J.; Gieskes, J.M. Chlorine stable isotope composition of the oceanic crust: Implications for Earth’s distribution of chlorine. Earth Planet. Sci. Lett. 1995, 131, 427–432. [Google Scholar] [CrossRef]
  50. Xiao, Y.; Zhou, Y.; Liu, W. Precise Measurement of Chlorine Isotopes Based on Cs2Cl2 by Thermal Ionization Mass Spectrometry. Anal. Lett. 1995, 28, 1295–1304. [Google Scholar] [CrossRef]
  51. Xiao, Y.; Yinming, Z.; Qingzhong, W.; Haizhen, W.; Weiguo, L.; Eastoe, C. A secondary isotopic reference material of chlorine from selected seawater. Chem. Geol. 2002, 182, 655–661. [Google Scholar] [CrossRef]
  52. Wan, H.; Liu, W. An isotope study (δ18O and δD) of water movements on the Loess Plateau of China in arid and semiarid climates. Ecol. Eng. 2016, 93, 226–233. [Google Scholar] [CrossRef]
  53. Liu, W.; Yang, H.; Wang, H.; Yao, Y.; Wang, Z.; Cao, Y. Influence of aquatic plants on the hydrogen isotope composition of sedimentary long-chain n-alkanes in the Lake Qinghai region, Qinghai-Tibet Plateau. Sci. China Earth Sci. 2016, 59, 1368–1377. [Google Scholar] [CrossRef]
  54. Stallard, R.; Edmond, J. Geochemistry of the Amazon: 2. the influence of geology and weathering environment on the dissolved load. J. Geophys. Res. Ocean. 1983, 88, 9671–9688. [Google Scholar] [CrossRef]
  55. Sami, K. Recharge mechanisms and geochemical processes in a semi-arid sedimentary basin, Eastern Cape, South Africa. J. Hydrol. 1992, 139, 27–48. [Google Scholar] [CrossRef]
  56. Spears, D. Mineralogical control of the chemical evolution of groundwater. In Solute Processes; Wiley: Chichester, UK, 1986; p. 512. [Google Scholar]
  57. Hounslow, A. Water Quality Data: Analysis and Interpretation; CRC Press: Boca Raton, FL, USA, 2018. [Google Scholar]
  58. Singh, A.K.; Hasnain, S. Environmental geochemistry of Damodar River basin, east coast of India. Environ. Geol. 1999, 37, 124–136. [Google Scholar] [CrossRef]
  59. Chidambaram, S. Recent Trends in Water Research: Hydrogeochemical and Hydrological Perspectives; I.K. International Publishing House Pvt. Ltd.: New Delhi, India, 2010. [Google Scholar]
  60. Okiongbo, K.; Douglas, R. Evaluation of major factors influencing the geochemistry of groundwater using graphical and multivariate statistical methods in Yenagoa city, Southern Nigeria. Appl. Water Sci. 2015, 5, 27–37. [Google Scholar] [CrossRef]
  61. Chebotarev, I. Metamorphism of natural waters in the crust of weathering—1. Geochim. Cosmochim. Acta 1955, 8, 22–48. [Google Scholar] [CrossRef]
  62. Qian, H.; Ma, Z.; Li, P. Hydrogeochemistry; Geological Publishing House: Beijing, China, 2005. [Google Scholar]
  63. Eggenkamp, H.; Kreulen, R.; Van Groos, A.K. Chlorine stable isotope fractionation in evaporites. Geochim. Cosmochim. Acta 1995, 59, 5169–5175. [Google Scholar] [CrossRef]
  64. Vengosh, A.; Chivas, A.R.; McCulloch, M.T. Direct determination of boron and chlorine isotopic compositions in geological materials by negative thermal-ionization mass spectrometry. Chem. Geol. Isot. Geosci. Sect. 1989, 79, 333–343. [Google Scholar] [CrossRef]
  65. Sherif, M.I.; Sultan, M.; Sturchio, N.C. Chlorine isotopes as tracers of solute origin and age of groundwaters from the Eastern Desert of Egypt. Earth Planet. Sci. Lett. 2019, 510, 37–44. [Google Scholar] [CrossRef]
  66. Zhang, M.; Frape, S.K.; Love, A.J.; Herczeg, A.L.; Lehmann, B.; Beyerle, U.; Purtschert, R. Chlorine stable isotope studies of old groundwater, southwestern Great Artesian Basin, Australia. Appl. Geochem. 2007, 22, 557–574. [Google Scholar] [CrossRef]
  67. Frape, S.; Bryant, G.; Blomqvist, R.; Ruskeeniemi, T. Evidence from stable chlorine isotopes for multiple sources of chloride in groundwaters from crystalline shield environments. In Proceedings of the Symposium on Isotopes in Water Resources Management, Vienna, Austria, 20–24 March 1995. [Google Scholar]
  68. Eggenkamp, H.G.M. δ37Cl: The Geochemistry of Chlorine Isotopes. Ph.D. Thesis, Utrecht University, Utrecht, The Netherlands, 1994. [Google Scholar]
  69. Santoni, S.; Huneau, F.; Garel, E.; Vergnaud-Ayraud, V.; Labasque, T.; Aquilina, L.; Jaunat, J.; Celle-Jeanton, H. Residence time, mineralization processes and groundwater origin within a carbonate coastal aquifer with a thick unsaturated zone. J. Hydrol. 2016, 540, 50–63. [Google Scholar] [CrossRef] [Green Version]
  70. Craig, H. Isotopic variations in meteoric waters. Science 1961, 133, 1702–1703. [Google Scholar] [CrossRef] [PubMed]
  71. Hussain, S.; Xianfang, S.; Hussain, I.; Jianrong, L.; Dong Mei, H.; Li Hu, Y.; Huang, W. Controlling factors of the stable isotope composition in the precipitation of Islamabad, Pakistan. Adv. Meteorol. 2015, 2015, 817513. [Google Scholar] [CrossRef]
Figure 1. Climate change patterns recorded in Pakistan during the last century: (a) area-weighted mean daily temperatures time series. Temperatures are averaged yearly from 1960 to 2013 (modified from [9,13]). (b) Annual average precipitation time series (modified from [10]). (c) Annual river flows of the Indus River System in Pakistan, from 1947 to 2002 (modified from [9]).
Water 11 00912 g001
Figure 2. (A) Location map of the Uchhali complex, Soan–Sakesar Valley, Salt Range, Pakistan. The lithology of the study area is also reported (modified from [25,44,45]). (B) Stratigraphic column of the study area. The Sakesar and Muree formations represent the main water-bearing formations.
Water 11 00912 g002
Figure 3. Piper diagram showing the different hydrofacies of the three saline lakes.
Water 11 00912 g003
Figure 4. Ion relationships in the lakes’ water samples.
Water 11 00912 g004
Figure 5. Identification of the mechanisms controlling the lakes’ water chemistry.
Water 11 00912 g005
Figure 6. Saturation indices calculated for the following dissolved minerals: dolomite, calcite, gypsum and halite.
Water 11 00912 g006
Figure 7. δ37Cl variations with (a) TDS and (b) 1/Cl in the saline lakes of the Salt Range area.
Water 11 00912 g007
Figure 8. Classical water δ18O vs. δD diagram. The GMWL is taken from [70], LMWL from [71] and the evaporation line from [1,70].
Water 11 00912 g008
Table 1. Ion compositions, water (δD, δ18O) and chlorine (δ37Cl) stable isotope compositions of the saline lakes of the Soan-Sakaser Valley (Salt Range, Pakistan) and their comparison with previous studies. Data sources: 1986 [40], 1994 [39] and 2007 from [47].
SampleDK+Na+Mg2+Ca2+SO42−ClCO3HCO3B3+δ18OδDδ37ClTDSDensitypH
(m) (mg/L) (‰) (g/L)g/cm3
K-1027.66500167.9417.77660.2357.9140589.72.39.2427.89−0.012.601.0018.66
K-2431.08498.2167.6815.61643.6355.11285922.158.8729.310.032.631.0018.63
K-3031502.116516.12655.5357.2133590.12.259.0128−0.032.611.0018.63
K-4229.9499167.217645356.9127.8590.32.189.2328.9−0.012.61.0018.65
K-5129.91500.1166.1316.44554356.12133.21590.552.239.0528.4−0.022.611.0038.84
Mean -29.91499.88166.7916.58631.66356.64132.40590.532.22 2.611.0018.68
1986-82.11770.5130.15.81964.1478.7------2.65-8.5
1994-32.45508.2149.5737.07417.9484.03--0.64---2.4-8.9
2007-----605.66208.8------1.43-9.5
U-10151.311,180.1106253.6411,59010,536190.6522.78.067.7321.08−0.0336.101.0278.84
U-23.5158.411,470.34108551.0211,61010,532162.6550.58.037.7522.950.0136.211.0348.84
U-31155.111,442.91077.15211,601.1210,514172.9543.78.037.722.240.0236.131.0288.81
U-4015711,278107253.6511,69910,52519052387.7121.98−0.0136.201.0248.83
U-52155.111,334.511074.15311,58010,528.1181.12539.418.017.722.19−0.0236.01.028.82
Mean-1.3155.3811,341.17107452.6611,61610,527.179.4535.8 1.0268.82
1986-344.0811,707680.96traces16,2728120.34------26.83->11
1994-253.9898901770.5158.9214,288.99528.1--0.96---36.5-8.81
2007-----7208.59175--ND- -29.06-9.21
J-10115.022386.7136.366.78890.21414789.321233.068.1123.820.097.971.0049.35
J-201142380.0936.597.28831419.37882133.023.058.223.7−0.027.951.0059.36
J-30114.32383.1376.8889.71415.1777.122140.2238.123.70.027.971.0049.32
J-40115.292382.8735.126.91886.011415.2785.12132.13.058.1523.76−0.017.921.0049.33
Mean-114.652383.1936.266.9225887.221415.9784.882132.083.04 1.0049.34
1986-207.21897.552.2912.02984900.7------4.96-9
1994-43.01807.853.49.82835.71035.4--1.23---8.75-9.24
2007-----624.3990--ND---4.2-9.69

