Spatial and Temporal Variability in Precipitation Concentration over Mainland China, 1961–2017
by
Yujie Lu
1,2, 
Shanhu Jiang
1,2,*,
Liliang Ren
1,2,
Linqi Zhang
2,
Menghao Wang
2,
Ruolan Liu
2 and
Linyong Wei
2 1
State Key Laboratory of Hydrology-Water Resources and Hydraulic Engineering, Hohai University, Nanjing 210098, China
2
College of Hydrology and Water Resources, Hohai University, Nanjing 210098, China
*
Author to whom correspondence should be addressed.
Water 2019, 11(5), 881; https://doi.org/10.3390/w11050881
Submission received: 28 March 2019
/
Revised: 19 April 2019
/
Accepted: 23 April 2019
/
Published: 26 April 2019
(This article belongs to the Section Water Resources Management, Policy and Governance)
Abstract
:Understanding the patterns and mechanisms of precipitation variations is important for assessing flood and drought risks and for ensuring sustainable water use. Here, we analyzed the characteristics of annual precipitation changes in eight subregions of China using the Mann–Kendall test based on daily precipitation data from 774 rain gauge stations during 1961–2017. Then, we used the monthly precipitation concentration index (PCI) and daily concentration index (CI) to analyze precipitation concentrations. The results are as follows: (1) PCI and CI in northern China generally decreased with time, indicating a uniform precipitation distribution. Notably, the annual precipitation increased significantly in Xinjiang and the Qinghai-Tibet Plateau, which could alleviate future drought. (2) PCI increased and CI decreased in the plain regions of the Yangtze River and Southeast China, exhibiting high CI values with marked increases of annual precipitation. Such heavy rainfall events combined with high rainfall concentrations could increase the flood risk. (3) A significant PCI increase and CI decrease occurred in Southwest China, where annual precipitation decreased significantly. Regular rainfall decreased notably, which could increase the likelihood of drought hazards. (4) Overall, both indices showed negative trends at most stations; precipitation distribution was generally more uniform over China. These findings improve our understanding of extreme rainfall evolution and water resource distribution over China. Furthermore, PCI and CI can serve as warning tools for disaster control and water resource management.
1. Introduction
Precipitation is a key component of the global water cycle. Changes in rainfall intensity, quantity, and spatiotemporal patterns often lead to extreme events such as droughts and floods. With the intensification of global climate change, changes in both global and regional natural precipitation characteristics [1,2] have negatively affected the human living environment, economic and social development, and many other aspects [1,3,4]. The trend of significant increases or decreases in daily or monthly precipitation in most countries is directly related to changes in the same signs of the amount of precipitation during heavy and extreme precipitation events [5,6]. The number of regions exhibiting a significant increase in extreme precipitation events is more than those exhibiting a significant decrease [7], and the growth rate of short-duration extreme precipitation may be greater than that of long-duration extreme precipitation. Therefore, considerable attention has been paid to extreme climatic phenomena by the public, governments, and academic institutions around the world in a backdrop of climate change and intensified human activities [8,9]. Moreover, spatial and temporal variations in precipitation distribution are an important aspect of climate research that have affected water circulation processes such as precipitation, evaporation, runoff, and soil water content to varying degrees [2].
Although the low frequency of observed extreme events, heavy rainfall occurring in a few day accounts for a large proportion of annual rainfall and may lead to flooding. A better technique to evaluate rainfall distribution and variability is to consider the contribution of several rainy days with the largest amount of rainfall to total rainfall. The timing and rate of annual precipitation concentration are also the characteristics of heavy rainfall. High precipitation concentrations often mean that the majority of annual precipitation is concentrated in a short period, which greatly affects the distribution of water resources. Many methods have been proposed to reflect the characteristics of nonuniform distributions of precipitation over a certain period. Specifically, several precipitation indices related to precipitation concentration are widely used to characterize the changing patterns of precipitation. For example, one of the main causes of waterlogging is multiday heavy precipitation. To analyze the concentration degree of daily precipitation, Martin-Vide [10] defined a concentration index (CI) to evaluate the contribution of the highest daily precipitation to the total amount. Owing to its scientific and practical merits, CI has been used to detect or monitor the heterogeneity of precipitation distributions in many regions [11]. To quantitatively evaluate monthly precipitation heterogeneity throughout the year, Oliver [12] and De Luis and Gonzalez-Hidalgo [13] developed the precipitation concentration index (PCI) based on monthly precipitation data. This index is simple to calculate and has intuitive physical meaning; thus, it can better represent the concentration degree and seasonality of annual precipitation. Numerous studies on precipitation variability have subsequently used the PCI index [14,15,16,17,18].
China has a vast land area with the most frequent drought and flood disasters. According to available data records, the maximum rainfall in many periods in China has been close to the most extreme values around the world; some have even exceeded global records, such as an increase in recent natural disasters, including a spring drought in Southwestern China and flood disasters that cause considerable social losses almost every year [19]. This phenomenon is closely related to many serious hazards in China, highlighting the importance of an accurate characterization of precipitation concentration. However, most studies have focused on analyzing patterns of extreme precipitation events using indices of extreme climate events [20,21]. Compared to the low frequency of observed extreme events, the exploration of precipitation concentration can improve the understanding of major disasters and provide warnings. Li et al. [16] calculated precipitation CIs in Xinjiang and concluded that the Kaidu River basin and Southern Xinjiang have higher precipitation CIs, with most parts of Xinjiang characterized by no significant trends in precipitation CIs. Huang et al. [22] studied the two precipitation concentration indices and found that the precipitation concentration in Qinghai showed a significant irregularity of the monthly rainfall distribution and a highly homogeneous distribution of the daily rainfall. These PCI and CI studies mainly focused on some major river basins or regions in China; only a few studies have focused on mainland China. Duan et al. [14] observed negative PCI trends for almost the entire country from 1961–2010, suggesting a more uniform monthly precipitation distribution over China. Tong et al. [23] claimed that CI values were large in eastern China and in the summer but small in western China and in the winter. However, previous studies on precipitation concentration in China have been limited to a specific region and have lacked a systematic analysis and regional comparisons across China. Analyzing and understanding the spatiotemporal characteristics and impacts of the precipitation concentration index in China is the key to understanding and solving water problems in China, especially in the context of climate change and human activities. Also, the combination of the PCI index with the CI index could be a more efficient methodology because of their different mechanisms and evaluation criteria. Moreover, minimal studies have compared these precipitation concentration indices for a better understanding of precipitation concentration in China. Thus, a detailed analysis of precipitation concentration in China could enhance the understanding of the statistical characteristics of precipitation extremes and could provide support for making macro decisions about river affairs and the prevention of natural disasters.
Thus, the study performs a comprehensive analysis of the daily and monthly precipitation concentration degrees in China based on the PCI and CI indices, including an analysis of its temporal changes and spatial distribution characteristics from 1961 to 2017. The aims are as follows: (1) to investigate the spatial and temporal patterns of precipitation in China using the CI and PCI indices at different time scales; (2) to analyze the trends of the PCI and CI series using the Mann–Kendall trend test; and (3) to reveal the temporal evolution of precipitation concentration and the differences between typical regions of China. The findings of this study will provide a better understanding of precipitation characteristics and their potential implications for the prevention and response of drought and flood disasters in China.
2. Study Area and Data
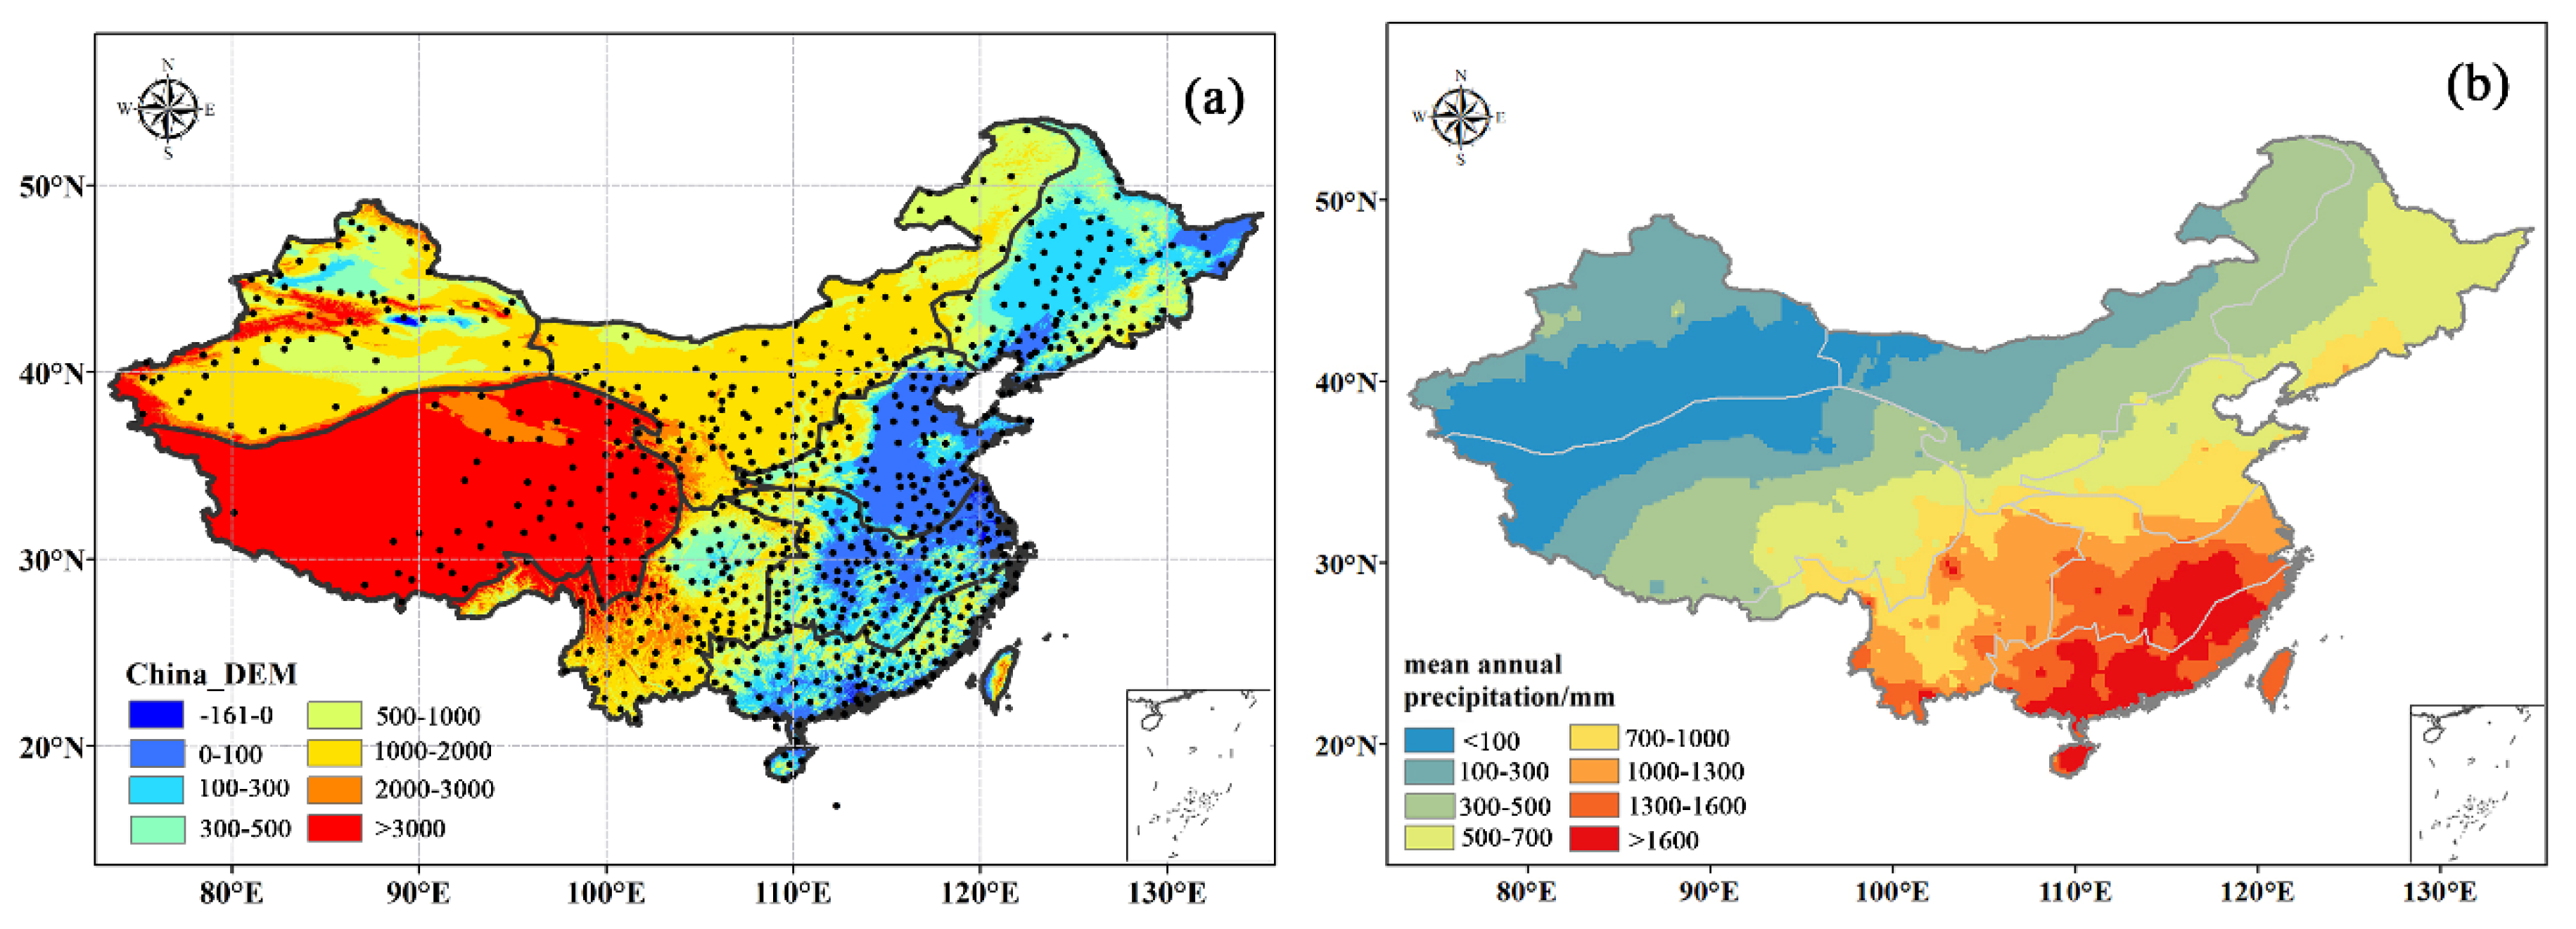
China’s vast territory, different landforms, and geographical locations create large differences in the climate between different regions of the country. Figure 1a shows the topographic variability of the digital elevation model (DEM). Considering the altitude, China can be roughly divided into three regions: (1) >3000 m, (2) 1000–3000 m, and (3) <1000 m. To analyze the spatial and temporal variations of precipitation concentration indices at different scales more clearly, as well as their mechanisms, we divided the mainland of China into eight regions according to Chen et al. [24] depending on the annual mean precipitation distribution [25], mountain ranges [26], and elevations. As shown in Figure 1a, the subregions are (1) Northeast China (NE), which belongs to a temperate monsoon climate, transitioning from humid/semi-humid to semiarid from southeast to northwest; (2) North China (NC), located north of the Qinling Mountains-Huaihe River line and with a temperate monsoon climate, a hot and rainy climate in summer, and a cold and dry climate in winter; (3) the middle and lower reaches of the Yangtze River region (CJ), which have a subtropical monsoon climate, a hot and rainy climate in summer, and a mild and rainy climate in winter; (4) Southeast China (SE), located in the southernmost part of China and has its northern boundary between middle subtropical and southern subtropical regions; (5) Northwest China (NW), which is bounded approximately by the 400-mm annual precipitation isoline; (6) Southwest China (SW), which is bounded by the Dabie Mountains to the north and the Wuyi Mountains to the east with a tropical monsoon climate; (7) Xinjiang (XJ) in central Asia, which is dominated by an arid or semiarid climate with less annual precipitation; and (8) the Qinghai-Tibet Plateau (Tibet), which is dominated by a plateau mountain climate with a high altitude, a complex topography, little rainfall, and larger regional differences.
The study area encompasses all of mainland China. The data comprises 24-h precipitation data of 824 stations nationwide (from 20:00 to 20:00) obtained from the China Surface Climate Data Set (V3.0) released by the National Climate Center (NCC) of the China Meteorological Administration (CMA). All data were quality controlled before release. Furthermore, homogeneity tests were also performed using the RclimDex software package (http://etccdi.pacificclimate.org/software.shtml). The software can pick out illogical data, such as precipitation values below 0 mm, that were treated as missing values. Due to the different observation starting time and the large number of missing measurements at some stations, many stations were excluded to guarantee the integrity of the data series. If the missing daily precipitation data of the station account for more than 5% of 57 years, the station will be excluded. Therefore, 1961–2017 data from 774 stations were selected. The missing values of selected stations were processed as follows: firstly, if values were missing no more than two days, the missing value was replaced by the average value of rainfall of adjacent days. However, if consecutive days were missing, values were estimated by a simple linear correlation based on data from neighboring stations (R2 > 0.95) [16]. The meteorological stations used in this study did not include Hong Kong, Macao, or Taiwan.
3. Methodology
3.1. Monthly Precipitation Concentration Index
In this study, the modified PCI series was used to investigate monthly rainfall heterogeneity, which was modified by De Luis et al. [27] using the rainfall concentration index defined by Oliver [12]. The modified index is described as follows:
where is the monthly rainfall amount of month . According to Equation (1), if the annual precipitation is concentrated within a single month, PCI is equal to the maximum of 100. If the annual precipitation is evenly distributed throughout all 12 months, then PCI is approximately equal to 8, which is the minimum value. The PCI is estimated on an annual scale, which explains the degree of precipitation concentration during a given year. Annual PCI values below 10 represent a uniform distribution of the monthly rainfall or a low level of precipitation concentration for the year. PCI values ranging from 11 to 15 denote a seasonal distribution and a moderate precipitation concentration or relatively uniform precipitation distribution. PCI values between 16 and 20 mean that the monthly precipitation distribution is irregular and that more precipitation falls in only a few months. PCI values above 20 indicate a strongly irregular precipitation distribution throughout the year and correspond to climates with a substantial monthly rainfall variability. The PCI values obtained in this study are the average for each given year in the selected period, which can also be calculated using the monthly average precipitation during the study period.
3.2. Daily Concentration Index
The concentration index (CI) proposed by Martin-Vide [10] is used to assess variations in the proportion of daily precipitation compared to the total amount. The CI index can quantitatively evaluate the relative or percentage effects of different magnitudes of daily precipitation, especially those of the largest daily rainfall event. The CI index is based on the fact that the statistical distribution of daily precipitation compared to the total amount is generally adjustable by a negative exponential distribution [28]. This index is calculated by analyzing the cumulative percentage contribution of precipitation amount, Y, and the cumulative percentage of wet days, X. In this study, a rainy day is defined as a day with at least 0.1 mm of rainfall, and 1 mm of precipitation is used as the precipitation interval to classify the precipitation limits in ascending order. An irregularity of the rainfall distribution was measured by determining the percentage of rain contributed by days falling in each class. The percentage differences in the contribution of different classes of daily precipitation events to the total precipitation are associated with negative exponential curves, which are known as normalized rainfall curves [29]. Based on previous studies, the calculation method for CI is as follows:
- Classify the daily precipitation based on class limits;
- Count the number of rainy days in each class interval, and compute the associated amount of precipitation of each group;
- Calculate the cumulative summation of the output items in step 2;
- According to the results of step 3, the accumulated percentage of precipitation days (X) and the associative accumulated percentage of precipitation (Y) are obtained;
- Derive the exponential curve of X versus Y.
Martin-Vide [10] recommends the following exponential curve to match the empirical pairs of value (, ), which are defined as
where a and b are the regression coefficients that can be determined by the least-squares method. Generally, the curve generated by Equation (2) is called the concentration curve or Lorenz Curve and has been used in many geographical regions, such as Italy [30], South America [31], Puerto Rico [32], Asia [16], South China [33], and Sicily [15]. The formula is shown as the following:
After determining the constant a and b, the daily precipitation concentration index is defined as
where S is the area enclosed by the bisector of the quadrant and the polygonal line
and A is the definite integral between 0 and 100 of the exponential curves, which represents the area under the curve:
The CI value is the fraction of S in the area of the lower triangular area defined by the perfect distribution (45°) line and varies from 0 to 1. The area S, enclosed by the quadrantal bisector and exponential curve, provides an evaluation standard for the concentration degree. The larger the area, the greater the CI value and the higher the concentration degree, which means that more precipitation is concentrated in fewer rainy days.
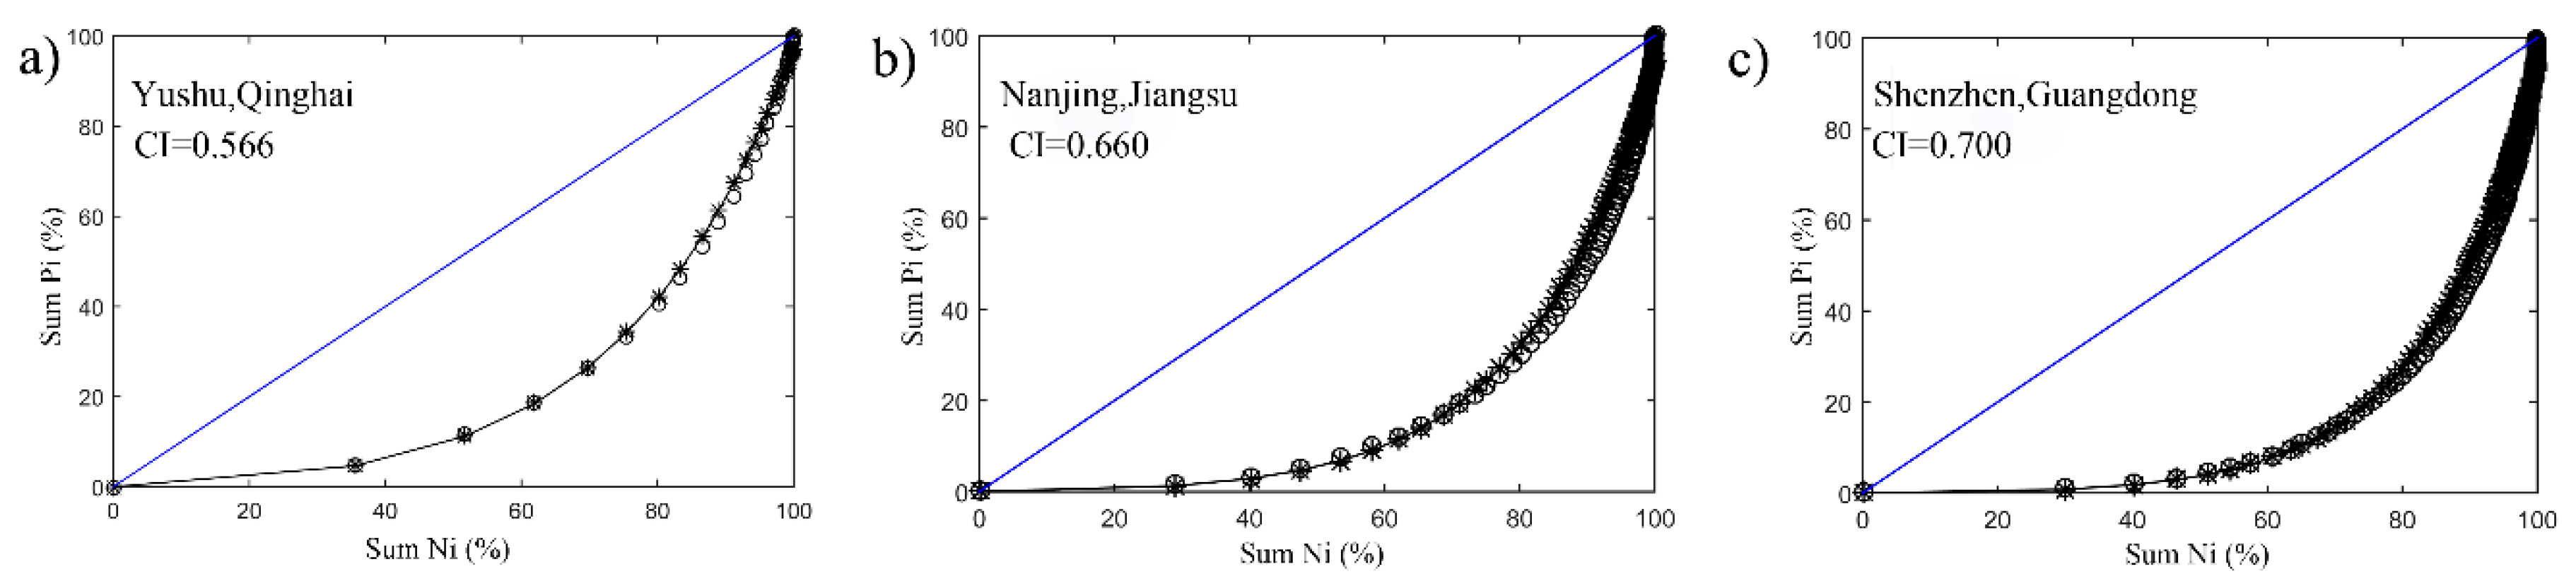
To illustrate the CI index, we show data from three stations that display three different levels of CI using the Lorenz curve in Figure 2. The stations are Yushu station in Qinghai province (33° N, 96°58′ E), Nanjing station in Jiangsu province (31°55′ N, 118°54′ E), and Shenzhen station in Guangdong province (22°16′ N, 113°34′ E). Figure 2 compares the fitted concentration curve and the empirical curve and indicates that the simulated and observed cumulative percentages of rainy days match well. This means that Equation (1) can effectively estimate precipitation variations. The three meteorological stations have different CI values (0.566, 0.660, and 0.700 for Yushu, Nanjing, and Shenzhen, respectively). A further analysis of Figure 2 reveals that the precipitation concentration is positively correlated with the area S of the Lorentz curve and the dotted line (45°). When the precipitation concentration is lower, the area of this part is smaller.
3.3. Mann–Kendall Test
In this study, the Mann–Kendall nonparametric statistical test [34] was adopted to test and evaluate the temporal effect of the precipitation concentration index (PCI/CI) changes for trend detection, which has been widely used in the analysis of hydrometeorological variables, including water quality, flow, temperature, and rainfall series [35,36,37]. We also used it to determine the significance of the PCI and CI indices. Like many other trend analysis methods, the Mann–Kendall test assumes that the time series are stable, independent, and random with equal probability distributions. However, it has the advantage that it does not require data to follow a specific distribution and is insensitive to outliers [38,39]. Consequently, many studies around the world have applied the Mann–Kendall method [40,41,42,43].
For the sequence , the numerical value relationship of all dual values and should be first determined (set as S). The statistics of the trend test are
where
and is the number of data points. When is greater than 10, converges to the standard normal distribution. The statistic Z is calculated as
Moreover, positive values of Z reflect an increasing trend, while a negative Z represents a decreasing trend. If |Z| > 1.96, the null hypothesis of no trend is rejected and the trend exhibits a 95% significance level. Similarly, if |Z| > 1.64, the null hypothesis of no trend is rejected and the trend is at the 90% significance level. In this research, we analyzed the trends at the 0.05 and 0.1 significance levels.
4. Results and Discussion
4.1. Characteristics of Annual Precipitation
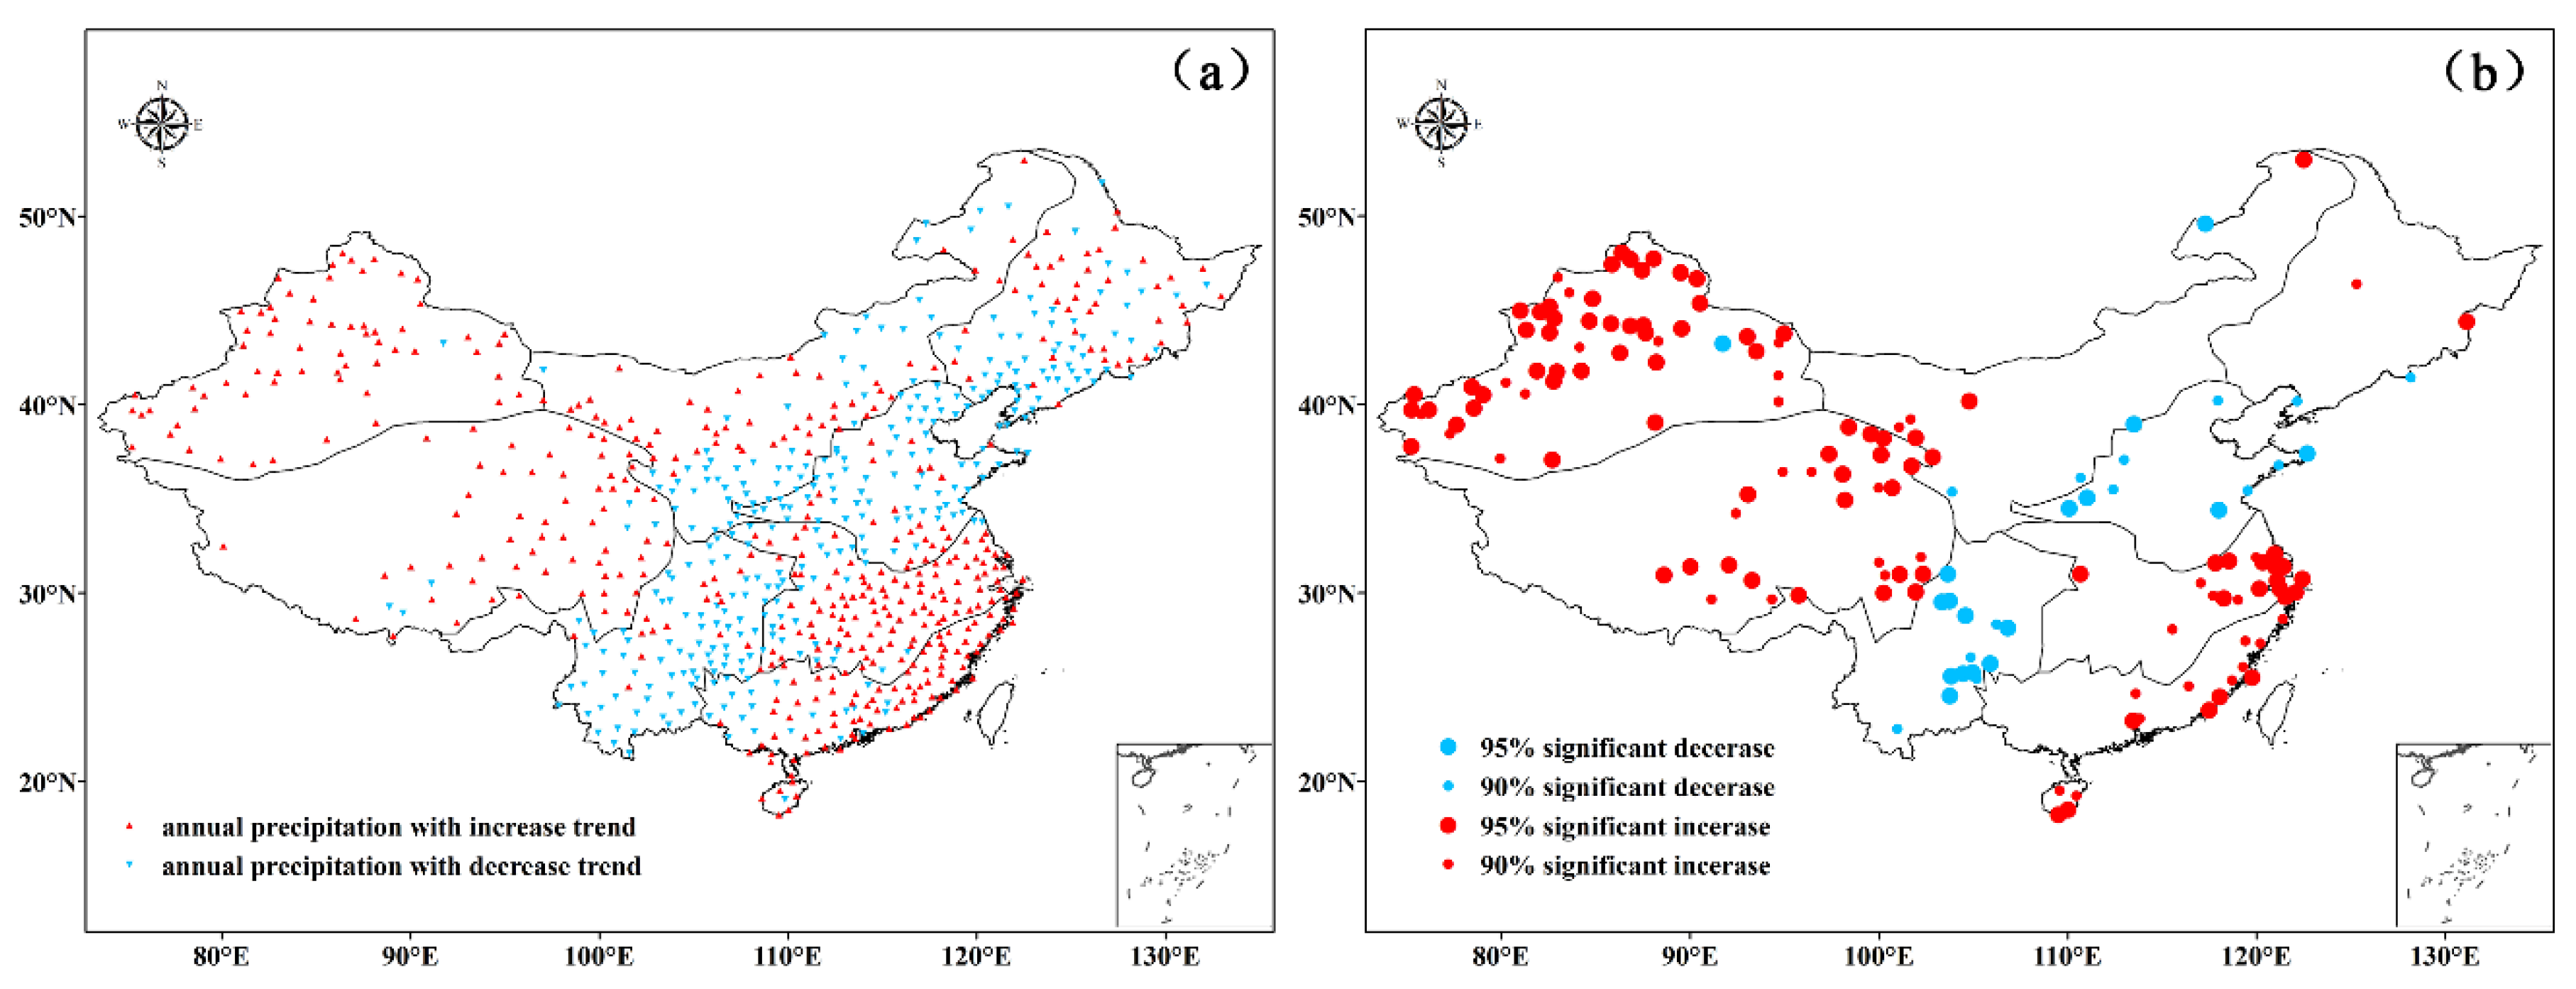
First, we analyzed the spatial distribution of annual precipitation in China from 1961 to 2017 for 774 stations (Figure 1b). The annual precipitation ranges widely from 14–2700 mm and is distributed across China in a broad northwest to southeast gradient. The Mann–Kendall’s test results show a clear variation trend of the total rainfall in China. There is an obvious spatial pattern of “increase-decrease-increase” in the annual precipitation from the southeast coastal area to the northwest inland area (Figure 3a). Rain gauges predominantly show an increasing trend with time.
According to the statistics, approximately 41.3% of the 774 stations show a negative trend, with 9.4% being statistically significant, and approximately 58.1% of all stations show a positive trend, with 16.0% being statistically significant. The rain gauges exhibiting a decreasing trend are concentrated in the middle part of China (eastern part of NW and southern part of NE, NC, and SW), whereas stations exhibiting an increasing trend are mainly centered in CJ, SE, TP, and XJ. It is notable that the region showing a decreasing trend constitutes a continuous arc from Liaoning to Yunnan and includes China’s farming-pastoral transitional zone, which roughly coincides with the 400-mm annual rainfall isohyet and represents a climate transition zone. This indicates that the variation of the total rainfall in the climate transition zone is much more unstable. In the eastern part of China (NE, NC, CJ, and SE), the total rainfall increases in the south and decreases in the north, i.e., the spatial pattern corresponds to “southern waterlogging and northern drought” [44]. In the western part of China (NW, TP, and XJ), the spatial pattern exhibits a clear increasing trend, which is beneficial for easing severe drought conditions. Rainfall variability in the western part of China is predominantly affected by the significant seasonal characteristics of water vapor sources [45] and plays a key role in the occurrence of extreme drought and flood events. Considering the statistical significance (Figure 3b), stations with positive trends prevail in the southeastern and western parts of China (CJ, SE, TP, and XJ). Furthermore, the significant positive trends are stronger than the significant negative trends.
However, regional differences in annual precipitation variations are strong (Figure 3). Ren [46] and Xiao [47] also reported that different periods show different spatial distributions. In brief, precipitation in northeast China shows a consistent decrease, while southeastern coastal areas and northwestern China have increased since the 1990s. Analyzing the characteristics of annual precipitation variations is important for scientific reference value and for guiding water conservation projects such as “South to North Water Diversion” and other projects [48].
4.2. Spatiotemporal Patterns of PCI
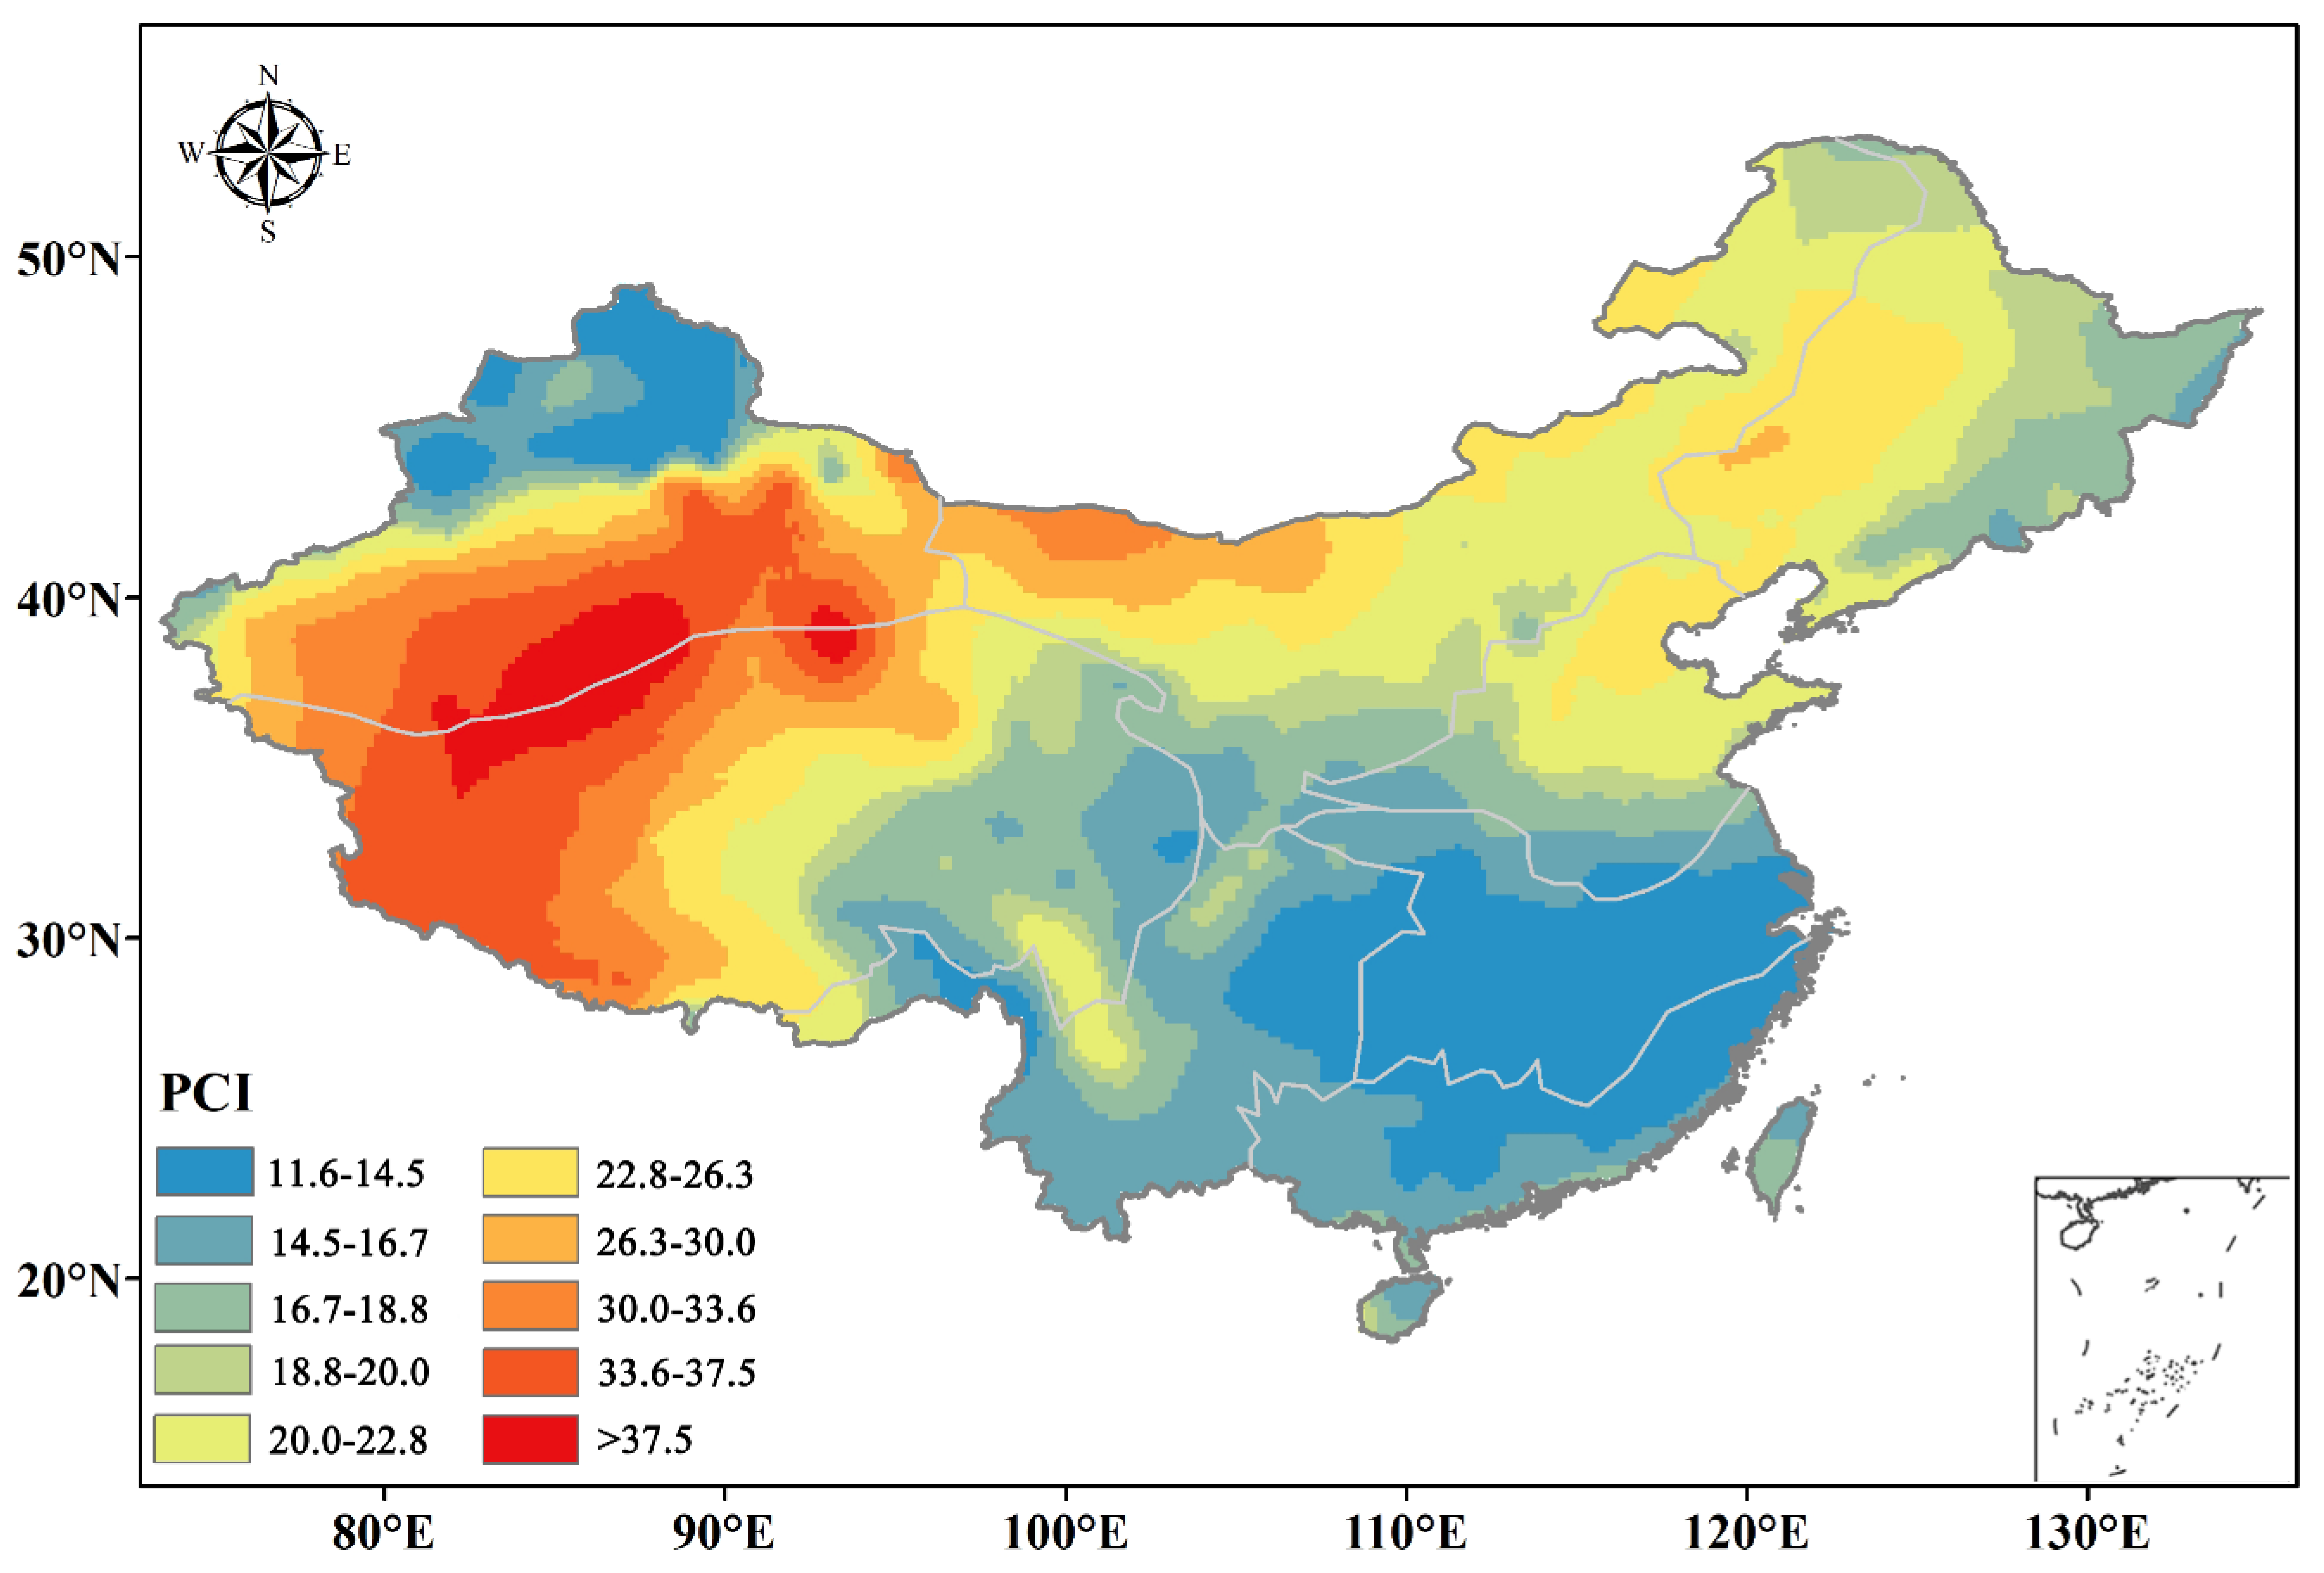
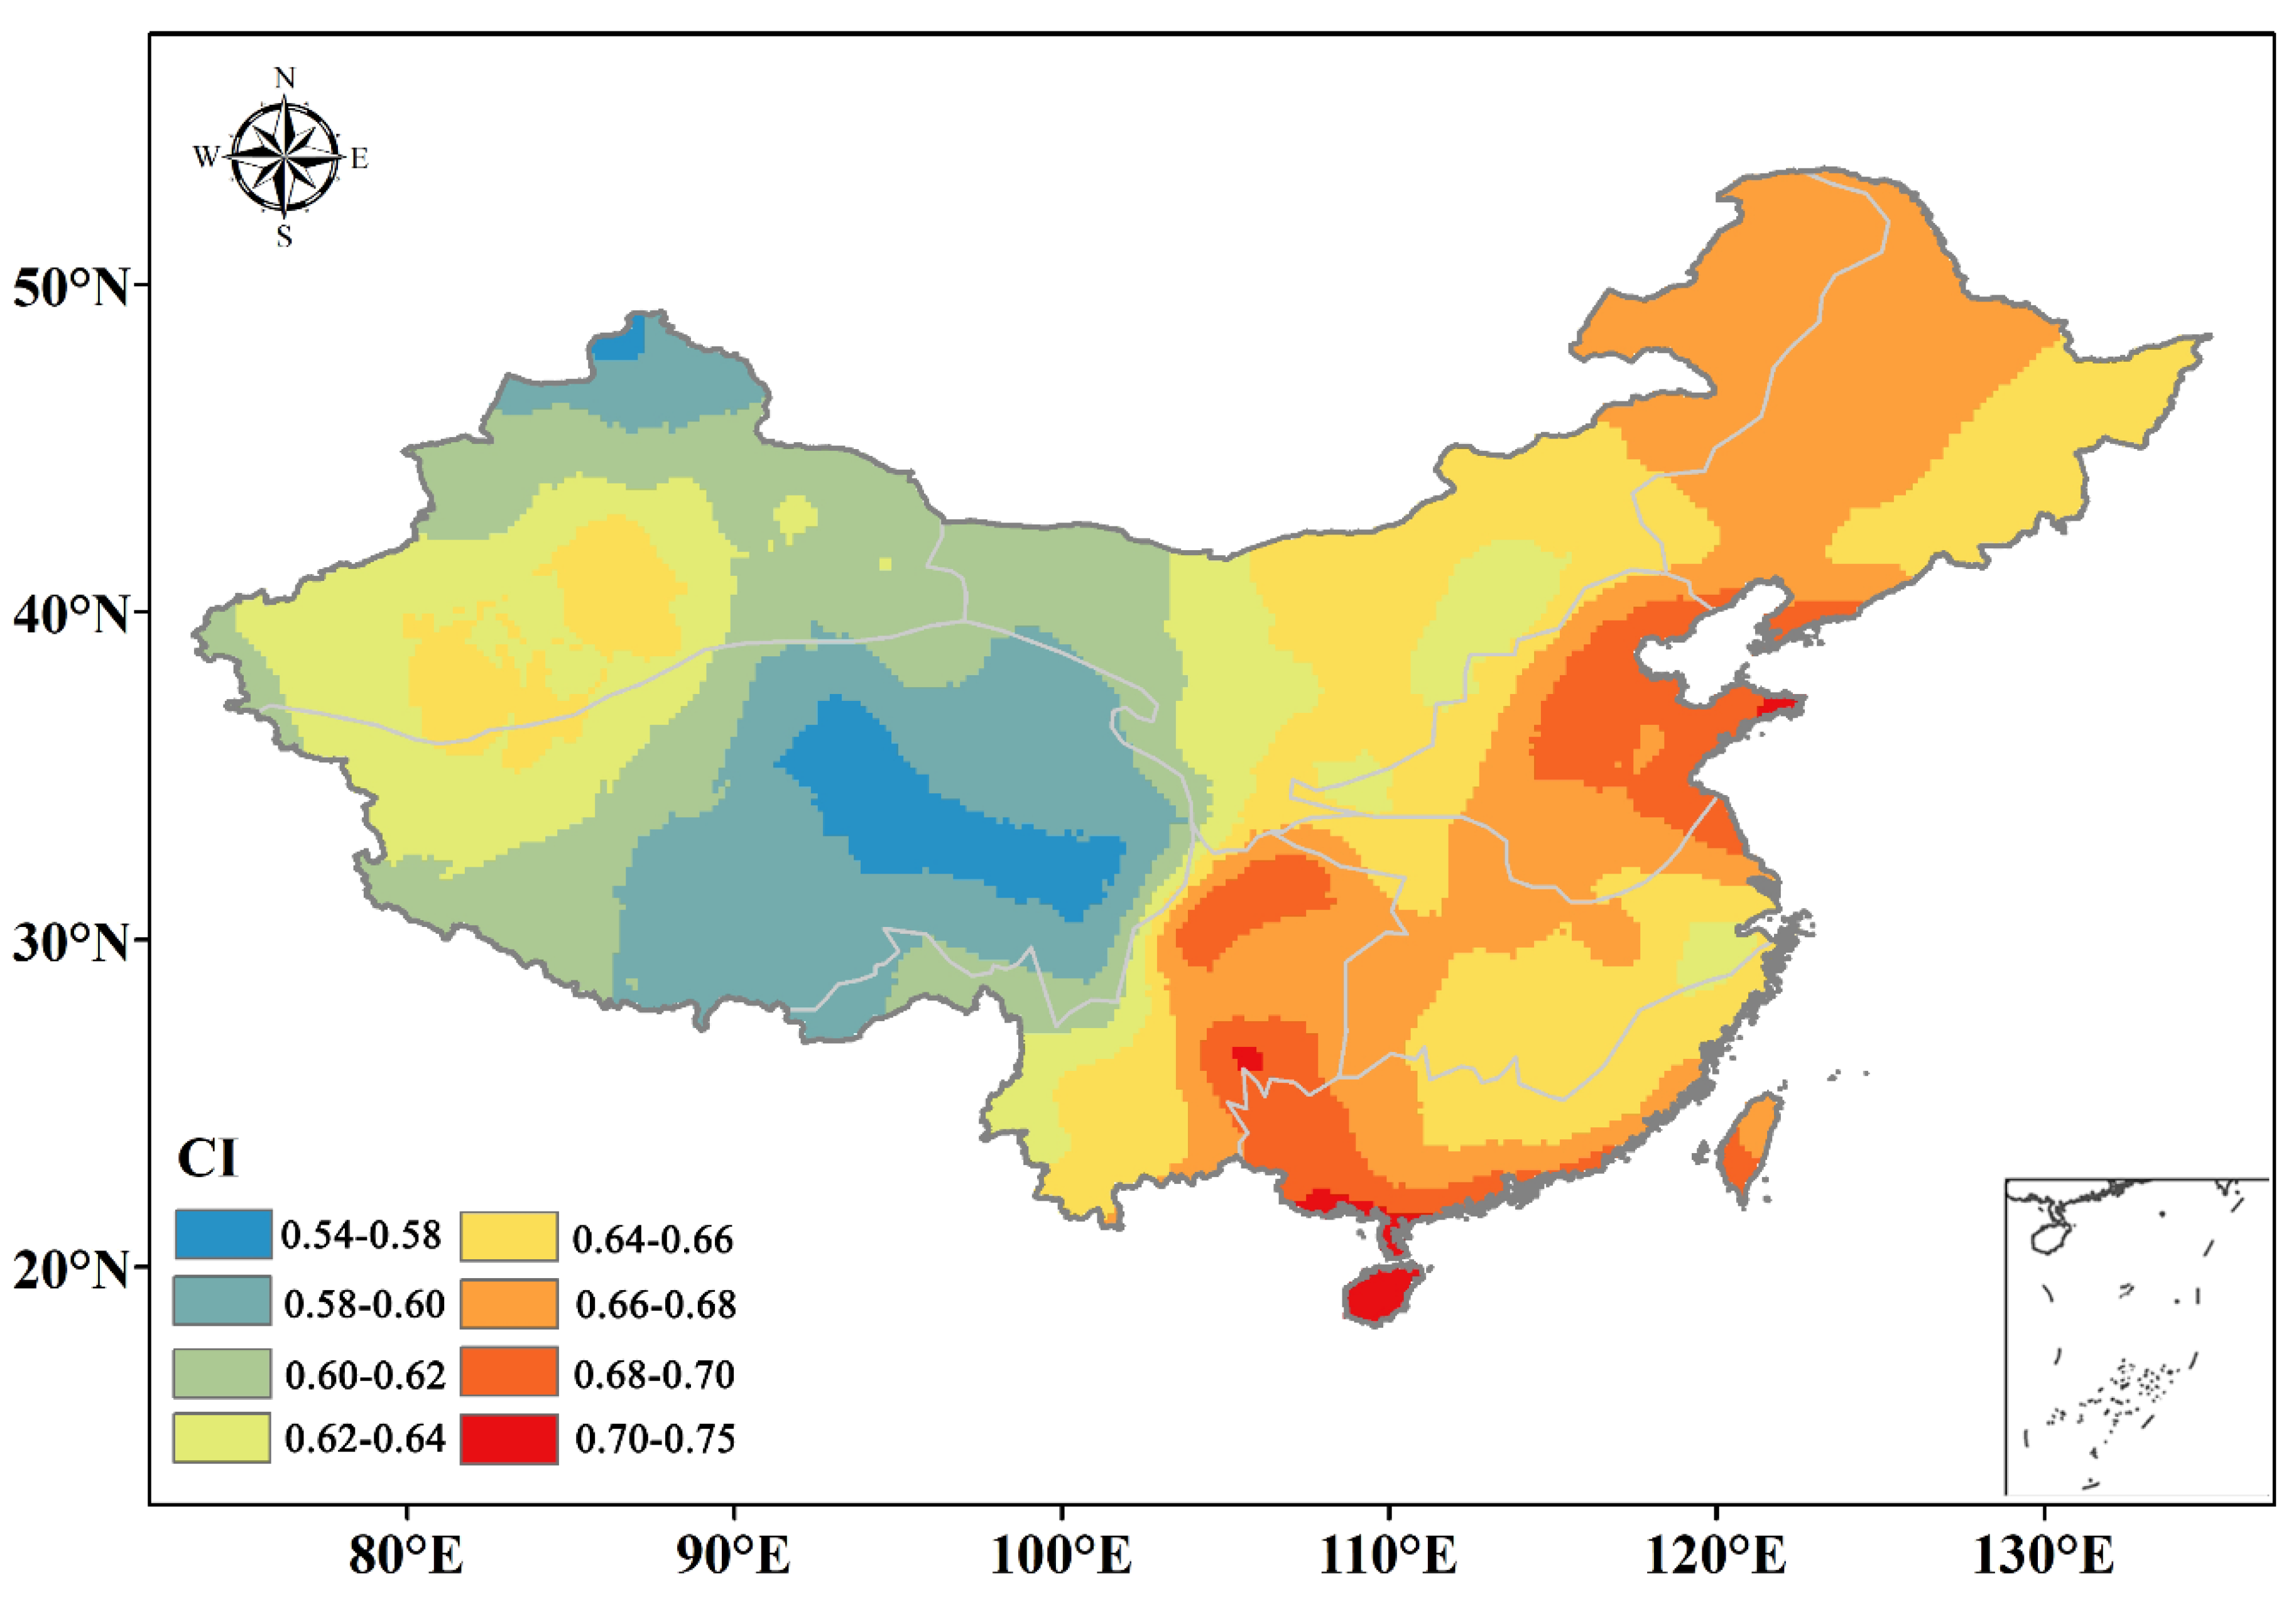
The PCI proposed by Oliver [12] can effectively represent the distribution patterns of annual precipitation over a 12-month period. The spatial distribution of multiyear average PCI values is shown in Figure 4, which is derived from the monthly precipitation data sets of each year from 1961 to 2017 using 774 national meteorological stations in China. The kriging spatial interpolation method is adopted to show the spatial distribution. The PCI values, which range from 11.3 to 42.3, exhibit an increasing trend from the coastal region to inland areas, excluding the northern region of Xinjiang (Figure 4). The complex topography leads to different circulation features between the north and south of Xinjiang [49], which results in a different rainfall distribution. Higher PCI values are predominantly observed in TP and XJ, whereas lower PCI values are mainly found in the coastal area of SE and CJ. The minimum PCI is 11.4 in Nanyue station of Hunan province (27°18′ N, 112°42′ E), while the maximum PCI is 42.2 at Lenghu station in Qinghai province (38°45′ N, 93°19′ E).
According to Figure 4, the monthly precipitation exhibits seasonal and uniform characteristics in CJ and SE, where the PCI values are less than 18.8. The PCI values in SW all are less than 20, and the annual precipitation distribution is also relatively uniform. The PCI values of most regions in NE, NC, and the eastern part of NW are greater than 20, indicating a heterogeneous distribution of the annual precipitation, with a certain degree of volatility and a high concentration degree. In the western areas of 100° E (XJ, TP, and the western part of NW), the PCI values are greater than 30, which indicates an extremely uneven distribution of the monthly precipitation. Conversely, in northern XJ and eastern TP, the PCI values are generally less than 20; thus, precipitation is less concentrated within the year.
The results of the Mann–Kendall trend test for the PCI series are shown in Figure 5a. The PCI values of most stations exhibit negative trends, but only a few stations pass the significance test. According to Table 1, 245 stations are characterized by an increasing PCI, accounting for 31% of all stations. The number of stations with a decreasing PCI is approximately twice those exhibiting an increasing trend. Thus, during the past 60 years, the PCI series in most parts of China has decreased and the distribution of monthly precipitation is generally more uniform, which is consistent with the research results of Duan et al. [14]. Significant decreases of the PCI series mainly occur in northern and western China (NE, NW, TP, and XJ), whereas significant increasing trends are predominantly distributed in SW, CJ, and SE (Figure 5b). This indicates that intra-annual precipitation variability is becoming increasingly heterogeneous in SW, CJ, and SE.
The PCI trend analysis results of subregions with a significance level equal to 90% or 95% (Table 1) show the percentage of rain gauges with a positive or negative trend. Some prominent differences are observed among the eight subregions. The positive significant trends are similar for all subregions, with only a few exhibiting statistical significance (7.4%). Conversely, NE, XJ, TP, and NW show a greater number of stations with negative significant trends (at least 24.5%). These zones are dominated by a strong irregular distribution of precipitation. Huang et al. [22] suggested that the decline in PCI might be due to the increasing rainy days that occur in the dry season.
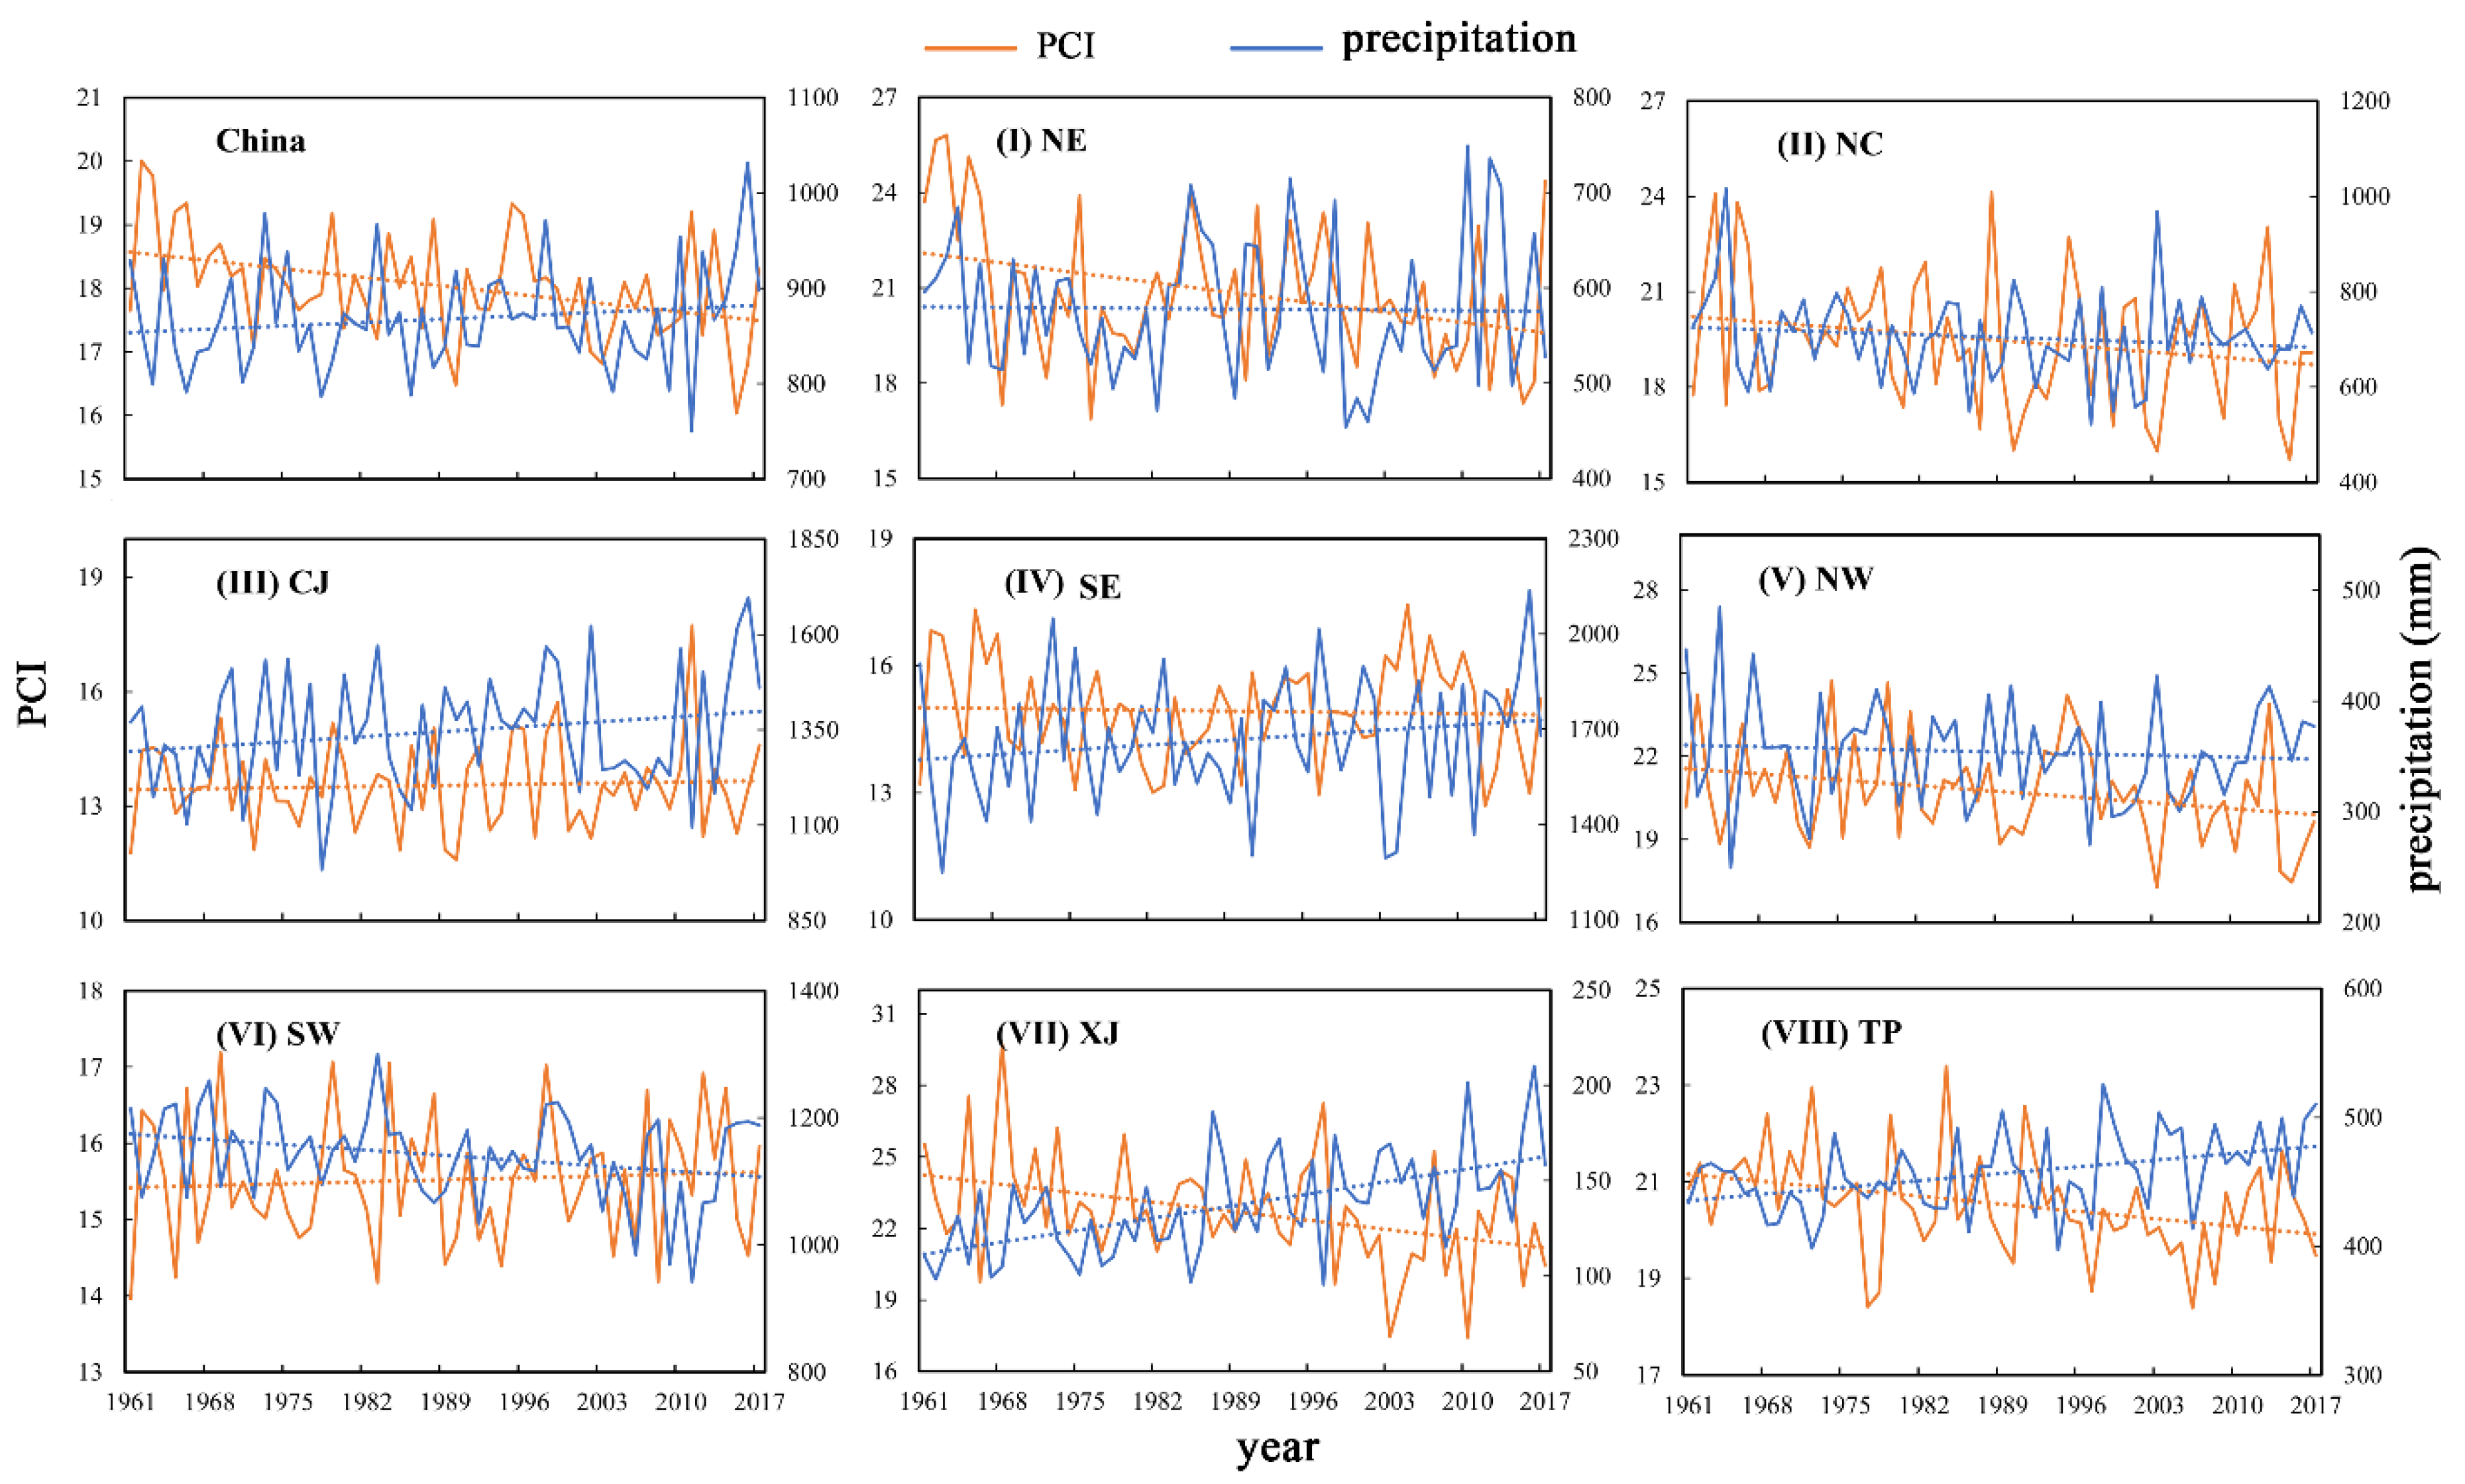
Regarding the long-term relationship between the PCI index and annual precipitation, the PCI series shows a clear decrease in most areas of northern China (NE, XJ, and TP), yet annual precipitation has increased over the past 57 years (Figure 6). This indicates that the precipitation distribution is generally uniform and that the amount of rainfall typically increases, i.e., the precipitation increases from previous rainless seasons in these regions. These characteristics could be conducive to maintaining soil moisture and crop growth in arid and semiarid areas. In NW and NC, the annual precipitation decreases slightly whereas PCI decreases remarkably, which indicates that the monthly precipitation in these regions becomes more regular. In CJ and SE, PCI increases slightly and the annual precipitation increases remarkably. If the PCI continues to rise and precipitation increases significantly, the potential for flood disasters will increase. In SW, the annual precipitation decreases significantly whereas the PCI increases slightly, and PCI exhibits a constant rise as precipitation decreases. This indicates that rainfall seasonality is enhanced in this region and is more likely to be concentrated in a few months. This could increase the difficulty of drought prevention and water resource management.
4.3. Spatiotemporal Variation Patterns of CI
The occurrence or a lack of heavy daily rainfall can change the rainfall structure of any given month, season, or year. The CI can be used to evaluate the distribution pattern of daily rainfall. The larger the CI value, the larger the contribution of heavy precipitation to total precipitation; thus, more rainfall will be concentrated in fewer days. Figure 7 shows the spatial pattern of annual CI for daily precipitation from 1961 to 2017 in China, which differs from that of PCI. The CI index ranges between 0.54 and 0.75 and decreases by almost three-tenths from the east to west, with slight variations from the south to north. The CI index is calculated using daily precipitation data, and days with low daily rainfall are more frequent in northern and western China. The majority of high CI values (generally greater than 0.66) are mainly observed in NE, NC, SW, CJ, and SE. Meanwhile, low CI values are mainly centered in TP because of the lack of rain in this region. The CI reaches a value of 0.75 in SE at Xuwen station (20°19′ N, 110°10′ E) in Guangdong province but only 0.54 in TP at Xiao Zaohuo station (36°48′ N,93°40′ E) in Qinghai province. Tong et al. [23] found similar CI values with a broad northeast to southwest gradient. In a previous study, Martin-Vide [10] concluded that a CI value of up to 0.7 indicated that more than 80% of all precipitation fell on 25% of heavy precipitation days. Thus, areas with large CI values such as SE and SW have an extremely uneven distribution of daily precipitation. A high rainfall intensity observed in some regions of China is consistent with the high recorded rainfall concentrations. Waterlogging and drought often occur in a relatively short time in these areas but not necessarily in arid and semiarid areas such as NE. Zhang et al. [49] reported that rainfall changes in China were mainly controlled by the East Asian monsoons. The East Asian summer monsoon loses much of its moisture before it reaches northwestern China; therefore, the frequency of heavy rainfall events decreases from the southeast toward the northwest throughout China. However, large CI values are detected in NE and NC, which are not the result of high torrential rainfall but due to a large amount of low rainfall events, in which more than 70% of the total precipitation falls on 25% of rainy days.
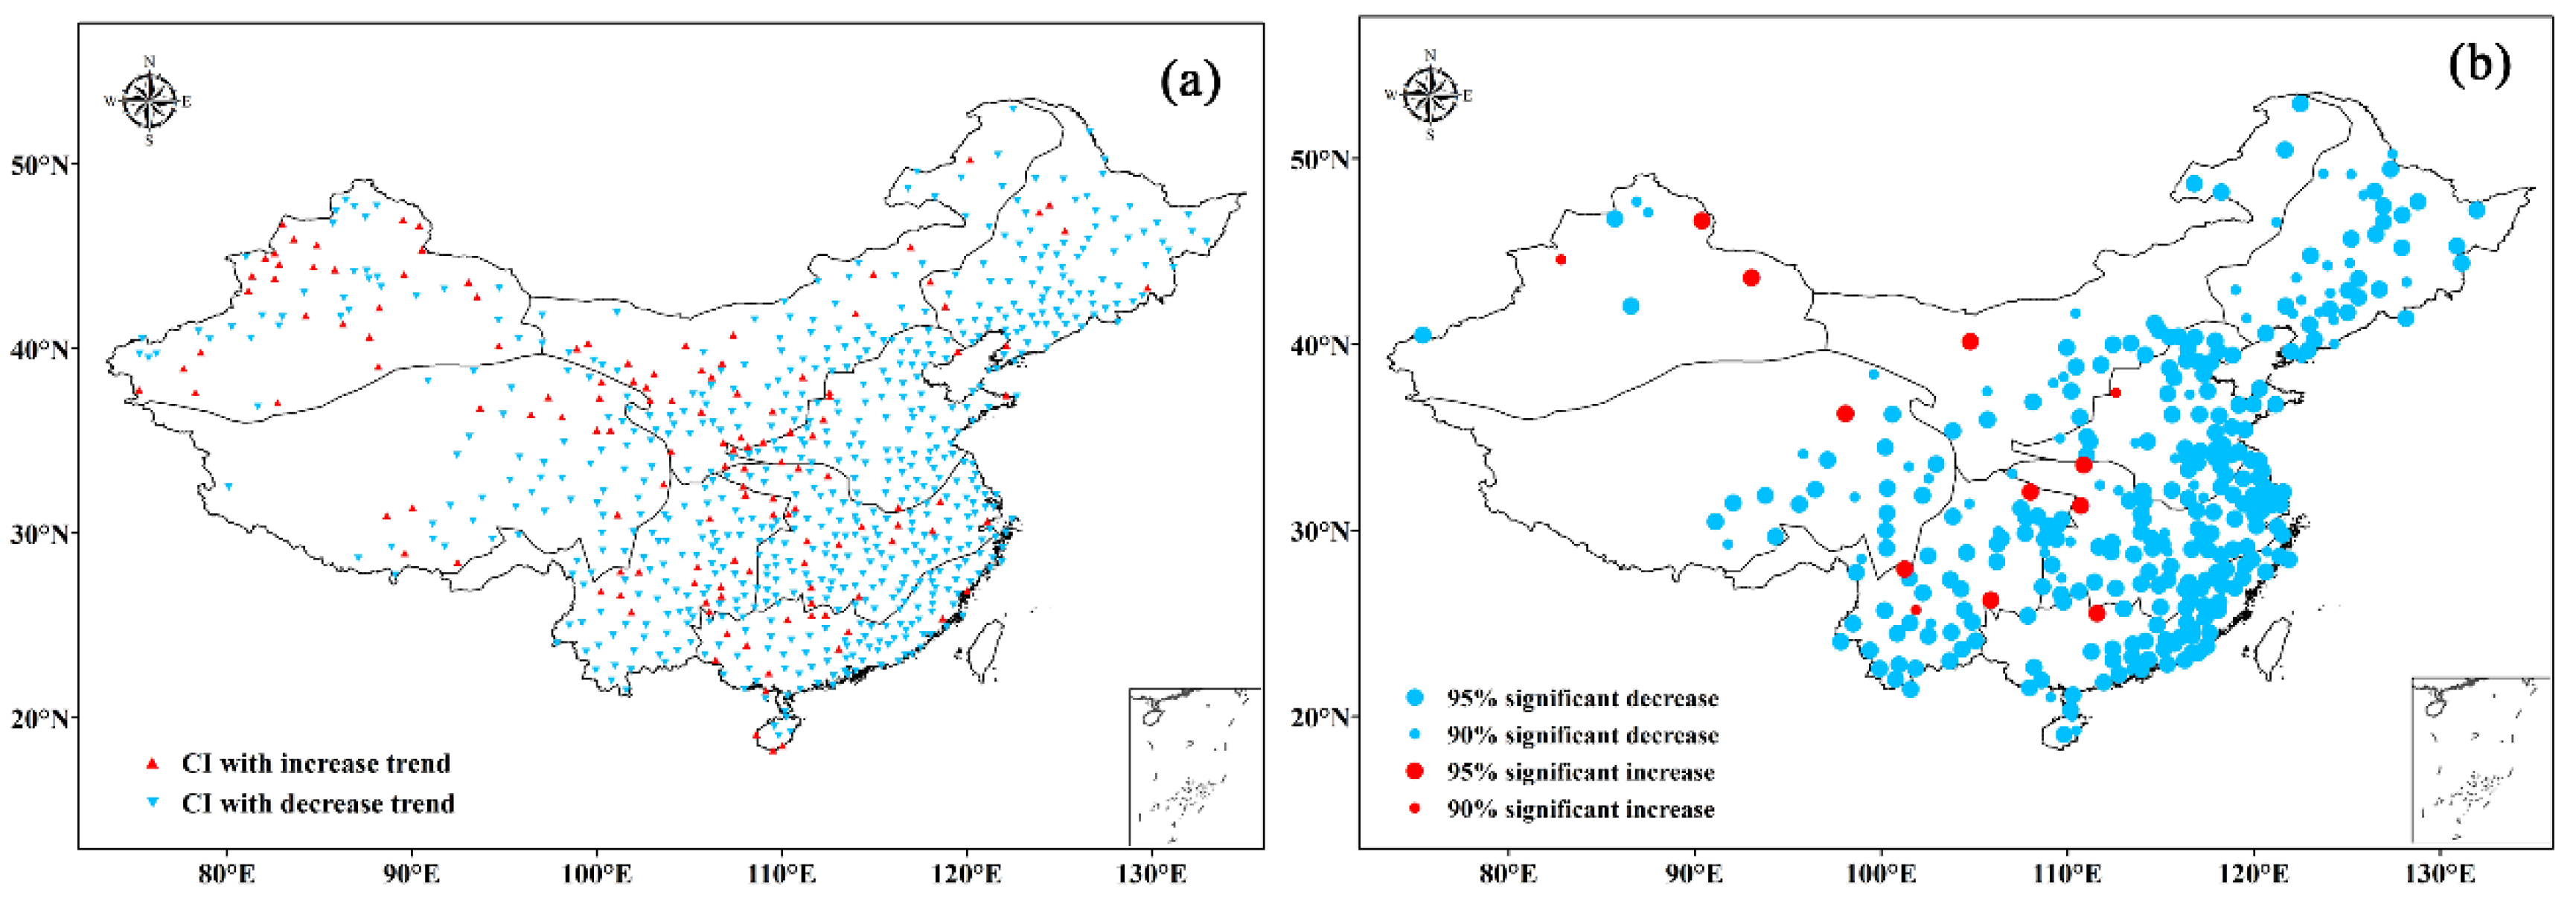
Figure 8a shows the spatial distribution of the CI series trend, which indicates a heterogeneity across China. A decreasing trend is observed throughout the entire area and, in particular, in the central and eastern parts. An increasing trend is only observed in a few regions. As shown in Figure 8b, the significant negative trends are mainly concentrated in the eastern part of NE, NC, CJ, SE, and SW. Therefore, regions with high multiyear average CI values have decreasing precipitation concentration trends, suggesting that daily precipitation is becoming more well-distributed and that the contribution of heavy rainfall events is decreasing in these regions. The statistical characteristics of significant CI series trends in Figure 8b are represented in Table 2. Table 2 reveals that more than 80% of the stations present negative trends, which are significant at 306 stations (up to 39.5%). Approximately 136 stations (up to 17.6%) show an increasing Mann–Kendall trend. However, the majority of these stations is not statistically significant at the 0.1 or 0.05 levels. Comparing the results of Table 2, some regions such as NW, SW, and XJ show remarkable increasing trends of up to 25.5%, 18.9%, and 41.8% respectively. These zones also contain more stations that are significant at the 90% or 95% confidence levels. The results show that the temporal distribution of daily precipitation in these regions is becoming more uneven.
According to the relationship between the CI index and average annual precipitation (Figure 9), the increasing rates of annual precipitation in CJ and SE are larger than those in other subregions, whereas the decreasing trend of CI values is relatively significant. This indicates that more precipitation occurs on a greater number of rainy days. Moreover, the increase in the frequency of light rainfall in these areas may be larger than that of heavy rainfall. As a result, the contribution of heavy precipitation to the annual total precipitation is relatively small, which increases the homogeneity of the rainfall distribution as the CI index decreases. In SW, both the CI and annual precipitation decrease markedly, indicating that the decrease of rainfall events is relatively large. This is consistent with the continuous occurrence of severe drought hazards in the region in 2011. The mean annual precipitation in XJ and TP is generally less than 300 mm, but precipitation increases notably in these subregions, whereas no significant variations exist in the CI index. This indicates an increasing number of wet days and a moderate rainfall distribution. In NC and NW, the annual precipitation decreases slightly, yet the CI index decreases, which indicates that the decrease of high-intensity precipitation is larger than that of light rainfall. In general, daily rainfall is more regular in western China, which may facilitate water resource management.
4.4. Comparison between PCI and CI Results in Eight Subregions
An accurate understanding and analysis of precipitation concentration provides an important reference for future research on agricultural production, the regional utilization and management of water resources, climate change, and the prevention and control of natural disasters, which have been frequent in recent years.
Due to the climate transition zone from northeast to southwest China, different climatic systems are the key mechanisms behind the different distribution patterns of precipitation concentrations observed in different subregions. Although the overall distribution of precipitation concentrations in China has an approximately uniform trend, the monthly and daily distributions of rainfall in different subregions exhibit different trends. The PCI and CI in northern subregions of China (NE, NC, NW, XJ, and TP) generally exhibit a downward trend, indicating a uniform precipitation distribution on both monthly and daily scales. However, the annual precipitation in XJ and TP increases significantly over the study period, which may be conducive to alleviating drought. However, in CJ and SE, PCI increases and CI decreases, indicating that rainfall is concentrated in a few months, yet daily rainfall during the rainy season tends to be homogeneous. Moreover, their CI values are higher, and the mean annual precipitation shows a clear increase. This indicates that a high rainfall intensity is consistent with a high rainfall concentration and that floods are more likely to occur. In SW, a significant increasing trend of PCI and an obvious decreasing trend of annual precipitation and CI indicate that drought hazards are more likely. In the future, the magnitude of extreme precipitation in China may not change significantly, but the frequency of extreme precipitation is likely to increase significantly in some regions. Overall, regional rainfall is largely influenced by topography and climatic conditions. Compared with the eastern regions, the western, northern, and central regions have more regular rainfall, whereas southern regions exhibit the most intense rainfall.
5. Conclusions
An analysis of the spatial and temporal variability of the precipitation concentration is essential due to its high impact on extreme environmental phenomena such as floods and drought. In this study, the spatial and temporal characteristics of annual rainfall, PCI, and CI were analyzed from 1961–2017 on annual, monthly, and daily scales in China and its eight subregions. The PCI and CI reflect the heterogeneity of the monthly and daily precipitation distributions throughout the year, respectively. The main findings are as follows.
The distribution of annual rainfall is heterogeneous in China. The total annual precipitation in China increased only slightly, yet that in regional differences was substantial. The annual rainfall concentration decreased significantly in the middle part of China (eastern part of NW and southern part of NE, NC, and SW), whereas a significant increasing trend was observed predominantly in CJ, SE, TP, and XJ.
The seasonality of PCI was more pronounced in CJ and SE, while the monthly distribution of precipitation in other parts of China was very uneven, with a high concentration and instability. A significant decrease of the PCI values predominantly occurred in NE, NW, TP, and XJ with increasing precipitation, which indicates that the rainfall distribution was more uniform at the monthly scale and could help alleviate drought. A slight upward trend of the PCI series in CJ and SE with an increasing precipitation could lead to an increased risk of flood disasters. A significant increase in the PCI series occurred in the SW with decreased precipitation, which would intensify droughts in the region.
The highest CI values were predominantly observed in NE, NC, SW, CJ, and SE, whereas negative trends were more common in all other subregions. These areas exhibited an uneven distribution of the daily precipitation, which is often related to heavy rainfall events that cause flooding (except for arid and semiarid areas such as NE). Both the CI and annual precipitations decreased markedly in SW, indicating substantially less regular rainfall. On the contrary, TP and XJ showed an increasing trend of wet days and a moderate rainfall distribution, which may facilitate water resource management.
Combining the analysis results of the PCI and CI indices revealed a slightly uniform overall distribution in China. Compared with the eastern regions, the western, northern, and central regions have more regular rainfall, while the southern region has the most intense rainfall.
It should be pointed out that the meteorological stations in Northwest China and Qinghai-Tibet Plateau are rare and unevenly distributed, which may lead to some uncertainties in the analysis results.
Author Contributions
Y.L., S.J., and L.R. designed the framework of this study; L.Z., R.L., and L.W. collected the data; Y.L. processed and analyzed the data and wrote the paper; S.J. and M.W. provided significant suggestions on the structure of the manuscript.
Funding
The current study was jointly supported by the National Key Research and Development Program approved by Ministry of Science and Technology, China (2018YFC0406601); the Program of Introducing Talents of Discipline to Universities by the Ministry of Education and the State Administration of Foreign Experts Affairs, China (B08048); the Fundamental Research Funds for the Central Universities (2017B10214); the National Natural Science Foundation of China (41501017, 51779070, and 51579066); and the National Key Research and Development Program approved by Ministry of Science and Technology, China (2016YFA0601504).
Conflicts of Interest
The authors declare no conflict of interest.
References
- Groisman, P.Y.; Knight, R.W.; Easterling, D.R.; Karl, T.R.; Hegerl, G.C.; Razuvaev, V.A.N. Trends in intense precipitation in the climate record. J. Clim. 2005, 18, 1326–1350. [Google Scholar] [CrossRef]
- Zhai, P.M.; Zhang, X.B.; Wan, H.; Pan, X.H. Trends in total precipitation and frequency of daily precipitation extremes over China. J. Clim. 2005, 18, 1096–1108. [Google Scholar] [CrossRef]
- Chou, C.; Lan, C.W. Changes in the Annual Range of Precipitation under Global Warming. J. Clim. 2012, 25, 222–235. [Google Scholar] [CrossRef]
- Allan, R.P.; Soden, B.J. Atmospheric warming and the amplification of precipitation extremes. Science 2008, 321, 1481–1484. [Google Scholar] [CrossRef] [PubMed]
- Shouraseni, S.R.; Balling, R.C. Evaluation of extreme precipitation indices using daily records (1910–2000) from India. Weather 2010, 64, 149–152. [Google Scholar] [CrossRef]
- Easterling, D.R.; Evans, J.L.; Groisman, P.Y.; Karl, T.R.; Ambenje, P. Observed variability and trends in extreme climate events: A brief review. Bull. Am. Meteorol. Soc. 2000, 81, 417–426. [Google Scholar] [CrossRef]
- Murray, V.; Ebi, K.L. IPCC Special Report on Managing the Risks of Extreme Events and Disasters to Advance Climate Change Adaptation (SREX). J. Epidemiol. Commun. Health 2012, 66, 759–760. [Google Scholar] [CrossRef] [PubMed]
- Donat, M.G.; Alexander, L.V.; Yang, H.; Durre, I.; Vose, R.; Dunn, R.J.H.; Willett, K.M.; Aguilar, E.; Brunet, M.; Caesar, J.; et al. Updated analyses of temperature and precipitation extreme indices since the beginning of the twentieth century: The HadEX2 dataset. J. Geophys. Res. Atmos. 2013, 118, 2098–2118. [Google Scholar] [CrossRef]
- Song, X.; Zhang, J.; Aghakouchak, A.; Roy, S.S.; Xuan, Y.; Wang, G.; Liu, C. Rapid urbanization and changes in trends and spatio-temporal characteristics of precipitation in the Beijing metropolitan area. J. Geophys. Res. Atmos. 2014, 119, 11250–11271. [Google Scholar] [CrossRef]
- Martin-Vide, J. Spatial distribution of a daily precipitation concentration index in peninsular Spain. Int. J. Climatol. 2004, 24, 959–971. [Google Scholar] [CrossRef]
- Cortesi, N.; Gonzalez-Hidalgo, J.C.; Brunetti, M.; Martin-Vide, J. Daily precipitation concentration across Europe 1971–2010. Nat. Hazards Earth Syst. Sci. 2012, 12, 2799–2810. [Google Scholar] [CrossRef]
- Oliver, J.E. Monthly Precipitation Distribution—A Comparative Index. Prof. Geogr. 1980, 32, 300–309. [Google Scholar] [CrossRef]
- De Luis, M.; Gonzalez-Hidalgo, J.C.; Brunetti, M.; Longares, L.A. Precipitation concentration changes in Spain 1946-2005. Nat. Hazards Earth Syst. Sci. 2011, 11, 1259–1265. [Google Scholar] [CrossRef]
- Duan, Y.W.; Zhu, K.Y.; Ma, Z.G.; Yang, Q. Characteristics of precipitation concentration index (PCI) variations and monthly distribution of annual precipitation in China. Chi. J. Atmos. Sci. 2014, 38, 1124–1136. (In Chinese) [Google Scholar] [CrossRef]
- Cannarozzo, M.; Noto, L.V.; Viola, F. Spatial distribution of rainfall trends in Sicily (1921–2000). Phys. Chem. Earth 2006, 31, 1201–1211. [Google Scholar] [CrossRef]
- Li, X.M.; Jiang, F.Q.; Li, L.H.; Wang, G.Q. Spatial and temporal variability of precipitation concentration index, concentration degree and concentration period in Xinjiang, China. Int. J. Climatol. 2011, 31, 1679–1693. [Google Scholar] [CrossRef]
- Zhang, Y.W.; Wang, W.W. Trends in Total Precipitation and Frequency of Daily Precipitation Extremes. In Proceedings of the 6th International Conference on Energy, Environment and Sustainable Development (Iceesd 2017), Guangdong, China, 14–15 October 2017; pp. 576–580. [Google Scholar]
- Gu, C.J.; Mu, X.M.; Zhao, G.J.; Gao, P.; Sun, W.Y.; Yu, Q. Changes in Stream Flow and Their Relationships with Climatic Variations and Anthropogenic Activities in the Poyang Lake Basin, China. Water 2016, 8, 564. [Google Scholar] [CrossRef]
- Miao, C.Y.; Hamed, A.; Kuo-Lin, H.; Soroosh, S.; Duan, Q.Y. Evaluation of the PERSIANN-CDR daily rainfall estimates in capturing the behavior of extreme precipitation events over China. J. Hydrol. 2015, 16, 1387–1396. [Google Scholar] [CrossRef]
- Li, Z.; Zheng, F.; Liu, W.; Flanagan, D.C. Spatial distribution and temporal trends of extreme temperature and precipitation events on the loess plateau of china during 1961–2007. Quat. Int. 2010, 226, 92–100. [Google Scholar] [CrossRef]
- Zhang, H.; Zhai, P. Temporal and spatial characteristics of extreme hourly precipitation over eastern china in the warm season. Adv. Atmos. Sci. 2011, 28, 1177. [Google Scholar] [CrossRef]
- Huang, J.; Liu, F.L.; Xue, Y.; Sun, S.L. The spatial and temporal analysis of precipitation concentration and dry spell in Qinghai, northwest China. Stoch. Environ. Res. Risk Assess. 2015, 29, 1403–1411. [Google Scholar] [CrossRef]
- Tong, X.H.; Liu, X.P.; Jia, Q.Y. Spatial and temporal variability of daily precipitation concentration in China during 1960−2011. Clim. Environ. Res. 2017, 22, 301–314. (In Chinese) [Google Scholar] [CrossRef]
- Chen, S.; Hong, Y.; Cao, Q.; Gourley, J.J.; Kirstetter, P.E.; Yong, B. Similarity and difference of the two successive v6 and v7 trmm multisatellite precipitation analysis performance over china. J. Geophys. Res. Atmos. 2013, 118, 13060–13074. [Google Scholar] [CrossRef]
- Qian, W.; Lin, X. Regional trends in recent precipitation indices in China. Meteorol. Atmos. Phys. 2005, 90, 193. [Google Scholar] [CrossRef]
- Tang, Z.; Wang, Z.; Zheng, C.; Fang, J. Biodiversity in China’s mountains. Front. Ecol. Environ. 2006, 4, 347–352. [Google Scholar] [CrossRef]
- De Luis, M.; Garcia-Cano, M.P.; Cortina, J.; Raventos, J.; Gonzalez-Hidalgo, J.C.; Sanchez, J.R. Climatic trends, disturbances and short-term vegetation dynamics in a Mediterranean shrubland. For. Ecol. Manag. 2001, 147, 25–37. [Google Scholar] [CrossRef]
- Brooks, C.E.P.; Carruthers, N. Handbook of statistical methods in meteorology. GeoRev 1953, 44, 617. [Google Scholar] [CrossRef]
- Jolliffe, I.T.; Hope, P.B. Representation of daily rainfall distributions using normalized rainfall curves. Int. J. Climatol. 1996, 16, 1157–1163. [Google Scholar] [CrossRef]
- Coscarelli, R.; Caloiero, T. Analysis of daily and monthly rainfall concentration in Southern Italy (Calabria region). J. Hydrol. 2012, 416, 145–156. [Google Scholar] [CrossRef]
- Zubieta, R.; Saavedra, M.; Silva, Y.; Giraldez, L. Spatial analysis and temporal trends of daily precipitation concentration in the Mantaro River basin: Central Andes of Peru. Stoch. Environ. Res. Risk Assess. 2017, 31, 1305–1318. [Google Scholar] [CrossRef]
- Vélez, A.; Martin-Vide, J.; Royé, D.; Santaella, O.J.T.; Climatology, A. Spatial analysis of daily precipitation concentration in Puerto Rico. Theor. Appl. Climatol. 2018, 6, 1–9. [Google Scholar] [CrossRef]
- Chen, W.; Chen, C.; Li, L.; Xing, L.; Huang, G.; Wu, C. Spatiotemporal Analysis of Extreme Hourly Precipitation Patterns in Hainan Island, South China. Water 2015, 7, 2239–2253. [Google Scholar] [CrossRef]
- Marzano, F.S.; Cimini, D.; Montopoli, M. Investigating precipitation microphysics using ground-based microwave remote sensors and disdrometer data. Atmos. Res. 2010, 97, 583–600. [Google Scholar] [CrossRef]
- Dogan, M.; Ulke, A.; Cigizoglu, H.K. Trend direction changes of Turkish temperature series in the first half of 1990s. Theor. Appl. Climatol. 2015, 121, 23–39. [Google Scholar] [CrossRef]
- Zhang, Q.; Liu, C.L.; Xu, C.Y.; Xu, Y.P.; Jiang, T. Observed trends of annual maximum water level and streamflow during past 130 years in the Yangtze River basin, China. J. Hydrol. 2006, 324, 255–265. [Google Scholar] [CrossRef]
- Ozgenc Aksoy, A.J.T.; Climatology, A. Investigation of sea level trends and the effect of the north atlantic oscillation (NAO) on the black sea and the eastern mediterranean sea. Theor. Appl. Climatol. 2017, 129, 129–137. [Google Scholar] [CrossRef]
- Song, X.Y.; Song, S.B.; Sun, W.Y.; Mu, X.M.; Wang, S.Y.; Li, J.Y.; Li, Y. Recent changes in extreme precipitation and drought over the Songhua River Basin, China, during 1960–2013. Atmos. Res. 2015, 157, 137–152. [Google Scholar] [CrossRef]
- Yavuz, H.; Erdogan, S. Spatial Analysis of Monthly and Annual Precipitation Trends in Turkey. Water Resour. Manag. 2012, 26, 609–621. [Google Scholar] [CrossRef]
- Becker, S.; Gemmer, M.; Jiang, T. Spatiotemporal analysis of precipitation trends in the Yangtze River catchment. Stoch. Environ. Res. Risk Assess. 2006, 20, 435–444. [Google Scholar] [CrossRef]
- Chattopadhyay, G.; Chakraborthy, P.; Chattopadhyay, S. Mann–Kendall trend analysis of tropospheric ozone and its modeling using ARIMA. Theor. Appl. Climatol. 2012, 110, 321–328. [Google Scholar] [CrossRef]
- Gemmer, M.; Becker, S.; Jiang, T. Observed monthly precipitation trends in China 1951-2002. Theor. Appl. Climatol. 2004, 77, 39–45. [Google Scholar] [CrossRef]
- Mohsin, T.; Gough, W.A. Trend analysis of long-term temperature time series in the Greater Toronto Area (GTA). Theor. Appl. Climatol. 2010, 101, 311–327. [Google Scholar] [CrossRef]
- Jiang, S.H.; Ren, L.L.; Xu, C.Y.; Yong, B.; Liu, Y.; Yang, X.; Zeng, X. Statistical and Hydrological Evaluation of the Latest Integrated Multi-satellitE Retrievals for GPM (IMERG) over a Midlatitude Humid Basin in South China. Atmos. Res. 2018, 214, 418–429. [Google Scholar] [CrossRef]
- Xu, Z.X.; Gong, T.L.; Li, J.Y. Decadal trend of climate in the Tibetan Plateau—Regional temperature and precipitation. Hydrol. Process. 2008, 22, 3056–3065. [Google Scholar] [CrossRef]
- Ren, G.Y.; Feng, G.L.; Yan, Z.W. Progresses in observation studies of climate extremes and changes in mainland China. Clim. Environ. Res. 2010, 15, 337–353. (In Chinese) [Google Scholar] [CrossRef]
- Xiao, M.Z.; Zhang, Q.; Singh, V.P.; Chen, X.H. Regionalization-based spatiotemporal variations of precipitation regimes across China. Theor. Appl. Climatol. 2013, 114, 203–212. [Google Scholar] [CrossRef]
- Jiang, S.H.; Liu, S.Y.; Ren, L.L.; Yong, B.; Zhang, L.; Wang, M.; Lu, Y.; He, Y. Hydrologic Evaluation of Six High Resolution Satellite Precipitation Products in Capturing Extreme Precipitation and Streamflow over a Medium-Sized Basin in China. Water 2018, 10, 25. [Google Scholar] [CrossRef]
- Zhang, Q.; Xu, C.Y.; Zhang, Z.X.; Chen, Y.D. Changes of temperature extremes for 1960–2004 in Far-West China. Stoch. Environ. Res. Risk Assess. 2009, 23, 721–735. [Google Scholar] [CrossRef]
Figure 1.
(a) The locations of the 774 rain gauge stations plotted on a digital elevation model of China showing different subareas: (I) Northeast China (NE), (II) Northern China (NC), (III) the middle and lower reaches of the Yangtze River region (CJ), (IV) South China (SC), (V) Northwest China (NW), (VI) Southwest China (SW), (VII) Xinjiang, and (VIII) the Tibetan Plateau (TP). (b) The spatial distribution of the mean annual precipitation across China.

Figure 2.
Empirical values based on the precipitation from 1961–2012 and Lorenz curves given by Equation (1) for the three grid cells: (a) Qinghai, (b) Nanjing, and (c) Shenzhen.
Figure 2.
Empirical values based on the precipitation from 1961–2012 and Lorenz curves given by Equation (1) for the three grid cells: (a) Qinghai, (b) Nanjing, and (c) Shenzhen.

Figure 3.
The spatial distribution of rainfall stations displaying negative or positive annual rainfall trends across China. (a) The overall station trends (The blue downward triangles denote decreasing trends; the red upward triangles denote increasing trends) and (b) the stations exhibiting statistically significant trends (The blue circles denote decreasing trends, the red circles denote increasing trends, the bigger circles show trends exhibiting a 95% significance level detected by the Mann–Kendall test; and the smaller circles show trends exhibiting a 90% significance level detected by the Mann–Kendall test).

Figure 4.
The spatial distribution of the mean annual precipitation concentration index (PCI) across China.
Figure 4.
The spatial distribution of the mean annual precipitation concentration index (PCI) across China.

Figure 5.
The spatial distribution of rainfall stations displaying negative or positive PCI trends across China. (a) The overall station trends (The blue downward triangles denote decreasing trends; the red upward triangles denote increasing trends) and (b) the stations exhibiting statistically significant trends (The blue circles denote decreasing trends, the red circles denote increasing trends, the bigger circles show trends exhibiting a 95% significance level detected by the MK test, and the smaller circles show trends exhibiting a 90% significance level detected by the MK test).

Figure 6.
Time series of the annual precipitation (the blue solid line) and PCI (the orange solid line) for the eight subregions in China: The dashed lines show the corresponding linear trend.
Figure 6.
Time series of the annual precipitation (the blue solid line) and PCI (the orange solid line) for the eight subregions in China: The dashed lines show the corresponding linear trend.

Figure 7.
The spatial distribution of the mean annual concentration index (CI) across China.

Figure 8.
The spatial distribution of the stations displaying negative or positive CI trends across China. (a) The overall station trends (The blue downward triangles denote decreasing trends; the red upward triangles denote increasing trends) and (b) the stations exhibiting statistically significant trends (The blue circles denote decreasing trends, the red circles denote increasing trends, the bigger circles show trends exhibiting a 95% significance level detected by the MK test, and the smaller circles show trends exhibiting a 90% significance level detected by the MK test).

Figure 9.
Time series of the annual precipitation (the blue solid line) and CI (the orange solid line) for eight subregions in China. The dashed lines are the corresponding linear trend.
Figure 9.
Time series of the annual precipitation (the blue solid line) and CI (the orange solid line) for eight subregions in China. The dashed lines are the corresponding linear trend.


Table 1.
PCI trends obtained by the Mann–Kendall for all subregions in China.
| Zone | Negative | Negative Significant (90%) | Negative Significant (95%) | Positive | Positive Significant (90%) | Positive Significant (95%) |
|---|---|---|---|---|---|---|
| NE | 96 (95.0%) | 34 (33.7%) | 26 (25.7%) | 5 (5.0%) | 0 (0%) | 0 (0%) |
| NC | 60 (64.5%) | 18 (19.4%) | 14 (15.1%) | 33 (35.5%) | 1 (1.1%) | 1 (1.1%) |
| CJ | 65 (49.2%) | 2 (1.5%) | 0 (0%) | 67 (50.8%) | 5 (3.8%) | 4 (3.0%) |
| SE | 63 (60.6%) | 4 (3.8%) | 2 (1.9%) | 39 (37.5%) | 4 (3.8%) | 0 (0%) |
| NW | 78 (73.6%) | 26 (24.5%) | 19 (17.9%) | 28 (26.4%) | 0 (0%) | 0 (0%) |
| SW | 45 (47.4%) | 4 (4.2%) | 3 (3.2%) | 50 (52.6%) | 7 (7.4%) | 4 (4.2%) |
| XJ | 58 (86.6%) | 19 (28.4%) | 15 (22.4%) | 9 (13.4%) | 0 (0%) | 0 (0%) |
| TP | 53 (81.5%) | 19 (29.2%) | 13 (20.0%) | 11 (16.9%) | 1 (1.5%) | 1 (1.5%) |
| China | 525 (67.8%) | 127 (16.4%) | 93 (12.0%) | 245 (31.7%) | 19 (2.6%) | 10 (1.4%) |
Table 2.
CI trends obtained by the Mann–Kendall for all subregions in China.
| Zone | Negative | Negative Significant (90%) | Negative Significant (95%) | Positive | Positive Significant (90%) | Positive Significant (95%) |
|---|---|---|---|---|---|---|
| NE | 93 (92.1%) | 42 (41.6%) | 26 (25.7%) | 7 (6.9%) | 0 (0%) | 0 (0%) |
| NC | 83 (89.2%) | 50 (53.8%) | 44 (47.3%) | 10 (10.8%) | 1 (1.1%) | 0 (0%) |
| CJ | 114 (86.4%) | 65 (57.0%) | 57 (50.0%) | 17 (14.9%) | 2 (1.8%) | 2 (1.8%) |
| SE | 89 (85.6%) | 56 (53.8%) | 51 (49.0%) | 15 (14.4%) | 2 (1.9%) | 2 (1.9%) |
| NW | 79 (74.5%) | 23 (21.7%) | 18 (17.0%) | 27 (25.5%) | 2 (1.9%) | 2 (1.9%) |
| SW | 77 (81.1%) | 41 (43.2%) | 37 (38.9%) | 18 (18.9%) | 4 (4.2%) | 3 (3.2%) |
| XJ | 34 (50.7%) | 5 (7.5%) | 3 (4.5%) | 28 (41.8%) | 5 (7.5%) | 4 (6.0%) |
| TP | 50 (76.9%) | 21 (32.3%) | 15 (23.1%) | 14 (21.5%) | 1 (1.5%) | 1 (1.5%) |
| China | 630 (81.4%) | 306 (39.5%) | 253 (32.7%) | 136 (17.6%) | 13 (1.7%) | 10 (1.4%) |
© 2019 by the authors. Licensee MDPI, Basel, Switzerland. This article is an open access article distributed under the terms and conditions of the Creative Commons Attribution (CC BY) license (http://creativecommons.org/licenses/by/4.0/).
Share and Cite
MDPI and ACS Style
Lu, Y.; Jiang, S.; Ren, L.; Zhang, L.; Wang, M.; Liu, R.; Wei, L. Spatial and Temporal Variability in Precipitation Concentration over Mainland China, 1961–2017. Water 2019, 11, 881. https://doi.org/10.3390/w11050881
AMA Style
Lu Y, Jiang S, Ren L, Zhang L, Wang M, Liu R, Wei L. Spatial and Temporal Variability in Precipitation Concentration over Mainland China, 1961–2017. Water. 2019; 11(5):881. https://doi.org/10.3390/w11050881
Chicago/Turabian StyleLu, Yujie, Shanhu Jiang, Liliang Ren, Linqi Zhang, Menghao Wang, Ruolan Liu, and Linyong Wei. 2019. "Spatial and Temporal Variability in Precipitation Concentration over Mainland China, 1961–2017" Water 11, no. 5: 881. https://doi.org/10.3390/w11050881
Note that from the first issue of 2016, this journal uses article numbers instead of page numbers. See further details here.