Application of the Mathematical Simulation Methods for the Assessment of the Wastewater Treatment Plant Operation Work Reliability


1
Department of Sanitary Engineering and Water Management, University of Agriculture in Krakow, Mickiewicza 24–28 Street, 30-059 Krakow, Poland
2
Department of Water Supply, Sewerage and Environmental Monitoring, Cracow University of Technology, Warszawska 24 Street, 31-155 Krakow, Poland
*
Author to whom correspondence should be addressed.
Water 2019, 11(5), 873; https://doi.org/10.3390/w11050873
Submission received: 29 March 2019
/
Revised: 17 April 2019
/
Accepted: 23 April 2019
/
Published: 26 April 2019
(This article belongs to the Special Issue Advances in Water and Wastewater Monitoring and Treatment Technology)
Abstract
:The aim of the present work was the modeling of the wastewater treatment plant operation work using Monte Carlo method and different random variables probability distributions modeling. The analysis includes the following pollutants indicators; BOD5 (Biochemical Oxygen Demand), CODCr (Chemical Oxygen Demand), Total Suspended Solids (SSt), Total Nitrogen (TN), and Total Phosphorus (TP). The Anderson–Darling (A–D) test was used for the assessment of theoretical and empirical distributions compatibility. The selection of the best-fitting statistical distributions was performed using peak-weighted root mean square (PWRMSE) parameter. Based on the performed calculations, it was stated that pollutants indicators in treated sewage were characterized by a significant variability. Obtained results indicate that the best-fitting pollutants indicators statistical distribution is Gauss Mixed Model (GMM) function. The results of the Monte Carlo simulation method confirmed that some problems related to the organic and biogenic pollutants reduction may be observed in the Wastewater Treatment Plant, in Jaworzno.
1. Introduction
The dynamic development of water supply and sewage systems that has been observed in Poland for many years contributes to the discharge of a large amount of sewage. The sewage is defined as the community’s spent water. Although it mainly consists of pure water (over 98%), it contains waste of almost every form and description, with the remainder being dirt. Approximately 25% of the pollutants in normal domestic sewage are in suspension and 75% in solution. Sewage contains many complex organic and mineral compounds. The organic portion of sewage is biochemically degradable and, as such, is responsible for the offensive characteristics usually associated with sewage. Furthermore, sewage contains large numbers of microorganisms, most of which are bacteria [1]. Before the discharging of treated sewage into the natural sewage receivers, there is a necessity for reach the required level of sewage treatment, because of the natural environment [2,3,4]. Because of this, it is important to make a general assessment each of the wastewater treatment plant, both in terms of the effectiveness of pollutants reduction and the reliability of the operation work of wastewater treatment plant facilities. Extensive analysis of the research results allows for predict the improprieties and for its elimination in the future. This is a significant point for attaining effective surface water protection against pollution [5].
Surface waters are very important source of water for large urban agglomerations. Continuous urban agglomerations development leads to an increase in human impact on the aquatic environment. Pollutants in rivers, lakes, and coastal waters pose a significant threat to the water reservoirs users, because of discharging the sewage after treatment processes into the natural environment. In extreme cases, pollutants that are introduced with sewage into the water can lead to the extinction all of the biological life forms in water and for purging the sewage natural receiver, e.g., surface water or ground water that have self-cleaning skills [6,7,8]. In recent decades, some problems related to the deficiency of required quality water have intensified. Rapid urbanization and the increase in the number of residents contributed to the surface water quality deterioration. In addition, due to the still growing water demand and its limited amount, there is a necessity for water recover through the wastewater treatment plant processes [9,10,11].
In order to achieve the required level of pollutants indicators in treated sewage, it is necessary to control the operational work of the particular wastewater treatment plant facilities. It is connected with the permanent or periodic complex control of the sewage treatment processes. The aim of control of the wastewater treatment plant facilities is due to the necessity of its maintaining in permanent readiness to the proper work, which provides the required treated sewage quality at the outflow. The growth of the wastewater treatment plant technological reliability, affects the quick detection of devices failures and measuring apparatus failures. In addition, a technological control including daily observations of the treated sewage quality and quantity, the condition of activated sludge and other parameters, affects the sewage treatment process effects in a special way.
Generally, the assessment of the operation work of the wastewater treatment plant is performed based on some pollutants indicator concentrations in treated sewage, which are compared with legally required pollutants indicators values. These limitation values are determined by the obligatory legal acts, such as the water and legal permission acts, and other regulations concerning the quality of treated sewage. However, the method of assessing the operation work of the wastewater treatment plant that is presented above is a bit simplified. This is because of the basis only on the empirical sample of the analyzed random variables. The reliability of the wastewater treatment plant is mainly considered as the percentage share of time, during which the expected treated sewage content meets the requirements [12]. A variability of the pollutants indicators values in sewage should be considered as a function of the probability distribution that determines the physicochemical parameters of treated sewage content. Thus, the mathematical simulations for the wastewater treatment plant operation work should be conducted. It allows for make more reliable assessment of the operation work of the wastewater treatment plant in comparison to the usually used methods that are based on short observations series for pollutants indicators. It should be noted that the using of a mathematical simulations for the optimization of sewage treatment processes is justified. Mathematical simulations give the possibility for elaboration the dynamic mathematical models of sewage treatment processes. Mathematical models allow making a decision about the changes in the sewage treatment processes. An additional advantage of using a mathematical models is the possibility of considering the variability of inflowing sewage quality (parameters). The wastewater treatment plant operator makes an assessment of the wastewater treatment plant operation work only based on the analysis of the pollutants indicators in treated sewage. Sometimes, the values of pollutants indicators in sewage at the inflow and sewage at the outflow from the wastewater treatment plant are compared with each other. Based on this comparison, it is possible to determine the reliability of the wastewater treatment plant operation work that is expressed by the reduction degree (%). Based on the conducted simulations, wastewater treatment plant operator is able to estimate the risk, i.e., the probability of occurrence in the future pollutants indicators values greater than its permissible limits. Thus, the higher risk value, the greater the need for the modernization or extension of the wastewater treatment plant facilities. A prediction of such values is even more important, because currently observed climate changes, demographic changes, and water consumption changes can affect significantly the changes of the wastewater treatment plant load, both in terms of the sewage volume (hydraulic load) and pollution sewage load. Finally, it can affect the treated sewage quality. Because of this, a prediction seems to be very important [13]. Simulation issues of technological processes of sewage treatment are often considered research problems, both during designing process of the wastewater treatment plant facilities, its modernization, and exploitation too. Because the operation work of the wastewater treatment plant is basis on the complexity technology processes, many different models for describing its operation work may be found. Modeling of the wastewater treatment plant operation work can be performed by using Artificial Neural Networks (ANN), where the number of input variables can be separated by cluster analysis or by principal component analysis [14,15,16]. Moreover, Activated Sludge Simulation Models (ASIM) are widely discussed in literature, e.g., Snip et al. [17], Wu et al. [18], Machado et al. [19], Alikhani et al. [20], Guo and Vanrolleghem [21]. Modeling of the wastewater treatment plant operation work can be conducted using particular types of probability distributions. Bugajski et al. [22], Marzec [23], and Jóźwiakowski et al. [24] considered the possibility of using Weibull distribution for modeling the wastewater treatment plant operation work reliability.
The analysis of the operation work of the wastewater treatment plant using the probability distributions allows the description of the analyzed phenomena in a wider range. An important point of the presented method is the possibility of modeling complicated dependences between the considered variables and forecasting the pollutants indicators values in some period of time. Results obtained in this way may be helpful for the assessment of the risk of improper operation work of the wastewater treatment plant. However, it should be stressed that some assumptions about the unique form of pollutants indicators distribution may be incorrect. Thus, the stability of mechanisms having an impact on pollutants indicators reduction is suggested. In reality, there are many proposals basis on the same empirical sample. Because of this, for each empirical distribution of random variables, the best-fitting theoretical distribution should be determined. One of the methods used for selection of the best-fitting theoretical distribution is the Akaike (AIC), or Schwartz (BIC), information criteria [25]. Alternative statistical tests also could be used for the assessment of theoretical distributions performance. One of them is an Anderson–Darling (A–D) test that compares the whole range, but it gives more weight to the upper tail [26]. The main disadvantage of these goodness-of-fit metrics is that they not provide any information about the precision limit and the inclusion of untypical (outlying) values. Moreover, it is not possible to assess the values of test statistics. But on the other hand, some methods that are commonly used for the assessing of rainfall–runoff hydrological models, such as percentage error in peak flow, percentage error in volume, efficiency coefficient, peak-weighted root mean square error, sum of absolute residuals, or sum of squared residuals, should be considered. Also, for the verification of the best-fitting probability distributions, the other criterions, such as the Akaike criterion (AIC) or Bayesian information criterion (BIC), can be used. However these criterions also have some limitations, e.g., the necessity for the estimation of distributions parameters using only maximum likelihood method.
Based on the some information presented above, the aim of the study was determined. In this study, simulation of the wastewater treatment plant operation work using selected statistical distributions was performed. It will allow the determination of the wastewater treatment plant reliability coefficients, not only in the range of the empirical sample, but also based on the forecasting the values of pollutants indicators. The novelty of this study is the identification of the best-fitting theoretical function by adopting Peak-Weighted Root Mean Square Error (PWRMSE), which is commonly used for calibrating the parameters in hydrological models. Finally, the performed analysis aimed to determine the wastewater treatment plant operation work reliability coefficients.
2. Research Object
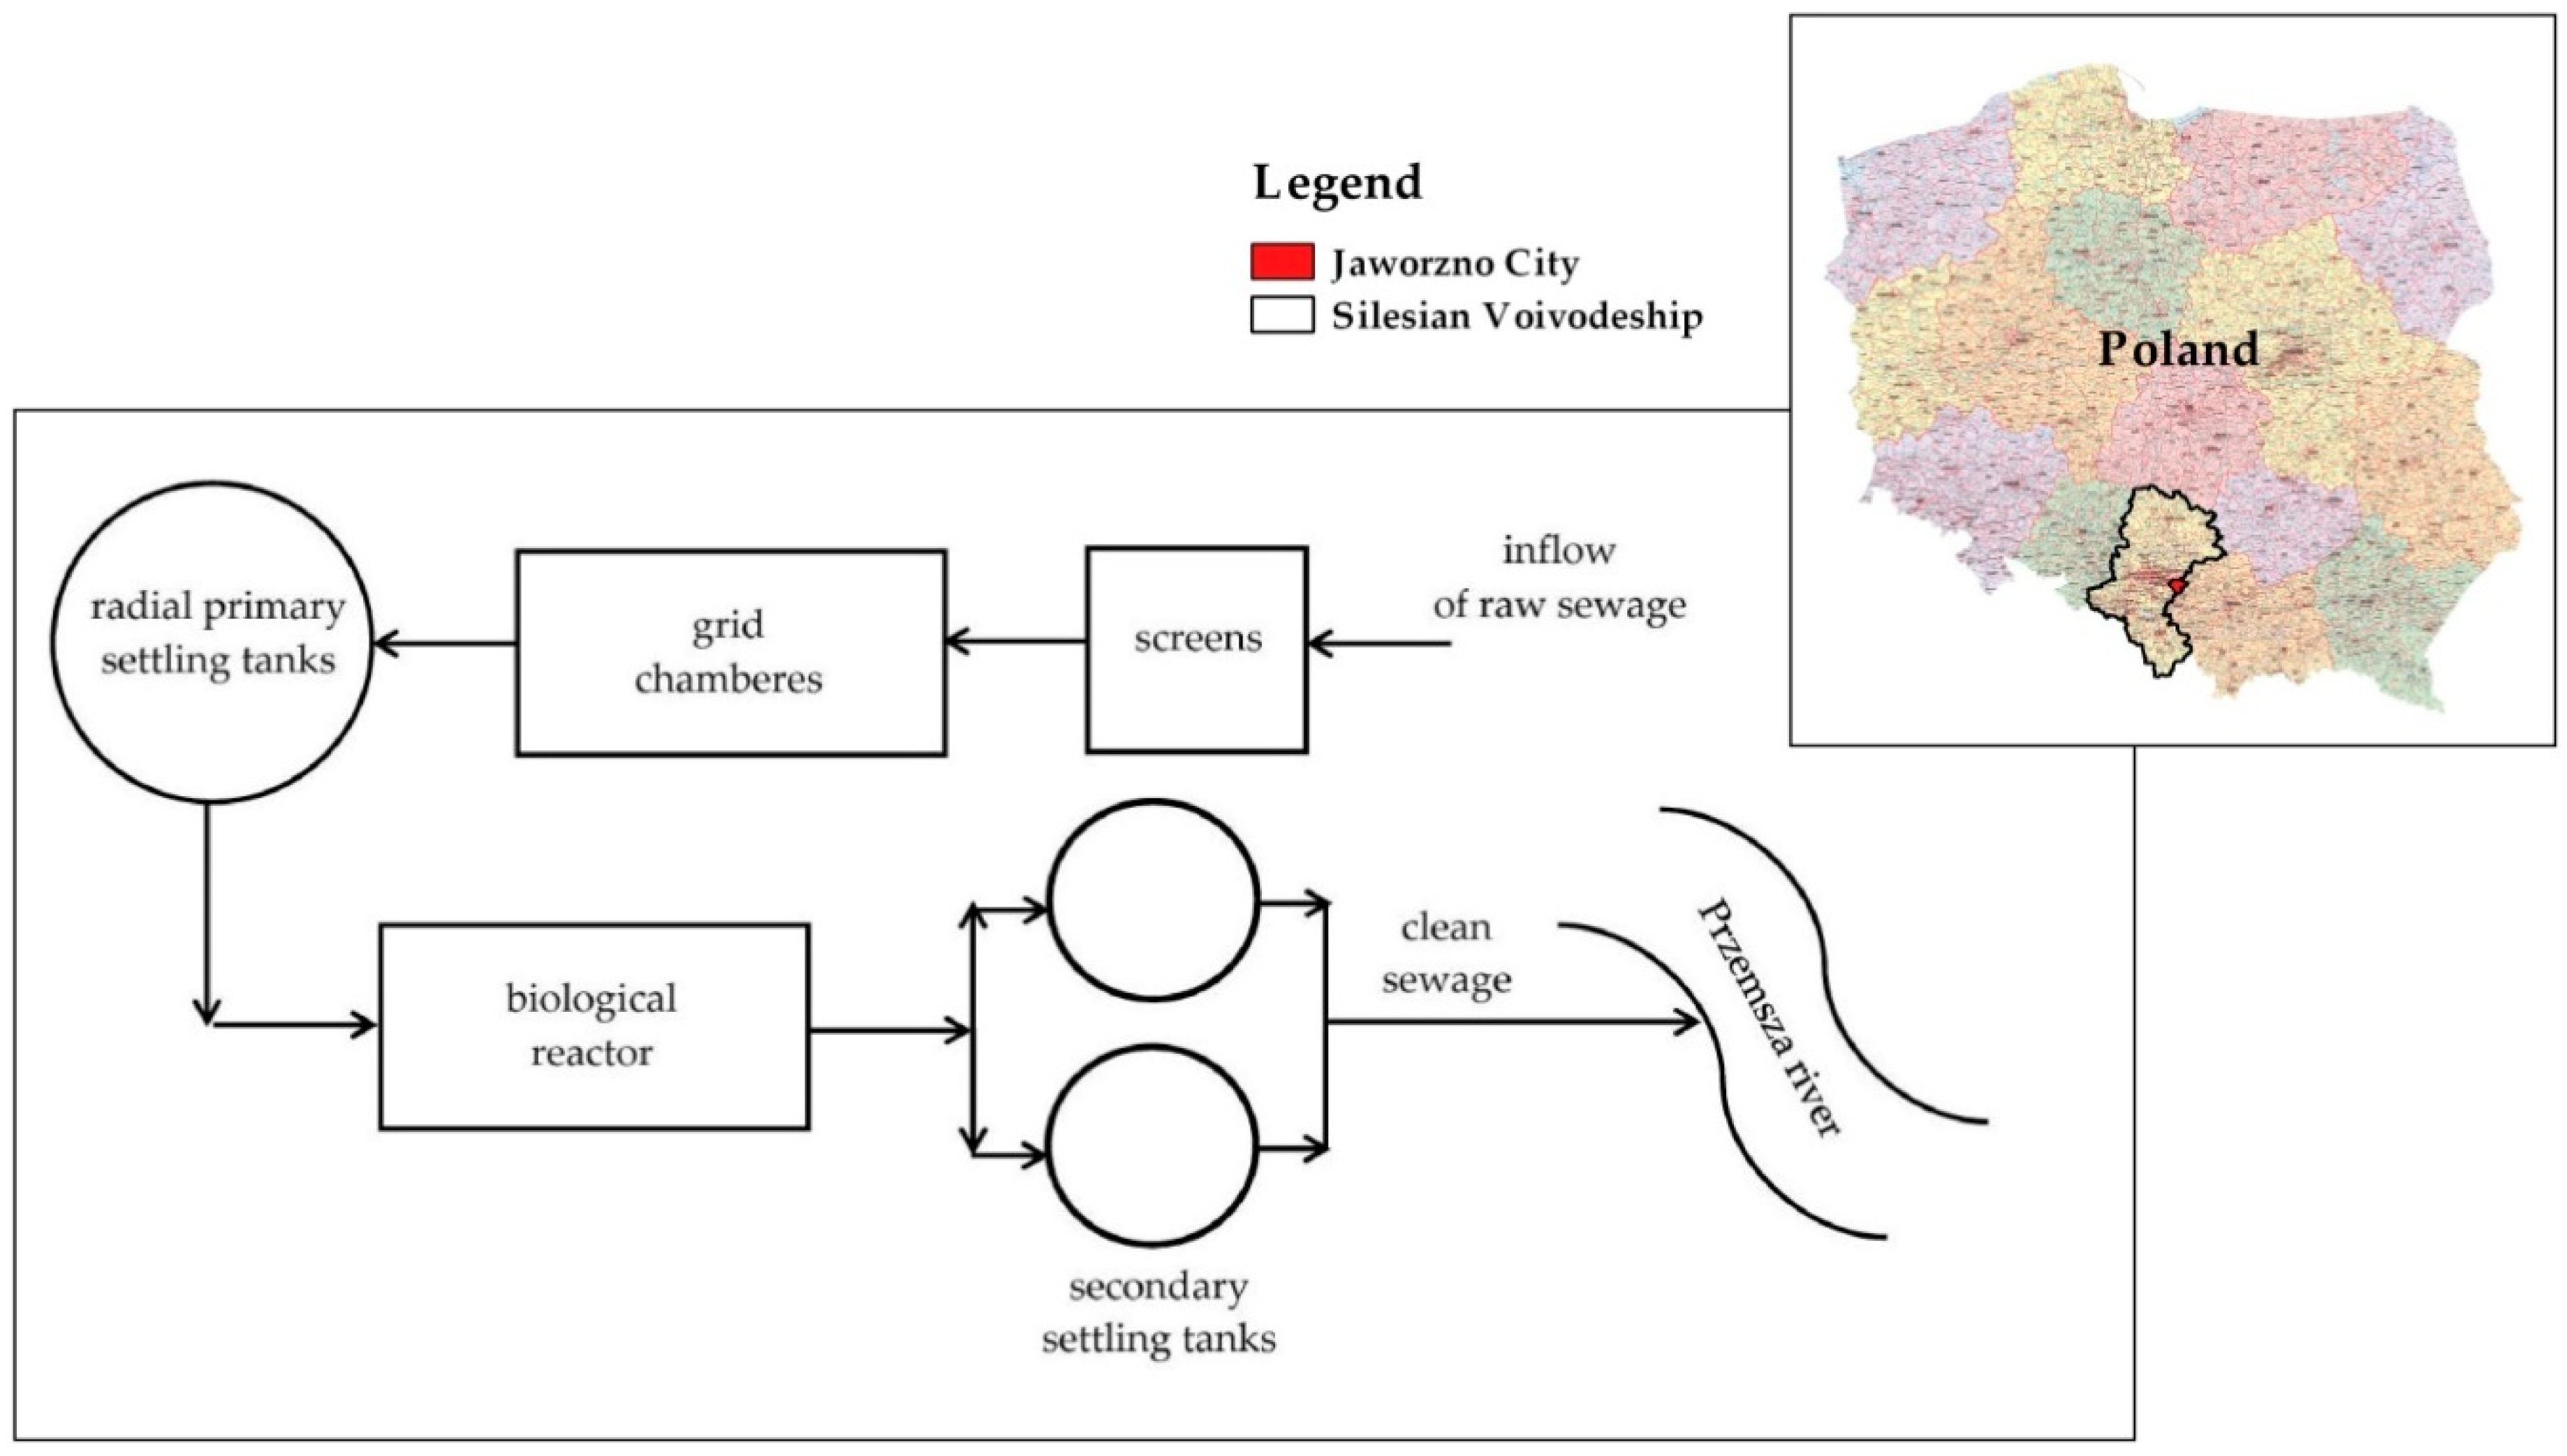
The wastewater treatment plant that is considered in this study is located in Jaworzno, Silesian Voivodeship, Poland. The Wastewater treatment plant (WTP) in Jaworzno combines a mechanical and biological sewage treatment processes using an activated sludge method in a biological phase. Designed capacity of the object is 25 000 m3∙d−1. Total population equivalent (p.e.) for WTP in Jaworzno is 125 000. Mechanical facilities of the WTP in Jaworzno include bar screens, grit chamber, and primary radial settling tank. Biological sewage treatment is performed in bioreactor using the activated sludge processes. Before the treated sewage is discharged into the natural receiver, sewage is directed into the two secondary settling tanks in order to separate the activated sludge from treated sewage. After this, treated sewage is discharged into the Przemsza River (Figure 1).
3. Materials and Methods
The analysis was made based on the data including the values of the following pollutants indicators; BOD5, CODCr, SSt, TN, and TP. Data was sourced from the period of 2015 to 2016 and included measured values of pollutants indicators for 48 samples of treated sewage. Performed analysis consists of a few elements: the initial analysis of the pollutants indicators series, theoretical distribution fitting for pollutants indicators, selection the best-fitting theoretical function to the empirical distribution, modeling of the pollutants indicators values, and determination of the wastewater treatment plant reliability coefficients values based on the performed simulation results.
According to the Polish obligatory standard [27], for the wastewater treatment plant with over 100,000 p.e., the permissible value of BOD5 in treated sewage is 15 mg O2·dm−3, CODCr – 125 mg O2·dm−3, SSt – 35 mg·dm−3, TN – 10 mg TN·dm−3, and TP – 1 mg TP·dm−3. Moreover, the Regulation of the Minister for Environment [27] determines the minimum amount of the collected sewage samples after treatment process per year. In this case, for the wastewater treatment plant that is characterized with over 100,000 p.e., there are 24 control sewage samples per year. As the cited Regulation (2014) indicates, at most, three of them do not have to meet the quality requirements.
3.1. Preliminary Data Analysis
Preliminary analysis of the pollutants indicators series includes the calculations of the descriptive statistics. Besides minimum (Min.), mean (Mean), and maximum (Max.) values, the measures of dispersion, such as standard deviation (s) and coefficient of variation (Cs) were calculated.
3.2. Statistical Distributions Fitting
Based on the observational series of pollutants indicators in treated sewage, the best-fitting theoretical distribution of random variables to its empirical distribution was considered. The analysis includes General Extreme Values (GEV), Gaussian Mixture Model (GMM), Log-normal, Normal, Pareto, Rayleigh, Triangle, and Weibull theoretical distributions. Each of the f(x) functions is described as follows [28,29,30,31,32,33].
GEV distribution:
where,
- κ—shape parameter;
- α—scale parameter;
- ξ—location parameter.
GMM distribution:
where,
- K—number of components;
- —weights such that
- —multivariate Gaussian distribution
Log-normal distribution:
where,
- —parameters of the log-normal distribution: variance and mean value, respectively.
Normal distribution:
where,
- —variance value;
- μ—mean value.
Pareto distribution:
Rayleigh distribution:
Triangular distribution:
where,
- a—lower limit;
- m—mode;
- b—upper limit.
Weibull distribution:
The assessment of theoretical distributions compatibility with pollutants indicators empirical distributions was made using Anderson–Darling (A–D) test. This type of the statistical test is sensitive in the whole distribution function range. In this case, the possibility of detection of some differences between the distribution functions is greater. Thus, in comparison to other tests, the A–D test provides better assessment of the distribution compatibility. It test includes two opposed hypothesis: H0: data follow a specified distribution and H1: data not follow a specified distribution. The calculations were performed for the statistical significance level of α = 0.05. The Anderson–Darling (A–D) statistic is described as follows [34,35,36]
where,
- n—number of observations;
- F—theoretical cumulative distribution;
- Xi—ordered data.
3.3. The Best Statistical Distributions Fitting
The best-fitting of theoretical function to the empirical random variables distribution was identified based on the metric used in the assessment, e.g., in hydrological modeling: peak-weighted root mean square error (PWRMSE). The studies concerning the possibilities of its using for the assessment of the best-fitting statistical distributions were considered by Młyński et al. [37] preliminary. The analyzed goodness-of-fit metric is described by the following formula [38,39].
where,
- n—size of the observation series;
- Oi—observed value;
- Pi—predicted value;
- —mean of observed values;
- —mean of predicted values.
Also, the Anderson–Darling statistic was used to compare the fit of analyzed distributions to determine which one was the best. The distribution with the largest p-value usually has the closest fit to the data.
3.4. Pollutants Indicators Modeling
Modeling of the pollutants indicators values in treated sewage was performed using Monte Carlo method. This method is defined as the using of the sequence of random numbers for creating the sample from the hypothetical population. Based on this population, there is a possibility of determining a statistical parameter estimator of the searched solution [40,41,42]. Essentially, this is a creation of the stochastic model that describes real phenomena. Next, this model is running many times with using randomly generated variables (according to the assumed probability distribution). Finally, statistical analysis of the obtained results is performed. As some papers show [43], the Monte Carlo method is commonly used for the analysis of water and sewage management facilities operation work. It should be emphasized that the Monte Carlo method has some advantages and disadvantages. This method is very flexible and the empirical distributions of random variable can be handled. Moreover, the method can generally be easily extended and developed as required. Finally, this method is easily understood by non-mathematicians. Regarding the disadvantages, use of the Monte Carlo method usually requires specialist software. Next, the calculations can take much longer than analytical models. Moreover, the solutions are not exact, but depend on the number of repeated runs used to produce the output statistics. That is, all outputs are estimates.
It should be emphasized that Monte Carlo method has already been used for assessment of the wastewater treatment plant operation work. However, previous research has focused on the assumption of a specific form of statistical distribution for pollutants indicators (e.g., normal distribution), values of distribution parameters and the prediction of the pollutants indicators values based on the assumed information, such as at work [44]. However, it should be stressed that some assumptions about the unique form of pollutants indicators distribution may be incorrect. In reality, there are many functions which may describe the empirical sample. Hence in this paper some novelties related to the Monte Carlo approach were included. Namely the specific form of distribution was not assumed. In performed analysis a few functions were considered. Next the best-fitting statistical distribution describing the empirical distributions of pollutants indicators was identified. Next for this function a simulation, using Monte Carlo method, was performed. One simulation series consist of 365 created random values of pollutants indicators. For each of the generated data set, 24-element’s sample was generated in a random way. In each of the series, the number of simulation observations that not meet the technological efficiency condition was determined, i.e., if simulated values were greater than the permissible levels. Next, the result of the control of the wastewater treatment plant operation work was determined as follows; CF = 1, in case of the negative assessment result, i.e., if the number of samples that not meet the requirements exceeded the maximum amount of these type samples; CF = 0, in otherwise. Then, each simulation series was repeated 100 times.
4. Results and Discussion
4.1. Preliminary Analysis of Pollutants Indicators
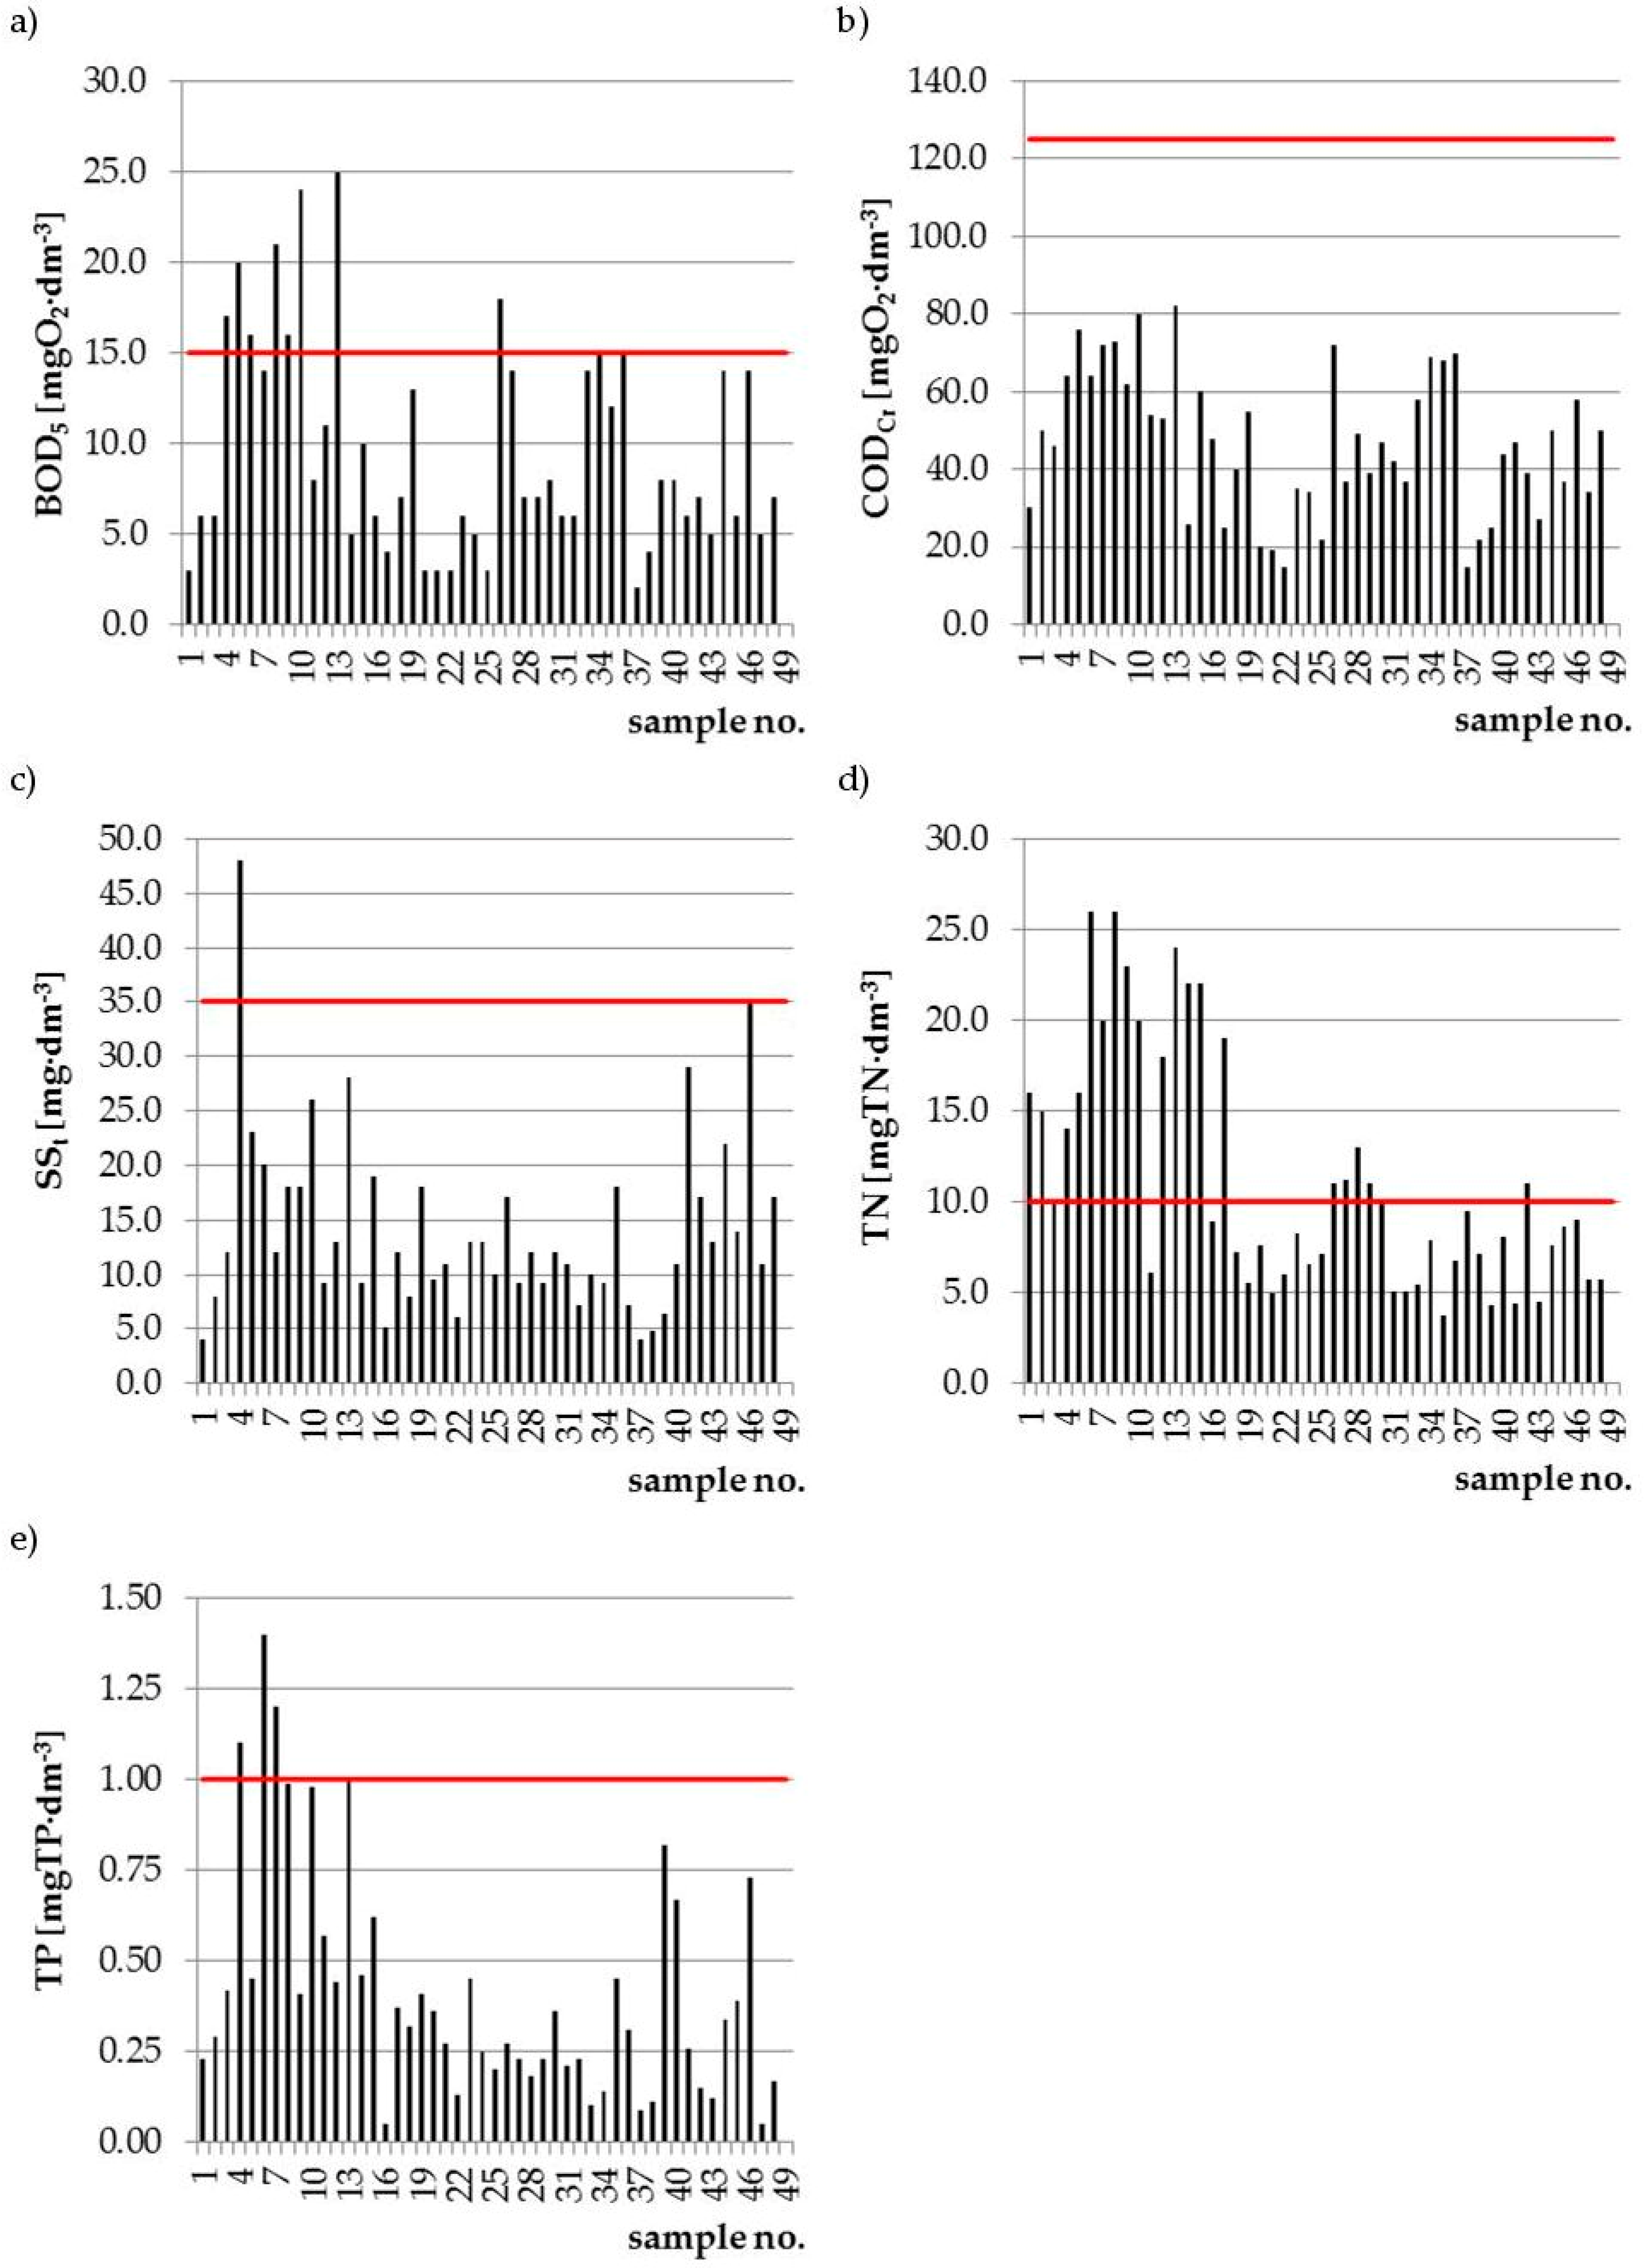
At the beginning, the values of the descriptive statistics for tested pollutants indicators observational series were determined and presented in Table 1. In turn, Figure 2 shows, noted over the whole investigation period, pollutant indicators values in treated sewage with its their permissible levels.
The results presented in Figure 2 and Table 1 indicate that the range between the minimum and maximum BOD5 values was 23 mg O2·dm−3. For the whole investigation period, 17% of the observations (eight samples) exceeded the limitation value for BOD5 of 15 mg O2·dm−3. In turn, the statistical range of CODCr limit values was 67 mg O2·dm−3. In the case of CODCr, the exceedance of its permissible level of 125 mg O2·dm−3 was not observed. For total suspended solids (SSt), a difference between the minimum and maximum concentration was 44 mg·dm−3. Only one treated sewage sample did not meet the SSt quality requirements. The range of between the minimum and maximum total nitrogen concentration (TN) was 22.3 mg TN·dm−3. Between 2015 and 2016, 19 samples of treated sewage (38% of all) exceeded the permissible level of total nitrogen concentration (10 mg TN·dm−3). In turn, the difference between the lowest and the highest noted total phosphorus (TP) concentration was 1.3 mg TP·dm−3. Three samples of treated sewage were characterized by the exceedance of the limitation value for TP concentration of 1mg TP·dm−3. The exceedance of the permissible values of pollutants indicators in treated sewage may be caused by different factors, such as sewage inflow irregularity or sewage pollutants content irregularity and sewage temperature in bioreactor. Both sewage quantity and sewage quality is strongly dependent on the city households’ character. Inhabitants without an access to sewage systems and treatment plants are accustomed to save the water. This is the reason for greater pollutants concentration in smaller water volume. Moreover, the water usage trends in households cause noticeable sewage drainage heterogeneousness. It leads to sewage treatment systems operation work instability [43]. Taking into consideration a coefficient of variation Cs (Table 1), it can be stated that pollutants indicators values were characterized by a considerable variation. Such irregularity is typical for household sewage. Research results presented by [45,46,47,48,49] also indicate on the irregularity of pollutants concentration in household sewage.
4.2. The Results of Theoretical and Empirical Distributions Fitting
Theoretical distributions fitting to empirical pollutants indicator distributions was performed using the following functions; GEV, GMM, Log-normal, Normal, Pareto, Rayleigh, Triangle, and Weibull distribution. The assessment of the compatibility of distributions fitting was made using Anderson–Darling (A–D) test for the significance level of α = 0.05. Analysis results are presented in Table 2.
Based on the results presented in Table 2, it can be stated that BOD5 observational series can be described using all of the analyzed probability distributions. This is evidenced by the p-values for each of the calculated A–D parameters. Its values were greater than assumed significance level of α = 0.05. In the case of CODCr, A–D test showed that for Pareto distribution, p-value is less than 5%. Therefore, in this case, H0 hypothesis about the compatibility of theoretical distribution with empirical distribution was rejected. As the results indicate (Table 2), for SSt, there is no possibility for empirical distribution using Pareto and Triangular functions. Statistical analysis of TN showed the lack of the compatibility of theoretical and empirical distributions in the case of Pareto and Triangular distributions. Finally, H0 hypothesis for TP concerning the distributions compatibility was rejected in the case of Triangular and Rayleigh functions.
The performed analysis showed that almost in every case, Triangular distribution cannot be used for the statistical describing of pollutants indicators observational series. Only in the case of BOD5, there is a possibility of using a Triangular distribution. However, it must be noted that the calculated p-value for BOD5 of Triangular distribution (p-value = 0.054) was close to the H0 hypothesis acceptability limit for Anderson–Darling test. The lack of the possibility of using a Triangular distribution is the result of the function characteristic. According to the Stein and Keblis [50] and Pereira et al. [51], Triangular distribution is a homogeneous function that is described by the most probable minimum and maximum values. Sewage treatment is a complex process. There are many time-variable factors affecting the sewage treatment processes that are the reason for the pollutants indicators variability in treated sewage. In consequence, prediction of the most repeated minimum and maximum values for Triangular distribution is difficult. In addition, it must be mentioned, that not much random variables types may be described using a Triangular distribution.
4.3. Selection of the Best-Fitting Statistical Distribution
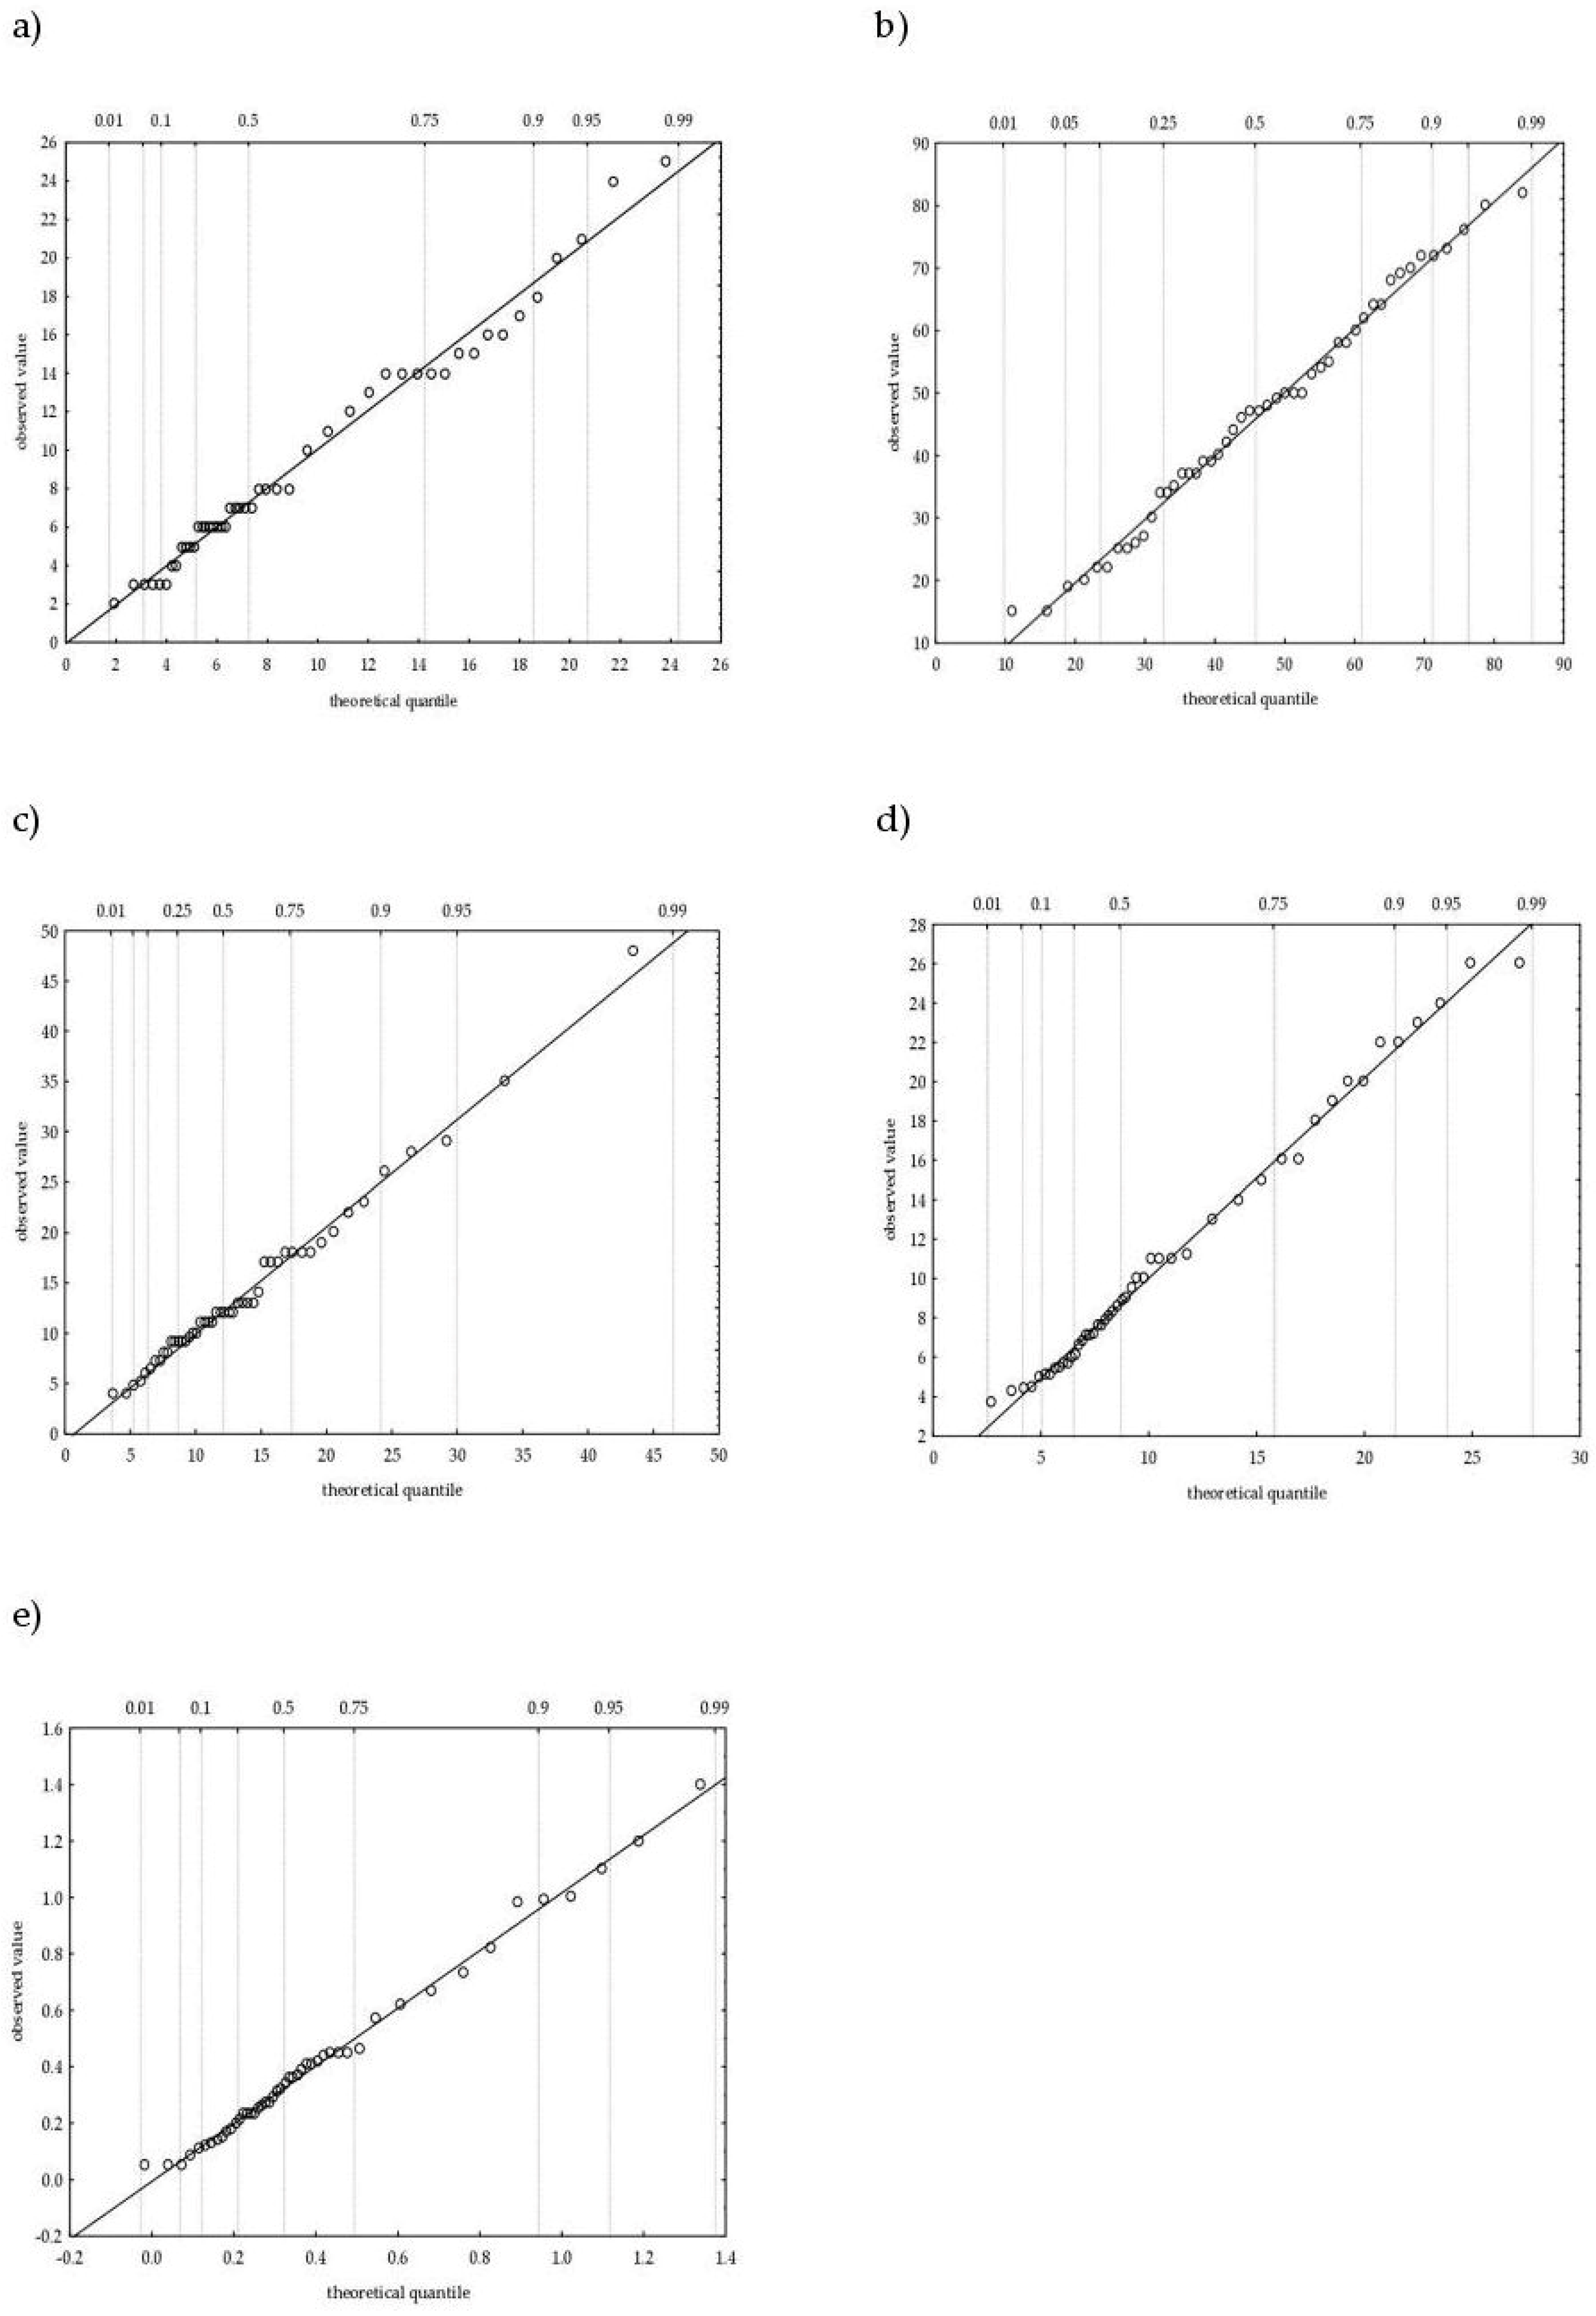
The performed analysis showed that pollutants indicators observational series may be described by using more than one theoretical distribution. Thus, the selection of the best-fitting statistical distribution using PWRMSE parameter was conducted. Calculations were made only for these functions, where the A–D test confirmed functions compatibility with random variables empirical distribution. The results of the analysis are presented in Table 3. In turn, Figure 3 shows quantile-quantile (Q-Q) graphs for the best-fitting statistical distributions.
The results presented in Table 3 indicate that both for BOD5 and CODCr, the best-fitting theoretical distribution is the GMM function, which is evidenced by the PWRMSE values equal to 0.802 mg O2·dm−3 and 1.511 mg O2·dm−3 for BOD5 and CODCr, respectively. In the case of SSt, the best-fitting theoretical distribution is GEV function (PWRMSESSt = 1.222 mg·dm−3). In turn, for biogenic compounds, the best-fitting statistical distribution is GMM. This is evidenced by the PWRMSE values for total nitrogen (PWRMSENt = 0.545 mg TN·dm−3) and for total phosphorus (PWRMSEPt = 0.028 mg TP·dm−3). The analysis allowed us to indicate, unequivocally, that for both organic pollutants indicators (BOD5 and CODCr) and for biogenic compounds (Total Nitrogen and Total Phosphorus) the best-fitting theoretical distribution is the GMM function. Although in the case of SSt, the best-fitting function is GEV distribution, nevertheless, there is also a possibility of using GMM distribution. This is because of the similarity of PWRMSE parameter for total suspended solids GEV and GMM distributions. The possibility of using Gaussian Mixture Model (GMM) for the assessment of the operation work of the wastewater treatment plant was also presented by Yu [52] and Bouzenad and Ramdani [53]. The results of the analysis performed using PWRMSE parameter turned out to be compatible with the results of Anderson–Darling (A–D) test. Both for GMM distribution (in case of BOD5 and CODCr) and for GEV distribution (in case of SSt), A–D test achieved the lowest values, while the p-value was the greatest among the tested distributions. One of the main A–D test disadvantages is the necessity for determination the critical values for each statistical distribution separately [54]. In addition, the use of the A–D test requires using advanced mathematical tools. Therefore, PWRMSE method can be an effective alternative tool for A–D test, because of its simplicity of using. This is especially important in the case of using the statistical methods in practical activities, especially by the wastewater treatment plants operators.
4.4. Determination of the Wastewater Treatment Plant Operation Work Reliability Coefficients
Determination of the pollutants indicators values was made based on the results of the best-fitting distributions selection using the Monte Carlo method. This method is commonly used in generating draws from a probability distribution. The conducted calculations relied on repeated random sampling to obtain numerical results. The essential idea of simulation was using randomness to solve problem that might be deterministic in principle as in the case of assessment of operation work reliability for WTP. GMM distribution was used for organic and biogenic pollutants indicators modeling. In turn, for SSt, simulation was conducted based on the GEV distribution. Obtained simulation results were used for the calculation of technological efficiency coefficient R, reliability coefficient CR and the risk of the “negative” control of the wastewater treatment plant operation work Re (Table 4).
Based on the obtained results (Table 4), it can be stated that wastewater treatment plant in Jaworzno works properly in terms of the organic pollutants reduction. The values of technological efficiency coefficient R are close to or equal to 1.0 for BOD5 and CODCr, respectively. These values indicate that the number of treated sewage samples that not fulfill the quality requirements may be noted occasionally. This is also evidenced by the reliability coefficient CR values. In turn, Re parameter for BOD5 showed that the number of treated sewage samples with exceeded BOD5 limitation values may be greater than the permissible samples amount. As the results indicate, in the case of CODCr, such risk is not predicted (Table 4). Obtained results showed that sewage treatment processes on the WTP in Jaworzno provide an effective SSt reduction. The values of R and CR parameters showed, that exceedings of the permissible SSt concentration at the wastewater treatment plant outflow may be observed. However, the number of these exceedations is not greater than the permissible limit for over 100,000 p.e. wastewater treatment plant. This is evidenced by the calculated value of Re parameter (Table 4). Performed simulation showed, that in the case of biogenic pollutants indicators, the requirements concerning to the TN and total TP concentration at the wastewater treatment plant outflow may be not fulfill. The values of technological efficiency coefficient R and reliability coefficient CR confirmed that biogenic compounds concentration in treated sewage may exceed its limit content. In addition, the values of Re parameter for biogenic compounds, suggest that the number of TN and TP exceedings may be greater than its limitation. Especially in the case of TN, the value of the risk of the “negative” control of the wastewater treatment plant operation work (Re=1.0) allowed for the statement, that, in the analyzed period, WTP in Jaworzno did not provide the required reduction of total nitrogen concentration. Based on the obtained simulation results, it can be stated that the sewage treatment processes on the WTP in Jaworzno were partially improper. Therefore, wastewater treatment plant operators should take actions to increase the organic and biogenic pollutants reduction effectiveness. The results of the analysis were based on the simulation (prediction) of the wastewater treatment plant reliability for pollutants indicators values in 49 sewage samples. These pollutants indicators indicate on the current wastewater treatment plant reliability. However, using this data, it is possible to forecast the sewage treatment processes reliability in the future. It is possible to forecast the wastewater treatment plant operation work in the future with the current hydraulic load and current pollutants content in sewage. It must be emphasized that presented simulation method can be used for modeling the sewage quality parameters after the next stages of sewage treatment process. It is possible to make an analysis of sewage quality parameters before biological sewage treatment (mechanical treatment). Thank to this, wastewater treatment plant operators are able to make a prediction about the occurrence of increased pollutants indicators values in sewage after mechanical treatment processes. Increased pollutant indicator values in sewage after mechanical treatment may cause some problems related to the achieving the required pollutants reduction after biological treatment. The performed simulation can give some information about the necessity for performing in the future the modernization of wastewater treatment plant, including, first, mechanical facilities modernization, without modernization of biological facilities. Similar to the above, calculations may be performed only for biological facilities. Obtained results can indicate to the risk of the negative operation work of some wastewater treatment plant facilities. It will allow us to indicate which of the facilities should be modernized in the future.
The assessment of the water and sewage infrastructure (facilities) reliability may be also carried out using the other methods. In the paper [55], the graph theory method was presented as a means to identify the most critical elements in a network with respect to malfunctioning of the system as a whole. The method is objective and independent on the type of storm event and requires limited computational effort. In the paper [56], it was found that the ‘bathtub’ type failure rate curve can describe failures for particular objects of sewage infrastructure. Registration of failure data is very important aspect too. In the paper of Korving and Langeveld [57], the uniform registration of failures was performed. This method enables cooperation of the different management authorities on the level of daily operations. Additionally, the comparison of the performance can be made between different water and sewage facilities and changes in the performance of system components can be identified more easily.
As it was already mentioned, the irregularity of pollutants content in sewage inflowing to the bioreactor is one of the main factor affected the disruption of sewage treatment processes. Both in the case of the WTP in Jaworzno and any other similar objects located on rural areas in Poland, sewage coming from septic tanks represent a substantial part of treated sewage. Sewage from septic tanks is characterized by high pollutants concentration; in addition, it is rotten sewage. Because of this, it is necessary to determine the permissible share of the sewage coming from septic tanks in total amount of treated sewage [58,59,60]. In order to increase the reduction of sewage biogenic pollutants, it is suggested to consider the application of biofilters before the bioreactor with activated sludge in wastewater treatment plant facilities. Biofilters will be used for nitrification process. In turn, total nitrogen and total phosphorus reduction process will take place in anaerobic and anoxic activated sludge chambers. Separation of the nitrobacteries from heterotrophic organisms will result with its no competition and greater stability of nitrification population [61]. Research related to determination of influence to the reduction of biogenic pollutants was also conducted by Wąsik et al. [62]. It should be noted that the decisions about the optimization of the water and sewage management, cannot be make only based on the empirical data analysis. Negotiations between the involved managers of the water and sewage facilities and other similar activities should be also considered [63]. It is observed very often, that some decisions about the sewage infrastructure facilities is partially making based on the intuition, without any reliable confirmation or arguments [64].
5. Summary
The aim of the paper was the modeling of the wastewater treatment plant operation work using Monte Carlo method. The analysis includes some pollutants indicators in treated sewage: BOD5, CODCr, SSt, TN, and TP. A simulation was performed using the following probability distributions: GEV, GMM, Log-normal, Normal, Pareto, Rayleigh, Triangular, and Weibull functions. A–D test was used for the assessment of theoretical and empirical distributions compatibility. In turn, the selection of the best-fitting statistical distributions was performed using PWRMSE parameter. Obtained results indicate on a significant variability of tested pollutants indicators in sewage after treatment processes on the wastewater treatment plant in Jaworzno. As the results of A–D test showed, Triangular distribution should not be used for statistical description of pollutants indicators observational series. Based on the results obtained using PWRMSE parameter, it was stated that the best-fitting random variables statistical distribution is GMM function. Because there was observed a similarity of PWRMSE method results and A–D test results, it was found that PWRMSE parameter can be an effective alternative for using A–D test. The results of Monte Carlo simulation method confirmed that some problems related to the organic (mainly BOD5) and biogenic pollutants indicators reduction may appear on the WTP in Jaworzno. Finally, it was found that Monte Carlo simulation method is a useful tool for modeling the wastewater treatment plant operation work reliability. However, it is important to indicate an appropriate theoretical distribution for random variables. With this, it is possible to create a new data, maintaining simultaneously a current correlation structures between the random variables. New values obtained in this way may be helpful for the assessment of the wastewater treatment plant operational work and for preparing different scenarios of its operation, which has a significant content in many aspects of the assessment of the wastewater treatment plant operation work. Simulation method can be used by the wastewater treatment plant operators for making an assessment of the risk of the failures the wastewater treatment plant facilities that can occur at specific random incidents. Presented methods allow for consider the risk of the failures in a wider scope. This “wider scope” includes especially a prediction of the changes of the amounts of inflowing sewage and the changes of pollutants content in sewage. Thanks to this, it is possible to speed up or to dismiss over time the need for the wastewater treatment plant modernization or the expansion of some wastewater treatment plant facilities. It is very important economical aspect. Such activities allow planning the expenses intended for modernization or expansion the wastewater treatment plant.
Author Contributions
Conceptualization, D.M. and P.B.; Methodology, D.M.; Formal Analysis, D.M.; Investigation, D.M.; Resources, P.B.; Data Curation, P.B.; Writing—Original Draft Preparation, D.M.; Writing—Review and Editing, D.M., P.B., and A.M.; Visualization, D.M., P.B., and A.M.; Supervision, P.B.
Funding
This research received no external funding.
Conflicts of Interest
The authors declare no conflict of interest.
References
- Psomopoulos, C.S.; Barkas, D.; Ioannidis, G.C. The Recycling Potential of Submersible Sewage Pumps in the EU. Recycling 2018, 3, 14. [Google Scholar] [CrossRef]
- Bergel, T.; Bugajski, P.; Pawełek, J. Analysis of the sewage system expandability in Mściwojów commune. GLL 2013, 2, 7–14. [Google Scholar] [CrossRef]
- Bugajski, P.; Chmielowski, K.; Kaczor, G. Influence of the size of flow of rainwater on the composition of raw wastewater in small sewer system. Acta Sci. Pol. Formatio Circumiectus 2016, 15, 3–11. [Google Scholar] [CrossRef]
- Młyński, D.; Chmielowski, K.; Młyńska, A. Analysis of hydraulic load of a wastewater treatment plant in Jasło. J. Water Land Dev. 2016, 28, 61–67. [Google Scholar] [CrossRef] [Green Version]
- Nowak, J.; Chmielowski, K.; Chmielowska, B.; Bedla, D. The efficiency of pollutant elimination in the Dobra treatment plant. Infrastruct. Ecol. Rural Areas 2016, 3, 737–747. [Google Scholar]
- Todeschini, S. Hydrologic and environmental impacts of imperviousness in an industrial catchment of Northern Italy. J. Hydrol. Eng. 2016, 21. [Google Scholar] [CrossRef]
- Gizińska-Górna, M.; Jóźwiakowski, K.; Marzec, M.; Pytka, A.; Sosnowska, B.; Różańska-Boczula, M.; Listosz, A. Analysis of the influence of a hybrid constructed wetland wastewater treatment plant on the water quality of the receiver. Rocz. Ochr. Sr. 2017, 19, 370–393. [Google Scholar]
- Młyński, D.; Kurek, K.; Bugajski, P. An analysis of seasonal waste draining for the urban agglomeration using statistical methods. Water 2018, 10, 976. [Google Scholar] [CrossRef]
- Angelakis, A.N.; Gikas, P. Water reuse: Overview of current practices and trends in the world with emphasison eu states. Water Util. J. 2014, 8, 67–78. [Google Scholar]
- Taheriyoun, M.; Moradinejad, S. Reliability analysis of a wastewater treatment plant using fault tree analysis and Monte Carlo simulation. Environ. Monit. Assess. 2015, 187, 4186–4199. [Google Scholar] [CrossRef]
- Psarrou, E.; Tsoukalas, I.; Makropoulos, E. A Monte-Carlo-based method for the optimal placement and operation scheduling of sewer mining units in urban wastewater networks. Water 2018, 10, 200. [Google Scholar] [CrossRef]
- Olyaei, M.A.; Karamouz, M.; Asce, F.; Farmani, R. Framework for assessing flood reliability and resilience of wastewater treatment plants. J. Environ. Eng. 2018, 144, 1–14. [Google Scholar] [CrossRef]
- Trigo, A.P.; Tinetti, B.; Falkner, H.; Jugdoyal, K.; Pahal, S.; Mudgal, S. ENER Lot 28—Pumps for Private and Public Wastewater and for Fluids with High Solids Content—Task 3—Consumer Behaviour and Local Infrastructure Working Document; Report for the European Commission: Paris, France, 2014. [Google Scholar]
- Yang, Y.; Yu, K.; Xia, Y.; Lau, F.T.K.; Tang, D.T.W.; Fung, W.C.; Fang, H.H.P.; Zhang, T. Metagenomicanalysis of sludge from full-scale anaerobic digesters operated in municipal wastewater treatment plants. Appl. Microbiol. Biotechnol. 2014, 98, 5709–5718. [Google Scholar] [CrossRef]
- Bayo, J.; López-Castellanos, J. Principal factor and hierarchical cluster analyses for performance assessment of an urban wastewater treatment plant in the Southeast of Spain. Chemosphere 2016, 155, 152–162. [Google Scholar] [CrossRef]
- Wąsik, E.; Chmielowski, K.; Operacz, A. PCA as a data mining tools characterizing the work of nitrification reactors in the sewage treatment plant in Trepcza. Acta Sci. Pol. Formatio Circumiectus 2016, 16, 209–222. [Google Scholar] [CrossRef]
- Snip, L.J.P.; Boiocchi, R.; Flores-Alsina, X.; Jeppsson, U.; Gernaey, K.V. Challenges encounteredwhen expanding activated sludge models: A case studybased on N2O production. Water Sci. Technol. 2014, 70, 1251–1260. [Google Scholar] [CrossRef]
- Wu, X.; Yanga, Y.; Wu, G.; Mao, J.; Zhou, T. Simulation and optimization of a coking wastewater biological treatment process by activated sludge models (ASM). J. Environ. Manag. 2016, 165, 235–242. [Google Scholar] [CrossRef] [PubMed]
- Machado, V.C.; Lafuente, J.; Baeza, J.A. Activated sludge model 2d calibration with full-scale WWTP data: Comparing model parameter identifiability with influent and operational uncertainty. Bioprocess Biosyst. Eng. 2014, 37, 1271–1287. [Google Scholar] [CrossRef] [PubMed]
- Alikhani, J.; Takacs, I.; Al-Omari, A.; Murthy, S.; Massoudieh, A. Evaluation of the information content of long-term wastewater characteristics data in relation to activated sludge model parameters. Water Sci. Technol. 2017, 75, 1370–1389. [Google Scholar] [CrossRef] [PubMed]
- Guo, L.; Vanrolleghem, P.A. Calibration andvalidation of an activated sludge model for greenhouse gases no. 1 (ASMG1): Prediction of temperature-dependent N2O emission dynamics. Bioprocess Biosyst. Eng. 2014, 37, 151–163. [Google Scholar] [CrossRef]
- Bugajski, P.; Chmielowski, K.; Kaczor, G. Reliability of a collective wastewater treatment plant. J. Ecol. Eng. 2016, 17, 143–147. [Google Scholar] [CrossRef]
- Marzec, M. Reliability of removal of selected pollutants in different technological solutions of household wastewater treatment plants. J. Water Land Dev. 2017, 35, 141–148. [Google Scholar] [CrossRef] [Green Version]
- Jóźwiakowski, K.; Bugajski, P.; Mucha, Z.; Wójcik, W.; Jucherski, A.; Nastwany, M.; Siwiec, T.; Mazur, A.; Obroślak, R.; Gajewska, M. Reliability and efficiency of pollution removal during long-term operation of a one-stage constructed wetland system with horizontal flow. Sep. Purif. Technol. 2017, 187, 60–66. [Google Scholar] [CrossRef]
- Sun, X.; Lall, U. Spatially coherent trends of annual maximum daily precipitation in the United States. Geophys. Res. Lett. 2015, 42, 9781–9789. [Google Scholar] [CrossRef]
- Delignette-Muller, M.L.; Dutang, C. An R package for fitting distributions. J. Stat. Softw. 2015, 64, 1–34. [Google Scholar] [CrossRef]
- Rozporządzenie Ministra Środowiska z dnia 18 listopada 2014 r. w sprawie warunków, jakie należy spełnić przy wprowadzaniu ścieków do wód lub do ziemi, oraz w sprawie substancji szczególnie szkodliwych dla środowiska wodnego (Dz.U. 2014 poz. 1800). Available online: http://prawo.sejm.gov.pl/isap.nsf/DocDetails.xsp?id=WDU20140001800 (accessed on 26 April 2019).
- Glickman, T.S.; Xu, F. The distribution of the product of two random variables. Stat. Probab. Lett. 2008, 78, 2821–2826. [Google Scholar] [CrossRef]
- Wang, X. Vehicle Noise and Vibration Refinement; Woodhead Publishing: Cambridge, UK, 2010. [Google Scholar]
- Zoran, D.; Weiss, Y. From learning models of natural image patches to whole image restoration. In Proceedings of the International Conference on Computer Vision, Tokyo, Japan, 25–27 May 2011; pp. 479–486. [Google Scholar]
- Yu, G.; Sapiro, G.; Mallat, S. Solving inverse problems with piecewise linear estimators: From gaussian mixture models to structured sparsity. IEEE Trans. Image Process. 2012, 21, 2481–2499. [Google Scholar]
- Wałęga, A.; Rutkowska, A.; Policht-Latawiec, A. Sensitivity of beta and Weibull synthetic unit hydrographs to input parameter changes. Pol. J. Environ. Stud. 2014, 1, 221–229. [Google Scholar]
- Alam, M.A.; Emuro, K.; Farnham, C.; Yuan, J. Best-fit probability distributions and return periods for maximum monthly rainfall in Bangladesh. Climate 2018, 6, 9. [Google Scholar] [CrossRef]
- Zeng, X.; Wang, D.; Wu, J. Evaluating the three methods of goodness of fit test for frequency analysis. JRACR 2015, 5, 178–187. [Google Scholar] [CrossRef]
- Evans, D.L.; Drew, J.H.; Leemis, L.M. The distribution of the Kolmogorov–Smirnov, Cramer–von Mises, and Anderson–Darling test statistics for exponential populations with estimated parameters. Comput. Probab. Appl. 2017, 247, 165–190. [Google Scholar]
- Jäntschi, L.; Bolboacă, S.D. Computation of probability associated with Anderson–Darling statistic. Mathematics 2018, 6, 88. [Google Scholar] [CrossRef]
- Młyński, D.; Wałęga, A.; Petroselli, A.; Tauro, F.; Cebulska, M. Estimating maximum daily precipitation in the upper Vistula basin, Poland. Atmosphere 2019, 10, 43. [Google Scholar] [CrossRef]
- Wałęga, A.; Książek, L. Influence of rainfall data on the uncertainty of flood simulation. Soil Water Res. 2016, 11, 277–284. [Google Scholar] [CrossRef] [Green Version]
- Wałęga, A. The importance of calibration parameters on the accuracy of the floods description in the Snyder’s model. J. Water Land Dev. 2016, 28, 19–25. [Google Scholar] [CrossRef] [Green Version]
- Halton, J.H. A retrospective and prospective survey of the Monte Carlo method. SIAM Rev. 1970, 12, 1–63. [Google Scholar] [CrossRef]
- Schauberger, G.; Piringer, M.; Baumann-Stanzer, K.; Knauder, W.; Petz, E. Use of a Monte Carlo technique to complete a fragment set of H2S emission rates from a wastewater treatment plant. J. Hazard. Mater. 2013, 263, 694–701. [Google Scholar] [CrossRef]
- Hendren, C.O.; Badireddy, A.R.; Casman, E.; Wiesner, M.R. Modeling nanomaterial fate in wastewater treatment: Monte Carlo simulation of silver nanoparticles (nano-Ag). Sci. Total Environ. 2013, 449, 418–425. [Google Scholar] [CrossRef]
- Barton, L.E.; Auffan, M.; Durenkamp, M.; McGrath, S.; Bottero, J.; Wiesner, M.R. Monte Carlo simulations of the transformation and removal of Ag, TiO2, and ZnO nanoparticles in wastewater treatment and land application of biosolids. Sci. Total Environ. 2015, 511, 535–543. [Google Scholar] [CrossRef]
- Andraka, D.; Dzienis, L. Modeling of risk in the operation of wastewater treatment plants. Rocz. Ochr. Sr. 2013, 15, 1111–1125. [Google Scholar]
- Wałęga, A.; Chmielowski, K.; Młyński, D. Influence of the hybrid sewage treatment plant’s exploitation on its operation effectiveness in rural areas. Sustainability 2018, 10, 2689. [Google Scholar] [CrossRef]
- Wąsik, E.; Chmielowski, K. Evaluation of the operation of the sewage treatment plant, Kujawy in Cracow. Teka. Kom. Ochr. Kszt. Środ. Przyr. 2013, 10, 481–488. [Google Scholar]
- Kaczor, G.; Bergel, T.; Bugajski, P.; Pijanowski, J. Aspects of sewage disposal from tourist facilities in national parks and other protected areas. Pol. J. Environ. Stud. 2015, 24, 107–114. [Google Scholar] [CrossRef]
- Bugajski, P.; Almeida, M.A.A.; Kurek, K. Reliablity of sewage treatment plants processing sewage from school buldings located in non-urban areas. Infrastruct. Ecol. Rural Areas 2016, 4, 1547–1557. [Google Scholar]
- Chmielowski, K.; Wąsik, E.; Operacz, A.; Bugajski, P.; Kaczor, G.; Jurik, L. Analysis of sewage susceptibility to biodegradation on an example of sewage treatment plant in Wodzisław Śląski. Infrastruct. Ecol. Rural Areas 2017, 4, 1427–1443. [Google Scholar]
- Stein, W.; Keblis, M. A new method to simulate the triangular distribution. Math. Comput. Model. 2009, 49, 1143–1147. [Google Scholar] [CrossRef]
- Pereira, E.J.S.; Pinho, J.T.; Galhardo, M.A.B.; Macêdo, W.M. Methodology of risk analysis by Monte Carlo Method applied to power generation with renewable energy. Renew. Energy 2014, 69, 347–355. [Google Scholar] [CrossRef]
- Yu, J. A nonlinear kernel Gaussian mixture model based inferential monitoring approach for fault detection and diagnosis of chemical processes. Chem. Eng. Sci. 2012, 68, 506–519. [Google Scholar] [CrossRef]
- Bouzenad, K.; Ramdani, R. Multivariate statistical process control using enhanced bottleneck neural network. Algorithms 2017, 10, 49. [Google Scholar] [CrossRef]
- Saculinggan, N.; Balase, E.A. Empirical power comparison of goodness of fit tests for normality in the presence of outliers. J. Phys. Conf. Ser. 2012, 435, 1–12. [Google Scholar] [CrossRef]
- Meijer, D.; Van Bijnen, M.; Langeveld, J.; Korving, H.; Post, J.; Clemens, F. Identifying Critical Elements in Sewer Networks Using Graph-Theory. Water 2018, 10, 136. [Google Scholar] [CrossRef]
- Korving, H.; Ottenhoff, E.C. Analysis of the causes of pump failure and differences of failure characteristics. Water Sci. Technol. 2008, 57, 1271–1276. [Google Scholar] [CrossRef] [PubMed]
- Korving, H.; Langeveld, J.G. Uniform registration of failures in wastewater systems—Experiences from pilot projects. In Proceedings of the 11th International Conference on Urban Drainage, Edinburgh, Scotland, UK, 31 August–5 September 2008; pp. 1–10. [Google Scholar]
- Bugajski, P.; Chmielowski, K.; Kaczor, G. Optimizing the percentage of sewage from septic tanks for stable operation of a wastewater treatment plant. Pol. J. Environ. Stud. 2016, 4, 1421–1425. [Google Scholar] [CrossRef]
- Bugajski, P.; Satora, S. The balance of sewage inflowing and brought to the treatment plant based on example of the chosen object. Infrastruct. Ecol. Rural Areas 2009, 5, 73–82. (In Polish) [Google Scholar]
- Zdebik, D.; Głodniok, M.; Zawartka, P. Anaerobic digestion model analysis of the fermentation process in psychrophilic and mesophilic chamber in accordance with the amount of biogas sourced. Inżynieria Ekologiczna 2015, 42, 63–71. (In Polish) [Google Scholar] [CrossRef]
- Wałęga, A.; Chmielowski, K.; Młyński, D. Nitrogen and phosphorus removal from sewage in biofilter—Activated sludge combined systems. Pol. J. Environ. Stud. 2019, 28, 1939–1947. [Google Scholar] [CrossRef]
- Wąsik, E.; Bugajski, P.; Chmielowski, K.; Nowak, A.; Mazur, R. Crystallization of struvite and hydroxyapatite during removal of biogenic compounds on the filter bed. Przem. Chem. 2017, 96, 1739–1743. (In Polish) [Google Scholar]
- Van Riel, W.; Van Bueren, E.; Langeveld, J.; Herder, P.; Clemens, F. Decision-making for sewer asset management: Theory and practice. Urban Water J. 2015, 13, 57–68. [Google Scholar] [CrossRef]
- Van Riel, W.; Langeveld, J.; Herder, P.; Clemens, F. Valuing information for sewer replacement decisions. Water Sci. Technol. 2016, 74, 796–804. [Google Scholar] [CrossRef] [PubMed]
Figure 1.
A simplified scheme of the wastewater treatment plant in Jaworzno.

Figure 2.
The values of pollutants indicators in treated sewage with its permissible levels: (a) Biochemical Oxygen Demand (BOD5), (b) Chemical Oxygen Demand (CODCr), (c) Total Suspended Solids (SSt), (d) Total Nitrogen (TN), and (e) Total Phosphorus (TP).
Figure 2.
The values of pollutants indicators in treated sewage with its permissible levels: (a) Biochemical Oxygen Demand (BOD5), (b) Chemical Oxygen Demand (CODCr), (c) Total Suspended Solids (SSt), (d) Total Nitrogen (TN), and (e) Total Phosphorus (TP).

Figure 3.
Quantile-quantile (Q-Q) graph type for the best-fitting random variables statistical distributions: (a) BOD5, (b) CODCr, (c) Total Suspended Solids (SSt), (d) Total Nitrogen (TN), and (e) Total Phosphorus (TP).
Figure 3.
Quantile-quantile (Q-Q) graph type for the best-fitting random variables statistical distributions: (a) BOD5, (b) CODCr, (c) Total Suspended Solids (SSt), (d) Total Nitrogen (TN), and (e) Total Phosphorus (TP).


Table 1.
The values of the descriptive statistics for pollutants indicators observational series.
| Pollutants Indicators | Descriptive Statistics | ||||
|---|---|---|---|---|---|
| Min. | Mean | Max. | S | Cs | |
| BOD5 [mgO2·dm−3] | 2.0 | 9.6 | 25.0 | 5.8 | 0.61 |
| CODCr [mgO2·dm−3] | 15.0 | 46.7 | 82.0 | 18.2 | 0.39 |
| SSt [mg·dm−3] | 4.0 | 14.2 | 48.0 | 8.3 | 0.59 |
| TN [mg TN·dm−3] | 3.7 | 11.1 | 26.0 | 6.4 | 0.57 |
| TF [mg TP·dm−3] | 0.1 | 0.4 | 1.4 | 0.3 | 0.76 |
Table 2.
The results of theoretical distributions fitting to empirical random variables distributions.
Table 2.
The results of theoretical distributions fitting to empirical random variables distributions.
| Statistical Distributions | BOD5 | CODCr | SSt | TN | TP | |||||
|---|---|---|---|---|---|---|---|---|---|---|
| A–D | p | A–D | p | A–D | p | A–D | p | A–D | p | |
| GEV | 0.786 | 0.491 | 0.322 | 0.920 | 0.258 | 0.966 | 0.401 | 0.847 | 0.233 | 0.979 |
| GMM | 0.445 | 0.803 | 0.187 | 0.993 | 0.351 | 0.895 | 0.224 | 0.982 | 0.193 | 0.992 |
| Log-normal | 0.696 | 0.561 | 0.730 | 0.534 | 0.288 | 0.947 | 0.709 | 0.550 | 0.352 | 0.894 |
| Normal | 2.053 | 0.086 | 0.307 | 0.932 | 2.013 | 0.091 | 2.386 | 0.057 | 2.421 | 0.055 |
| Pareto | 1.684 | 0.138 | 3.405 | 0.017 | 3.734 | 0.012 | 6.463 | 0.001 | 1.098 | 0.309 |
| Rayleigh | 1.700 | 0.135 | 1.346 | 0.218 | 1.195 | 0.269 | 1.707 | 0.134 | 4.697 | 0.004 |
| Triangular | 2.428 | 0.054 | 5.673 | 0.001 | 9.783 | 0.000 | 5.147 | 0.002 | 11.083 | 0.000 |
| Weibull | 0.969 | 0.373 | 0.277 | 0.954 | 1.033 | 0.340 | 1.392 | 0.204 | 0.555 | 0.690 |
Table 3.
The results of the peak-weighted root mean square (PWRMSE) analysis for tested pollutants indicators.
Table 3.
The results of the peak-weighted root mean square (PWRMSE) analysis for tested pollutants indicators.
| Statistical Distributions | PWRMSE | ||||
|---|---|---|---|---|---|
| BOD5 | CODCr | SSt | TN | TP | |
| GEV | 2.369 | 2.266 | 1.222 | 5.211 | 0.100 |
| GMM | 0.802 | 1.511 | 1.733 | 0.545 | 0.028 |
| Log-normal | 1.825 | 7.344 | 1.780 | 1.780 | 0.119 |
| Normal | 1.748 | 29.476 | 4.124 | 4.124 | 0.631 |
| Pareto | 1.283 | - | - | - | 0.065 |
| Rayleigh | 1.413 | 6.297 | 1.413 | 1.940 | - |
| Triangular | 1.263 | - | - | - | - |
| Weibull | 1.083 | 2.193 | 3.100 | 3.100 | 0.071 |
Table 4.
The values of the wastewater treatment plant operation work reliability coefficients determined based on the Monte Carlo simulation method.
Table 4.
The values of the wastewater treatment plant operation work reliability coefficients determined based on the Monte Carlo simulation method.
| Reliability Parameters | Reliability Coefficients | ||||
|---|---|---|---|---|---|
| BOD5 | CODCr | SSt | TN | TP | |
| R | 0.947 | 1.000 | 0.995 | 0.909 | 0.977 |
| CR | 0.651 | 0.371 | 0.397 | 1.100 | 0.435 |
| Re | 0.810 | 0.000 | 0.000 | 1.000 | 0.160 |
© 2019 by the authors. Licensee MDPI, Basel, Switzerland. This article is an open access article distributed under the terms and conditions of the Creative Commons Attribution (CC BY) license (http://creativecommons.org/licenses/by/4.0/).
Share and Cite
MDPI and ACS Style
Młyński, D.; Bugajski, P.; Młyńska, A. Application of the Mathematical Simulation Methods for the Assessment of the Wastewater Treatment Plant Operation Work Reliability. Water 2019, 11, 873. https://doi.org/10.3390/w11050873
AMA Style
Młyński D, Bugajski P, Młyńska A. Application of the Mathematical Simulation Methods for the Assessment of the Wastewater Treatment Plant Operation Work Reliability. Water. 2019; 11(5):873. https://doi.org/10.3390/w11050873
Chicago/Turabian StyleMłyński, Dariusz, Piotr Bugajski, and Anna Młyńska. 2019. "Application of the Mathematical Simulation Methods for the Assessment of the Wastewater Treatment Plant Operation Work Reliability" Water 11, no. 5: 873. https://doi.org/10.3390/w11050873
Note that from the first issue of 2016, this journal uses article numbers instead of page numbers. See further details here.