Riverbank Filtration Impacts on Post Disinfection Water Quality in Small Systems—A Case Study from Auburn and Nebraska City, Nebraska


1
Nebraska Water Center, University of Nebraska Lincoln, Lincoln, NE 68588-6204, USA
2
Department of Civil Engineering, University of Nebraska Lincoln, Lincoln, NE 68588-6105, USA
*
Author to whom correspondence should be addressed.
Water 2018, 10(12), 1865; https://doi.org/10.3390/w10121865
Submission received: 26 September 2018
/
Revised: 7 December 2018
/
Accepted: 13 December 2018
/
Published: 15 December 2018
(This article belongs to the Special Issue Efficiency of Bank Filtration and Post-Treatment)
Abstract
:Small water systems can experience a fluctuating quality of water in the distribution system after disinfection. As chlorine is the most common disinfectant for small systems, the occurrence of disinfection byproducts (DBPs) represents a common problem for these systems. Riverbank filtration (RBF) can be a valuable solution for small communities located on riverbanks. The objectives of this study were to evaluate (i) the improvements in water quality at two selected RBF systems, and (ii) the potential lower concentrations of DBPs, in particular, trihalomethanes (THMs), in small systems that use RBF. Two small communities in Nebraska, Auburn and Nebraska City, using RBF were selected. Results from this study highlight the ability of RBF systems to consistently improve the quality of the source water and reduce the occurrence of THMs in the distribution water. However, the relative removal of THMs was directly impacted by the dissolved organic carbon (DOC) removal. Different THM concentrations and different DOC removals were observed at the two RBF sites due to the different travel distances between the river and the extractions wells.
1. Introduction
Small water systems (served population <10,000) represent more than 97% of the USA public water systems and often experience a fluctuating quality of water in the distribution system after disinfection [1]. Dissolved organic carbon (DOC) present in surface waters contributes to the formation of several disinfection byproducts (DBPs) when chlorine is used as the disinfectant [2,3,4,5]. Systems that use chloramine also experience the depletion of chlorine residuals due to nitrification in summer months [6,7,8]. DBPs have been detected in concentration up to few mg L−1 and many of them are suspected or known human carcinogens [9,10,11]. Among halogenated DBPs, trihalomethanes (THMs) have been widely detected [2,10,12,13]. In order to reduce general public exposure to DBPs and lower the potential of cancer and reproductive and development risks, in 2005, the U.S. Environmental Protection Agency (EPA) issued a Stage 2 Disinfectants and Disinfection Byproducts Rule (DBPR) requiring all drinking water treatment plants to maintain levels of total THMs (TTHM) below the annual average maximum contaminant level (MCL) (80 μg L−1) on the location running annual average (EPA Stage 1 and 2) [14]. Small water systems, especially in rural communities, may struggle to comply with the USEPA Stage 2 DBPR due to source water variation, limited resources, aging infrastructures, and low-cost efficiency [2]. For example, Hua et al., investigating three small drinking water systems in rural communities in Missouri, observed consistently higher THMs in finished water than the MCL (80 μg L−1) [2]. Nationally, it has been identified that small systems using surface waters experience three times the rate of Stage 1 DBP violations than systems that serve populations above 10,000 [15]. Therefore, there is a need to provide cost-effective solutions to improve the source of water by reducing its variations and lowering its level of organic carbon. Natural filtration, a technology that has been used for communities of various sizes to fully treat or pretreat surface water before supply, can represent a valuable solution [16,17]. Natural filtration includes two primary technologies: Riverbank filtration (RBF) and slow sand filtration (SSF) [18,19]. Both of these types of technologies have been shown to produce water of consistent quality and remove a significant amount of organic carbon and microorganisms present in surface water. Additionally, natural filtration is resistant to rapid contamination [18,19,20,21,22,23]. Particularly, RBF is potentially ideal for small communities that are located on riverbanks. The use of groundwater in many areas (e.g., Nebraska) can be an issue due to high levels of nitrate (>MCL, 10 mg L−1 [24]) [25,26,27,28]. State regulatory agencies frequently request case studies for the application of technologies to address specific regulations before approving plans and funding [29]. There is a scarcity of research in small communities about how water produced from RBF wells or SSF affects the formation and subsequent fate of DBPs when chlorine or chloramines are used as disinfectants. Preliminary investigations have shown the ability of RBF to reduce DBP precursors (i.e., DOC) [30,31,32,33,34]. Increased understanding of the formation and dispersal of DBPs in the disinfection system and other contaminants of concern will provide greater protection of public health.
This study investigates (i) the improvements in water quality (i.e., total organic carbon, TOC, DOC, total coliforms, and Escherichia coli) at two selected RBF systems and (ii) the potential lower concentrations of DBPs, in particular, THMs, in small systems that use natural filtration compared to systems that directly use surface water. Improvements in water quality were measured by comparing the quality of river waters and the filtrate and examining the response of the systems to hydrologic forcing, such as spring runoff or low flow events in rivers.
2. Materials and Methods
2.1. Description of the RBF Sites
Auburn and Nebraska City, two small towns in Nebraska, were selected. The two cities have a population of 3460 and 7289, respectively [35]. Temperature ranged between −27 °C and 38 °C in both towns [36]. At the time of the study, the town of Auburn drew its drinking water from eight wells (1, 2, 3, 4, 5, 7, 13, and 19) located on the bank of the Little Nemaha River (distance well–river >88 m). The wells are placed in different locations along the river on straight stretches of the river as well as on limited curves (Figure S1). The outside well diameter ranges between 0.46 and 0.91 m, the well screen length is about 4.64 m (ranging between 4.58 and 4.72 m), and the well depth between 13.41 and 18.75 m (average: 15.72 m) (Table S1).
The aquifer sediments at the RBF site in Auburn consist of a superficial layer of brown/gray clay (1.5 to ~7.0 m below ground level, bgl) followed by fine sand to coarse (~7.0 to ~16.0 m bgl) with traces of gravel and boulders overlaying blue shale (>~16.0 m bgl) (Table S2).
After the water is collected, the current treatment practice for municipal use consists of aeration, adsorption clarification, high-rate gravity sand filters, fluoridation, and chlorination. Well 4, due to the high level of nitrate (~7.5 mg NO3-N L−1), is not being used. The water treatment plant is capable of producing 2 million gallons per day of drinking water.
At the time of the study, the town of Nebraska City drew its drinking water from eleven wells (1–11) located near the Missouri River (distance well–river >15.2 m). The outside well diameter ranges between 0.46 and 0.64 m, the well screen length is about 11 m (ranging between 8.53 and 13.41 m), and the well depth between 25.3 and 29.26 m (average: 26.72 m) (Table S1). In contrast with Auburn, the wells are placed in a single location along the river on a limited curve of the river (Figure S1). The aquifer sediments at the RBF site in Nebraska City show a more heterogeneous distribution compared to those of Auburn (Tables S2 and S3). In fact, aquifer sediments near wells 1, 2, 5, 6, and 7 mostly consist of sand with blue clay (~3.0 to ~4.5 m bgl) and gravel (~18.3 to ~23.0 m bgl), while superficial occurrence of clay (0 to ~5 m bgl) was observed followed by fine and coarse sand and limestone at the bottom near Wells 4, 8, 10, and 11 (Table S3). The aquifer sediments near Wells 3 and 9 mostly consist of fine and coarse sand with gravel and traces of clays (~15.0 m bgl) (Table S3). After the water is collected, the current treatment practice for municipal use consists of aeration, filtration, addition of lime, and chlorination.
The monitoring program started in May 2016 and continued until June 2017. Monthly samples were collected throughout the study (low flow period), while biweekly samples were collected in May 2016 (moderately high river flow period). River water samples were collected approximately 50 cm deep and 2 m from the riverbed of the Little Nemaha River and Missouri River, at the same locations throughout the study. Well water samples were collected from available well house spigots at the identified wells after water quality parameters (i.e., temperature, pH, dissolved oxygen, etc.) had stabilized. Water samples were also collected at the two water treatment plants, before additional treatment (referred herein as “pre”) and after chlorination (water entering the distribution system; referred herein as “post”).
2.2. Water Quality Analysis
Certified glass vials for TOC with Teflon lined, and septa (VWR, Thorofare, NJ, USA) were used to collect samples for TOC, DOC, ultraviolet absorbance (UVA), and THM analysis. DOC samples were filtered through a 0.45 μm glass microfiber (VWR, Thorofare, NJ, USA). Sulfuric acid was added to preserve the TOC and DOC samples. The collected samples were stored at 4 °C before analysis. Major anions, THMs, total coliforms, and E. coli were analyzed within a few hours of collection. Major anions (bromide, chloride, fluoride, nitrate, nitrite, orthophosphate, and sulfate) were measured using a Dionex ICS-90 ion chromatograph with a Dionex IonPac AS14 column (diameter: 4 mm and length: 250 mm) (Dionex, Bannockburn, IL, USA). TOC and DOC were measured by hot persulfate oxidation using an OI 1010 carbon analyzer (OI Analytical, College Station, TX, USA). The four most common THMs (bromodichloromethane, bromoform, chlorodibromomethane, and chloroform) [37,38] were measured using purge and trap gas chromatography/mass spectrometry with an OI 4552 Analytical autosampler and Eclipse Purge-and-Trap Sample Concentrator OI 4660 (OI Analytical, College Station, TX, USA) coupled with a 6890N GC/MS (Agilent Technologies, Santa Clara, CA, USA). Specific ultraviolet absorbance (SUVA), defined as the ratio between DOC and UVA at 254 nm, was used to estimate the nature of the organic matter present in the natural water [38,39,40]. The absorbance at 254 nm was measured with a Lambda 25 UV/VIS spectrometer (PerkinElmer Instruments, Akron, OH, USA). Table S4 shows the method detection limits of the different analytes.
Total coliform and E. coli were quantified using a commercial most probable number (MPN) test, Colilert 18, with a Quanti-Tray 2000 from IDEXX Laboratories (Westbrook, ME, USA) [41,42]. Due to its simplicity, the IDEXX method has been used in RBF investigations [32,43,44]. Samples were collected aseptically from the rivers as well as after RBF wells. 100 mL or an appropriate dilution of the sample was mixed with the reagent, poured into sterile trays, heat sealed, and incubated at 35 °C for 18 h to detect total coliform and E. coli.
3. Results
3.1. Improvement in Water Quality: Auburn RBF Site
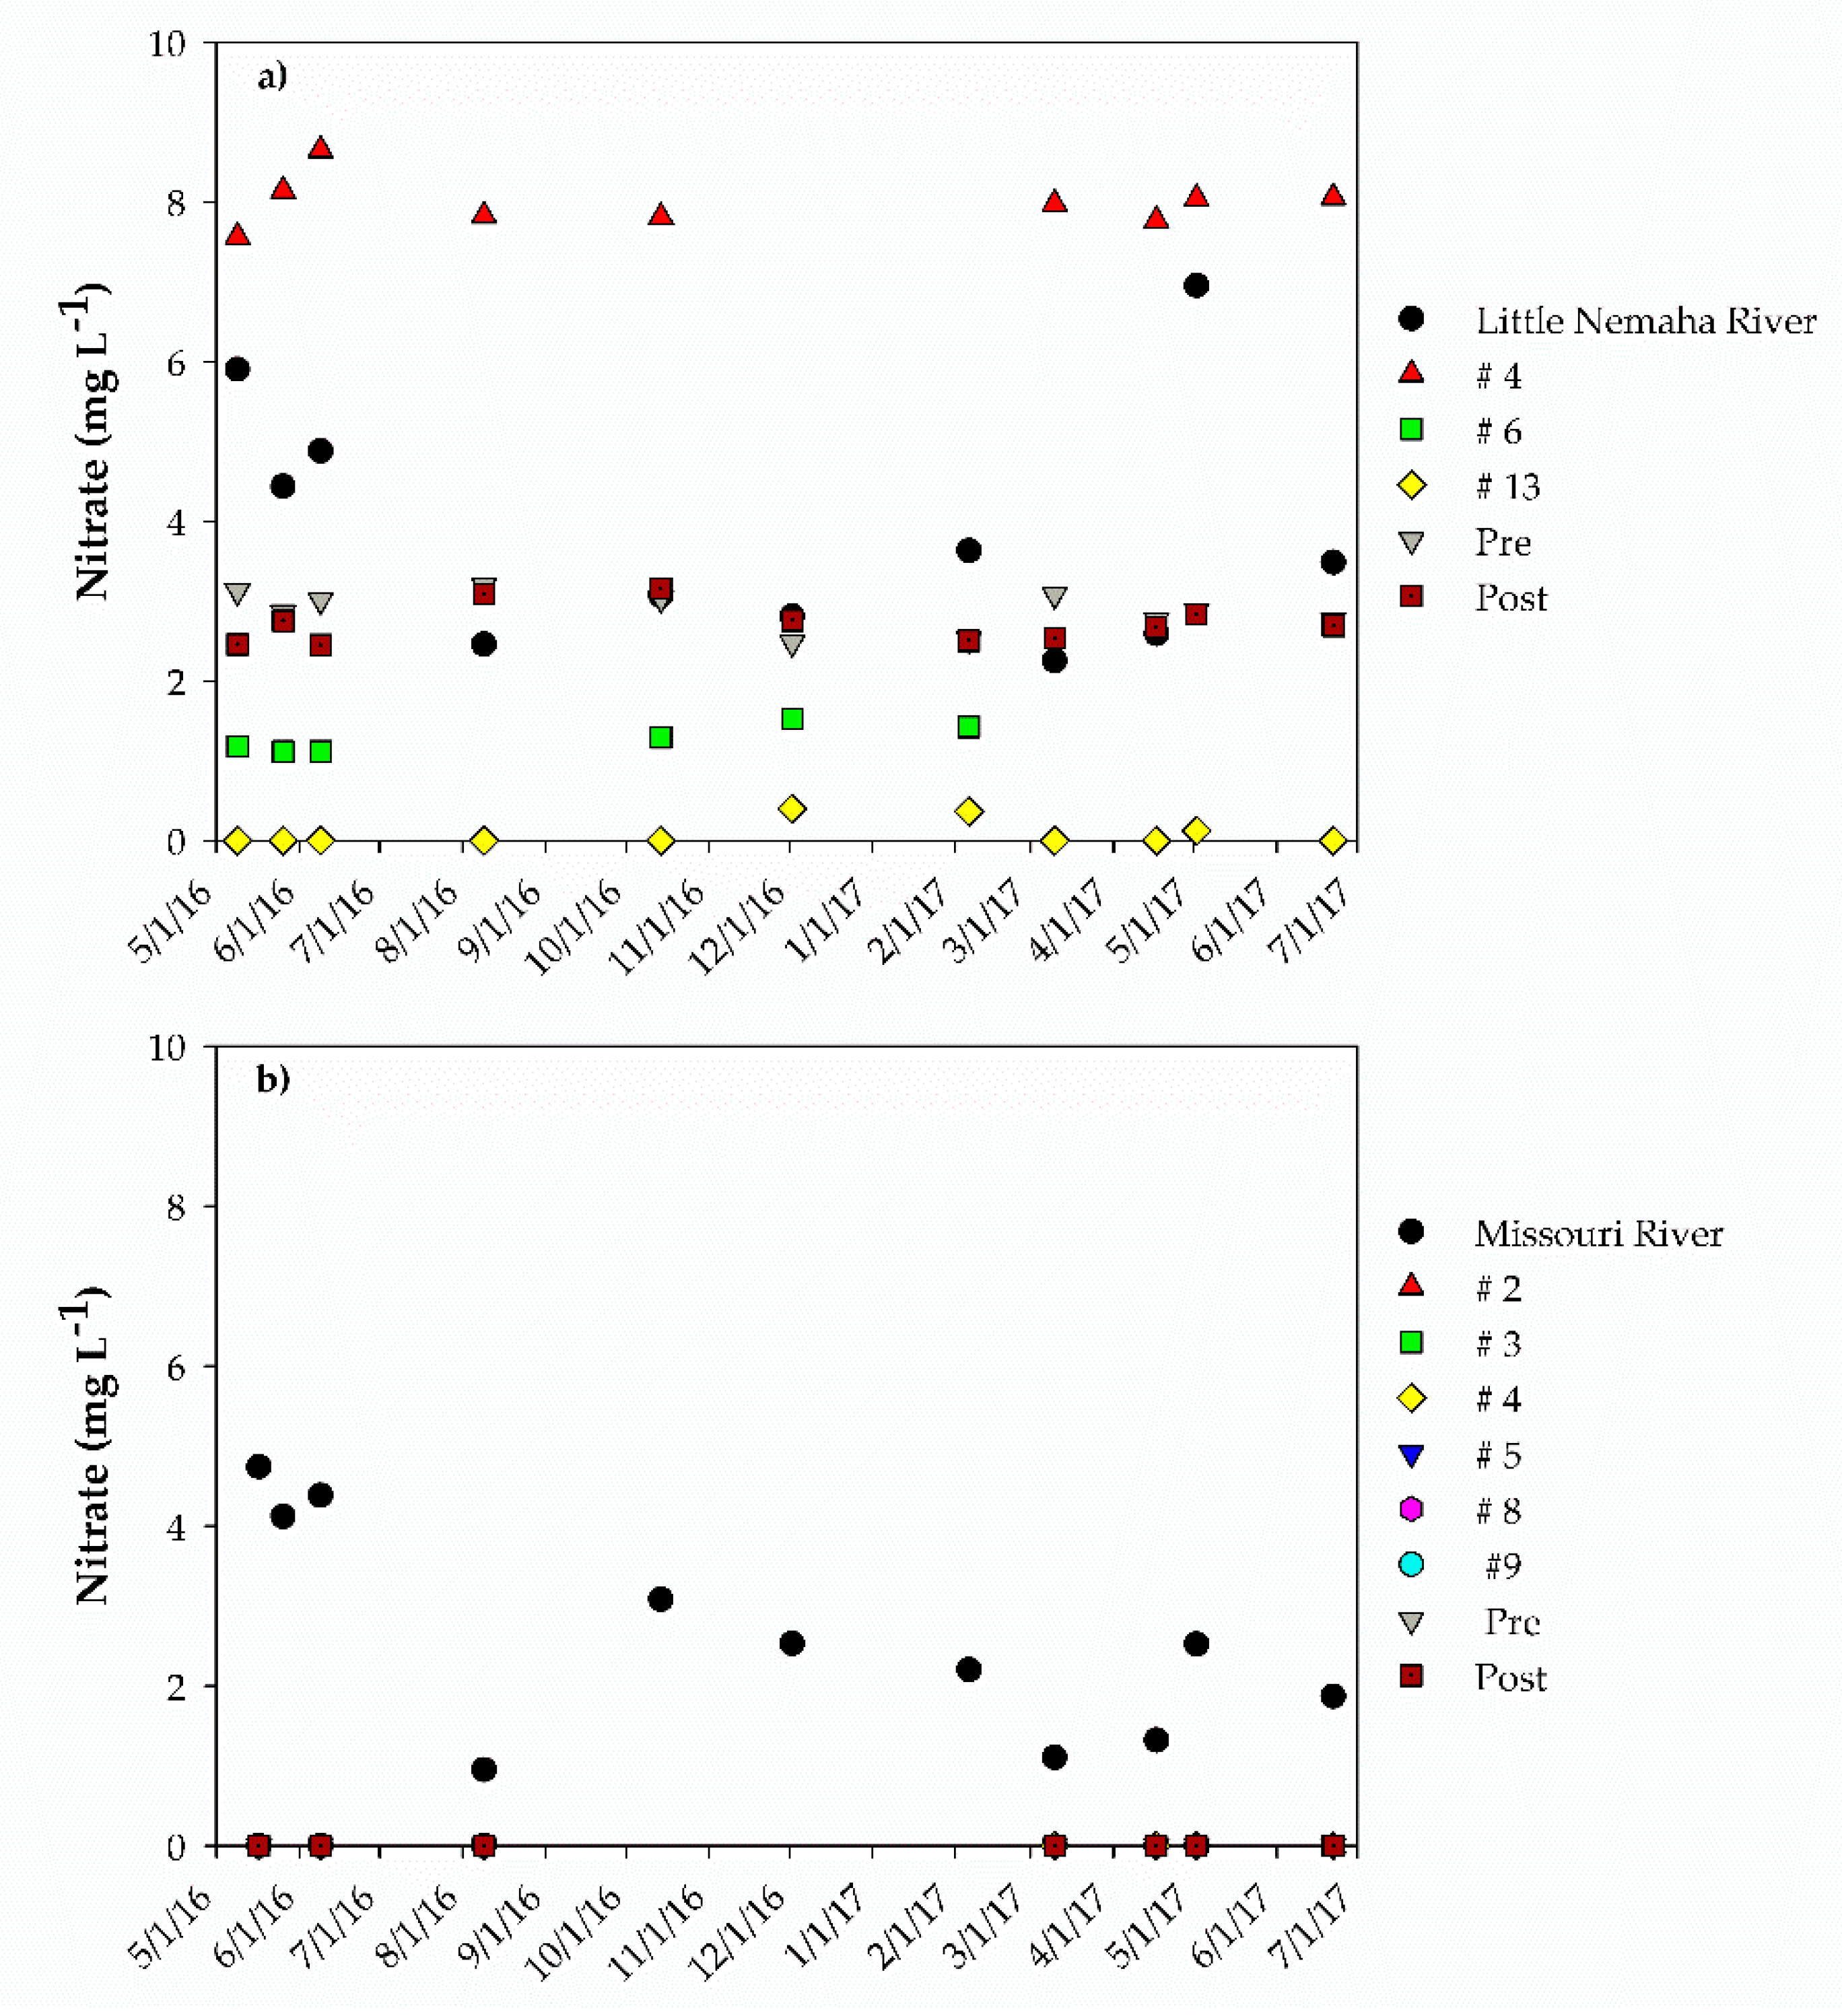
The Little Nemaha River flows through S–E Nebraska and drains into the Missouri River. During the investigation, the Little Nemaha River, in Auburn, had a discharge ranging between 4 and 63 m3 s−1 (Figure S2) [45]. At the Auburn RBF site, pH ranged between 6.96 and 8.41 in the Little Nemaha River water samples, and between 6.44 and 8.45 at the investigated wells (Figure S3a, Table S5). Electrical conductivity (EC) in the river ranged between 304 and 551 μS cm−1 and between 441 and 687 μS cm−1 at the investigated wells (Figure S4a, Table S5). Among the different anions, fluoride (MCL: 4 mg L−1 [24]) and phosphate were consistently below 0.4 mg L−1 in the river as well as at the wells (data not shown). Nitrate (measured as NO3-N) (MCL: 10 mg L−1 [24]) ranged between 2.3 and 7.0 mg L−1 in the river and between 0.2 mg L−1 and 1.5 mg L−1 at Wells 6 and 13. High levels of nitrate (7.8 to 8.7 mg L−1) were observed at Well 4 (Figure 1a). Due to the high levels of nitrate, Well 4 was not being used. Higher values of sulfate (14.8 to 180 mg L−1) and chloride (5.9 to 31.9 mg L−1) were observed at the wells than in the river (15.8 to 78.0 mg L−1 and 4.1 and 14.3 mg L−1, respectively) (Figures S5a and S6a). Nitrite and bromide were below 0.0239 mg L−1 throughout the study (data not shown).
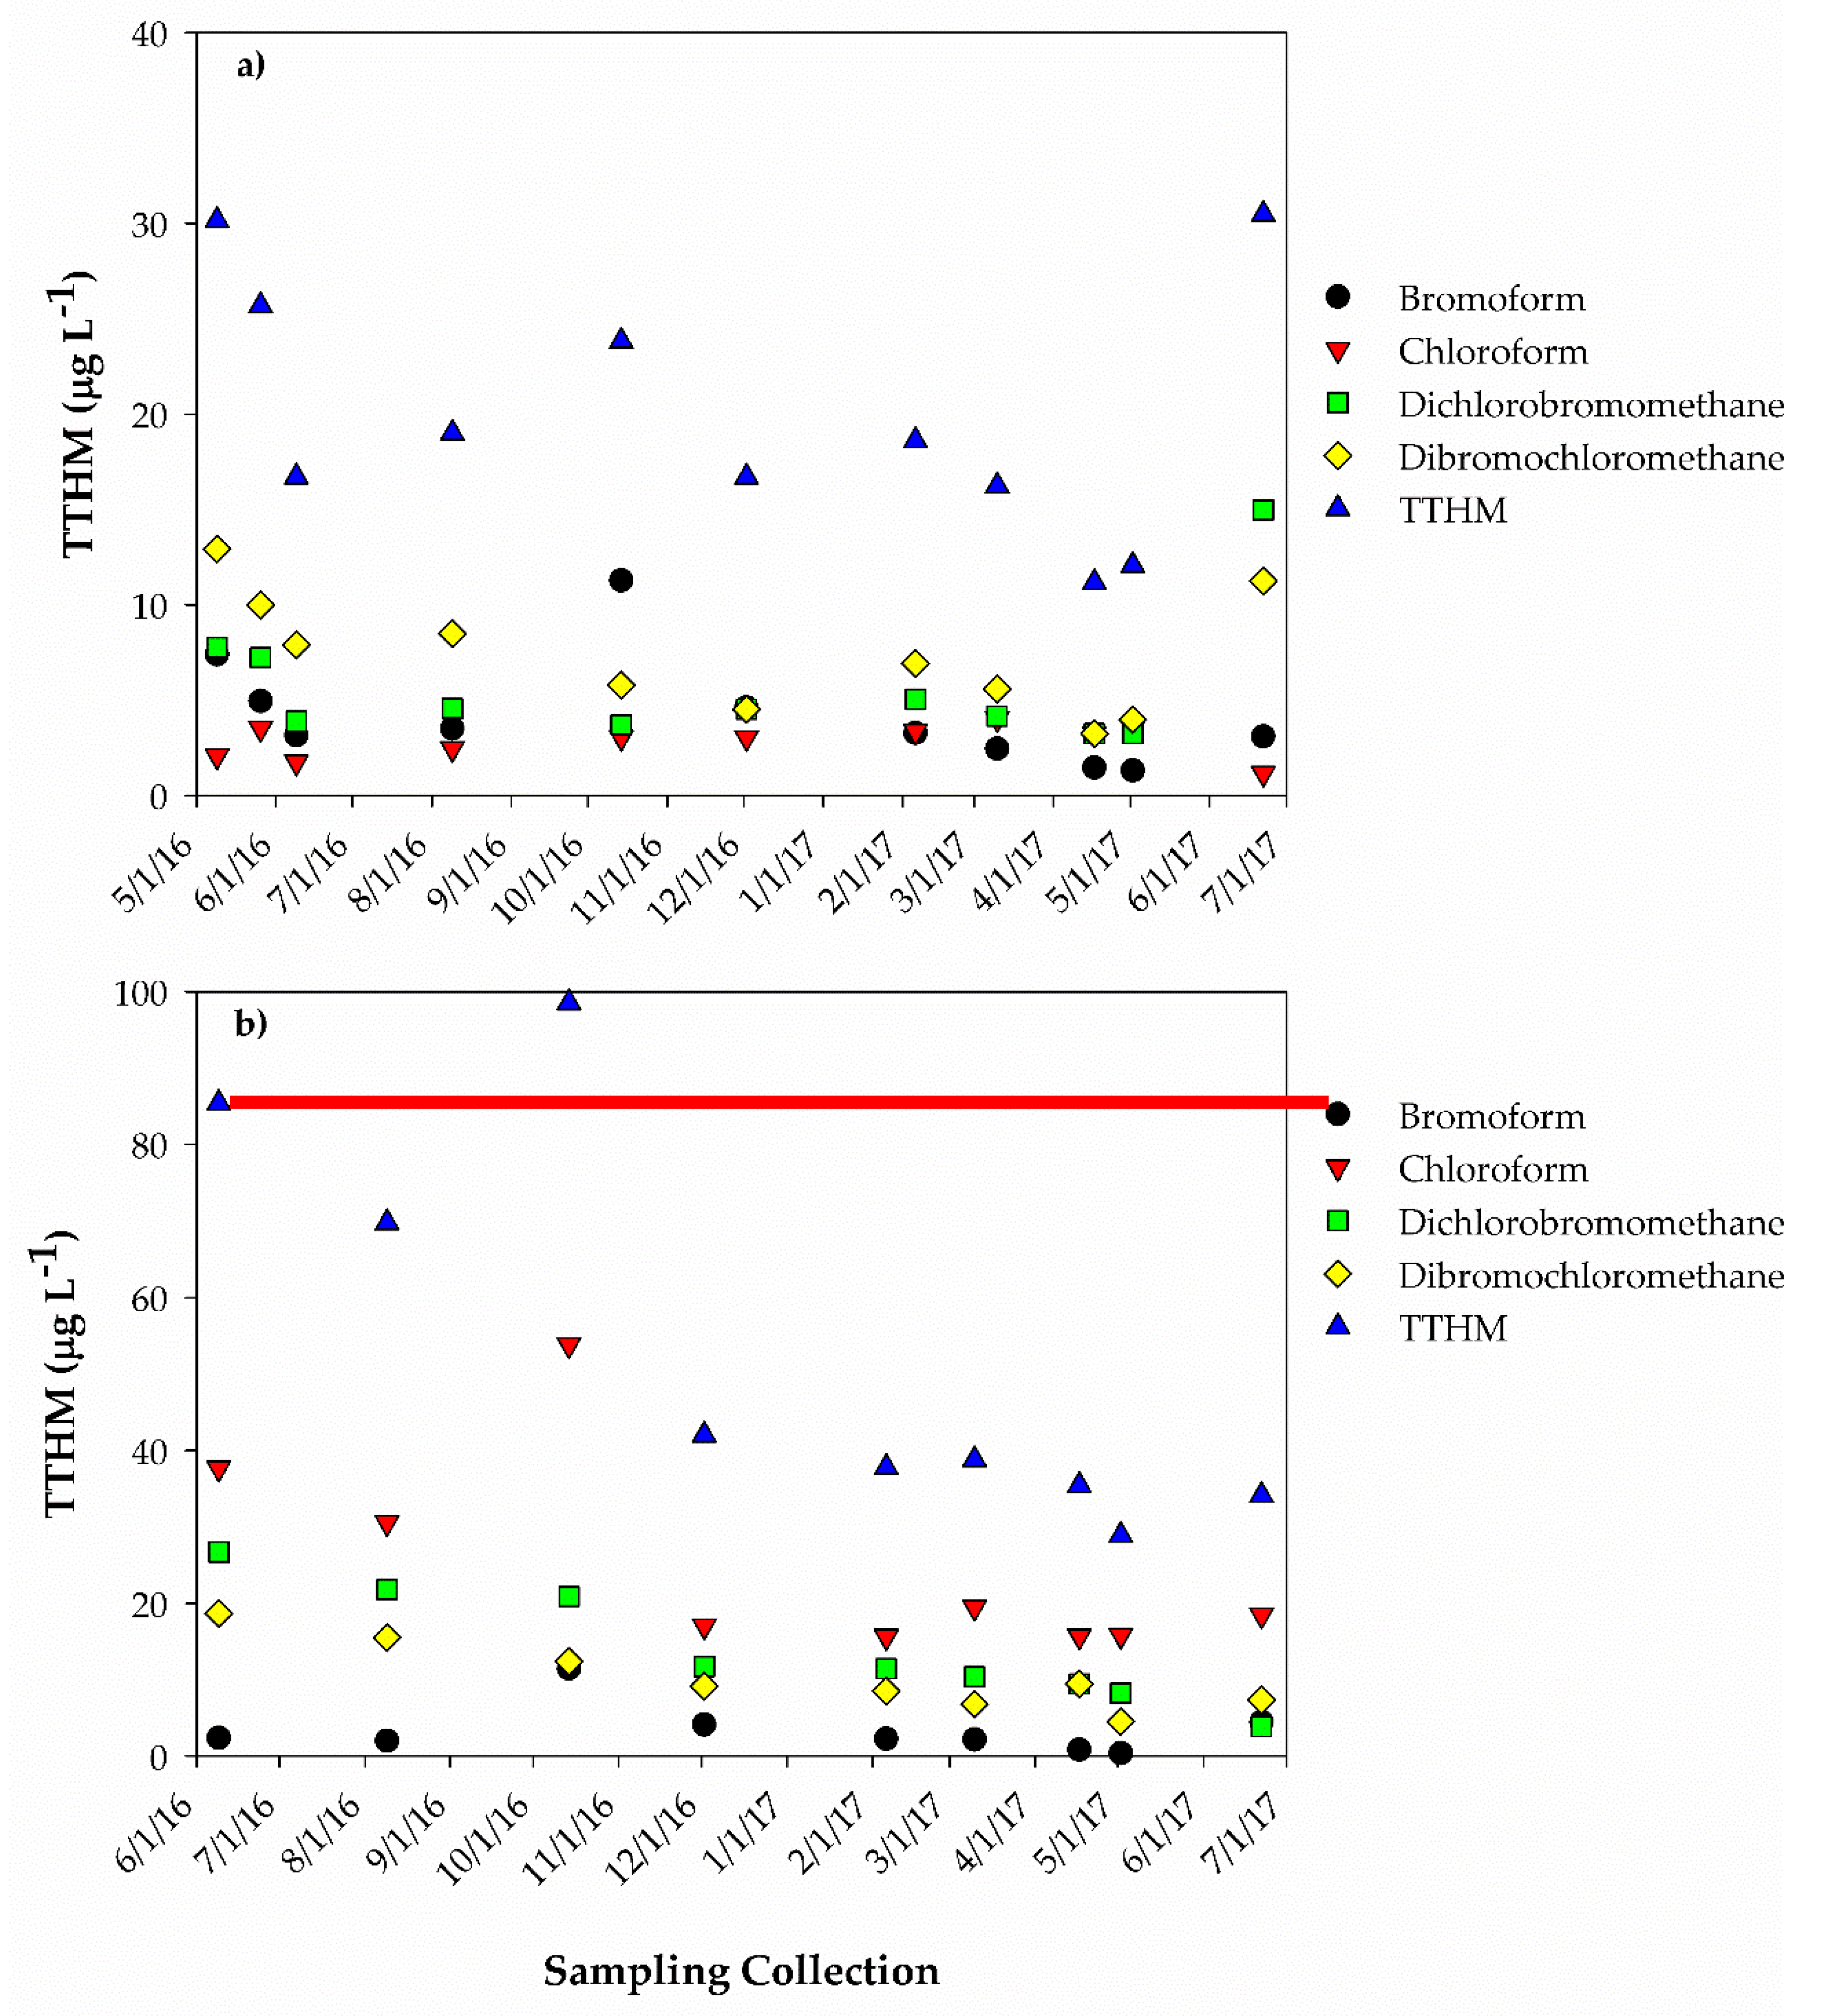
TOC and DOC along the Little Nemaha River ranged between 1.8 and 17.6 mg L−1 and between 1.6 and 7.2 mg L−1, respectively. In RBF well water, TOC and DOC ranged between 0.3 and 2.7 mg L−1 and 0.2 and 2.1 mg L−1 (Figure 2a,c, Table S5). TOC removal through RBF (water collected at investigated wells vs. stream water) ranged between 58 and 96% throughout the study. Similarly, DOC removals ranged between 53 and 90% (Table S6). Removal from RBF of TOC and DOC was not impacted by TOC and/or DOC values in the Little Nemaha River (Table S6). SUVA ranged between 1.9 and 16.0 L mg−1 m−1 at the Little Nemaha River and between 1.3 and 8.8 L mg−1 m−1 in extracted water from RBF wells. Lower values were observed at the water facility. After chlorination, SUVA ranged between 0.6 and 5.0 L mg−1 m−1 (Figure S7a). TTHM ranged between 11.2 and 30.5 μg L−1. Among the THMs investigated, chloroform (1.16 to 4.03 μg L−1) and dichlorobromomethane (3.24 to 14.97 μg L−1) showed the lowest and highest concentrations, respectively (Figure 3a, Table S7). The RBF facility was also able to consistently remove bacteria. Total coliforms, 2.06 × 10³ to 8.30 × 10⁶ MPN/100 mL, and E. coli, 1.34 × 10² to 6.31 × 10² MPN/100 mL, present in the Little Nemaha River, decreased to <1 MPN/100 mL (IDEXX detection limit) in RBF well water throughout the study.
3.2. Improvement in Water Quality: Nebraska City RBF Site
The Missouri River flows through S–E Nebraska and receives the Little Nemaha River south of Auburn. During the investigation, in Nebraska City, the discharge of the Missouri River ranged between 960 and 1910 m3 s−1 (Figure S2) and the water temperature between 0 and 30 °C [45]. pH ranged between 7.10 and 8.30 in the Missouri River water samples, and between 6.68 and 8.00 at the investigated wells (Figure S3b, Table S5). EC in the river ranged between 579 and 763 μS cm−1 and between 548 and 856 μS cm−1 at the investigated wells (Figure S4b, Table S5). Among the different anions, phosphate was consistently below 0.0517 mg L−1, while fluoride was consistently below 0.5 mg L−1 in the river as well as at the wells (data not shown). Nitrate ranged between 0.9 and 4.7 mg L−1 in the river (consistently <MCL), while no detection occurred at the investigated wells throughout the study (Figure 1b). Slightly higher values of sulfate (86.7 to 399 mg L−1) and chloride (10.9 to 25.5 mg L−1) were observed in the river than at the wells (80.4 to 353 mg L−1 and 5.3 and 22.3 mg L−1, respectively) (Figures S5b and S6b). Nitrite and bromide were below 0.0239 mg L−1 throughout the study (data not shown).
TOC and DOC in the Missouri River water samples ranged between 1.7 and 10.5 mg L−1 and between 1.6 and 5.8 mg L−1 respectively. In the RBF well water, TOC and DOC ranged between 1.2 and 3.4 mg L−1 and between 1.3 and 4.6 mg L−1 (Figure 2b,d, Table S5). TOC removal ranged between 14.2 and 78.2%. DOC removal ranged between 15.2 and 62.8% (Table S7). Low removal of TOC and DOC was achieved in the presence of low TOC and DOC values (<2.7 mg L−1) in the Missouri River. SUVA ranged between 1.51 and 6.69 L mg−1 m−1 at the Missouri River and between 1.53 and 6.16 L mg−1 m−1 in RBF well water. Slightly lower values were observed at the water facility. After chlorination, SUVA ranged between 0.82 and 5.46 L mg−1 m−1 (Figure S7b). The total concentration of THMs ranged between 28.9 and 98.6 μg L−1. Among the THMs investigated, bromoform (0.4 to 11.4 μg L−1) and chloroform (15.6 to 53.8 μg L−1) showed the lowest and highest concentrations, respectively (Figure 3a, Table S7). By the results obtained in RBF well water in Auburn, the RBF facility was also able to consistently remove bacteria. Total coliforms, 2.60 × 10³ to 4.35 × 10⁴ MPN/100 mL, and E. coli, 24.6 to 2.00 × 10³ MPN/100 mL, present in the Missouri River, decreased to <1 MPN/100 mL (IDEXX detection limit) in RBF well water throughout the study.
4. Discussion
Results from our study highlight the ability of the two RBF systems to consistently improve the quality of the source water. Total coliforms and E. coli were consistently removed (below detection limit) throughout the study regardless of the environmental conditions (summer vs. winter and dry vs. rainy period) and the starting counts. High bacterial removals (up to 4 logs) were also observed elsewhere [32,33,34,46]. RBF also represents a valuable option to provide treated water with low levels of nitrate even in agriculturally intensive areas. However, local conditions may impact the occurrence of nitrate in the treated water. While similar nitrate concentrations, up to 6 mg L−1, were detected at the two rivers, different concentrations occurred in RBF well water at both sites. Nitrate was consistently absent in RBF well water in Nebraska City, while it ranged between 0 and 8.7 mg L−1 in RBF well water in Auburn. In Auburn, the occurrence of nitrate varied in different wells. Nitrate was almost absent in Well 13 (the newest well), while it was consistently detected at approximately 8 mg L−1 in Well 4. The different nitrate behavior may be related to the location of the two RBF sites. The RBF site in Nebraska City is adjacent to a conservation area, while the RBF site in Auburn is located in an agricultural area. The identification of a conservation area (ideal habitat for birds and animals and no agriculture) for the wellfield by the city will provide an ideal buffer around the wells. Therefore, local land use control can help small communities using RBF in dealing with nitrate. If a significant amount of flow for an RBF well is derived from the river and the well is located in a zone that receives limited or no nitrate, the expected concentrations will be low in the well as the background concentration will be low and denitrification is expected to remove a substantial part of the nitrate present in the river water. TOC and DOC removal efficiencies are similar to those observed around the world [25,32,33,34,47]; this is probably achieved within the first few meters of infiltration and can be due to a combined effect of biodegradation [23,48] and mixing with landside groundwater. The Missouri River is a far greater river than the Little Nemaha River. Its discharge is between 30 and 230 times the discharge of the Little Nemaha River. No to limited correlation was observed between discharge and TOC/DOC (p-value > 0.05) throughout the study at the two locations (Figure S8). In fact, except the Little Nemaha River on June 2017, TOC was fairly stable in the presence of low as well as high discharge (Figure S8). Similarly, to the limited impact on TOC/DOC, limited to no correlation (p-value > 0.05) was also observed between discharge and nitrate in the two rivers throughout the study (Figure S8). These findings suggest limited to no impact on the levels of nitrate in the two rivers due to increasing discharge associated with snowmelt observed in May 2016 and May 2017 (Figure S2). In cold climates, much of the springtime runoff and streamflow in rivers is associated with snowmelt.
RBF represented a potentially effective option to reduce the production of THMs in small systems. The occurrence of THMs in small systems represents a challenge for local water utilities [2,15,49]. For example, Hua et al. [2], investigating three small drinking water systems in rural Missouri using groundwater, surface water, and reservoir water as source water reported high levels of THMs (>80 μg L−1) in finished water. The three systems used chlorine as final treatment. The low removal efficiency of DOC was consistently observed at the three water systems. However, after enhancing DOC removal in one of the three systems by adding powdered activated carbon, THM concentrations in finished water were lowered to approximately 40 μg L−1 [2]. In our study, THM values were mostly lower than the MCL. However, the occurrence of THMs was different at the two RBF sites. Historical data collected between 2012 and 2017, showed a higher concentration of THMs in Nebraska City (54.56 ± 27.76 μg L−1) compared to Auburn (22.29 ± 6.92 μg L−1) [50]. A similar trend was also observed in our study. A higher concentration of THMs was observed in Nebraska City (57.48 ± 25.62 μg L−1) compared to Auburn (20.05 ± 6.63 μg L−1). The small difference between historical data and our results at the two facilities can be related to the sampling location. THMs increased with increasing residence time [51]. Results from our study showed that the levels of THMs in the post-treatment water were strongly linked to the DOC removal (p-values < 0.005), and poorly linked to the DOC level (p-value > 0.05) as well as to SUVA (p-value > 0.005). The statistical analysis revealed a negative correlation between the levels of THMs in the post-treatment water and the DOC removal (correlation coefficient, r: −0.684). The highest THMs’ concentration (98.54 μg L−1) was observed in Nebraska City on October 14, corresponding to the lowest DOC removal (15.2%). While the two rivers had similar DOC (Little Nemaha River, Auburn: 3.57 ± 1.82 mg L−1; Missouri River, Nebraska City: 4.46 ± 1.52 mg L−1), the two RBF sites showed different DOC removal (Auburn: 76.17 ± 10.77%; Nebraska City: 37.82 ± 13.19%) (Table S5). The significantly higher DOC reductions observed in Auburn could be directed related to the longer extraction wells’ distance from the river due to longer travel time (>88 m at the Auburn RBF site vs. >15 m at the Nebraska City RBF site). The results of our study were in agreement with previous findings suggesting that DOC reductions by RBF were site-specific, with higher reductions/removal correlating with greater travel distances between the river and the extractions wells [32,52] even in the presence of large capacity collector wells [53]. Both RBF sites showed a similar trend for SUVA throughout the study. SUVA was >4 L mg−1 m−1 in both rivers and in RBF well water at both sites between June 2016 and February 2017; after that SUVA was <3 L mg−1 m−1. Samples collected after chlorination had SUVA <3 L mg−1 m−1. High SUVA values suggested the occurrence of hydrophobic and especially aromatic matter, while SUVA <3 L mg−1 m−1 suggested the dominance of hydrophilic matter [54]. The results from our study confirmed the weak correlation between SUVA and THMs [55]. The presence of brominated THMs can be linked to the possible occurrence of a very low amount of naturally occurring bromide. During our study, bromide was constantly below the analytical detection limit. However, even at concentrations in the range of μg L−1 bromide can generate brominated THMs [56]. Naturally occurring bromide can be rapidly oxidized by chlorine to hypobromous acid and hypoiodous acid and consequently react with natural organic matter to form brominated DBPs [57].
Supplementary Materials
The following are available online at https://www.mdpi.com/2073-4441/10/12/1865/s1, Figure S1: RBF wells’ sites: Auburn (left) and Nebraska City (Right). Figure S2: Discharge, Little Nemaha River (Auburn) and Missouri River (Nebraska City). Figure S3: pH in (a) Auburn and (b) Nebraska City. LNR: Little Nemaha River; MR: Missouri River; Pre: Inflow water to the water treatment plant prior to any additional treatment; Post: Water collected at the two water treatment plants after chlorination. Figure S4: Electrical conductivity (EC) in (a) Auburn and (b) Nebraska City. LNR: Little Nemaha River; MR: Missouri River; Pre: Inflow water to the water treatment plant prior to any additional treatment; Post: Water collected at the two water treatment plants after chlorination. Figure S5: Chloride in (a) Auburn and (b) Nebraska City. LNR: Little Nemaha River; MR: Missouri River; Pre: Inflow water to the water treatment plant prior to any additional treatment; Post: Water collected at the two water treatment plants after chlorination. Figure S6: Sulfate in (a) Auburn and (b) Nebraska City. LNR: Little Nemaha River; MR: Missouri River; Pre: Inflow water to the water treatment plant prior to any additional treatment; Post: Water collected at the two water treatment plants after chlorination. Figure S7: Specific ultraviolet absorbance (SUVA) in (a) Auburn and (b) Nebraska City. LNR: Little Nemaha River; MR: Missouri River; Pre: Inflow water to the water treatment plant prior to any additional treatment; Post: Water collected at the two water treatment plants after chlorination. Figure S8: Discharge, total organic carbon (TOC), and nitrate at the two sampling locations along the Little Nemaha River (Auburn) and Missouri River (Nebraska City). Table S1: Characteristics of wells at the two RBF sites. Table S2: Auburn—Geological formations at the riverbank filtration site. Table S3: Nebraska City—Geological formations at the riverbank filtration site. Table S4: Method detection limits. Table S5: Basic water quality properties (pH, electrical conductivity, EC, total organic carbon, TOC, dissolved organic carbon, DOC) at the two RBF sites and water utilities. Table S6: Removal (%) of dissolved organic carbon (DOC) at the two water treatment facilities. Table S7: Trihalomethanes at the two water treatment plants. Water samples.
Author Contributions
Methodology, M.D. and C.R.; Investigation, M.D.; Data Curation, M.D.; Writing—Original Draft Preparation, M.D.; Writing—Review and Editing, B.D. and C.R.; Supervision, C.R.; Project Administration, B.D.; Funding Acquisition, B.D. and C.R.
Funding
This research was funded by the U.S. EPA National Center for Innovation in Small Drinking Water Systems, grant number 15008462A02.
Acknowledgments
The authors are especially grateful to D. Hunter, K. Swanson, and their staff at the Auburn Water Work and C. Mayer, M. Lant, and their staff at the Nebraska Water Works for allowing this study. The authors would also like to thank C.A. Olson, P. Juntakut, and N. Schumacher for their support during water samples’ collection. The authors are also grateful for the assistance of David Cassada, Separations Chemist at the Nebraska Water Center.
Conflicts of Interest
The authors declare no conflict of interest. The founding sponsors had no role in the design of the study; in the collection, analyses, or interpretation of data; in the writing of the manuscript, and in the decision to publish the results.
References
- U.S. Environmental Protection Agency. Building the Capacity of Drinking Water Systems. Available online: https://www.epa.gov/dwcapacity/learn-about-small-drinking-water-systems (accessed on 14 October 2018).
- Hua, B.; Mu, R.; Shi, H.; Inniss, E.; Yang, J. Water quality in selected small drinking water systems of Missouri rural communities. Beverages 2016, 2, 10. [Google Scholar] [CrossRef]
- Allard, S.; Tan, J.; Joll, C.A.; Von Gunten, U. Mechanistic study on the formation of Cl-/Br-/I-trihalomethanes during chlorination/chloramination combined with a theoretical cytotoxicity evaluation. Environ. Sci. Technol. 2015, 49, 11105–11114. [Google Scholar] [CrossRef] [PubMed]
- Roccaro, P.; Vagliasindi, F.; Korshin, G. Relationships between trihalomethanes, haloacetic acids, and haloacetonitriles formed by the chlorination of raw, treated, and fractionated surface waters. J. Water Supply Res. Tech. AQUA 2014, 63, 21–30. [Google Scholar] [CrossRef]
- Hua, G.; Reckhow, D.A. Characterization of disinfection byproduct precursors based on hydrophobicity and molecular size. Environ. Sci. Technol. 2007, 41, 3309–3315. [Google Scholar] [CrossRef] [PubMed]
- Zhang, Y.; Love, N.; Edwards, M. Nitrification in drinking water systems. Crit. Rev. Environ. Control 2009, 39, 153–208. [Google Scholar] [CrossRef]
- Odell, L.H.; Kirmeyer, G.J.; Wilczak, A.; Jacangelo, J.G.; Marcinko, J.P.; Wolfe, R.L. Controlling nitrification in chloraminated systems. J. AWWA 1996, 88, 86–98. [Google Scholar] [CrossRef]
- Wilczak, A.; Jacangelo, J.G.; Marcinko, J.P.; Odell, L.H.; Kirmeyer, G.J. Occurrence of nitrification in chloraminated distribution systems. J. AWWA 1996, 88, 74–85. [Google Scholar] [CrossRef]
- Grellier, J.; Rushton, L.; Briggs, D.J.; Nieuwenhuijsen, M.J. Assessing the human health impacts of exposure to disinfection by-products—A critical review of concepts and methods. Environ. Int. 2015, 78, 61–81. [Google Scholar] [CrossRef]
- Richardson, S.D.; Plewa, M.J.; Wagner, E.D.; Schoeny, R.; DeMarini, D.M. Occurrence, genotoxicity, and carcinogenicity of regulated and emerging disinfection by-products in drinking water: A review and roadmap for research. Mutat. Res. Rev. Mutat. Res. 2007, 636, 178–242. [Google Scholar] [CrossRef]
- Singer, R.C. Human substances as precursors for potentially harmful disinfection by-products. Water Sci. Technol. 1999, 40, 25–30. [Google Scholar] [CrossRef]
- Krasner, S.W.; Kostopoulou, M.; Toledano, M.B.; Wright, J.; Patelarou, E.; Kogevinas, M.; Villanueva, C.M.; Carrasco-Turigas, G.; Marina, L.S.; Fernández-Somoano, A.; et al. Occurrence of DBPs in drinking water of European regions for epidemiology studies. J. AWWA 2016, 108, E501–E512. [Google Scholar] [CrossRef]
- Guilherme, S.; Rodriguez, M.J. Occurrence of regulated and non-regulated disinfection by-products in small drinking water systems. Chemosphere 2014, 117, 425–432. [Google Scholar] [CrossRef] [PubMed]
- Stage 1 and Stage 2 Disinfectants and Disinfection Byproducts Rules. Available online: http://water.epa.gov/lawsregs/rulesregs/sdwa/stage2/regs_factsheet.cfm (accessed on 3 September 2018).
- Ringenberg, D. Regulatory Barriers to Approval of New Technologies for Small Drinking Water Systems. Master’s Thesis, University of Nebraska, Lincoln, NE, USA, 2017. Available online: http://digitalcommons.unl.edu/envengdiss/13/ (accessed on 3 September 2018).
- Ray, C. Worldwide potential of riverbank filtration. Clean Technol. Environ. Policy 2008, 10, 223–225. [Google Scholar] [CrossRef]
- Ray, C.; Melin, G.; Linsky, R.B. River Bank Filtration—Improving Source-Water Quality; Kluwer: Dordrecht, The Netherlands, 2003; 364p. [Google Scholar]
- D’Alessio, M.; Yoneyama, B.; Ray, C. Fate of selected pharmaceutically active compounds during simulated riverbank filtration. Sci. Total Environ. 2015, 505, 615–622. [Google Scholar] [CrossRef] [PubMed]
- D’Alessio, M.; Yoneyama, B.; Kirs, M.; Kisand, V.; Ray, C. Pharmaceutically active compounds: Their removal during slow sand filtration and their impact on slow sand filtration bacterial removal. Sci. Total Environ. 2015, 524–525, 124–135. [Google Scholar] [CrossRef]
- Sudhakaran, S.; Lattemann, S.; Amy, G.L. Appropriate drinking water treatment processes for organic micropollutants removal based on experimental and model studies—A multi-criteria analysis study. Sci. Total Environ. 2013, 442, 478–488. [Google Scholar] [CrossRef] [PubMed]
- Storck, F.R.; Schmidt, C.K.; Lange, F.T.; Henson, J.W.; Hahn, K. Factors controlling micropollutant removal during riverbank filtration. J. AWWA 2012, 4, E643–E652. [Google Scholar] [CrossRef]
- Hoppe-Jones, C.; Oldham, G.; Drewes, J.E. Attenuation of total organic carbon and unregulated trace organic chemicals in U.S. riverbank filtration systems. Water Res. 2010, 44, 4643–4659. [Google Scholar] [CrossRef]
- Hiscock, K.M.; Grischeck, T. Attenuation of groundwater pollution by bank filtration. J. Hydrol. 2002, 266, 139–144. [Google Scholar] [CrossRef] [Green Version]
- U.S. Environmental Protection Agency. National Primary Drinking Water Regulations. Available online: https://www.epa.gov/ground-water-and-drinking-water/national-primary-drinking-water-regulations#one (accessed on 15 October 2018).
- Wells, M.J.; Gilmore, T.E.; Mittelstet, A.R.; Snow, D.D.; Sibray, S.S. Assessing decadal trends of a nitrate-contaminated shallow aquifer in Western Nebraska using groundwater isotopes, age-dating, and monitoring. Water 2018, 10, 1047. [Google Scholar] [CrossRef]
- Pennino, M.J.; Compton, J.E.; Leibowitz, S.G. Trends in drinking water nitrate violations across the United States. Environ. Sci. Technol. 2017, 51, 13450–13460. [Google Scholar] [CrossRef] [PubMed]
- Exner, M.E.; Hirsh, A.J.; Spalding, R.F. Nebraska’s groundwater legacy: Nitrate contamination beneath irrigated cropland. Water Resour. Res. 2014, 50, 4474–4489. [Google Scholar] [CrossRef] [PubMed]
- Spalding, R.F.; Exner, M.E. Occurrence of nitrate in groundwater—A review. J. Environ. Qual. 1993, 22, 392–402. [Google Scholar] [CrossRef]
- Ringenberg, D.; Wilson, S.; Dvorak, B. State barriers to approval of drinking water technologies for small systems. J. AWWA 2017, 109, E343–E352. [Google Scholar] [CrossRef]
- Kim, H.-C.; Lee, W.M.; Lee, S.; Choi, J.; Maeng, S.K. Characterization of organic precursors in DBP formation and AOC in urban surface water and their fate during managed aquifer recharge. Water Res. 2017, 123, 75–85. [Google Scholar] [CrossRef] [PubMed]
- Liu, P.; Farré, M.J.; Keller, J.; Gernjak, W. Reducing natural organic matter and disinfection by-product precursors by alternating oxic and anoxic conditions during engineered short residence time riverbank filtration: A laboratory-scale column study. Sci. Total Environ. 2016, 565, 616–625. [Google Scholar] [CrossRef] [PubMed]
- Partinoudi, V.; Collins, M.R. Assessing RBF reduction/removal mechanisms for microbial and organic DBP precursors. J. AWWA 2007, 99, 61–71. [Google Scholar] [CrossRef]
- Weiss, W.J.; Bouwer, E.J.; Ball, W.P.; O’Melia, C.R.; Lechevallier, M.W.; Arora, H.; Speth, T.F. Riverbank filtration—Fate of DBP precursors and selected microorganisms. J. AWWA 2003, 95, 68–81. [Google Scholar] [CrossRef]
- Weiss, W.J.; Bouwer, E.J.; Ball, W.P.; O’Melia, C.R.; LeChevallier, M.W.; Arora, H.; Aboytes, R.; Speth, T.F. Study of water quality improvements during riverbank filtration at three Midwestern United States drinking water utilities. Geophys. Res. Abstr. 2003, 5, 04297. [Google Scholar]
- United States Census Bureau, Census 2010. Available online: https://factfinder.census.gov/faces/tableservices/jsf/pages/productview.xhtml?src=bkmk (accessed on 9 September 2018).
- High Plains Regional Climate Center CLIMOD. Available online: http://climod.unl.edu/ (accessed on 18 September 2018).
- U.S. Environmental Protection Agency (U.S. EPA). Drinking water guidance on disinfection by-products. In Disinfection By-Products in Drinking Water; Advice Note. No. 4 Version 2; U.S. Environmental Protection Agency: Washington, DC, USA, 2012; p. 27. [Google Scholar]
- WHO. Guidelines for Drinking-Water Quality; WHO: Geneva, Switzerland, 2011; p. 518. [Google Scholar]
- Baghoth, S.A.; Sharma, S.K.; Amy, G.L. Tracking natural organic matter (NOM) in a drinking water treatment plant using fluorescence excitation–emission matrices and PARAFAC. Water Res. 2011, 45, 797–809. [Google Scholar] [CrossRef]
- Chen, W.; Westerhoff, P.; Leenheer, J.A.; Booksh, K. Fluorescence excitation–emission matrix regional integration to quantify spectra for dissolved organic matter. Environ. Sci. Technol. 2003, 37, 5701–5710. [Google Scholar] [CrossRef] [PubMed]
- U.S. Environmental Protection Agency (U.S. EPA). Method 1623: Cryptosporidium and Giardia in Water by Filtration/IMS/FA; EPA 815-R-05-002; Office of Water: Washington, DC, USA, 2005; p. 68.
- ISO. Water Quality—Enumeration of Escherichia coli and Coliform Bacteria—Part 2: Most Probable Number Method; ISO 9308-2: 2012; International Organization for Standardization: Geneva, Switzerland, 2012. [Google Scholar]
- Cady, P.; Boving, T.B.; Choudri, B.S.; Cording, A.; Patil, K.; Reddy, V. Attenuation of bacteria at a riverank filtration site in rural India. Water Environ. Res. 2013, 85, 2164–2174. [Google Scholar] [CrossRef]
- Balzer, M.; Witt, N.; Flemming, H.C.; Wingender, J. Faecal indicator bacteria in river biofilms. Water Sci. Technol. 2010, 61, 1105–1111. [Google Scholar] [CrossRef] [PubMed]
- USGS Water Data for the Nation. Available online: https://waterdata.usgs.gov/nwis (accessed on 18 September 2018).
- Dash, R.R.; Prakash, E.B.; Kumar, P.; Mehrotra, I.; Sandhu, C.; Grischek, T. River bank filtration in Haridwar, India: Removal of turbidity, organics and bacteria. Hydrogeol. J. 2010, 18, 973–983. [Google Scholar] [CrossRef]
- Maeng, S.K.; Sharma, S.K.; Lekkerkerker-Teunissen, K.; Amy, G.L. Occurrence and fate of bulk organic matter and pharmaceutically active compounds in managed aquifer recharge: A review. Water Res. 2011, 45, 3015–3033. [Google Scholar] [CrossRef] [PubMed]
- Quanrud, D.M.; Hafer, J.; Karpiscak, M.M.; Zhang, J.; Lansey, K.E.; Arnold, R.G. Fate of organics during soil-aquifer treatment: Sustainability of removals in the field. Water Res. 2003, 37, 3401–3411. [Google Scholar] [CrossRef]
- U.S. Environmental Protection Agency (U.S. EPA). Occurrence Assessment for the Final Stage 2 Disinfectants and Disinfection Byproducts Rule; EPA 815-R-05-011; U.S. EPA: Washington, DC, USA, 2005.
- Nebraska Drinking Water Watch. Available online: https://sdwis-dhhs.ne.gov:8443/DWW/ (accessed on 9 September 2018).
- Chen, W.J.; Weisel, C.P. Halogenated DBP concentrations in a distribution system. J. AWWA 1998, 90, 151–163. [Google Scholar] [CrossRef]
- Skark, C.; Remmler, F.; Zullei-Seibert, N. Classification of Riverbank Filtration Sites and Removal Capacity. In Recent Progress in Slow Sand and Alternative Biofiltration Processes; Gimbel, R., Graham, N.J.D., Collins, M.R., Eds.; IWA Publishing: London, UK, 2006. [Google Scholar]
- Wang, J. Riverbank Filtration Case Study at Louisville, Kentucky. In Riverbank Filtration; Ray, C., Melin, G., Linsky, R.B., Eds.; Kluwer Academic Publishers: Dordrecht, The Netherlands, 2002; pp. 117–145. [Google Scholar]
- Edzwald, J.K.; Tobiason, J.E. Enhanced coagulations: US requirements and a broader view. Water Sci. Technol. 1999, 40, 63–70. [Google Scholar] [CrossRef]
- Hua, G.; Reckhow, D.A.; Abusallout, I. Correlation between SUVA and DBP formation during chlorination and chloramination of NOM fractions from different sources. Chemosphere 2015, 130, 82–89. [Google Scholar] [CrossRef]
- Kitis, M.; Yigita, N.O.; Harmana, B.I.; Muhammetoglu, H.; Muhammetoglu, A.; Karadirek, I.E.; Demirel, I.; Ozdenc, T.; Palancic, I. Occurrence of trihalomethanes in chlorinated groundwaters with very low natural organic matter and bromide concentrations. Environ. Forensics 2010, 11, 264–274. [Google Scholar] [CrossRef]
- Hua, G.; Reckhow, D.A.; Kim, J. Effect of bromide and iodide ions on the formation and speciation of disinfection byproducts during chlorination. Environ. Sci. Technol. Lett. 2006, 40, 3050–3056. [Google Scholar] [CrossRef]
Figure 1.
Nitrate (in NO3–N) in (a) Auburn and (b) Nebraska City. LNR: Little Nemaha River; MR: Missouri River; Pre: Inflow water to the water treatment plants prior to any additional treatment; Post: Water collected at the two water treatment plants after chlorination.
Figure 1.
Nitrate (in NO3–N) in (a) Auburn and (b) Nebraska City. LNR: Little Nemaha River; MR: Missouri River; Pre: Inflow water to the water treatment plants prior to any additional treatment; Post: Water collected at the two water treatment plants after chlorination.

Figure 2.
Total organic carbon (TOC) in (a) Auburn and (b) Nebraska City and dissolved organic carbon (DOC) in (c) Auburn and (d) Nebraska City. LNR: Little Nemaha River; MR: Missouri River; Pre: Inflow water to the water treatment plant prior to any additional treatment; Post: Water collected at the two water treatment plants after chlorination.

Figure 3.
Total Trihalomethanes (TTHM) in (a) Auburn and (b) Nebraska City. Water samples were collected at the two water treatment plants after chlorination. Total TTHM maximum contaminant level (MCL): 80 μg L−1 (Stage 1 and Stage 2 Disinfectants and Disinfection Byproducts Rules. Available online: http://water.epa.gov/lawsregs/rulesregs/sdwa/stage2/regs_factsheet.cfm).

© 2018 by the authors. Licensee MDPI, Basel, Switzerland. This article is an open access article distributed under the terms and conditions of the Creative Commons Attribution (CC BY) license (http://creativecommons.org/licenses/by/4.0/).
Share and Cite
MDPI and ACS Style
D'Alessio, M.; Dvorak, B.; Ray, C. Riverbank Filtration Impacts on Post Disinfection Water Quality in Small Systems—A Case Study from Auburn and Nebraska City, Nebraska. Water 2018, 10, 1865. https://doi.org/10.3390/w10121865
AMA Style
D'Alessio M, Dvorak B, Ray C. Riverbank Filtration Impacts on Post Disinfection Water Quality in Small Systems—A Case Study from Auburn and Nebraska City, Nebraska. Water. 2018; 10(12):1865. https://doi.org/10.3390/w10121865
Chicago/Turabian StyleD'Alessio, Matteo, Bruce Dvorak, and Chittaranjan Ray. 2018. "Riverbank Filtration Impacts on Post Disinfection Water Quality in Small Systems—A Case Study from Auburn and Nebraska City, Nebraska" Water 10, no. 12: 1865. https://doi.org/10.3390/w10121865
Note that from the first issue of 2016, this journal uses article numbers instead of page numbers. See further details here.